Multiscale Reduced-Order Modeling of a Titanium Skin Panel Subjected to Thermo-Mechanical Loading
Abstract
This manuscript presents the formulation, implementation, calibration and application of a multiscale reduced-order model to simulate a titanium panel structure subjected to thermo-mechanical loading associated with high-speed flight. The formulation is based on the eigenstrain-based reduced-order homogenization model (EHM) and further considers thermal strain as well as temperature dependent material properties and evolution laws. The material microstructure (i.e., at the scale of a polycrystalline representative volume element (RVE)) and underlying microstructural mechanisms are directly incorporated and fully coupled with a structural analysis, concurrently probing the response at the structural scale and the material microscale. The proposed approach was fully calibrated using a series of uniaxial tension tests of Ti-6242S at a wide range of temperatures and two different strain rates. The calibrated model is then adopted to study the response of a generic aircraft skin panel subjected to thermo-mechanical loading associated with high-speed flight. The analysis focuses on demonstrating the capability of the model to predict not only the structural scale response, but simultaneously the microscale response, and further studies the effects of temperature and texture on the response.
Nomenclature
| , = | Coordinates of the macro- and microscale domain |
| = | Scale separation parameter |
| , = | macroscopic displacement and temperature |
| , , = | macroscopic strain, stress and body force |
| , , = | Homogenized density, specific heat and thermal conductivity at the macroscale |
| , , = | strain, inelastic strain and stress of part |
| , , , = | slip rate, strength, resolved shear stress and Schmid factor of the s-th slip system of part |
| , , = | initial slip resistance, and slip resistance due to forest dislocation and dislocation debris |
| , , = | dislocation densities of the s-th slip system of part |
| , , , = | coefficient tensors |
| = | Identity tensor |
| Superscripts | |
| s = | slip system index |
| , = | part number |
| Subscripts | |
| = | forest dislocation |
| = | dislocation debris |
| = | total dislocation density |
| , , , , , = | index |
1 Introduction
High-speed airplane structures are exposed to extreme and transient loads associated with aerodynamic environments. These environments involve oscillatory mechanical loading, as well as temporally and spatially varying temperature fields that push the structure into a myriad of limit states (such as yielding, fatigue and buckling), ultimately resulting in fatigue initiation that quickly grows to jeopardize structural survivability.
Extensive efforts exist in the literature on investigating the response of aerostructures subjected to high-speed flight environments, for the ultimate goal of structural damage prognosis to assist the design process. In general, these efforts can be grouped into two categories, aiming to address the two most important aspects of this problem. The first category focuses on characterizing the thermo-mechanical loading associated with high-speed flight in order to predict the response of the structure. Beberniss et al. [1] and Spottswood et al. [2] conducted wind-tunnel experiments to obtain full-field experimental data for a simple, champed flat panel exposed to high-speed flow, and measured the temperature profile as well as displacement over the panel. Following this effort, Perez et al. [3] applied the measured loads to a panel model to simulate its response. Riley et al. [4] simulated the structural response to hypersonic boundary-layer transition, where the pressure loads and heat flux are derived from aerothermodynamics, and loosely coupled to a structural dynamic model. Further developments along this line include accounting for the impact of structure deformation on the loads [5, 6, 7], fully-coupled multiphysics modeling [8, 9, 10], and proper orthogonal decomposition (POD) based reduced-order modeling (ROM) of the elastic structural model [11, 12].
The second category focuses on accurate modeling of the material evolution and damage accumulation in the high-speed flight environment, where relatively limited studies exist in the literature. Arya et al. [13] carried out elastic, elastic-plastic, elastic-plastic-creep, and cyclic loading life analysis of a representative hypersonic aircraft cowl lip under thermo-mechanical loading, and further estimated the fatigue crack initiation life using a low-cycle fatigue criteria. Xue and Mei [14] adopted isotropic linear elastic material model, and investigated the nonlinear flutter and fatigue life of simply supported panels using first-order piston theory aerodynamics and arbitrary prescribed temperature distributions. More recently, elastic-thermoviscoplastic model [15], the Chaboche constitutive model that accounts for strain hardening together with the Palmgren–Miner linear damage rule [16], viscoelastic–viscoplastic formulation that accounts for oxygen-assisted embrittlement [17], creep and multiplicatively-decomposed plasticity [18] have been used to evaluate the response of aerostructures. However, damage initiation and propagation in metallic material are highly localized phenomena, and require direct consideration of the material microstructure (i.e., at the scale of the polycrystalline representative volume element (RVE)) and all relevant microstructural deformation mechanisms due to thermo-mechanical loading. Hence there is a knowledge and capability gap in this aspect for accurate structural scale damage prognosis in the current literature for aerostructures under high-speed flight environment. To fill this gap, one needs to track microstructural mechanisms for capturing failure initiation phenomena under high-speed flight conditions.
Crystal plasticity finite element (CPFE) modeling has been a widely used numerical tool for capturing a wealth of deformation mechanisms of metallic materials under different loading conditions. Within the context of CPFE, both thermal expansion/contraction due to temperature change [19, 20], as well as temperature dependent flow rules and hardening rules can be straightforwardly incorporated [19, 21, 22, 23]. However, the tremendous computation cost associated with CPFE simulations, and the orders of magnitude of difference in the length scale between a polycrystalline RVE and a structural component, make it computationally prohibitive to conduct a structural scale CPFE simulation even with parallel computing techniques [24].
To upscale from the microstructure to the structural scale, several homogenization methods have been proposed. These include the Sachs [25] and Taylor [26] models, the grain cluster method [27, 28], Viscoplastic self-consistent (VPSC) models [29, 30], the Fourier transform (FFT) method [31], non-uniform transformation field analysis method [32], reduced-order variationalmultiscale enrichment method [33], self-consistent clustering method [34, 35] and data driven models [36, 37]. Recently, the eigendeformation-based reduced-order homogenization (EHM) model, originally proposed for fiber-reinforced composites [38, 39, 40] has been advanced for the modeling of polycrstal plasticity [41]. EHM is based on the transformation field analysis (TFA) [42] and operates in the context of computational homogenization with a focus on model order reduction of the microscale problem. EHM pre-computes certain microstructure information by solving a series of linear elastic problems defined over the fully resolved microstructure (i.e., concentration tensors, interaction tensors) and approximates the microscale problem using a much smaller basis spanned over subdomains (also called parts) of the RVE. Using this reduced basis, and prescribed spatial variation of inelastic response fields over the parts, the microscale problem leads to a set of algebraic equations with part-wise responses as unknowns, instead of node-wise quantities as in CPFE. EHM has also recently been extended for a sparse formulation to further improve its efficiency and scalability [43], and consider different lattice structures and dislocation density based flow rule and hardening laws [44].
This manuscript presents a thermo-mechanical EHM for computationally efficient multiscale analysis of polycrystalline structures subjected to thermo-mechanical loading. In particular, this manuscript presents the following novel contributions: (1) thermal strain at the microscale is considered as another source of eigenstrain in addition to the plastic strain from dislocation evolution, through the use of thermal influence functions; (2) an extensive calibration has been conducted against uniaxial tension of titanium alloy at a wide range of temperatures and two different strain rates, leading to an accurate model that could be used for modeling the structural response under thermal-mechanical loading; (3) localized fatigue initiation analysis in a structural panel subjected to thermo-mechanical loading associated with high-speed flight has been performed, indicating the effects of temperature and microstructural texture on the response at both micro- and structural scales. The panel that is investigated is made of a high temperature titanium alloy, Ti-6Al-2Sn-4Zr-2Mo-0.1Si (Ti-6242S).
The remainder of this manuscript is organized as follows: Section 2 provides an overview of the EHM model for mechanical loading only, along with its extension to account for thermo-mechanical loading. Model implementation and calibration against a series of uniaxial tensile tests of Ti-6242S at various temperatures and different strain rates are presented in Section 3, followed by the detailed analysis of an aircraft skin panel in Section 4. Section 5 concludes the manuscript and discusses the future work.
2 EHM for polycrystalline materials subjected to thermo-mechanical loading
2.1 EHM governing equations
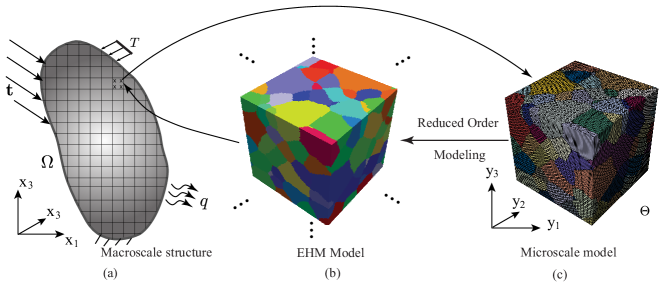
EHM is based on the transformation field theory analysis [42], to reduce the computational cost associated with the microscale problem in a two-scale computational homogenization (also called FE2, see [45, 46]) setting as shown in Fig. 1. In standard computational homogenization, one needs to solve the coupled microscale problem (defined over the microscale domain , characterized by spatial coordinate system ) and the macroscale problem (defined over the macroscale domain , characterized by spatial coordinate system ). EHM aims at model order reduction of the microscale problem by: 1) partitioning the microstructure into a small number of subdomains (or parts), where the coarsest partitioning in the context of crystal plasticity is one-part-per-grain; 2) pre-computing certain microstructural information, including concentration and interaction tensorsobtained from linear elastic simulations on the microstructure, associated with the partitioning of the microstructure domain; and 3) prescribing spatial variation of inelastic fields in each part, where uniform response is assumed in each part. The macroscale boundary value problem defining the heterogeneous body is described by [38, 41]:
| (1) |
and
| (2) |
in which and denote the macroscopic displacement and temperature fields, respectively. represents the macroscale stress, the macroscale body force. , and are the homogenized density, specific heat and thermal conductivity, respectively. While both the displacement and temperature could be microscale dependent (i.e., varying over the microscale domain ), we only consider the microscale dependency of the displacement field, neglecting temperature variation over an RVE (i.e., ). The temperature field is therefore calculated through a macroscale thermal analysis employing homogenized thermal properties. The macroscale problem is closed with initial and boundary conditions, as well as a reduced-order approximation of the microscale problem that effectively provides the macroscale constitutive responses. The microscale governing equations are expressed in the form of an algebraic system, which is solved for a small set of inelastic strains associated with each part and expressed as (at an arbitrary material point on the structure)
| (3) |
in which, and represent the part-wise (i.e., subdomain average over ) total strain and inelastic strain tensor of part , respectively. is the total number of parts in the RVE. and are coefficient tensors expressed as functions of the elastic and inelastic influence functions as described in Ref. [41], and is the thermal influence function introduced following a similar derivation procedure. In this manuscript, we use the one-part-per-grain scheme so each part coincides with a grain in the RVE. The influence function problems are summarized in the Appendix for completeness. We note the dependency of the coefficient tensors on temperature, which is different from and is an extension to the original EHM formulation. This difference is due to the temperature dependent elastic properties, and an efficient evaluation procedure for these temperature dependent coefficient tensors are detailed below.
2.2 Viscoplastic constitutive behavior
Considering the average inelastic deformation within a grain as a consequence of crystallographic slip along preferred slip orientations, the inelastic strain rate in grain (and part) of the microstructure associated with the macroscale material point is expressed as
| (4) |
where, is the plastic slip rate on the slip system of grain , is the total number of slip systems, is the Schmid tensor of the slip system of grain , uniquely describing the orientation of the slip system as the dyadic product of the slip direction, , and the normal to the slip plane , (i.e., ). The resolved shear stress acting on a slip system, , is related to the grain-averaged stress following the Schmid’s law:
| (5) |
The slip rate is typically formulated by a flow rule as a function of the resolved shear stress and one or more internal state variables. Here we choose to use a dislocation density based flow rule [21, 22, 44]
| (6) |
where, is the slip system strength. is the thermal activation volume, the Boltzman constant. is the average mobile dislocation density, the vibration frequency of dislocation segment, the magnitude of the Burgers vector and the thermal activation energy. The slip system strength is expressed as [47, 30]
| (7) |
where is the initial slip resistance associated with isothermal temperature introduced by Ozturk et al. [20] based on the work of Williams et al. [48]. and are the contributions from the immobile forest dislocations and dislocation debris, respectively, which constitute obstacles to dislocation mobility. The initial value of is calculated with respect to the value at room temperature as
| (8) |
where , , and are material parameters. and are expressed as
| (9) |
and
| (10) |
in which, is the shear moduli related to the current temperature, the dislocation interaction parameter defined as (satisfying the Taylor relationship [49]). This model does not consider latent hardening effects, as dislocation density evolution induced by latent hardening has been found to be small compared with that due to self-hardening in the alloy investigated in this study [50, 51, 52]. The latent hardening effects could be added by replacing the scalar with an interaction coefficient matrix as employed in Ref. [53]. is a material independent factor associated with low substructure dislocation density and takes the value of 0.086 [49]. and are the forest and dislocation debris densities, respectively.
In the case of oscillatory loading, the strain path can potentially change and the stored forest dislocation can be reversibly reduced by the shearing in the opposite strain path [54, 55]. Hence, the total forest dislocation density is physically resolved into three terms as
| (11) |
where, is the forward dislocation density, and the latter two are the reversible terms corresponding to loading and unloading paths along the slip system. Experimental observations indicate relatively low initial forest dislocation density in HCP- or BCC-based materials [56, 57, 58, 59], and initial forest dislocation density of m-2 is used. The evolution of the forward dislocation density takes the form
| (12) |
where, is a proportionality parameter determining how much the forest dislocations are reversible, and chosen based on the procedure described in Ref. [54]. Strain is relatively small under the cyclic loading considered in this study, and more dislocations can be reversed. is set as (following Ref. [54]). and are the coefficients controlling the generation of forest dislocations and the annihilation due to dynamic recovery, respectively.
As for the remaining reversible portion of dislocation density, its evolution is different in the slip directions depending on the direction of shear stress [54]:
| (13) |
and
| (14) |
where, is the state of total dislocation density at the point of the latest load reversal and is the dislocation density recombination coefficient taken to be 0.4 for HCC and BCC crystals [55]. If , no plastic flow or dislocation density evolution occurs.
Since the recovery process by means of dislocation climb or cross-slip is related to the dislocation debris formation, we can describe the evolution of dislocation debris density to be proportional to the recovery rate. In addition, since hardening at a given slip system is taken to be affected by the total dislocation debris on all slip systems as suggested by Eq. (8), the evolution of the dislocation debris density is expressed as the cumulative contributions from each slip system
| (15) |
in which, is a recovery rate coefficient, and the initial dislocation debris density in all slip system is defined to be the same value of [60, 61].
3 Model implementation and calibration
3.1 Microstructure reconstruction and EHM implementation for Ti-6242S
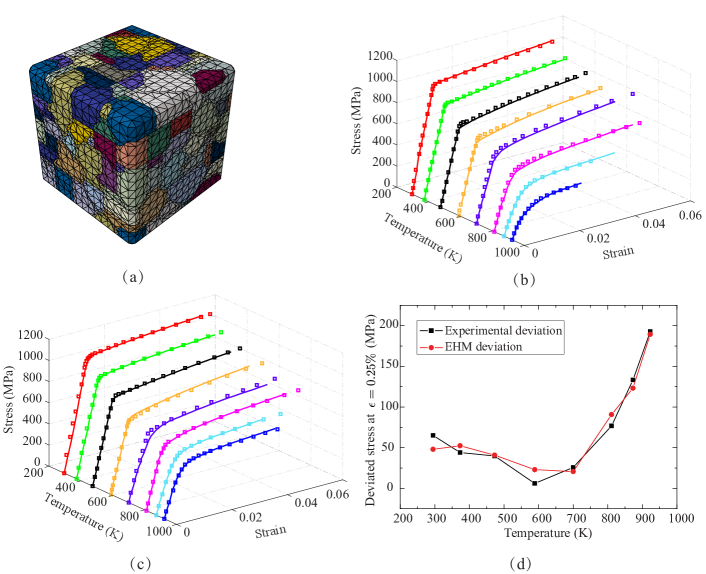
Ti-6242S is a near- titanium alloy that has been widely used in aerospace engineering because of its high resistance to failure associated with creep, fatigue and environmental degradation. Its hierarchical microstructure, such as primary grains, matrix of lamellar + colonies and microtextured regions of particles with similar orientations, provides the characteristic features that contribute to the observed mechanical and physical properties [62, 63]. The 2D electron backscatter diffraction (EBSD) scan of the microstructure from Ref. [64] is used to extract the statics to generate a 3D polycrystalline RVE [44] using software DREAM.3D [65]. A lognormal distribution with for the grains and a normal distribution with for the grains are found to accurately represent the grain area in the experimental EBSD data [64]. The grain size statistics, as well as the orientation and misorientation distributions from Ref. [64] are used to reconstruct and mesh the microstructure using the workflow developed in Refs. [66, 67]. This workflow ensures that the reconstructed microstructure represents the experimentally observed material morphology. A 145-grain microstructure shown in Fig. 2 (a) is used in this study.
The generated microstructure is then employed to construct the EHM, where each grain constitutes a EHM part, leading to 145-part EHM model. The dislocation density based crystal plasticity model defined in Eqs. (4)-(15) together with the EHM framework (Eqs. (1)-(3)), and a given set of initial and boundary conditions fully define the multiscale problem, allowing to simulate a structural scale problem. The influence function problems are first evaluated on the elastic microstructure using finite element methods following the procedure in Ref. [41] at different base temperatures (i.e., 295K, 373K, 473K, 589K, 700K, 811K, 873K and 923 K), and the corresponding coefficient tensors are computed. These coefficient tensors at the chosen base temperatures allow us to evaluate coefficient tensors at any intermediate temperature following the interpolation procedure in Ref. [68].
In this study, the mechanical dissipation induced localized heating due to elasto-visco-plastic processes is considered negligible. This result in a one-way coupling between the thermal and mechanical problems. We employed a staggered solution scheme to evaluate the coupled thermo-mechanical problems. The temperature history is determined first by solving the steady-state thermal problem. Then the mechanical problem with the determined temperature history is solved with the EHM for the Ti-6242S serving as constitutive law. The EHM implementation has been performed for implicit quasi-static and dynamic analyses. At a given time increment of any structural scale integration point, we track the response of the 145-grain microstructure, using the temperature at that particular integration point and time increment. This allows us to probe not only the structural scale response, but also the microscale (i.e., grain scale) response throughout the structural domain.
3.2 Model calibration for Ti-6242S
EHM has been previously verified against direct CPFE simulations on different microstructure configurations and subjected to various loading conditions [44]. This section aims at the calibration of the material parameters using strain controlled uniaxial tension of Ti-6242S at eight different temperatures (between K and K) and two different strain rates (quasi-static (QS): /s; high strain rate (HS): 0.01/s) to arrive at a set of material parameters that provides an overall satisfactory match between simulations and experiments for all the available tests. More details about the experimental tests can be found in Ref. [64]. It should be noted that, while the experimental tests are at different temperatures, the load is applied after the specimen rises to the specified temperature and the temperature remains constant during the loading. This indicates, during these calibrations, the thermal expansion contribution in Eq. (3) is negligible. The thermal expansion is accounted for structural scenarios where temperatures vary in space and time, or when boundary conditions induces thermal stresses (see Section 4).
Ogi et al. [69] measured the elastic constants of titanium at various temperatures and reported a linear dependency of elastic constants on temperature between room temperature and approximately K. Based on these findings, Ozturk et al. [20] calculated the slopes corresponding to the reduction of elastic constants with temperature increase for both and titanium to account for the temperature effects in CPFE simulation of Ti-6242. The thermal expansion for phase is taken to be anisotropic as K and K and for the phase, isotropic expansion is considered with K [70].
The dislocation mobilities in basal, prismatic and pyramidal slip systems of HCP and three types of BCC crystals are implemented in the current model, and same parameters for the three types BCC slip systems are assumed similar to that in Ref. [22]. This simplification is reasonable considering the low volume fraction of the phase in the material microstructure.
Due to the large number of parameters used in the current model, a special procedure is adopted to calibrate the model. First, a physically plausible range is determined for each parameter based on literature study [71, 72, 73, 20] and preliminary simulations. Two strain rates and eight temperature conditions ranging from 298 to 923 K are then used to perform calibration separately, leading to a smaller sub-range for each parameter for each single test. Consequently, temperature- and strain-rate-consistent parameters are obtained in the intersection of the parameter sub-ranges that fits all experiments. The calibrated model parameters are shown in Table 2. Using these parameters, the stress-strain responses under different loading conditions and temperatures are compared to the experiments in Fig. 2 (b)-(c). The maximum error of overall stress-strain curves is less than 9%. It is noted that the ultimate strength decreases as temperature increases for both strain rates. To understand the effects of strain rates, the stress deviations between the QS and HS tests at 0.25% strain are plotted at different temperatures as shown in Fig. 2 (d). It is shown that the strain rate sensitivity is higher at high and low temperatures, but relatively low at intermediate temperature range of [600K, 700K]. This non-trivial rate sensitivity is well captured by the current model.
| Parameters | Slip Systems | |||||
|---|---|---|---|---|---|---|
| Symbol | Unit | Basal | Prismatic | Pyramidal | Pyramidal | BCC Slip |
| J | ||||||
| m3 | ||||||
| J K-1 | ||||||
| m-2 | ||||||
| Hz | ||||||
| m | ||||||
| MPa | 500 | 435 | 680 | 677 | 732 | |
| MPa | 245 | 200 | 180 | 180 | 300 | |
| m-1 | ||||||
| MPa | 300 | 330 | 100 | 90 | 230 | |
4 Investigation of a skin panel subjected to thermo-mechanical loading associated with high-speed flight
In this section, the calibrated EHM model for Ti-6242S is utilized to analyze a representative skin panel structure subjected to combined thermo-mechanical loading associated with a high-speed flight condition. This analysis aims at computationally characterizing the deformation processes at both structural and microscopic scale that could be potentially used for failure initiation analysis and structural damage prognosis.
4.1 Representative skin panel structure
A generic skin panel that has been previously investigated in the literature [74, 8, 2, 9, 10] is used in this study. The geometry and the mesh of the panel is shown in Fig. 3 (a). The panel has a dimension of mm, with stiffeners along the long edges, and is made of Ti-6242S. The width of the stiffeners is 30 mm and the thickness is 0.021 mm. The panel is discretized with tri-linear eight-noded hexahedron elements with reduced integration that are regularized with hourglass stiffness, and the stiffeners are discretized with four-noded shell elements with reduced integration. A modified version of the panel, with refined mesh and three bolt holes as shown in Fig. 3 (b) is also developed and used in this study as further discussed.
In the current simulations, the stiffeners are taken to be elastic, while for the panel the EHM for Ti-6242S based on the 145-grain microstructure is adopted. The simulations using the mesh in Fig. 3(a) track the response of 278,400 grains in addition to the structural scale response. The panel is subjected to thermo-mechanical loading associated with a Mach 2, free-stream dynamic pressure of 123 KPa [2].

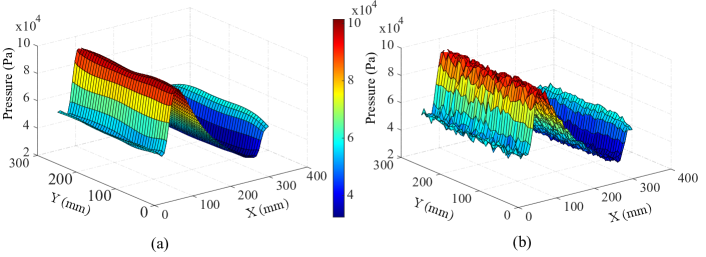
The pressure applied on the panel consists of a mean pressure and a temporally and spatially varying acoustic part. The mean pressure is obtained from a steady state CFD calculation using Reynolds-Averaged Navier-Stokes (RANS) equations for flow on a rigid panel (see Ref. [74] for details) as shown in Fig. 4 (a). The acoustic part is the turbulent boundary layer (TBL) pressure on the panel, approximated using a series of random cosine functions to generate the spatial and temporal distributions. The number of cosine functions and magnitude of each cosine function are estimated from the work of Spottswood et al. [2], while frequency are randomly chosen between 1 and 500 Hz. This pressure profile shown in Fig. 4 is consistent with the reported numerical and experimental results in Refs. [9, 10].
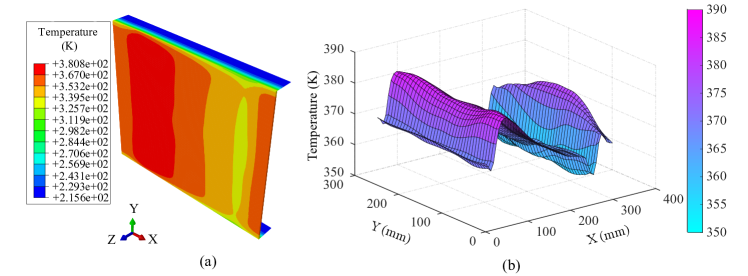
To obtain the spatially varying temperature profile over the panel, a thermal analysis of the panel subjected to a free stream temperature is used. The analysis considers aerodynamic heating and convective and radiative heat conduction on the panel surface [74]. The adiabatic wall temperature is approximated by performing separate inviscid and viscous flow solutions following the work of Anderson [75]. In the current study, we start with the temperature profile of the panel at t=20 s after imposing the adiabatic wall temperature, and conduct a thermo-mechanical analysis for 20 ms. At the beginning of the simulation (i.e., 20 s after aerodynamic heating), the calculated temperature profile for free stream temperature of 388 K is shown in Fig. 5, with a temperature range of approximately 300-385 K. This temperature profile has a similar pattern with that in Ref. [76]. We note that since within the current temperature range the change in elastic moduli is negligible, we directly use the values at room temperature from [71] to save computational cost. For a different application where the temperature range is significant, the slopes reported in Ref. [20] corresponding to the reduction of elastic constants with temperature increase for both and titanium are used to consider the temperature dependent elastic constants. Within the 20 ms span of the analysis, temporal temperature change is relatively small. We hence consider a steady state but spatially varying temperature field over the structural domain (i.e., in Eq. (3)).
4.2 Time step size and mesh size convergence study
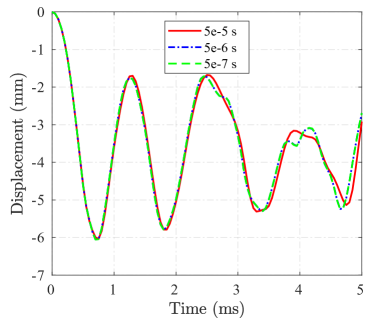
Due to the high frequency loading considered in the current study, a time step and mesh size convergence study has been conducted to choose the appropriate element and time step sizes that provide convergent and most efficient simulations. Since simulations are performed using implicit analyses, time step and mesh size selection affect solution accuracy only. Time step stability, a common concern in explicit analysis is not a factor in the implicit approach. Three different time step sizes, 5e-5 s, 5e-6 s and 5e-7 s are used to study the response of the panel on the original mesh in Fig. 3 (a). The obtained displacement history of a high pressure location (highlighted point I in Fig. 3 (a)) from different time step sizes are shown in Fig. 6. The figure indicates that the time step size of 5e-6 s yields a converged response, hence the remaining simulations are based on the time step size of 5e-6 s.
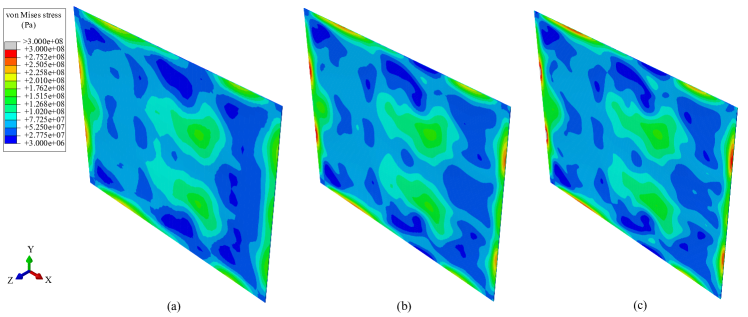
We also conduct a mesh size convergence study by considering two additional mesh sizes where the element size is set to one half ( mm) and one third (mm) of that of the original mesh shown in Fig. 3 (a). The stress contour at time = 5 ms from the simulations using different mesh sizes are shown in Fig. 7. The results show relatively small differences, and the intermediate mesh density (i.e., mm) is chosen for all subsequent simulations. Using this mesh, the simulation tracks the response of 2,818,800 grains throughout the structural domain.
4.3 Structural scale response investigation: effects of temperature
To understand the effect of temperature on the response of the panel (Fig. 3 (a)), we consider different cases with uniform and spatially varying temperatures. In the uniform case, the temperature of the structure is 473.15 K everywhere. In the spatially varying case, the temperature profile shown in Fig. 5 is used. We refer these simulations as Case 1 and Case 2, respectively. To promote the plastic deformation, a factor of 5 is multiplied to the pressure profile for this panel without bolt holes.
In addition to the macroscale and microscale quantities, we also track additional derived quantities from the microscale response. Joseph et al. [77, 78] observed that there are intense dislocation pile-ups at the grain boundaries slightly underneath the crack nucleation surface of fatigued Ti-6242S using transmission electron microscopy. This observation leads to the proposal of using the dislocation density discrepancy between neighboring grains as a fatigue indicator parameter (FIP) for Ti-6242S under cyclic loading [44]. This FIP finds the maximum sessile dislocation density discrepancy across all grain pairs within the microstructure, . To identify , the largest total sessile dislocation density across all systems of grain , , is computed for all grains as
| (16) |
Then is identified as
| (17) |
in which, is the total number of neighbors of grain , and is the grain ID for the neighbor of grain . is the critical state of grain boundary pile-up for a grain and indicates potential for fracture initiation under oscillatory loading. We also define the averaged plastic strain () of the RVE attached to a macroscale integration point as
| (18) |
in which, denotes the plastic strain in grain with being the volume fraction of grain . These averaged plastic strains are used to calculate the equivalent plastic strain () following [79]
| (19) |
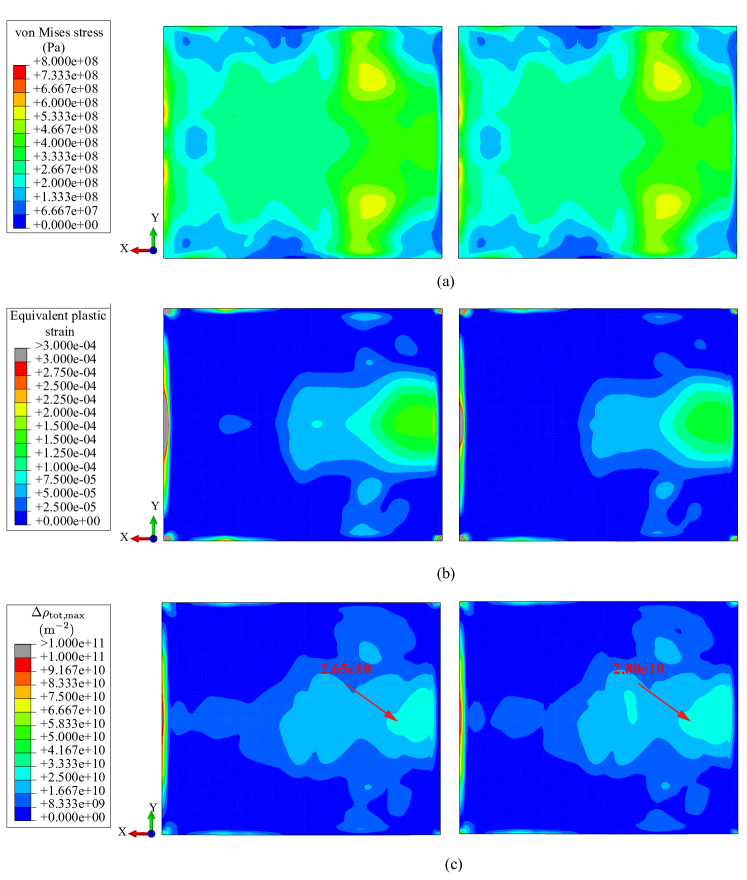
Fig. 8 provides the comparison of the von Mises stress, equivalent plastic strain as well as the maximum dislocation density discrepancy in Cases 1 and 2. The stress comparison in Fig. 8 shows that the primary stress concentration region is close to the constrained edge, with several additional (secondary) stress concentration regions within the panel. In the secondary concentration regions in the panel, Case 1 has slightly larger stress. Overall, the macroscipic response shows a symmetry along the direction, mainly due to the relative symmetric distribution of the pressure load and the geometry.
While Case 1 has much higher temperature than Case 2, the resulting plastic strain in the two simulations are of similar magnitude. This suggests that the spatial variation in the temperature field also promotes the accumulation of plastic strains. When examining the maximum dislocation discrepancy, , in the concentration region in the panel in Fig. 8. It is observed that Case 2 has an value 5.7% higher than that in Case 1. This suggests that the spatial variation in temperature gradients promotes the failure initiation at the microscale, despite that common macroscopic quantities such as stress and plastic strains are largely similar. While current experimental investigation of the panel response has not yet gone down to the subgrain level, it has been demonstrated that the presence of thermal gradients will shift the boundary layer transient, alter the panel response [7] and facilitate the plate buckling [80]. The promotion of fatigue initiation by thermal gradient has also been widely observed for nickel-based alloy [81, 82].
It should be noted that the current calibration is based on monotonic loading cases, while the cyclic response of the same material under pure cyclic loading has only been numerically studied [44]. Using the calibrated model from monotonic loading to a cyclic loading case, or outside the temperature and strain rates range may lead to potential deviation. It would be beneficial to directly use cyclic stress-strain responses at a wide range of temperatures and strain rates to calibrate the model when such data become available, then the calibrated model could be widely used under different loading conditions.
4.4 Local response investigation and effects of texture
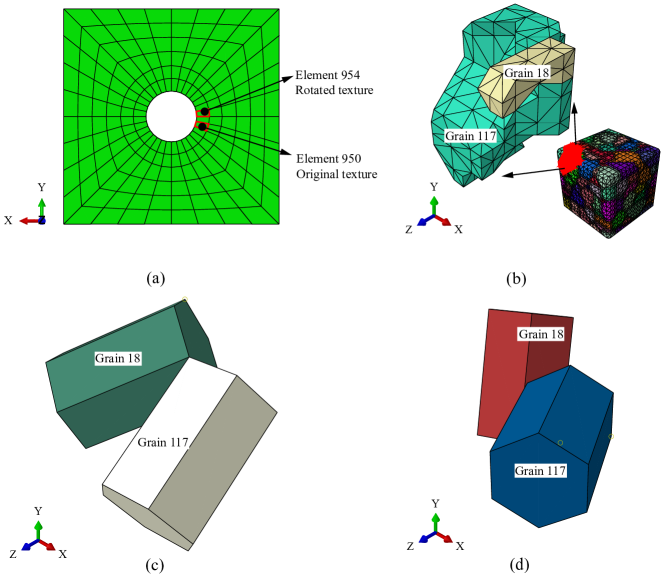
In this section, we investigate the behavior in the areas of localized stress concentrations. In view of the anisotropy of the -dominated microstructure of the titanium alloy considered and the strain partitioning due to non-uniform textures [83, 84, 85], we also study the effect of texture on the behavior of a panel subjected to dynamic loading. To introduce localizations, we add three bolt holes along edge AD of the panel as shown in Fig. 3 (b), and constrain the displacements of all nodes on the inner face of the bolt holes. In addition to the original texture, we also investigate a case with a rotated texture. In the rotated texture case, the third Euler angle of each grain is subjected to reorient the dominant c-axis direction from along the panel length direction to along the width direction. We note that it is also possible to have different regions of the panel to have different textures or microstructures resulting from different manufacturing processes, such that high stress, strain and fatigue initiation locations can be altered and achieve different fatigue life [44].
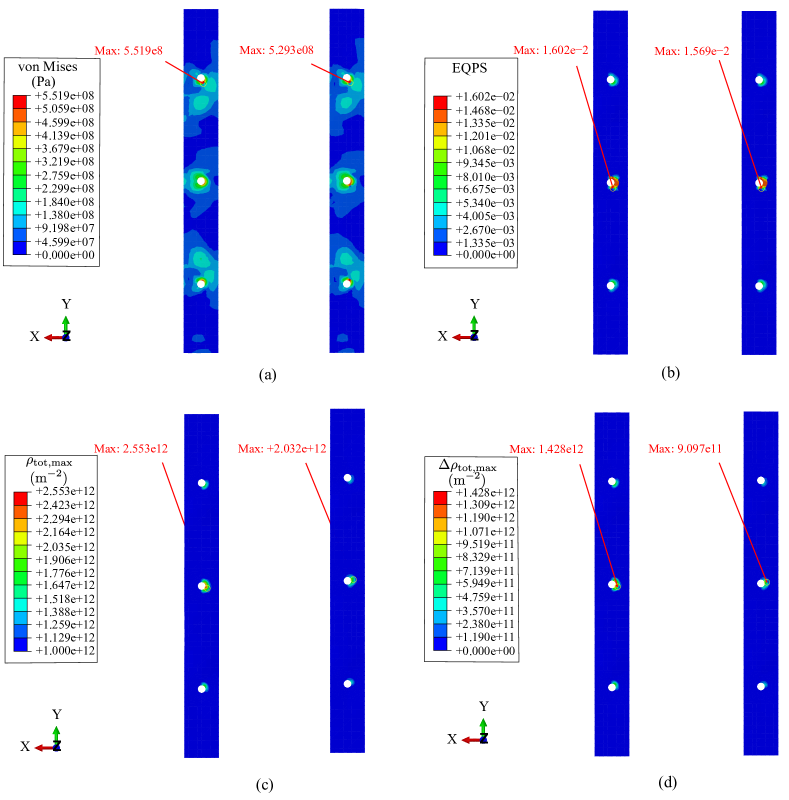
The von Mises, equivalent plastic strain and maximum dislocation discrepancy around the holes are shown in Fig. 9. The stress concentrations are clearly seen along the three holes, and the plastic strain as well as the maximum dislocation discrepancy all show higher values around the bolt holes. The macroscale response measures such as von Mises stress and show very close agreement between the two textures. However, for microscale response such as and show significant differences. This result demonstrates the presence of localized phenomenon, that are undetectable by homogenized measures.
To better probe the local response, we focus on a square region (2.54cm 2.54 cm) around the center bolt hole (Fig. 11 (a)). This region contains 576 elements, hence the response of 83,520 grains are tracked. The histograms of stress, equivalent plastic strain and dislocation density in each grain are plotted in Fig. 10. Since the histograms have very long tails, the values beyond a certain magnitude are grouped into the last bin in the histogram for better visualization.
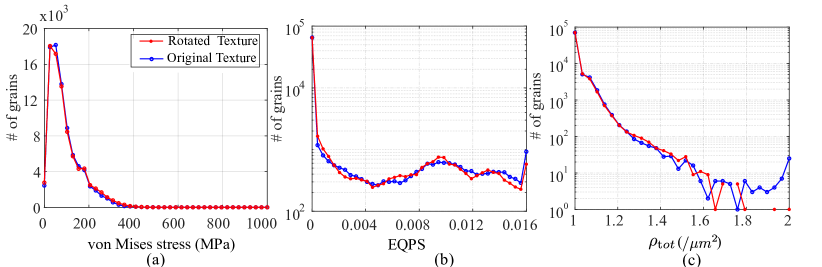
It is again clearly shown in Fig. 10 that while the von Mises stress and distributions are close between the original and rotated texture, the have more significant differences, especially at the tail. For example, in the rotated texture case, there are only four grains that have higher than 1.8 . In contrast, there are more than twenty grains that above higher than 2.0 in the original texture case.
Figure 11 (a) shows the locations in the panel, where the underlying microstructure has the for the two textures. The locations of the most critical points in the original and rotated texture cases are very close to each other, and close to the hole as shown in Fig. 11 (a). The magnitude in the original texture case is approximately 50% higher than that of the rotated texture. It has been recognized both computationally and experimentally that texture has a significant role on the plastic response, and it is possible to use small clusters of similar crystal orientations, called micro-textured regions (MTR) or macrozones to change the fatigue sensitivities in titanium alloys [83, 85]. EHM could be potentially used to spatially design those MTR to improve the fatigue resistance of a given structural component. We then further track down to identify the grain pairs that has the maximum . Interestingly, in both cases, the dislocation discrepancy between the same two grains (grain 117 and 18) exhibits the as shown in Fig. 11 (b). The orientations of this grain pair, are represented using two hexagonal prisms as shown in Fig. 11 (c) and (d), where the normal to the base of the prism is the c-axis of the grain. This example demonstrates the capability of EHM predicting failure initiation at a structural material point, by tracking the most critical grain pair inside the microstructure.
5 Conclusion
This manuscript presented a multiscale reduced-order homogenization model for titanium structures subjected to thermo-mechanical loading associated with high-speed flight. This development is an extension of the EHM model by incorporating thermal strain at the microscale, and accounts for temperature dependent material properties and evolution laws. The developed model was fully calibrated and can accurately capture the stress-strain response of titanium materials under uniaxial tension across a wide range of temperature and strain rates. A generic airplane skin panel subjected to thermo-mechanical loading associate with high-speed flight was then analyzed using the calibrated model to evaluate to evaluate its response. The effects of temperature and microstructrue texture on the panel response were also discussed. The following main conclusions are drawn from our investigations:
-
•
The developed EHM model is fully capable of incorporating the thermal effects, and can accurately capture the stress-strain response of Ti6242S under a wide range of temperatures and strain rates.
-
•
The developed EHM model can allow efficient microstructure-informed structural simulation, providing not only the macroscopic response, but also the response of the underlying microstructure associated with a macroscopic material point. These localized response provides insights in localized response prediction, such as fatigue initiation.
-
•
The simulation results from different temperatures indicate the spatial variation in temperature field promotes the accumulation of plastic deformation, and dislocation density discrepancy between neighboring grains, leading to earlier initiation of fatigue damage within the microstructure.
-
•
The study on different texture indicates while the macroscopic response may only be slightly affected by the microstructure texture, the localized response highly depends on the microstructure and leads to very different fatigue initiation time. Hence it is possible to delay the initiation of fatigue damage by proper design of texture at critical locations.
The developed EHM model for thermo-mechancial loading can be advanced in a number of fronts for modeling of aerostructures subjected to high-speed flight environments. Firstly, the FIP used in this manuscript need to be compared with existing FIPs and further validated using experiments. This process will allow accurate fatigue initiation time and sites prediction in large scale aerostructures. Next, other physics processes associate with high-speed flight, such as oxygen ingress and oxygen-assisted material embrittlement also plays significant role in determining structure response. It is beneficial to incorporate these process in the EHM model. In addition, we will also focus on a systematic study of the significance of the material and loading uncertainty associated with high-speed flight, and use of a database of reduced-order models for Titanium with selected microstructures from different manufacturing processes to optimize the spatial variation of the microstructure for improved fatigue resistance under high-speed flight condition.
Funding Sources
The authors gratefully acknowledge the research funding from the Air Force Office of Science Research Multi-Scale Structural Mechanics and Prognosis Program (Grant No: FA9550-13-1-0104). We also acknowledge the technical cooperation of the Structural Science Center of the Air Force Research Laboratory. X. Zhang has been financially supported by the faculty start-up funding from the University of Wyoming, which is also gratefully acknowledged.
Appendix
The coefficient tensors , , and are functions of elastic (), phase inelastic () and thermal () influence functions. At a given temperature , the expressions for the coefficient tensors are
| (20) |
| (21) |
| (22) |
| (23) |
where is the identity tensor, the compliance tensor. Elastic and phase inelastic influence functions, , and are calculated from the so called elastic influence function problem, phase inelastic influence function problem and thermal influence function problem given in Box 1-3:
References
- Beberniss et al. [2016] Beberniss, T., Spottswood, S., Perez, R., and Eason, T., “Nonlinear Response of a Thin Panel in a Multi-Discipline Environment: Part I – Experimental Results,” Nonlinear Dynamics, Volume 1, Springer, 2016, pp. 237–248. 10.1007/978-3-319-29739-2_22.
- Spottswood et al. [2013] Spottswood, S. M., Beberniss, T., and Eason, T., “Full-field, dynamic pressure and displacement measurements of a panel excited by shock boundary-layer interaction,” 19th AIAA/CEAS aeroacoustics conference, 2013, p. 2016. 10.2514/6.2013-2016.
- Perez et al. [2016] Perez, R. A., Spottswood, S. M., Beberniss, T. J., Bartram, G. W., and Eason, T. G., “Nonlinear Dynamic Response Prediction of a Thin Panel in a Multi-Discipline Environment: Part II—Numerical Predictions,” Nonlinear Dynamics, Volume 1, Springer, Cham, Switzerland, 2016, pp. 249–257. 10.1007/978-3-319-29739-2_23.
- Riley et al. [2016] Riley, Z. B., Deshmukh, R., Miller, B. A., McNamara, J. J., and Casper, K. M., “Characterization of Structural Response to Hypersonic Boundary-Layer Transition,” AIAA J., 2016. 10.2514/1.J054607.
- Riley et al. [2014] Riley, Z. B., McNamara, J. J., and Johnson, H. B., “Assessing Hypersonic Boundary-Layer Stability in the Presence of Structural Deformation,” AIAA J., Vol. 52, No. 11, 2014, pp. 2547–2558. 10.2514/1.J052941.
- Brouwer et al. [2017] Brouwer, K. R., Gogulapati, A., and McNamara, J. J., “Interplay of Surface Deformation and Shock-Induced Separation in Shock/Boundary-Layer Interactions,” AIAA J., 2017. 10.2514/1.J056030.
- Riley and McNamara [2017] Riley, Z. B., and McNamara, J. J., “Interaction Between Compliant Structures and Boundary-Layer Transition in Hypersonic Flow,” AIAA J., 2017. 10.2514/1.J055521.
- Culler and McNamara [2011] Culler, A. J., and McNamara, J. J., “Impact of fluid-thermal-structural coupling on response prediction of hypersonic skin panels,” AIAA J., Vol. 49, No. 11, 2011, pp. 2393–2406. 10.2514/1.J050617.
- Gogulapati et al. [2014] Gogulapati, A., Deshmukh, R., Crowell, A. R., McNamara, J. J., Vyas, V., Wang, X., Mignolet, M., Beberniss, T., Spottswood, S. M., and Eason, T. G., Response of a Panel to Shock Impingement: Modeling and Comparison with Experiments, 2014. 10.2514/6.2014-0148.
- Gogulapati et al. [2015] Gogulapati, A., Deshmukh, R., McNamara, J. J., Vyas, V., Wang, X., Mignolet, M. P., Beberniss, T., Spottswood, S. M., and Eason, T. G., Response of a Panel to Shock Impingement: Modeling and Comparison with Experiments-Part 2, 2015. 10.2514/6.2015-0685.
- Crowell and McNamara [2012] Crowell, A. R., and McNamara, J. J., “Model Reduction of Computational Aerothermodynamics for Hypersonic Aerothermoelasticity,” AIAA J., 2012. 10.2514/1.J051094.
- Gogulapati et al. [2020] Gogulapati, A., Brouwer, K. R., Wang, X., Murthy, R., McNamara, J. J., and Mignolet, M. P., Full and Reduced Order Aerothermoelastic Modeling of Built- Up Aerospace Panels in High-Speed Flows, 2020. 10.2514/6.2017-0180.
- Arya et al. [1991] Arya, V. K., Melis, M. E., and Halford, G. R., “Finite Element Elastic-Plastic-Creep and Cyclic Life Analysis of a Cowl Lip,” Fatigue Fract. Eng. Mater. Struct., Vol. 14, No. 10, 1991, pp. 967–977. 10.1111/j.1460-2695.1991.tb00006.x.
- Xue and Mei [1993] Xue, D. Y., and Mei, C., “Finite element nonlinear flutter and fatigue life of two-dimensional panels with temperature effects,” J. Aircr., Vol. 30, No. 6, 1993, pp. 993–1000. 10.2514/3.46444.
- Sobotka et al. [2013] Sobotka, J. C., Oral, A., and Culler, A. J., “Towards a coupled loads-response-life prediction framework for hypersonic structures in combined extreme environments,” 54th AIAA/ASME/ASCE/AHS/ASC Structures, Structural Dynamics, and Materials Conference, 2013, p. 1519. 10.2514/6.2013-1519.
- Miner [1945] Miner, A., “Cumulative damage in fatigue,” ASME. J. Appl. Mech., Vol. 12, No. 3, 1945, pp. 159–164. 10.1115/1.4009458.
- Oskay and Haney [2010] Oskay, C., and Haney, M., “Computational modeling of titanium structures subjected to thermo-chemo-mechanical environment,” Int. J. Solids Struct., Vol. 47, No. 24, 2010, pp. 3341–3351. 10.1016/j.ijsolstr.2010.08.014.
- Clough et al. [2020] Clough, J. L., Oberai, A. A., and Camberos, J. A., Deformation of a Panel in Repeated High Speed Flow Modeled with Creep and Multiplicatively-Decomposed Plasticity, 2020. 10.2514/6.2020-2418.
- Meissonnier et al. [2001] Meissonnier, F., Busso, E., and O’Dowd, N., “Finite element implementation of a generalised non-local rate-dependent crystallographic formulation for finite strains,” Int. J. Plast., Vol. 17, No. 4, 2001, pp. 601–640. 10.1016/S0749-6419(00)00064-4.
- Ozturk et al. [2016a] Ozturk, D., Shahba, A., and Ghosh, S., “Crystal plasticity FE study of the effect of thermo-mechanical loading on fatigue crack nucleation in titanium alloys,” Fatigue Fract. Eng. Mater. Struct., Vol. 39, No. 6, 2016a, pp. 752–769. 10.1111/ffe.12410.
- Hu et al. [2016] Hu, P., Liu, Y., Zhu, Y., and Ying, L., “Crystal plasticity extended models based on thermal mechanism and damage functions: Application to multiscale modeling of aluminum alloy tensile behavior,” Int. J. Plast., Vol. 86, 2016, pp. 1–25. 10.1016/j.ijplas.2016.07.001.
- Liu et al. [2018] Liu, Y., Zhu, Y., Oskay, C., Hu, P., Ying, L., and Wang, D., “Experimental and computational study of microstructural effect on ductile fracture of hot-forming materials,” Mat. Sci. Eng. A, Vol. 724, 2018, pp. 298 – 323. https://doi.org/10.1016/j.msea.2018.03.049.
- Benzing et al. [2019] Benzing, J., Liu, Y., Zhang, X., Luecke, W., Ponge, D., Dutta, A., Oskay, C., Raabe, D., and Wittig, J., “Experimental and numerical study of mechanical properties of multi-phase medium-Mn TWIP-TRIP steel: Influences of strain rate and phase constituents,” Acta Mater., Vol. 177, 2019, pp. 250 – 265. 10.1016/j.actamat.2019.07.036.
- Bishop et al. [2015] Bishop, J. E., Emery, J. M., Field, R. V., Weinberger, C. R., and Littlewood, D. J., “Direct numerical simulations in solid mechanics for understanding the macroscale effects of microscale material variability,” Comput. Methods Appl. Mech. Eng., Vol. 287, 2015, pp. 262–289. 10.1016/j.cma.2015.01.017.
- Sachs [1928] Sachs, G., “Zur ableitung einer fliessbedingung,” . Ver. Dtsch. Ing., Vol. 72, 1928, pp. 734–736. 10.1007/978-3-642-92045-5_12
- Taylor [1938] Taylor, G., “Plastic Strain in Metals,” J. Inst. Met., Vol. 62, 1938, pp. 307–324.
- Tjahjanto et al. [2010] Tjahjanto, D. D., Eisenlohr, P., and Roters, F., “A novel grain cluster-based homogenization scheme,” Modelling Simul. Mater. Sci. Eng., Vol. 18, 2010, p. 015006. 10.1088/0965-0393/18/1/015006.
- Yadegari et al. [2015] Yadegari, S., Turteltaub, S., and Suiker, A., “Generalized grain cluster method for multiscale response of multiphase materials,” Comput. Mech., Vol. 56, 2015, pp. 193–219. 10.1007/s00466-015-1167-9.
- Segurado et al. [2012] Segurado, J., Lebensohn, R. A., LLorca, J., and Tomé, C. N., “Multiscale modeling of plasticity based on embedding the viscoplastic self-consistent formulation in implicit finite elements,” Int. J. Plast., Vol. 28, No. 1, 2012, pp. 124–140. 10.1016/j.ijplas.2011.07.002.
- Knezevic et al. [2013a] Knezevic, M., McCabe, R. J., Lebensohn, R. A., Tome, C. N., Liu, C., Lovato, M. L., and Mihaila, B., “Integration of self-consistent polycrystal plasticity with dislocation density based hardening laws within an implicit finite element framework: Application to low-symmetry metals,” J. Mech. Phys. Solids, Vol. 61, No. 10, 2013a, pp. 2034 – 2046. https://doi.org/10.1016/j.jmps.2013.05.005.
- Eisenlohr et al. [2013] Eisenlohr, P., Diehl, M., Lebensohn, R., and Roters, F., “A spectral method solution to crystal elasto-viscoplasticity at finite strains,” Int. J. Plast., Vol. 46, 2013, pp. 37–53. 10.1016/j.ijplas.2012.09.012.
- Michel and Suquet [2016] Michel, J.-C., and Suquet, P., “A model-reduction approach to the micromechanical analysis of polycrystalline materials,” Comput. Mech., Vol. 57, 2016, pp. 483–508. 10.1007/s00466-015-1248-9.
- Zhang and Oskay [2016a] Zhang, S., and Oskay, C., “Reduced order variational multiscale enrichment method for elasto-viscoplastic problems,” Comput. Methods Appl. Mech. Eng., Vol. 300, 2016a, pp. 199–224. 10.1016/j.cma.2015.11.020.
- Liu et al. [2016] Liu, Z., Bessa, M. A., and Liu, W. K., “Self-consistent clustering analysis: An efficient multi-scale scheme for inelastic heterogeneous materials,” Comput. Methods Appl. Mech. Eng., Vol. 306, 2016, pp. 319–341. 10.1016/j.cma.2016.04.004.
- Yu et al. [2019] Yu, C., Kafka, O. L., and Liu, W. K., “Self-consistent clustering analysis for multiscale modeling at finite strains,” Comput. Methods Appl. Mech. Engg., Vol. 349, 2019, pp. 339–359. 10.1016/j.cma.2019.02.027.
- Latypov and Kalidindi [2017] Latypov, M. I., and Kalidindi, S. R., “Data-driven reduced order models for effective yield strength and partitioning of strain in multiphase materials,” J. Comput. Phys., Vol. 346, 2017, pp. 242 – 261. 10.1016/j.jcp.2017.06.013.
- Liu et al. [2019] Liu, Z., Wu, C. T., and Koishi, M., “A deep material network for multiscale topology learning and accelerated nonlinear modeling of heterogeneous materials,” Comput. Methods Appl. Mech. Engg., Vol. 345, 2019, pp. 1138–1168. 10.1016/j.cma.2018.09.020.
- Oskay and Fish [2007] Oskay, C., and Fish, J., “Eigendeformation-based reduced order homogenization for failure analysis of heterogeneous materials,” Comput. Methods Appl. Mech. Engrg., Vol. 196, 2007, pp. 1216–1243. 10.1016/j.cma.2006.08.015.
- Crouch and Oskay [2010] Crouch, R., and Oskay, C., “Symmetric Mesomechanical Model for Failure Analysis of Heterogeneous Materials,” Int. J. Multiscale Comput. Eng., Vol. 8, No. 5, 2010, pp. 447–461. 10.1615/IntJMultCompEng.v8.i5.20.
- Sparks and Oskay [2016] Sparks, P., and Oskay, C., “The Method of Failure Paths for Reduced-Order Computational Homogenization,” Int. J. Multiscale Comput. Eng., Vol. 14, 2016. 10.1615/IntJMultCompEng.2016018702.
- Zhang and Oskay [2015] Zhang, X., and Oskay, C., “Eigenstrain based reduced order homogenization for polycrystalline materials,” Comput. Methods Appl. Mech. Engg., Vol. 297, 2015, pp. 408–436. 10.1016/j.cma.2015.09.006.
- Dvorak [1992] Dvorak, G. J., “Transformation Field Analysis of Inelastic Composite Materials,” Proc. R. Soc. Lond. A, Vol. 437, 1992, pp. 311–327. 10.1098/rspa.1992.0063.
- Zhang and Oskay [2017a] Zhang, X., and Oskay, C., “Sparse and scalable eigenstrain-based reduced order homogenization models for polycrystal plasticity,” Comput. Methods Appl. Mech. Eng., Vol. 326, 2017a, pp. 241–269. 10.1016/j.cma.2017.07.027.
- Liu et al. [2020] Liu, Y., Zhang, X., Zhu, Y., Hu, P., and Oskay, C., “Dislocation density informed eigenstrain based reduced order homogenization modeling: verification and application on a titaniumalloy structure subjected to cyclic loading,” Modell. Simul. Mater. Sci. Eng., Vol. 28, 2020, p. 025004. 10.1088/1361-651x/ab602e.
- Feyel and Chaboche [2000] Feyel, F., and Chaboche, J.-L., “FE2 multiscale approach for modelling the elastoviscoplastic behaviour of long fibre SiC/Ti composite materials,” Comput. Methods Appl. Mech. Eng., Vol. 183, 2000, pp. 309–330. 10.1016/S0045-7825(99)00224-8.
- Feyel [2003] Feyel, F., “A multilevel finite element method () to describe the response of highly non-linear structures using generalized continua,” Comput. Methods Appl. Mech. Eng., Vol. 192, 2003, pp. 3233–3244. 10.1016/S0045-7825(03)00348-7.
- Beyerlein and Tome [2008] Beyerlein, I., and Tome, C., “A dislocation-based constitutive law for pure Zr including temperature effects,” Int. J. Plast., Vol. 24, 2008, pp. 867–895. 10.1016/j.ijplas.2007.07.017.
- Williams et al. [2002] Williams, J., Baggerly, R., and Paton, N., “Deformation behavior of HCP Ti-Al alloy single crystals,” Metall. Mater. Trans. A, Vol. 33, No. 3, 2002, pp. 837–850. 10.1007/s11661-002-0153-y.
- Madec et al. [2002] Madec, R., Devincre, B., and Kubin, L., “From dislocation junctions to forest hardening,” Phys. Rev. Lett., Vol. 89, No. 25, 2002, p. 255508. 10.1103/PhysRevLett.89.255508.
- Oppedal et al. [2012] Oppedal, A. L., El Kadiri, H., Tomé, C. N., Kaschner, G. C., Vogel, S. C., Baird, J. C., and Horstemeyer, M. F., “Effect of dislocation transmutation on modeling hardening mechanisms by twinning in magnesium,” Int. J. Plast., Vol. 30-31, 2012, pp. 41–61. 10.1016/j.ijplas.2011.09.002.
- Ardeljan et al. [2014] Ardeljan, M., Beyerlein, I. J., and Knezevic, M., “A dislocation density based crystal plasticity finite element model: application to a two-phase polycrystalline HCP/BCC composites,” J. Mech. Phys. Solids., Vol. 66, 2014, pp. 16–31. 10.1016/j.jmps.2014.01.006.
- Ardeljan et al. [2015] Ardeljan, M., Knezevic, M., Nizolek, T., Beyerlein, I. J., Mara, N. A., and Pollock, T. M., “A study of microstructure-driven strain localizations in two-phase polycrystalline HCP/BCC composites using a multi-scale model,” Int. J. Plast., Vol. 74, 2015, pp. 35–57. 10.1016/j.ijplas.2015.06.003.
- Knezevic et al. [2013b] Knezevic, M., Lebensohn, R. A., Cazacu, O., Revil-Baudard, B., Proust, G., Vogel, S. C., and Nixon, M. E., “Modeling bending of -titanium with embedded polycrystal plasticity in implicit finite elements,” Mat. Sci. Eng. A, Vol. 564, 2013b, pp. 116–126. 10.1016/j.msea.2012.11.037.
- Kitayama et al. [2013] Kitayama, K., Tome, C., Rauch, E., Gracio, J., and Barlat, F., “A crystallographic dislocation model for describing hardening of polycrystals during strain path changes. Application to low carbon steels,” Int. J. Plast., Vol. 46, 2013, pp. 54–69. 10.1016/j.ijplas.2012.09.004.
- Zecevic and Knezevic [2015] Zecevic, M., and Knezevic, M., “A dislocation density based elasto-plastic self-consistent model for the prediction of cyclic deformation: Application to AA6022-T4,” Int. J. Plast., Vol. 72, 2015, pp. 200–217. 10.1016/j.ijplas.2015.05.018.
- Viguier et al. [1995] Viguier, B., Hemker, K. J., Bonneville, J., Louchet, F., and Martin, J.-L., “Modelling the flow stress anomaly in -TiAl I. Experimental observations of dislocation mechanisms,” Philos. Mag. A, Vol. 71, No. 6, 1995, pp. 1295–1312. 10.1080/01418619508244375.
- Naka et al. [1988] Naka, S., Lasalmonie, A., Costa, P., and Kubin, L., “The low-temperature plastic deformation of -titanium and the core structure of a-type screw dislocations,” Philos. Mag. A, Vol. 57, No. 5, 1988, pp. 717–740. 10.1080/01418618808209916.
- Follansbee and Gray [1989] Follansbee, P., and Gray, G., “An analysis of the low temperature, low and high strain-rate deformation of Ti- 6Al- 4V,” Metall. Trans. A, Vol. 20, No. 5, 1989, pp. 863–874. 10.1007/BF02651653.
- Zhang et al. [2016] Zhang, Z., Jun, T.-S., Britton, T. B., and Dunne, F. P., “Determination of Ti-6242 and slip properties using micro-pillar test and computational crystal plasticity,” J. Mech. Phys. Solids, Vol. 95, 2016, pp. 393–410. 10.1016/j.jmps.2016.06.007.
- Williams and Schaal [1962] Williams, W. S., and Schaal, R. D., “Elastic deformation, plastic flow, and dislocations in single crystals of titanium carbide,” J. Appl. Phys., Vol. 33, 1962, pp. 955–962. 10.1063/1.1777197.
- Appel et al. [1997] Appel, F., Lorenz, U., Oehring, M., Sparka, U., and Wagner, R., “Thermally activated deformation mechanisms in micro-alloyed two-phase titanium amminide alloys,” Mater. Sci. Eng. A, Vol. 233, No. 1-2, 1997, pp. 1–14. 10.1016/S0921-5093(97)00043-9.
- Pilchak et al. [2014] Pilchak, A. L., Li, J., and Rokhlin, S. I., “Quantitative comparison of microtexture in near-alpha titanium measured by ultrasonic scattering and electron backscatter diffraction,” Metall. Mater. Trans. A, Vol. 45, No. 10, 2014, pp. 4679–4697. 10.1007/s11661-014-2367-1.
- Pilchak et al. [2016] Pilchak, A. L., Shank, J., Tucker, J. C., Srivatsa, S., Fagin, P. N., and Semiatin, S. L., “A dataset for the development, verification, and validation of microstructure-sensitive process models for near-alpha titanium alloys,” Integr. Mater. Manuf. Innov., Vol. 5, No. 1, 2016, p. 14. 10.1186/s40192-016-0056-1.
- Gockel et al. [2016] Gockel, B. T., Kolesar, R. S., and Rollett, A. D., “Experimental study of an aerospace titanium alloy under various thermal and tensile loading rate conditions,” Integr. Mater. Manuf. Innov., Vol. 5, No. 1, 2016, p. 13. 10.1186/s40192-016-0057-0.
- Groeber and Jackson [2014] Groeber, M., and Jackson, M., “DREAM.3D: A Digital Representation Environment for the Analysis of Microstructure in 3D,” Integr. Mater. Manuf. Innov., Vol. 3, 2014, pp. 5–19. 10.1186/2193-9772-3-5.
- Zhang and Oskay [2016b] Zhang, X., and Oskay, C., “Polycrystal plasticity modeling of nickel-based superalloy IN 617 subjected to cyclic loading at high temperature,” Modelling Simul. Mater. Sci. Eng., Vol. 24, 2016b, p. 055009. 10.1088/0965-0393/24/5/055009.
- Phan et al. [2017] Phan, V.-T., Zhang, X., Li, Y., and Oskay, C., “Microscale modeling of creep deformation and rupture in Nickel-based superalloy IN 617 at high temperature,” Mech. Mater., Vol. 114, 2017, pp. 215–227. 10.1016/j.mechmat.2017.08.008.
- Zhang and Oskay [2017b] Zhang, S., and Oskay, C., “Reduced order variational multiscale enrichment method for thermo-mechanical problems,” Comput. Mech., Vol. 59, No. 6, 2017b, pp. 887–907. 10.1007/s00466-017-1380-9.
- Ogi et al. [2004] Ogi, H., Kai, S., Ledbetter, H., Tarumi, R., Hirao, M., and Takashima, K., “Titanium’s high-temperature elastic constants through the HCP–BCC phase transformation,” Acta Mater., Vol. 52, No. 7, 2004, pp. 2075–2080. 10.1016/j.actamat.2004.01.002.
- Ozturk et al. [2016b] Ozturk, T., Stein, C., Pokharel, R., Hefferan, C., Tucker, H., Jha, S., John, R., Lebensohn, R. A., Kenesei, P., Suter, R. M., and Rollett, A. D., “Simulation domain size requirements for elastic response of 3D polycrystalline materials,” Modelling Simul. Mater. Sci. Eng., Vol. 24, No. 1, 2016b, p. 015006. 10.1088/0965-0393/24/1/015006.
- Deka et al. [2006] Deka, D., Joseph, D. S., Ghosh, S., and Mills, M. J., “Crystal plasticity modeling of deformation and creep in polycrystalline Ti-6242,” Metall. Mater. Trans. A, Vol. 37, 2006, pp. 1371–1388. 10.1007/s11661-006-0082-2.
- Ghosh et al. [201] Ghosh, S., Anahid, M., and Chakraborty, P., “Modeling fatigue crack nucleation using crystal plasticity finite element simulations and multi-time scaling,” Computational Methods for Microstructure-Property Relationships, Springer, 201, pp. 497–554. 10.1007/978-1-4419-0643-4_14.
- Ghosh and Anahid [2013] Ghosh, S., and Anahid, M., “Homogenized constitutive and fatigue nucleation models from crystal plasticity FE simulations of Ti alloys, Part 1: Macroscopic anisotropic yield function,” Int. J. Plast., Vol. 47, 2013, pp. 182–201. 10.1016/j.ijplas.2012.12.008.
- Culler [2010] Culler, A. J., “Coupled fluid-thermal-structural modeling and analysis of hypersonic flight vehicle structures,” Ph.D. thesis, The Ohio State University, 2010.
- Anderson [2006] Anderson, J. D., Jr., Hypersonic and High-Temperature Gas Dynamic, American Institute of Aeronautics and Astronautics , Reston, Virginia, 2006, pp. 103–176. 2nd ed.
- Matney et al. [2014] Matney, A., Mignolet, M. P., Spottswood, S. M., Culler, A. J., and McNamara, J. J., “Thermal reduced order model adaptation to aero-thermo-structural interactions,” Proceedings of the 55th Structures, Structural Dynamics and Materials Conference (SciTech 2014), National Harbor, Maryland, 2014, pp. 13–17. 10.2514/6.2014-0493.
- Joseph et al. [2018a] Joseph, S., Bantounas, I., Lindley, T. C., and Dye, D., “Slip transfer and deformation structures resulting from the low cycle fatigue of near-alpha titanium alloy Ti-6242Si,” Int. J. Plast., Vol. 100, 2018a, pp. 90 – 103. 10.1016/j.ijplas.2017.09.012.
- Joseph et al. [2018b] Joseph, S., Lindley, T. C., and Dye, D., “Dislocation interactions and crack nucleation in a fatigued near-Alpha titanium alloy,” Int. J. Plast., Vol. 110, 2018b, pp. 38–56. 10.1016/j.ijplas.2018.06.009.
- W. F. Chen [1988] W. F. Chen, D. J. H., Plasticity for Structural Engineers, Springer-Verlag NewYork, 1988, pp. 233–234.
- Thornton et al. [1994] Thornton, E. A., Coyle, M. F., and McLeod, R. N., “Experimental study of plate buckling induced by spatial temperature gradients,” J. Therm. Stresses, Vol. 17, No. 2, 1994, pp. 191–212. 10.1080/01495739408946255.
- Brendel et al. [2008] Brendel, T., Affeldt, E., Hammer, J., and Rummel, C., “Temperature gradients in TMF specimens. Measurement and influence on TMF life,” Int. J. Fatigue, Vol. 30, No. 2, 2008, pp. 234–240. 10.1016/j.ijfatigue.2007.01.039.
- Sun et al. [2020] Sun, J., Yuan, H., and Vormwald, M., “Thermal gradient mechanical fatigue assessment of a nickel-based superalloy,” Int. J. Fatigue, Vol. 135, 2020, p. 105486. 10.1016/j.ijfatigue.2020.105486.
- Echlin et al. [2016] Echlin, M. P., Stinville, J. C., Miller, V. M., Lenthe, W. C., and Pollock, T. M., “Incipient slip and long range plastic strain localization in microtextured Ti-6Al-4V titanium,” Acta Mater., Vol. 114, 2016, pp. 164–175. 10.1016/j.actamat.2016.04.057.
- Ma et al. [2018] Ma, R., Pilchak, A. L., Semiatin, S. L., and Truster, T. J., “Modeling the evolution of microtextured regions during processing using the crystal plasticity finite element method,” Int. J. Plast., Vol. 107, 2018, pp. 189 – 206. 10.1016/j.ijplas.2018.04.004.
- Liu and Dunne [2021] Liu, Y., and Dunne, F. P. E., “The mechanistic link between macrozones and dwell fatigue in titanium alloys,” Int. J. Fatigue, Vol. 142, 2021, p. 105971. 10.1016/j.ijfatigue.2020.105971.