Initial Characterization of Active Transitioning Centaur, P/2019 LD2 (ATLAS), using Hubble, Spitzer, ZTF, Keck, APO and GROWTH Visible Infrared Imaging and Spectroscopy
Abstract
We present visible and mid-infrared imagery and photometry of temporary Jovian co-orbital comet P/2019 LD2 taken with HST/WFC3, Spitzer/IRAC, the GROWTH telescope network, visible spectroscopy from Keck/LRIS and archival ZTF observations taken between 2019 April and 2020 August. Our observations indicate that the nucleus of LD2 has a radius between 0.2-1.8 km assuming a 0.08 albedo and a coma dominated by 100 m-scale dust ejected at 1 m/s speeds with a 1″ jet pointing in the SW direction. LD2 experienced a total dust mass loss of 108 kg at a loss rate of 6 kg/s with Af/cross-section varying between 85 cm/125 km2 and 200 cm/310 km2 from 2019 April 9 to 2019 Nov 8. If the increase in Af/cross-section remained constant, it implies LD2’s activity began 2018 November when within 4.8 au of the Sun, implying the onset of H2O sublimation. We measure CO/CO2 gas production of 1027 mol/s /1026 mol/s from our 4.5 m Spitzer observations, - = 0.590.03, - = 0.180.05, - = 0.010.07 from GROWTH observations, H2O gas production of 80 kg/s scaling from our estimated production of 7.5 mol/s from Keck/LRIS spectroscopy. We determine that the long-term orbit of LD2 is similar to Jupiter family comets having close encounters with Jupiter within 0.5 Hill radius in the last 3 y, within 0.8 Hill radius in 9 y. Additionally, 78.8 of our orbital clones are ejected from the Solar System within years having a dynamical half-life of 3.4 years.
1 Introduction
The gas giant Jupiter is the dominant gravitational perturbing body affecting the dynamical transfer of Solar System comets from the outer Solar System’s trans-Neptunian disk beyond the orbit of Neptune into the inner reaches of the Solar System (recently described in Dones et al., 2015). The vast majority of comets in transfer from the outer Solar system regions such as the Oort Cloud in the case of long period comets (recently described in Vokrouhlický et al., 2019) or the trans-Neptunian region in the case of short period comets (recently described in Nesvorný et al., 2017). Once the comets originating from the trans-Neptunian region randomly walk their way through the outer Solar System and become strongly influenced by close-encounters with Neptune and Uranus, a significant portion are transformed in their orbital configuration into the Centaur group of small bodies. The Centaur class is defined as having semi-major axes, , and perihelion, , between 5.2 au, the semi-major axis, of Jupiter, and 30 au, the semi-major axis of Neptune, , (Jewitt, 2009). An additional quantity used to define the small bodies in the inner-Solar system is the Tisserand parameter with respect to Jupiter, , defined as
| (1) |
where is the eccentricity of the body and is the inclination. can be used as a rough indication of how much an object is influenced by the gravitational perturbations of Jupiter (Murray & Dermott, 1999). Centaurs are objects that generally have 3.05 (Gladman et al., 2008) whereas Jupiter family comets have 32(Duncan et al., 2004). However, we note that the 3.05 boundary does not strictly define objects as Centaurs as there can be non-Centaur objects with 3.05.
The mean dynamical half-life of Centaurs is 2.7 Myr with the vast majority of Centaurs eventually being ejected from the Solar System (Horner et al., 2004) while the Jupiter family comets have a bit shorter lifetimes of 0.5 Myr (Levison & Duncan, 1994). The chaotic evolution of the Centaurs causes a significant number (around one third) to becoming Jupiter family comets at some point in their lifetimes, prior to their eventual ejection from the Solar System (Horner et al., 2004). The Centaur 2014 OG, recently discovered to be active (Chandler et al., 2020), may be an example of an object transitioning between the Centaur and Jupiter family comet groups. Some can even be temporarily captured as satellites of the giant planets, or to the Jovian and Neptunian Trojan populations (e.g., Horner & Evans, 2006; Horner & Lykawka, 2012). Another example of a Centaur recently in the stage of becoming a Jupiter Family Comet is 29P/Schwassmann-Wachmann. Centaur 29P is located in a region of orbital parameters space with 5.5 au 8.0 au, and aphelion, 5 au 7 au that acts as a “gateway” that the Centaurs preferentially inhabit whilst in the process of dynamically transferring to become Jupiter family comets to becoming Jupiter family comets (Sarid et al., 2019).
The recently discovered briefly Jovian co-orbital comet P/2019 LD2 (Sato et al., 2020), with a semi-major axis of 5.30 au, a perihelion of 4.57 au and aphelion of 6.02, may be another example of an object in the transition region between Centaur objects and Jupiter family comets. The comet will only spend 1 orbit in the dynamical configuration where it has a Jupiter-similar semi-major axis (Hsieh et al., 2021; Kareta et al., 2020a). Initially reported as an inactive object by the ATLAS survey (Tonry, 2011) in 2019 June and designated by the Minor Planet Center as 2019 LD2111https://minorplanetcenter.net/dbsearch/showobject?utf8=E29C93objectid=P2F2019+LD2, it was discovered to be active by amateur astronomers222http://aerith.net/comet/catalog/2019LD2/2019LD2.html. Pre-discovery images and follow-up images of the comet taken by ATLAS and other ground-based telescopes resulted in it being given the cometary designation P/2019 LD2 (Fitzsimmons et al., 2020). Whilst technically some of the orbital elements of P/2019 LD2 such as its semi-major axis, resemble those of a Jovian co-orbital, it is inherently unstable in stark contrast to the stable orbits of Jovian Trojans, which are stable on timescales comparable to the age of the Solar system and are located at 60∘ mean longitude with respect to Jupiter (e.g., Marzari et al., 2002). In addition, the Jovian Trojans have a different origin having most likely been captured as a result of Jupiter’s migration during the Solar system’s formation, 4.5 Gyr ago (e.g., Morbidelli et al., 2005; Roig & Nesvorný, 2015).
One proposed origin for P/2019 LD2 is that it is a Jupiter family comet in the transition region in orbital parameters space inhabited by objects that are in transition between Centaurs and Jupiter family comets (Steckloff et al., 2020). As comets transfer from their origins in the outer Solar System beyond the orbit of Neptune and become denizens of the inner Solar System, they will experience a dramatic shift in the thermal environment due to increased thermal insolation from the Sun (De Sanctis et al., 2000; Sarid & Prialnik, 2009). The consequence of the increased Solar insolation as the comet nears the Sun is the increased heating and sublimation of volatiles such as CO and H2O near the comet’s surface (Meech & Svoren, 2004; Lisse et al., 2020). Another consequence of the increased heating from closer proximity of the Sun is that large-scale ablation of the comet’s structure due to thermal stress can occur resulting in it becoming partially or completely disrupted (Fernández, 2009). Since P/2019 LD2 is now in transition between the Centaur and Jupiter Family Comet populations, it seems likely that it has become active for the first time, and as such, its activity will be rapidly evolving in response to the new epoch of increased Solar heating.
We therefore present in this paper the analysis of visible light high-resolution Hubble Space Telescope/Wide Field Camera 3 (HST/WFC3 Dressel, 2012) observations of P/2019 LD2 using the approach of Jewitt et al. (2014) and Bolin & Lisse (2020) to understand the dust coma and nucleus properties, and to constrain the cause of P/2019 LD2’s activity. We will also use mid-infrared (MIR) P/2019 LD2 observations taken with Spitzer Space Telescope/Infrared Array Camera (Spitzer/IRAC Werner et al., 2004) combined with the analysis techniques of Reach et al. (2013) and Lisse et al. (2020) to place upper limits on the comet’s CO+CO2 gas production. We also use multi-wavelength observations covering the visible and MIR by building on the techniques of Bolin et al. (2020b) by using a network of ground-based observatories to characterize the physical properties of this transitioning Centaur. In addition, we will examine the long-term orbital properties of P/2019 LD2 using its latest orbital solution in order to better understand its possible origins and future dynamical evolution.
2 Observations
Observations of P/2019 LD2 were obtained before the official announcement of its activity in 2020 May both by targeted observations by ground and space-based observatories and serendipitously in the survey observations by the Zwicky Transient Facility (ZTF) (Graham et al., 2019). The time span of our targeted observations is 2019 Sep 7 UTC to 2020 Aug 19 UTC including observations by the Astrophysical Research Consortium 3.5 m telescope (ARC 3.5 m) Spitzer, HST, Keck I and members of the GROWTH network (Kasliwal et al., 2019) such as Mount Laguna Observatory 40-inch Telescope (MLO 1.0-m), Liverpool Telescope (LT), Lulin Optical Telescope (LOT). A list of our targeted observations and their viewing geometry is listed in Table LABEL:tab:obs. The time span of our serendipitous observations of P/2019 LD2 made with the ZTF survey is between 2019 April 9 UTC and 2019 Nov 8 UTC and are listed with their viewing geometry in Table LABEL:tab:phot.
2.1 Zwicky Transient Facility
We searched for serendipitous observations of P/2019 LD2 made with the Zwicky Transient Facility survey mounted on the Palomar Observatory’s 48-inch telescope (Bellm et al., 2019) in the ZTF archive (Masci et al., 2019). The ZTF archive possessed observations of P/2019 LD2 made as far back as 2019 April 9 UTC which we include up to 2019 Nov 8 UTC. The observations were made in and band in images consisting of 30 s exposures. Seeing conditions were typically between 1.5-2.5″ and at air masses ranging from 1.4 to 2.6. A full list of observations of P/2019 LD2 made by ZTF containing the viewing geometry and observing conditions is presented in Table LABEL:tab:phot.
2.2 Apache Point Astrophysical Research Consortium 3.5 m
Following the announcement of the appearance of activity of P/2019 LD22 (then called 2019 LD2), we triggered target of opportunity observations with the ARC 3.5 m at Apache Point Observatory on 2019 September 7 UTC using the ARCTIC large-format optical CCD camera (Huehnerhoff et al., 2016). The camera was used in full-frame, quad amplifier readout, 22 binning mode resulting in a pixel scale of 0.228″ and used with the and filters. In total, 14 and exposures were obtained, each 120 s long and in alternating order between the and filters. The telescope was tracked at the sky-motion rate of the comet of 8.6″/h. The seeing was 1.4″ and the airmass was 1.8 during the observations.
2.3 Spitzer Space Telescope
Observations of P/2019 LD2 were made with the Spitzer Space Telescope (Spitzer) using the IRAC instrument (Fazio et al., 2004) on 2020 January 25-26 UTC (DDT program 14331, PI Bolin et al., 2019). The observations consisted of 11 Astronomical Observing Requests (AORs), each consisting of 80 x 12 s dithered frames and having a 0.44 h duration for a total of 4.8 h clock time. The frames where dithered in groups of 10, with each using a large cycling pattern. The sky at the location of P/2019 LD2 during the Spitzer observations possessed a high density of stars due to its low, -18∘ galactic latitude, therefore shadow observations were used to improve the sensitivity of the observations. Out of a total of 11 AORs, eight were focused on observed P/2019 LD2 for a total of 2.13 h on source time. The remaining three AORs were Shadow observations that were evenly spaced in the sky location covering the trajectory of P/2019 LD2 between 2020 January 02:23:32-23:10:44 that P/2019 LD2 was being observed. The target was centered in the 4.5 m channel since this channel is sensitive to CO/CO2 emission and also because the object was expected to be brightest at this wavelength. The 4.5 m IRAC channel has a spatial resolution of 1.2″/pixel. The data were reduced in a method as described in (Fernández et al., 2013).
2.4 Hubble Space Telescope
The Hubble Space Telescope (HST) was used to observe P/2019 LD2 with General Observer’s (GO) time on 2020 April 1 UTC (HST GO 16077, PI Bolin et al., 2020a). During the one orbit visit, five 380 s F350LP filter exposures were obtained with the UVIS2 array of the WFC3/UVIS camera (Dressel, 2012) for a total of 1900 s integration time over a single orbit. The F350LP filter has a central wavelength of 582 nm with a FWHM bandpass of 490 nm (Deustua et al., 2017). The instrument and filter combination of WFC3 and the F350LP filter provides a per-pixel resolution of 0.04″ corresponding to 145 km at the topo-centric distance of the comet. The comet was tracked non-sidereally according to its skyplane rate of motion of 40″/h.
2.5 Mount Laguna Observatory 40-inch Telescope
Multi-band optical images of P/2019 LD2 were obtained with the 1.0 m Telescope at the Mount Laguna Observatory (Smith & Nelson, 1969) on 2020 May 17 UTC. Johnson-Cousins , and filters were used in combination with the E2V 42-40 CCD Camera to obtain 7-9 120 s exposures in each filter. The seeing conditions were 1.92″, the airmass was 1.49 and sidereal tracking was used. This facility is a member of the GROWTH collaboration.
2.6 Liverpool Telescope
Observations of P/2019 LD2 were made in , , and filters by the 2 m Liverpool Telescope located at the Observatorio del Roque de los Muchachos on 2020 May 29 UTC. The IO:O wide-field camera was used with a 2x2 binning providing a pixel scale of 0.3″ (Steele et al., 2004). Two 30 s exposures were made per filter with the telescope tracking at the sidereal rate. The seeing conditions were 1.21 ″ and the airmass was 1.75. Detrending of data was performed using the automated IO:O pipeline software (Steele et al., 2004). This facility is a member of the GROWTH collaboration.
2.7 Lulin Optical Telescope
Multiband , , and imaging of P/2019 LD2 were made by the 1 m Lulin Optical Telescope on 2020 June 23-27 UTC and 2020 July 10 UTC. The observations were made using the 2K 2K SOPHIA camera with a pixel scale of 0.52 ″(Kinoshita et al., 2005). Exposure times of 90 s were where the telescope was tracked at the non-sideral rate determined by the ephemeris of the comet. The seeing conditions of the observations were 1.5″ and the airmass was 1.15.
2.8 Keck I Telescope
A spectrum of P/2019 LD2 was obtained using the Low-Resolution Imaging Spectrometer (LRIS) Oke et al. (1995) on the Keck I telescope on 2020 August 19 UTC (PI J. von Roestel, C272). The blue camera consisting of a 2 x 2K x 4K Marconi CCD array was used with the red camera consisting of a science grade Lawrence Berkeley National Laboratory 2K x 4K CCD array. Both cameras have a spatial resolution of 0.135 ″/pixel. We used the 560 nm dichroic with 50 transmission efficiency in combination with the 600/4000 grism for the blue camera, rebinned twice in both the spectral and spatial direction, and the 600/7500 grating for the red camera, rebinned once in the spectral direction and twice in the spatial direction, providing a spectral resolution of 0.8 nm and 0.5 nm, respectively, and a spatial resolution of 0.27″. A total integration time of 300 s was used for the exposure and was obtained at airmass 1.8 in 0.85″ seeing conditions. Both telluric correction and Solar-analog stars were observed at similar air masses as P/2019 LD2. Wavelength calibration was completed using the HgCdZn lamps for the blue camera and the ArNeXe lamps for the red camera. We used a local Solar analog star to remove the Solar component from the spectrum of P/2019 LD2. The LPipe spectroscopy reduction package was used to reduce the data (Perley, 2019).
3 Results
3.1 Morphology and nucleus
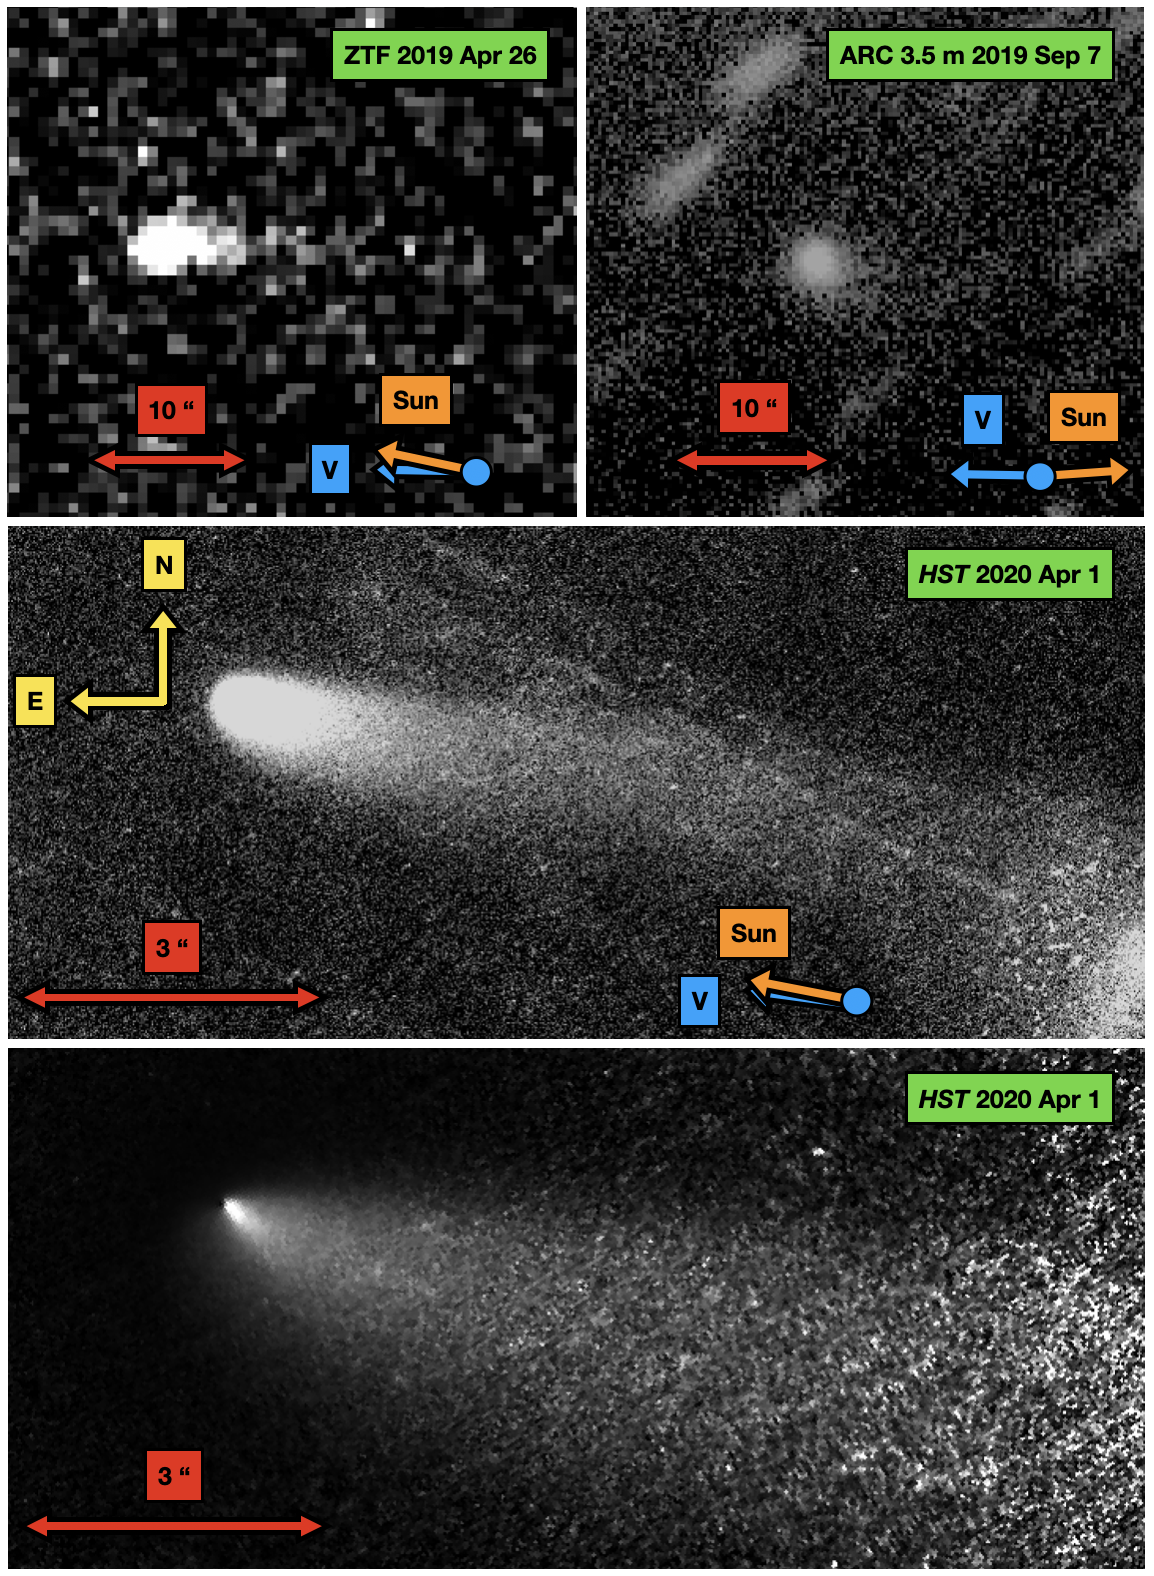
Serendipitous pre-discovery observations of P/2019 LD2 were obtained with ZTF on 2019 April 26 UTC consisting of three 30 s exposures in band. These pre-discovery data of P/2019 LD2 have been co-added into a composite image with an equivalent 90 s integration time presented in the top left panel of Fig. 1. The comet has an extended appearance with a 20″ long tail with a position angle of 260∘ in the anti-Solar direction. ZTF obtained pre-discovery detections of P/2019 LD2 on 2019 April 9,15 and 20, but the comet did not have a discernible extended appearance in these data.
On 2019 September 7 UTC, the ARC 3.5 m was used to obtain 20 x 120 s exposures of P/2019 LD2 in band. A composite median stack with an equivalent exposure time of 2400 s is presented in the top right panel of Fig. 1. In the ARC 3.5 m images, the comet has a diffuse, non-stellar appearance. The tail is not easily defined in the ARC 3.5 m median stack, though the comet’s extended appearance is enhanced in the opposite direction of the comet’s orbital motion with a position angle of 230∘ and length of 5″.
The center panel of Fig. 1 presents the appearance of P/2019 LD2 in a median stack of five 380 s F350LP image with an equivalent integration time of 1900 s taken with HST/WFC3 on 2020 April 01 UTC. Cosmic rays have been removed from the composite image stack with median interpolation of the surrounding pixels. The high-resolution composite HST stack was taken when the comet was at an orbit-plane angle of -0.44∘ and had a tail with a length of 32″ limited by background structure caused by galaxies and sky noise opposite of the Solar direction with a position angle of 250∘. The 32″-long tail translates into a length of 6.2108 m given its topo-centric distance of 5.02 au and a phase angle of 10.7∘. An enhanced version of the HST median composite stack normalized by the distance from the optocenter reveals a possible jet structure 1″ long as seen in the bottom panel of Fig. 1. We will discuss the implications of the comet’s morphology from these observations for its dust properties below in Section 3.3.
We compare the surface brightness profile of P/2019 LD2 to the simulated surface brightness profile of a G2 field star WFC3 point-spread function (PSF) assuming the use of the F350LP filter using the TinyTim software (Krist et al., 2011) as seen in Fig. 2. Both the radial profiles of P/2019 LD2 and the simulated stellar G2V source are computed by azimuthally averaging concentric apertures centered on the optocenter separated by the pixel scale allowed by WFC3 using the F350LP filter. The normalized surface brightness profile of P/2019 LD2 between 0.24″-1.2″ was fit to the functional form of where is the surface brightness and is the distance from the optocenter in pixels resulting in a radial profile slope of m-1.71. We note that the radial profile slope is steeper than the typical -1 to -1.5 radial profile slope of comets with an isotopic coma in a steady state. The steeper radial profile slope of P/2019 LD2 compared to comets with isotopic coma may be an independent indication that the comet’s evolving dust production rate (Jewitt & Meech, 1987).
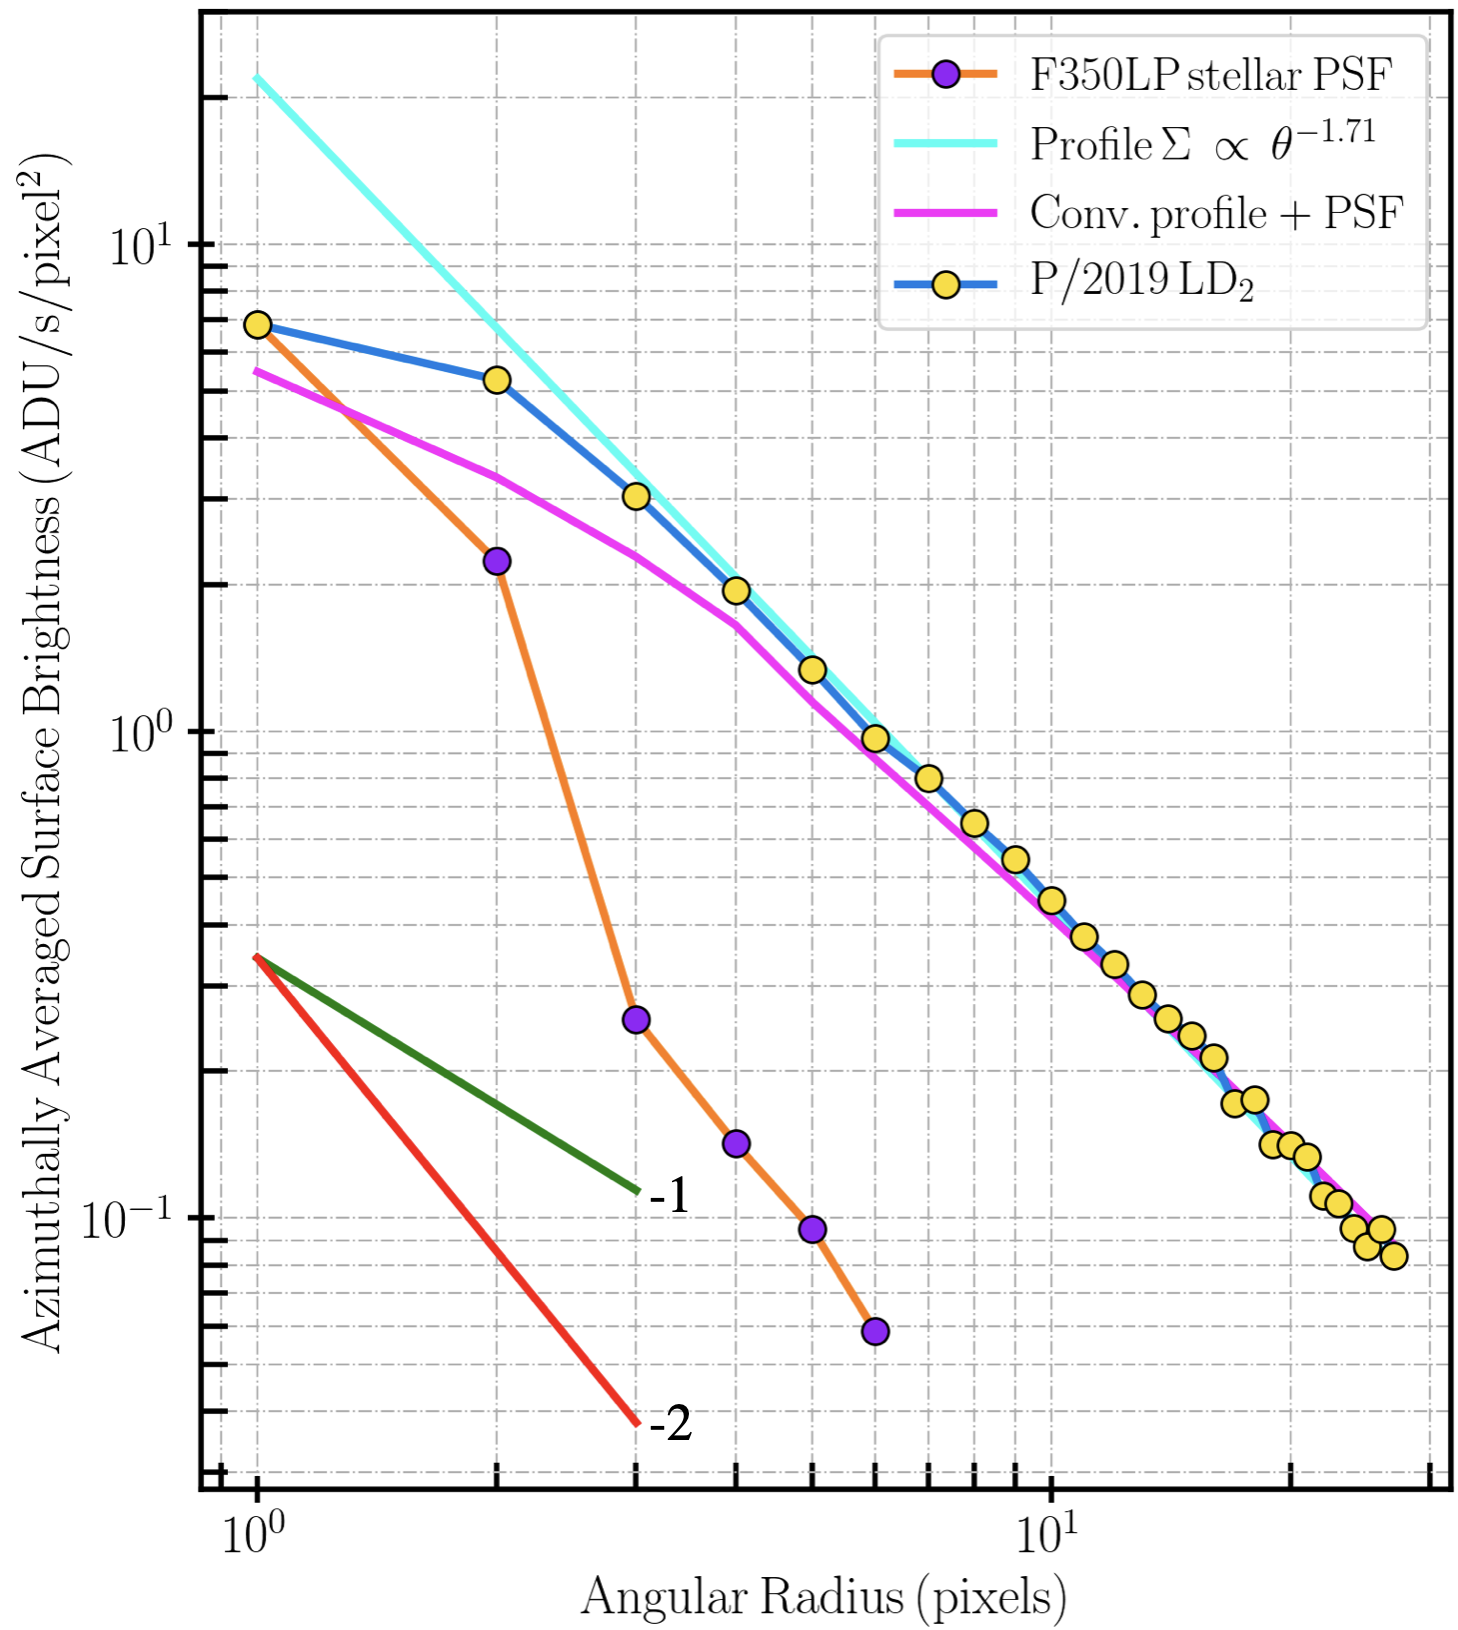
The fitted 0.24″-1.2″ radial profile of P/2019 LD2 was convolved with the synthetic G2V PSF and subtracted from the measured radial profile of P/2019 LD2 to calculate a equivalent nucleus brightness of V = 22.60.04 assuming a mV-mF350LP0.1(Bolin et al., 2020b). We assume the following phase function for determining the absolute magnitude of the nucleus,
| (2) |
where and , are the heliocentric distance, topo-centric distance and phase angle of the comet as listed in Table LABEL:tab:obs for the 2020 April 1 UTC observation. = 0.04, where we assume a phase coefficient of 0.04 in magnitudes/degree, resulting in = 15.530.05. The true phase coefficient of P/2019 LD2 is unknown, therefore our uncertainty on the measured value of is considered a lower limit.
From our measured value of , we calculate the light scattering cross-section, , of P/2019 LD2 in km2 using the following function
| (3) |
where is the albedo the nucleus, assumed to be 0.08, the typical albedo measured for Centaurs (Bauer et al., 2013), resulting in =11.150.42 km2. Converting our measured cross-section to a radius using , we obtain a radius of 1.8 km, comparable to the radius estimates of P/2019 LD2 based on un-resolved photometry and the non-detection of P/2019 LD2 from ground-based observations (Schambeau et al., 2020). We note that this is a radius estimate based on a single observation and represents a size assuming a spheroid shape. Significant deviations from a spheroid shape such as a bi-lobal (Nesvorný et al., 2018) or elongated shape (Bolin et al., 2018; Hanuš et al., 2018) as has been observed for other comet-like bodies may require additional observations to be made of P/2019 LD2 to accurately determine its size.
3.2 Photometry and lightcurve
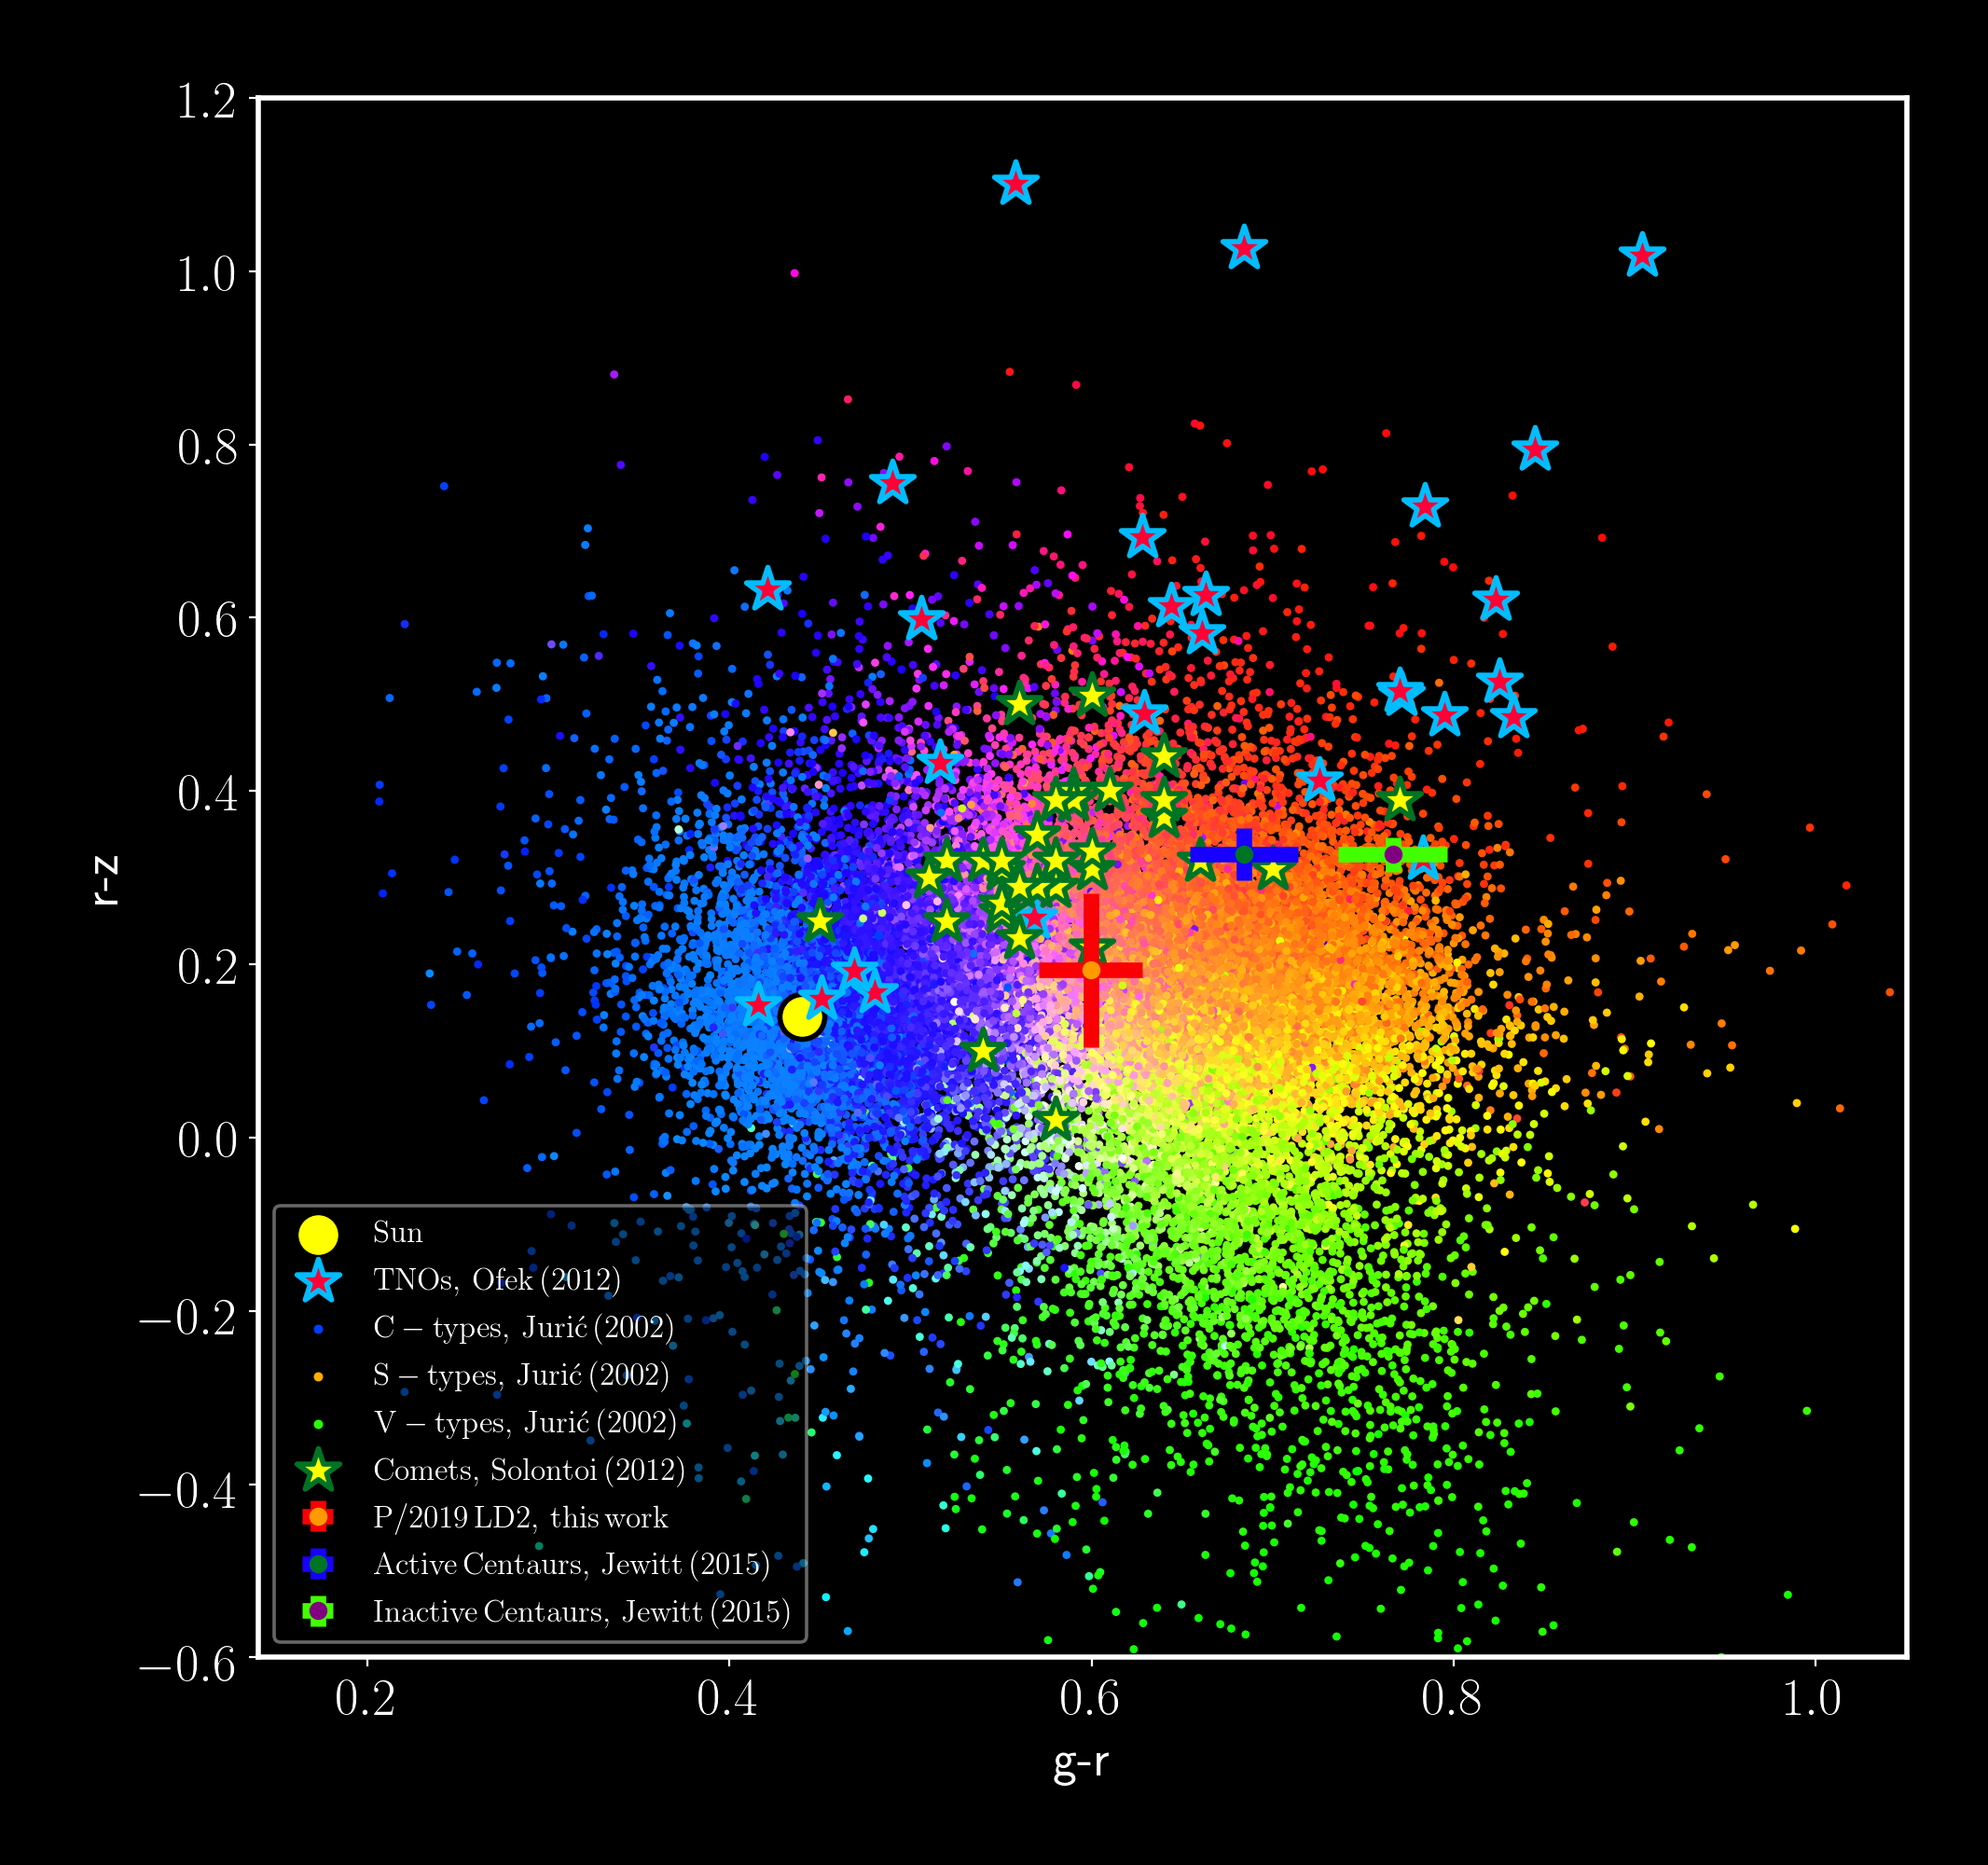
Using the combination of our ground-based observations with the ARC 3.5 m taken on 2019 September 7 UTC, the MLO 1.0-m on 2020 May 27 UTC, the LT on 2020 May 29 UTC and Lulin Optical Observatory on 2020 July 10 UTC, we have calculated the mean colors of P/2019 LD2 using 10,000 km photometric apertures of - = 0.600.03, -=0.180.05, -=0.010.07. The filter configuration and viewing geometry of our observations are presented in Table LABEL:tab:obs. The equivalent angular size of the 10,000 km used in our photometric calculations ranged from 3.2″ to 3.7″ with the seeing during observations ranging from 1.2″ to 1.9″. We used the color transformations from Jordi et al. (2006) to convert the Johnson-Cousins photometry of P/2019 LD2 from the MLO 1.0-m and LT to the SDSS system.
Our visible measured colors of P/2019 LD2 are reddish to neutral in the 480 nm to 910 n wavelength range covered by our filters consistent with the measured colors of other active Solar System comets as presented in Fig. 3. For comparison purposes only, we have included the colors of inactive objects in Fig 3. We note that the measured colors of P/2019 LD2 from our observations are somewhat bluer compared to the colors of active and inactive Centaurs measured by Jewitt (2015), though this may be due to the longer wavelength coverage of our observations which go as far as 910 nm compared to the shorter visible-wavelength observations of Jewitt (2015).
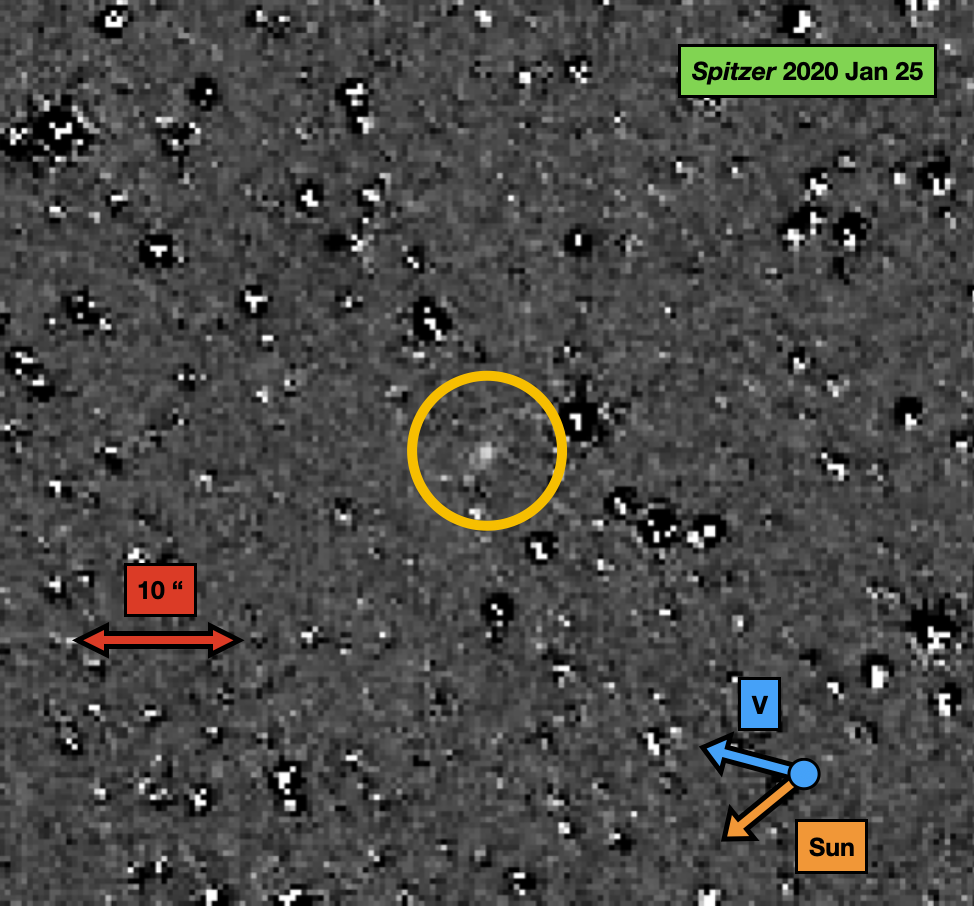
Images from each of the Spitzer DDT program 14331 AORs 1,4,6,9 and 10 that were used to take images of P/2019 LD2 from 2020 January 25 2:23 to 23:11 UTC were reduced using the reduction methods described in Fernández et al. (2013). Images obtained during each of these five AORs using the 4.5 m channel were co-added to form a single composite image with an equivalent exposure time of 948 s for each AOR.
P/2019 LD2 was located in a crowded star field at a galactic latitude of -18∘. Therefore, due to the imperfections in the shadowing technique, we used an aperture size with an angular width of 3.24″ equivalent to 10,000 km at the topo-centric distance of 4.26 au of the comet from Spitzer. We obtain an on-source flux density for P/2019 LD2 of 35.62.8 Jy at 4.5 m using the average of the five photometry measurements from the composite images made from each of the AORs 1, 4, 6, 9 and 10. The comet has a slightly extended appearance of more than 2.4 ″ as seen in Fig. 4 and an aperture correction was applied to the flux density measurement. The flux from the nucleus assuming a km-scale nucleus radius as measured in Section 3.1 is 0.1 Jy, less than 1 of the total flux.
We present the based off of the Spitzer/IRAC photometry of P/2019 LD2 using the definition of A’Hearn et al. (1984) which is a quantity in units of length, in this case cm, that corrects the comet’s brightness with respect to heliocentric distance, geocentric distance, aperture size, Solar spectrum and filter wavelength. The values are normalized to 0∘ phase angle, , using the Halley-Marcus cometary phase function defined by Schleicher & Bair (2011). Assuming that the entirety of the flux in the 4.5 m Spitzer/IRAC observations is from dust in local thermal equilibrium, we calculate a = 334 cm. This is strictly an upper limit on due to the possible contribution of gas in the measured flux of the comet.
If we assume that the entirety of the flux from the comet is from CO emission and that the gas speed is 0.5 km/s, we measure a gas production rate of 1.60.11027mol/s similar to the results of Kareta et al. (2020b). For CO2, assuming that the entirety of the flux is due to gas emission, we obtain a gas production rate of 1.40.11026mol/s comparable to the CO2 measured for comets observed in the MIR at similar heliocentric distances (Reach et al., 2013; Bauer et al., 2015).
Using our archival observations of P/2019 LD2 from ZTF taken between 2019 April 9 UTC and 2019 November 8 UTC, we have plotted the equivalent magnitudes of P/2019 LD2 as a function of time since the perihelion date of 2020 April 10 UTC, () measured with equivalent 20,000 km apertures presented in the top panel of Fig. 5 with observational details in Table LABEL:tab:phot. These observations include data taken in -band which have been corrected to an equivalent -band magnitude using our - color estimate for P/2019 LD2 of 0.6. The 20,000 km aperture was equivalent to an angular size of 5.4″ on 2019 November 8 UTC when the comet had a geocentric distance of 5.14 au and an angular size of 7.52″ when the comet had a geocentric distance of 3.67 au on 2019 July 1 UTC. The measured local seeing in the ZTF images at the time of observation ranged between 1.6″ to 3.9″ with a median seeing value of 2.0″. Using only the r-band photometry, the data show a secular brightening trend of the comet as the comet approached opposition on 2019 June 24.42 UTC increasing in brightness by 1.60.2 mags/day. After leaving opposition, the comet showed an asymmetrical secular fading trend of 0.40.1 mags/day compared to the pre-opposition brightening trend.
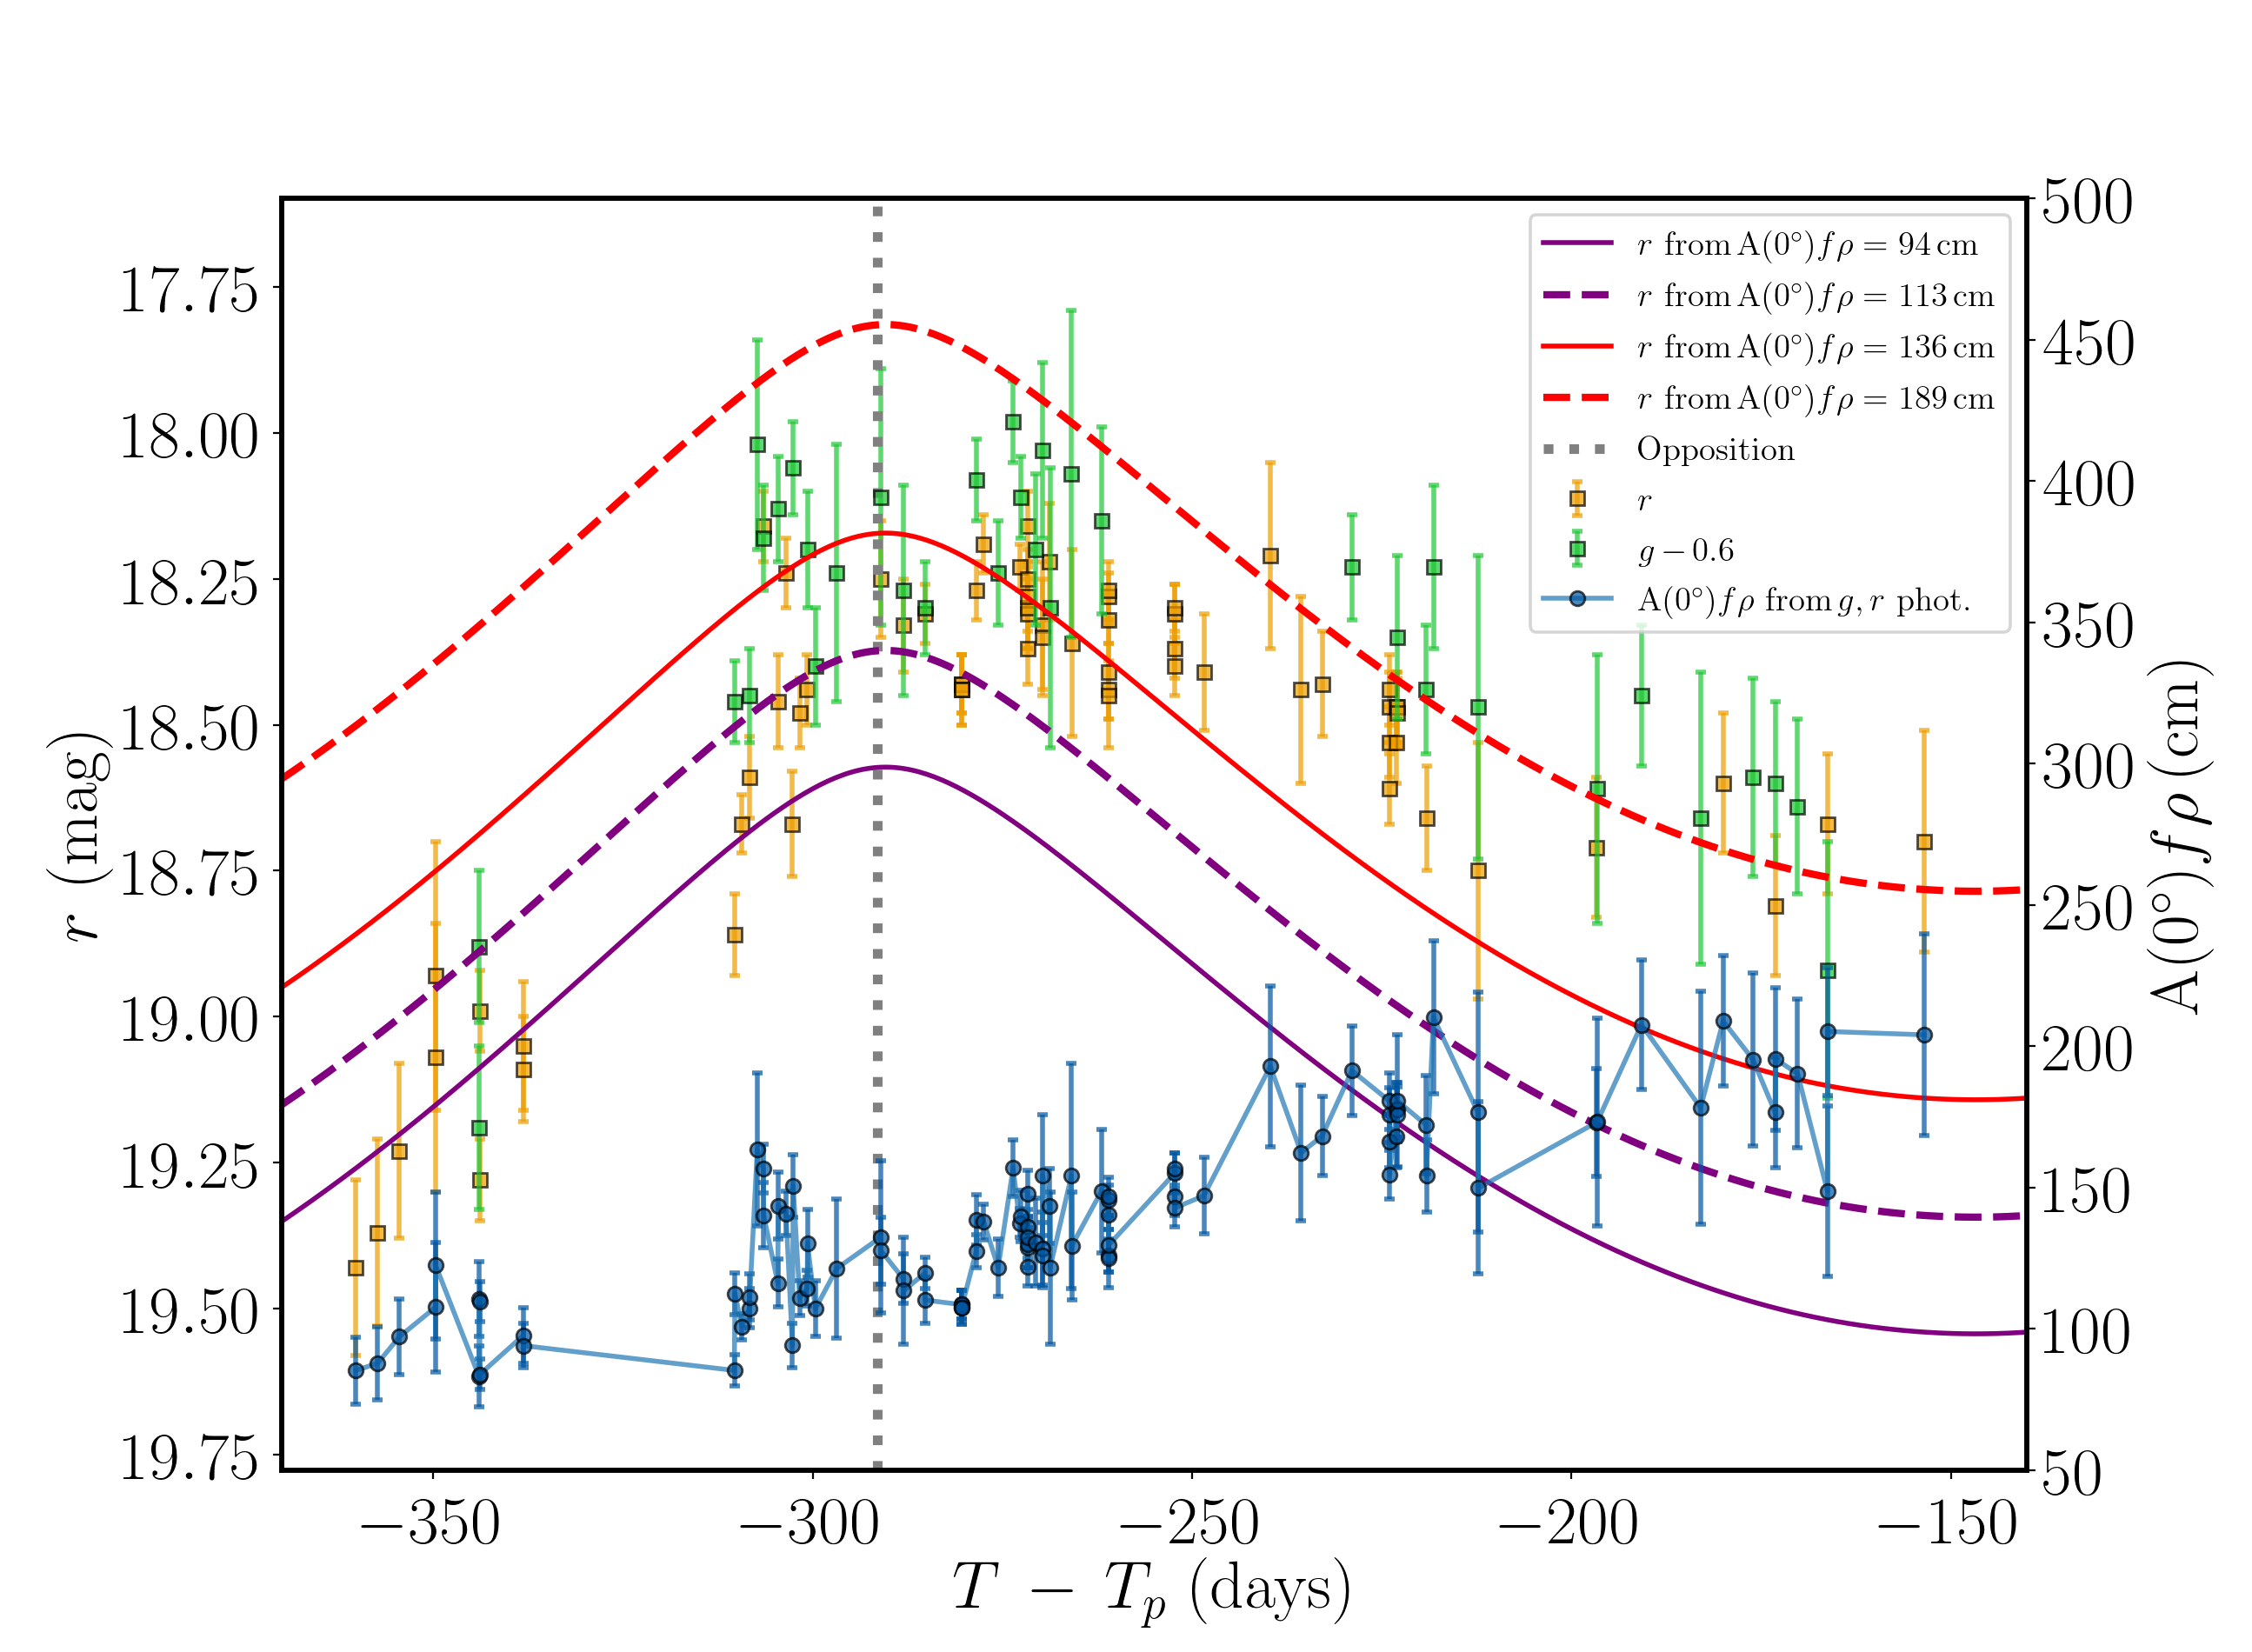
In addition to photometry, we present the based off of the ZTF photometry of P/2019 LD2 using as implemented by Mommert et al. (2019). The values are normalized to 0∘ phase angle, and are plotted against the second Y-axis in the top panel of Fig. 5 and presented in Table LABEL:tab:phot. Values of constant are plotted for reference in the top panel of Fig. 5. The value of rises consistently over the span of our observations resulting in asymmetry in the brightness of P/2019 LD2 as it passed through opposition on 2019 June 24 UTC ( = -291 days). Before opposition between = -370 and -312, the error weighted mean of = 93.911.8 cm, between = -312 and -291, = 113.18.57 cm. After opposition the error weighted mean of between = -291 and -211 equaled 136.29.7 cm and from = -211 and -50, = 188.825.8 cm. The range of from 85 cm to 200 cm is consistent with the observed range of comets which ranges from 1 to 10,000 cm (A’Hearn et al., 1995).
3.3 Dust properties and mass loss
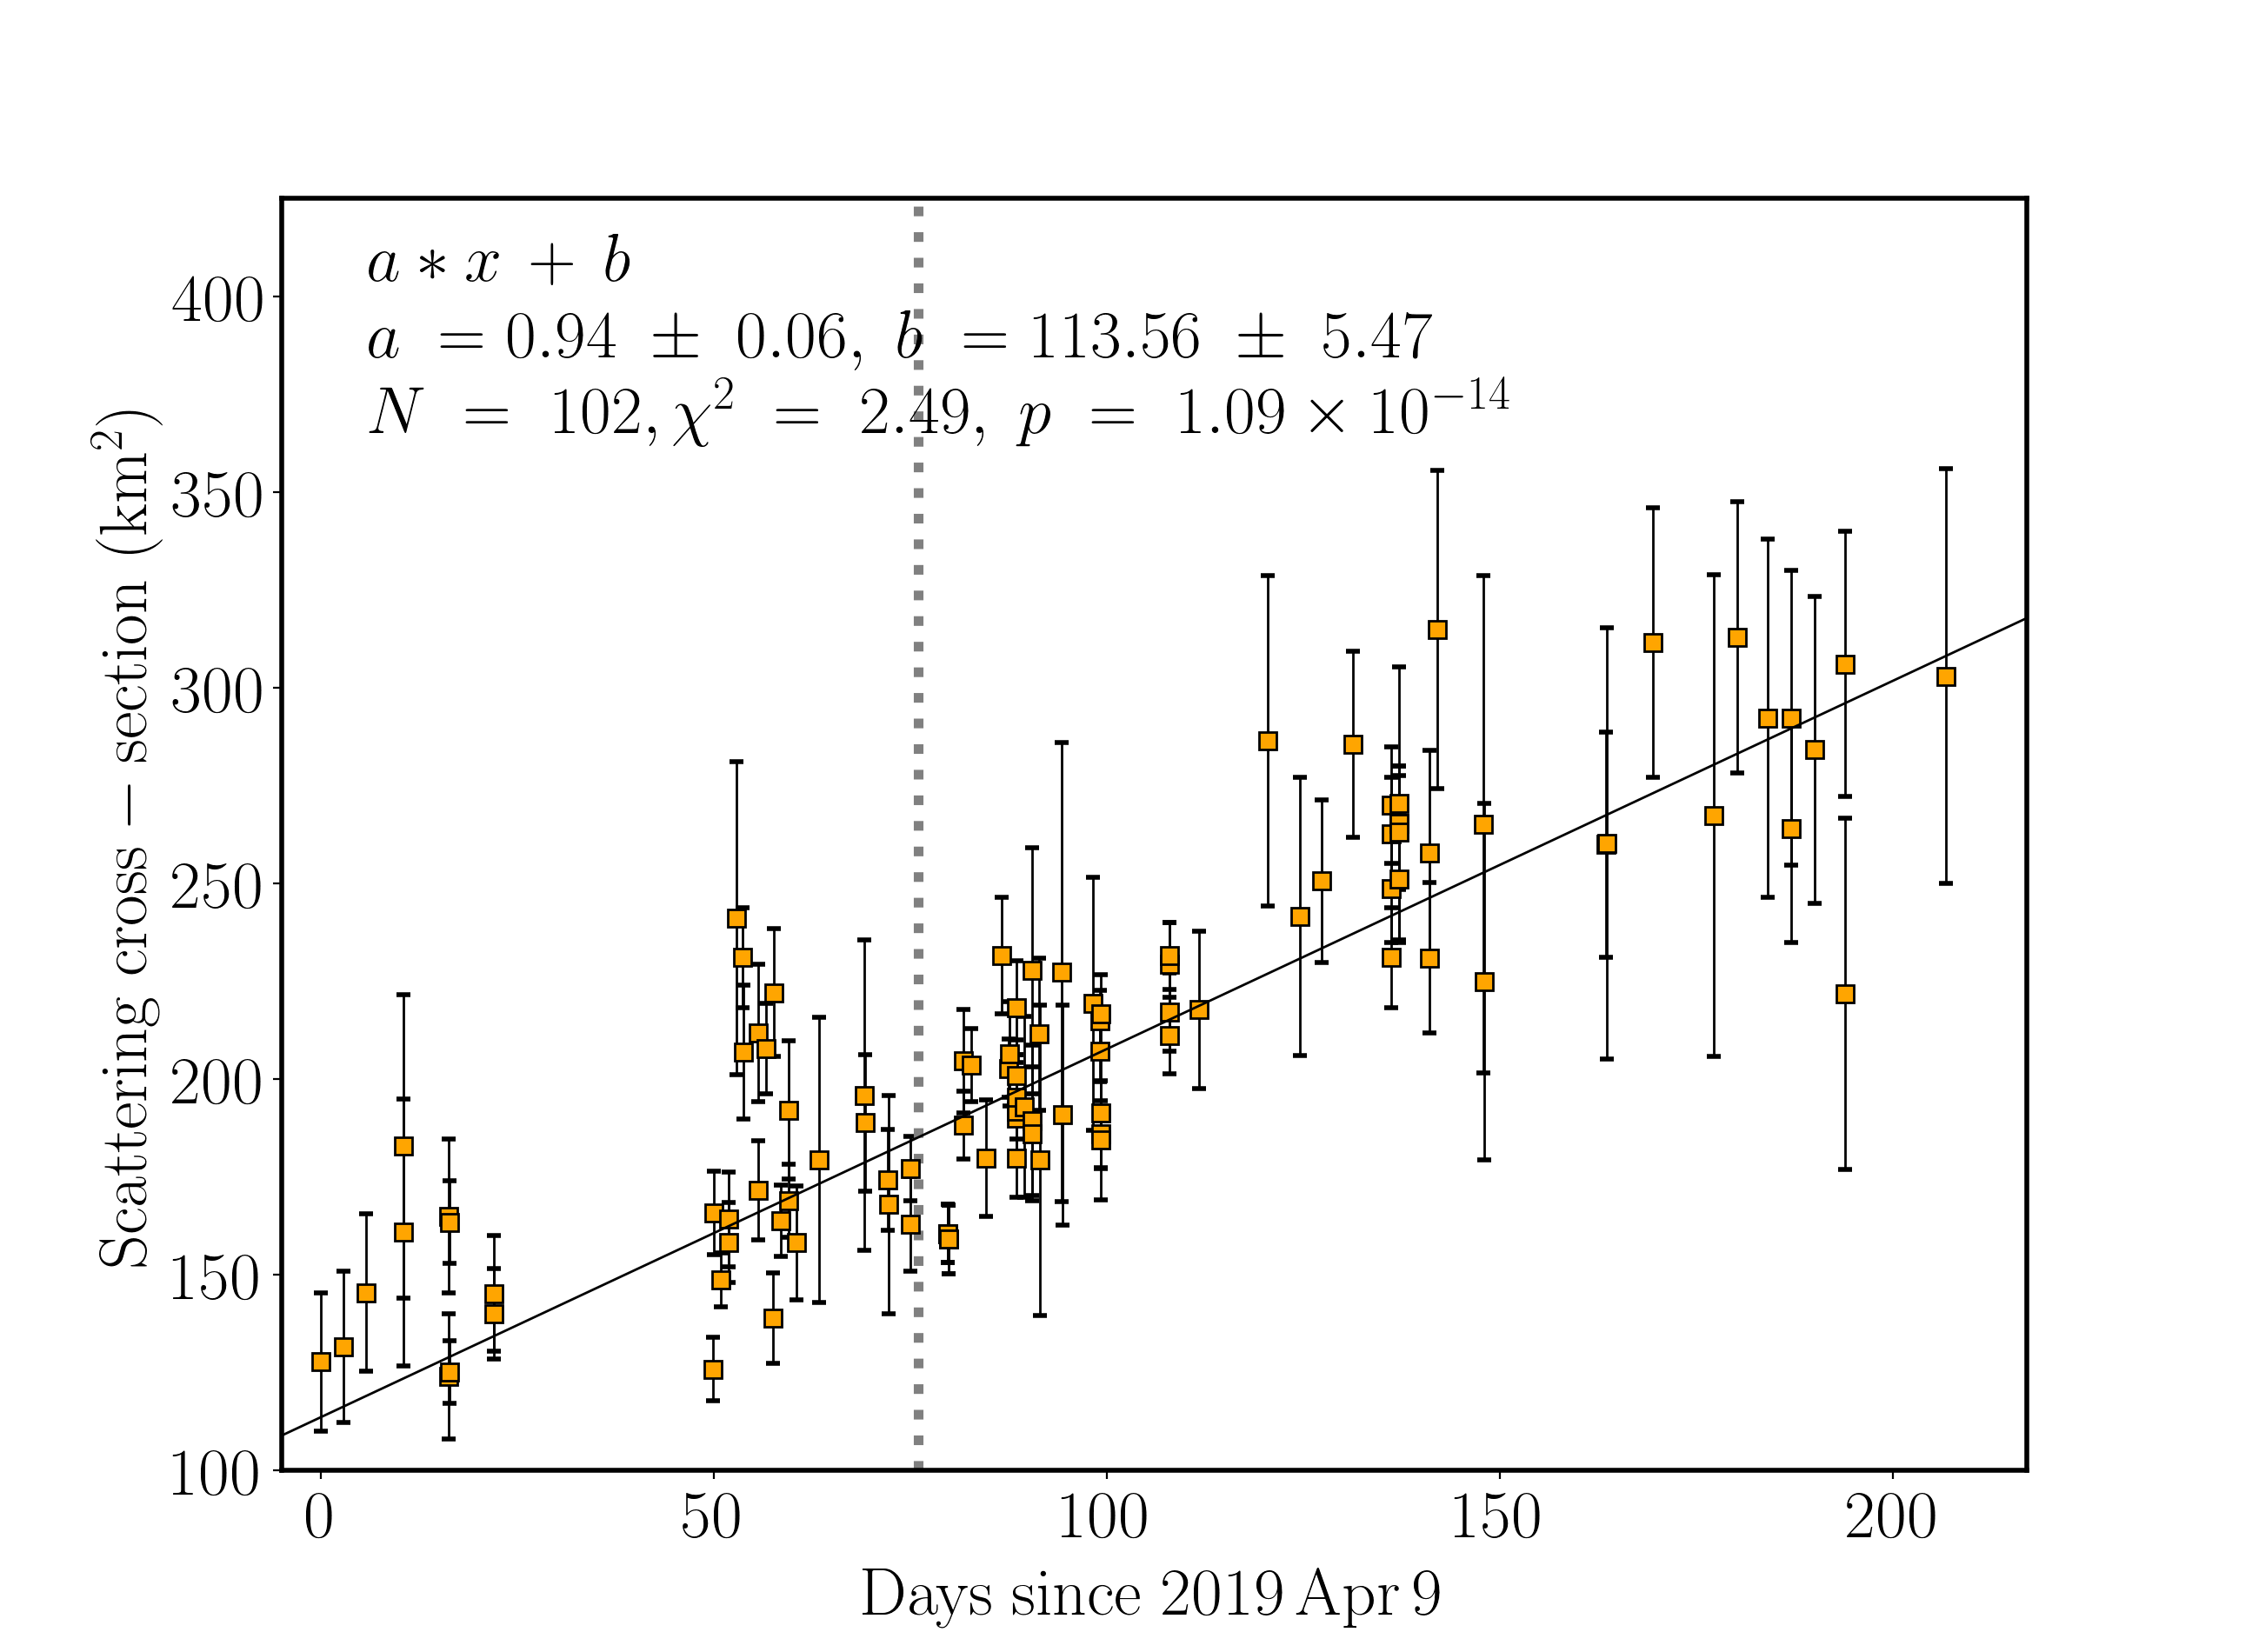
In addition to calculating the of P/2019 LD2, we calculate the value of for each of the equivalent -band magnitudes in Table LABEL:tab:phot using Eqn. 3 which are plotted in the bottom panel of Fig. 5. A linear function is fit to these data resulting in a fitted slope parameter value of = 0.940.06 km2/day. The change in phase angle over the time of our observations is modest as seen in Table LABEL:tab:phot, therefore variations in the phase function used to calculate should have a minimal effect on the estimate of the uncertainty of our measured slope parameter. Extrapolating backward in time beyond the range of our data results in a = 0 km2 at 135 days before 2019 April 9 UTC, the date of our first photometry data point or on 2018 November 24 UTC during which P/2019 LD2 had a heliocentric distance of 4.8 au when water ice begins to sublimate (Lisse et al., 2019).
The dimensionless ratio of Solar radiation and gravitational forces is defined by (Burns et al., 1979)
| (4) |
where is the length of dust travel, in this case, the observed length of the tail of P/2019 LD2 of 6.2108 m, is the heliocentric distance, is the gravitational acceleration towards the Sun at 1 au equal to 6.010-3 m/s2 and is the time of particle release. Assuming a mean value of 4.6 au, = 6.2108 m, the length of the tail estimated from the 2020 April 1 UTC HST/WFC3 images, and = 4.3 s, the time between the 2020 April 1 UTC HST/WFC3 observations and the estimated start of the activity, we calculate a value of =2.4. Making the assumption that the dust particles are dielectric spheres (Bohren & Huffman, 1983), the reciprocal of our estimated value of translates into particle size, , in m of 400 m. However, we caution that this may be an upper limit on the dust size due to the limitations of our tail length measurement by the contamination of background galaxies in the HST/WFC3 images due to variations in the activity of P/2019 LD2 affecting our estimate of based on the backwards extrapolation of the photometric data.
Assuming our estimated particle size of 400 m, we estimate the total mass loss over the duration of our ZTF observations between 2019 April 9 UTC and 2019 November 8 UTC by = 4/3 where is the difference between the cross section at the start and end of our observations equal to 220 km2. Assuming a dust density of 1 kg/m3 (McDonnell et al., 1986), we obtain a total mass loss over the time span of our observations of 108 kg. Adopting our estimated value of 1 km2/day, we obtain a mass loss rate using = 5105kg/day.
To estimate the fraction of active area of P/2019 LD2, , we take the ratio between the mass-loss rate and the equilibrium mass sublimation flux at 4.6 au, fs = 1.4 kg m-2 (Jewitt et al., 2015) where 0.4 km2. Thus, 10 of P/2019 LD2’s surface is active assuming our inferred size radius of 1.8 km from Section 3.1, comparable to the active surface area measured for Jupiter family comets (Fernández et al., 1999). An alternative assumption is to assume that P/2019 LD2 has a 100 active area setting a lower limit to its radius of 0.2 km.
In addition, we use the perpendicular profile of P/2019 LD2 taken with the high-resolution images from HST/WFC3 to estimate the out-of-plane distribution of dust with a minimum of projection effects as the Earth passed through the projected orbital plane of P/2019 LD2 with a projected orbital plane angle of only 0.4∘ on 2020 April 1 UTC. We measured the FWHM along the perpendicular direction of the tail’s profile as a function of distance from the optocenter, between 0 and 2″ in increments of 0.12″ slices as are plotted in Fig. 6.
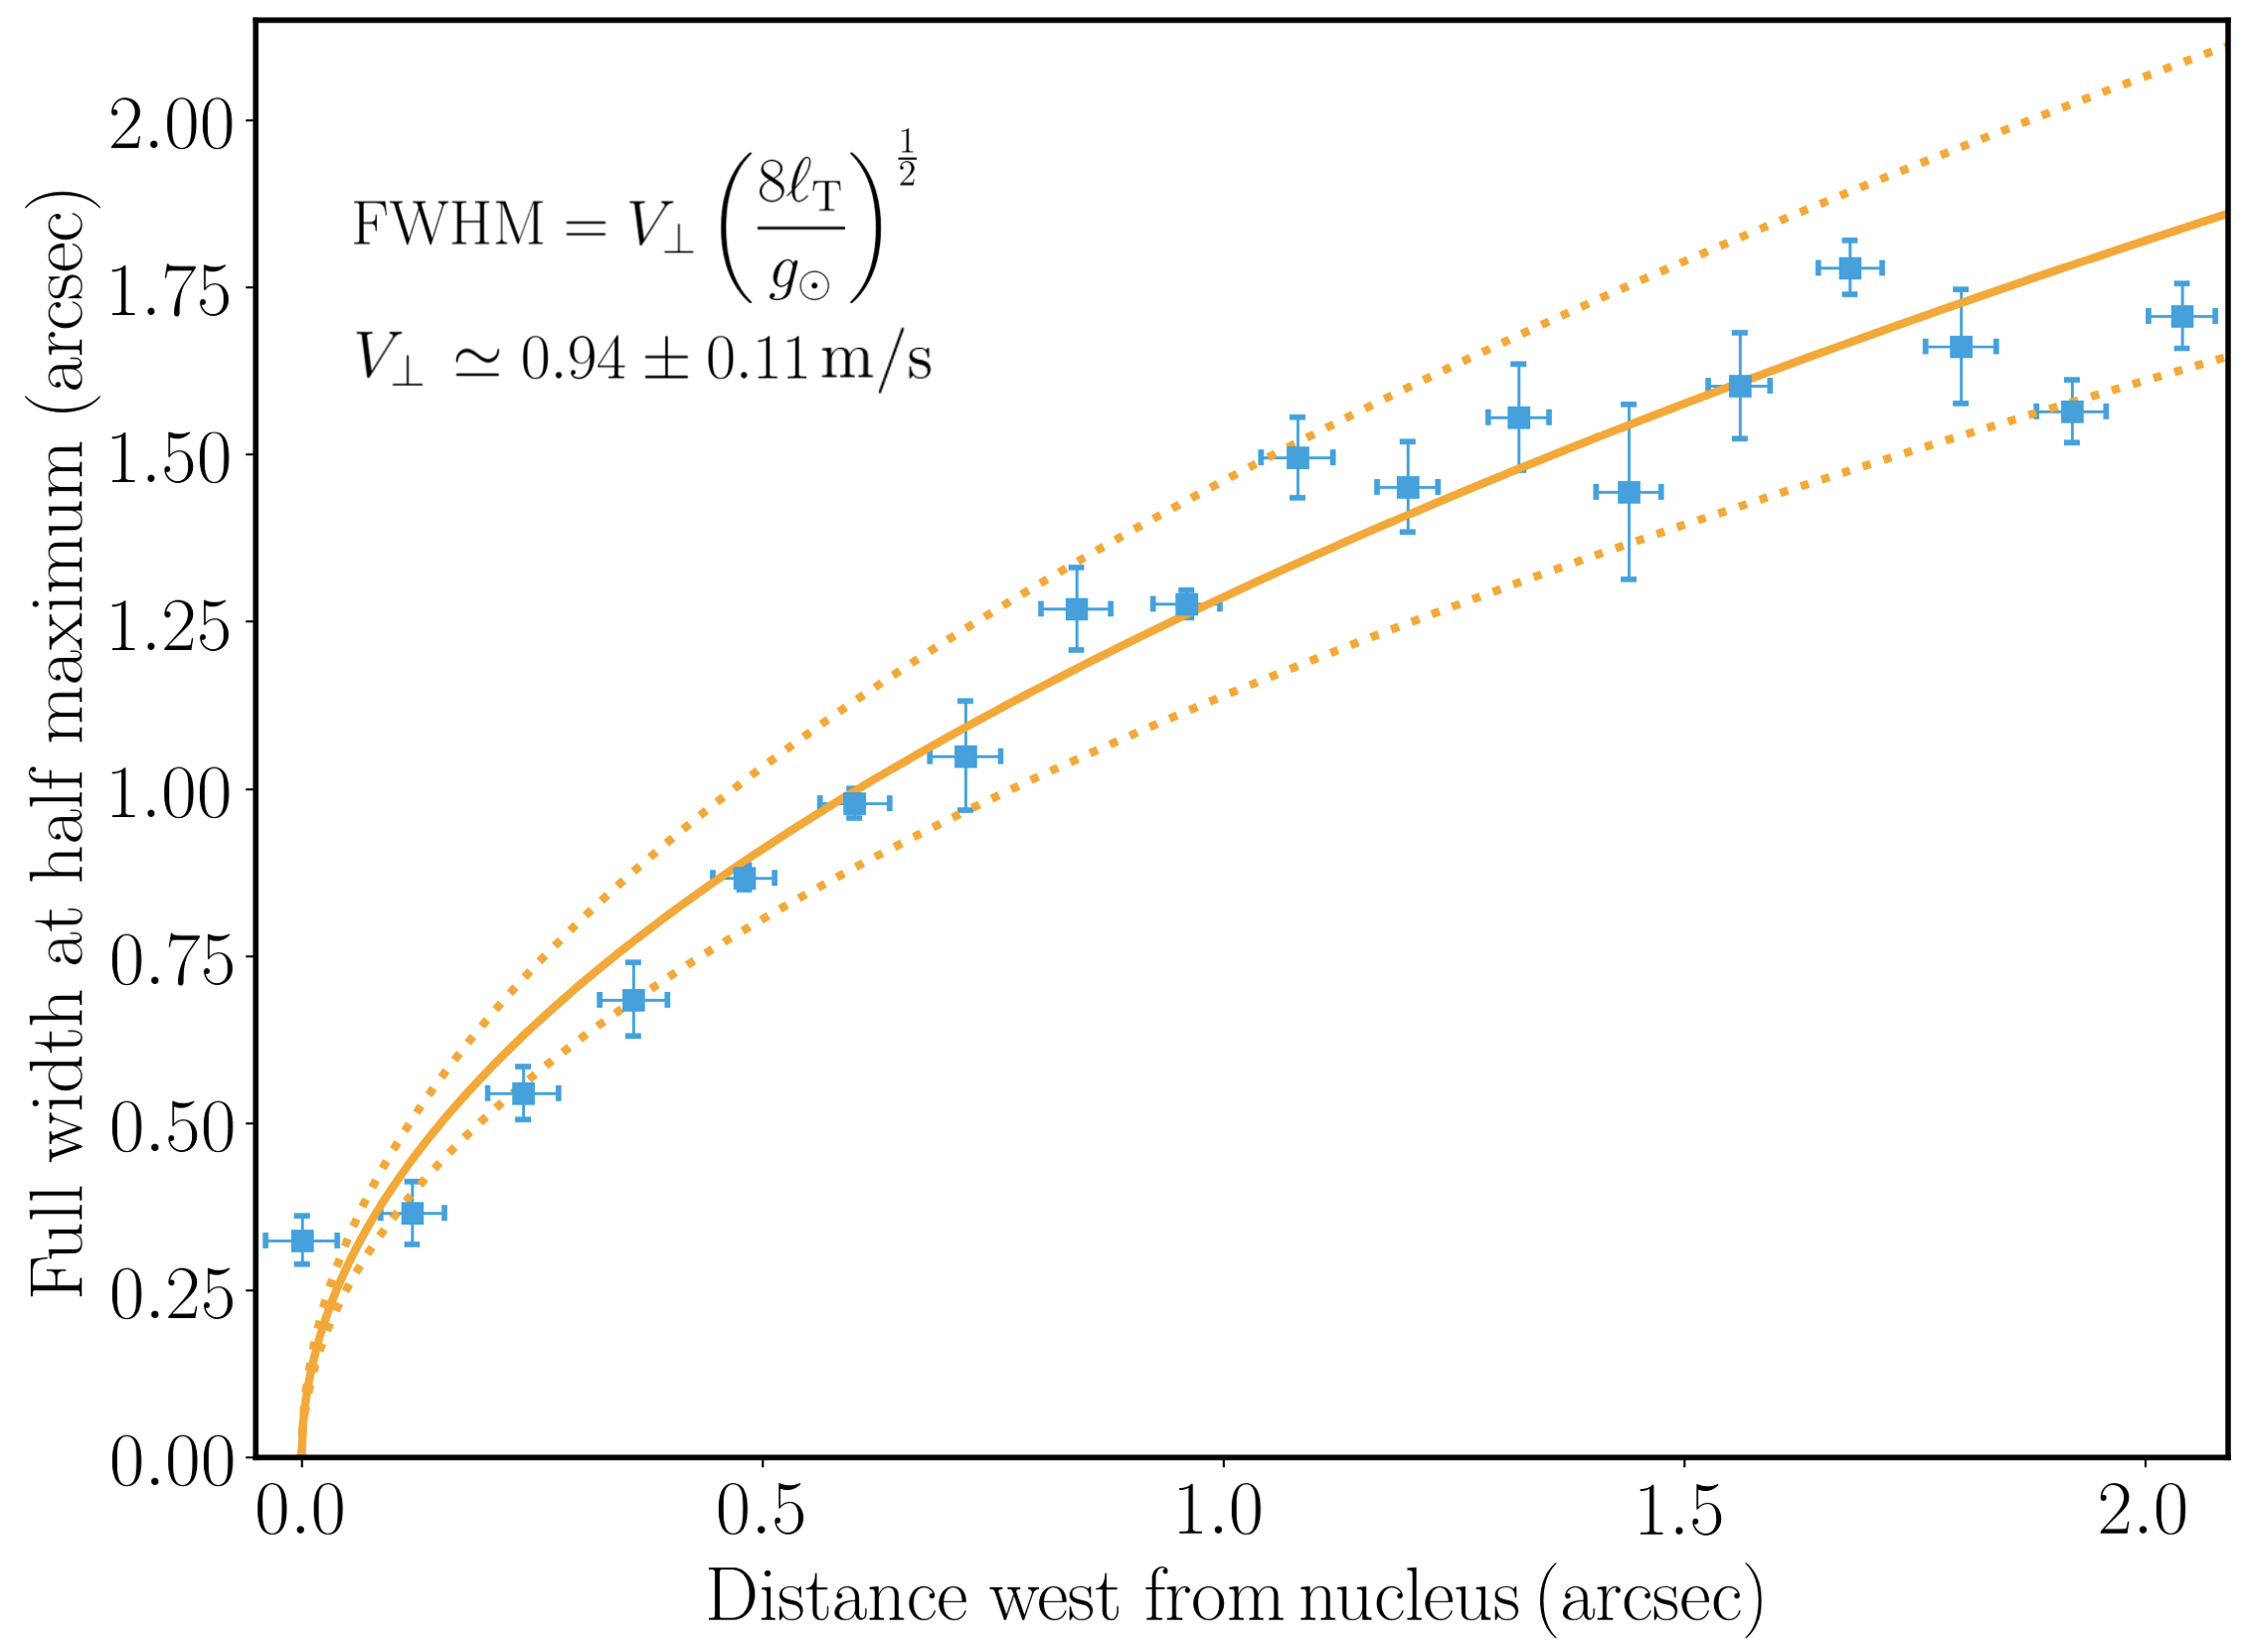
Neglecting projection effects, the FWHM of the tail gradually widened with and was fit to the following function
| (5) |
from (Jewitt et al., 2014) where is the component of the ejection velocity perpendicular to the orbital plane, equal to 1 m/s. We estimate that the perpendicular component of the ejection velocity scales with V⊥ 1 m/s -1/2 where = 400 m (Jewitt et al., 2014).
3.4 Spectrum
The spectrum of P/2019 LD2 was extracted using a 7.4″-wide region centered on the peak of the continuum’s brightness. We compute the normalized reflectance spectrum of P/2019 LD2 taken with Keck/LRIS on 2020 August 19 UTC in the wavelength range between 400 nm and 1000 nm by dividing the P/2019 LD2 spectrum by our Solar analog spectrum and normalized to unity at 550 nm. The resulting spectrum indicates a reddish to neutral coma color for P/2019 LD2 as seen in Fig. 7 . We measured a slope of 16/100 nm between 480 and 760 nm and a flatter spectrum between 760 nm and 900 nm consistent with the photometric colors taken by LT on 2020 May 29 plotted over the LRIS spectra in Fig. 7 for reference. Our spectrum shows no sign of emission in the 505 nm to 522 nm range (Farnham et al., 2000) in the highlighted range in Fig. 7.
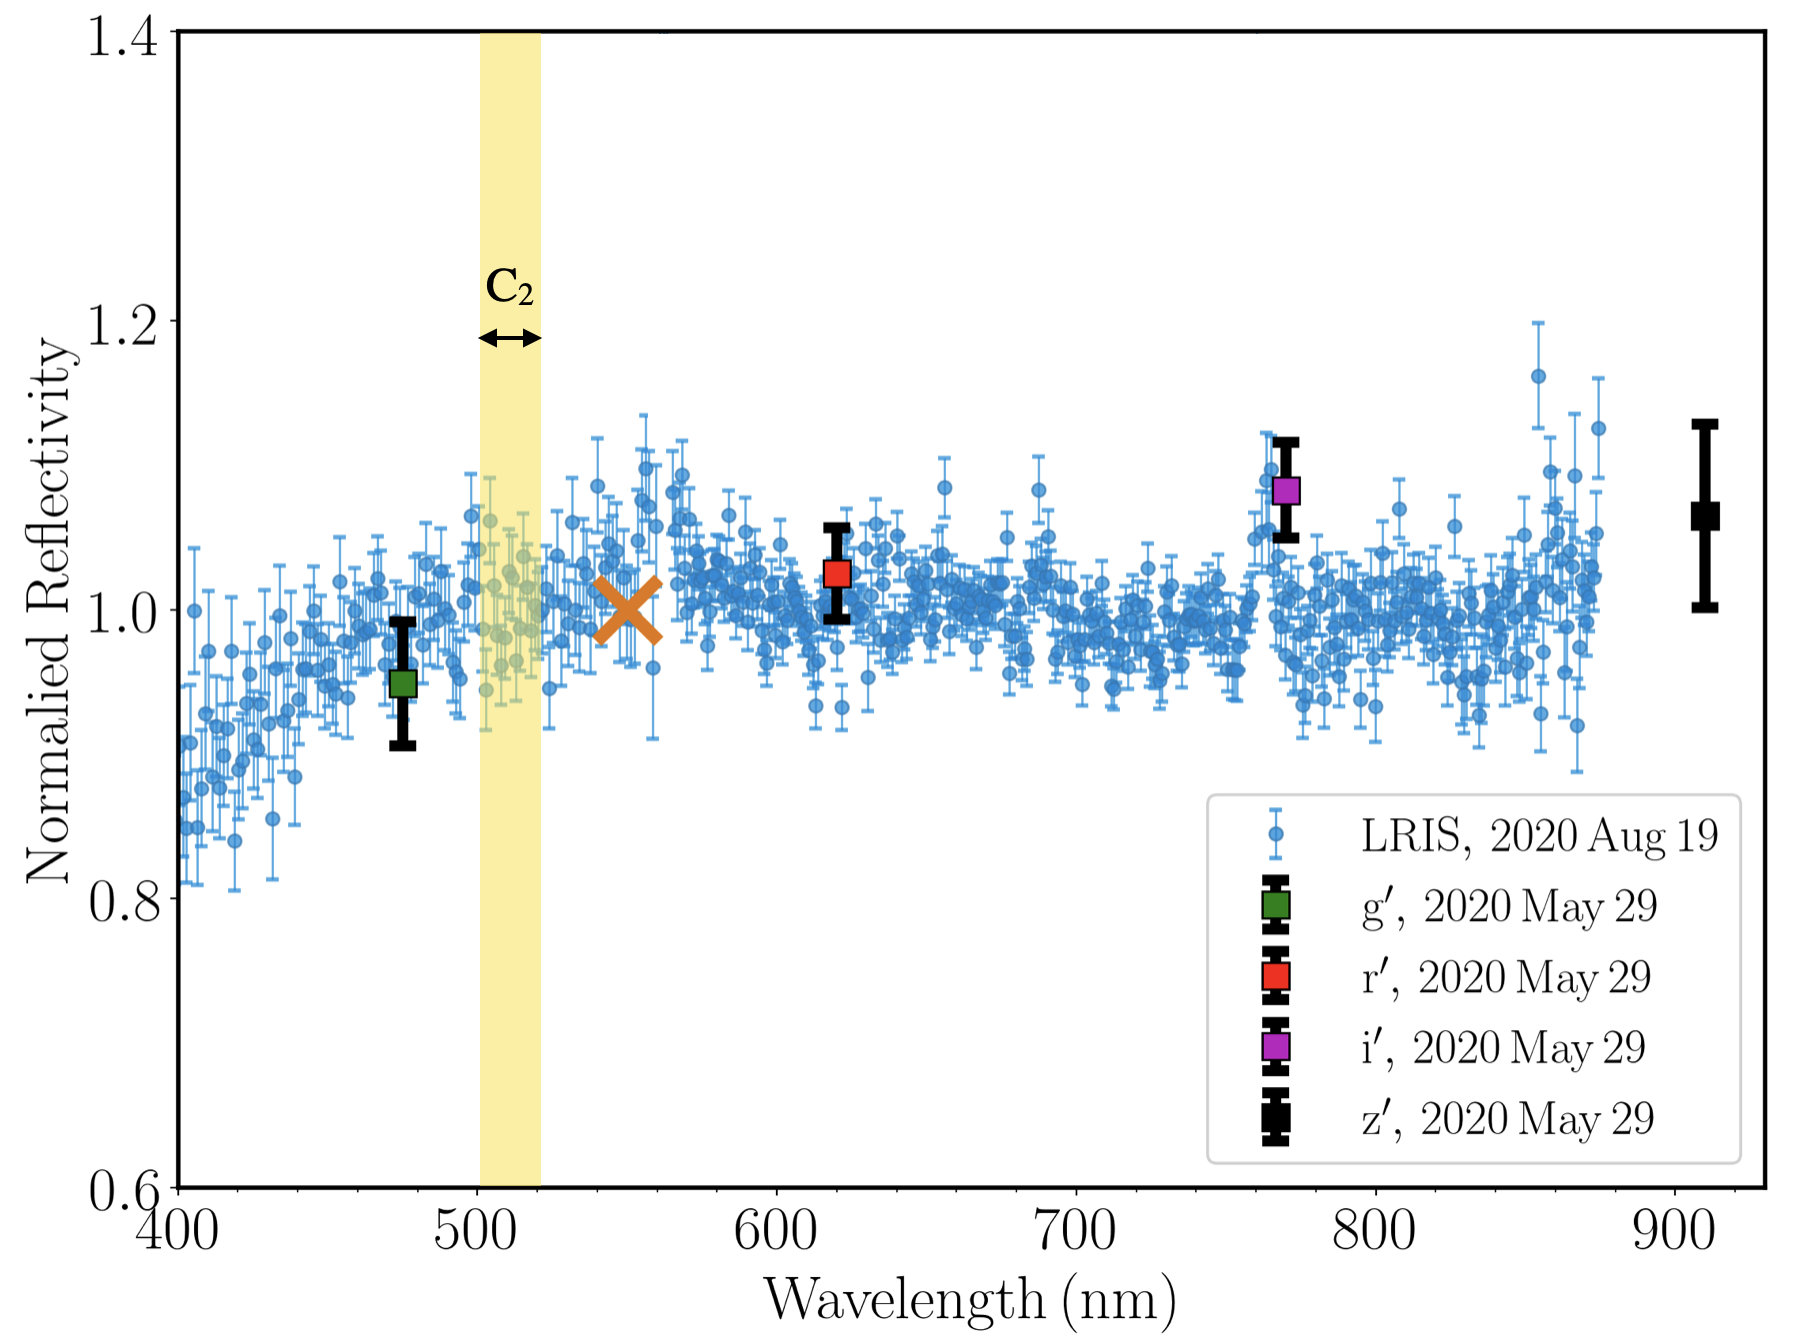
We set an upper limit to the gas production of P/2019 LD2 using the mean -band continuum flux density of P/2019 LD2 using its measured 550 nm flux, fluxV = 1.52 erg cm-2 s-1 nm. The fractional 1 continuum statistical uncertainty of our P/2019 LD2 spectrum in the range spanning the 505 nm to 522 nm is 0.01 corresponding to a 3 flux density flux = 2.13 erg cm-2 s-1 nm including a correction of 0.6 for slit losses. The 3 upper limit to the flux in the 17 nm width of the C2 band is 3.62 erg cm-2 s-1. The 3 upper limit on the number of molecules projected within the 7.4″ 1.0″ spectroscopic slit assuming that the coma is optically thin is
| (6) |
where is the fluorescence efficiency factor of the spectral band at where = 2.2 erg s-1 radical-1 (A’Hearn, 1982) which results in 1.27 molecules.
We apply the assumptions of the Haser model (Haser, 1957) to determine a coarse 3 upper limit on the production rate of . The Haser model uses two length scales, the ”parent” molecule species length scale, , and the ”daughter” molecule species length scale, , to describe the distribution of the radicals. For at a of 4.594 au, =5.3 km and =2.5 km (Cochran, 1985). In addition, we assume the speed of the molecular gas is 0.5 km/s which is used to determine the residence time of the molecules in the projected slit (Combi et al., 2004). Using these assumptions with the Haser model we find the 3 upper limit to the gas production rate 7.5 mol/s which is a similar limit compared to the measured of other Solar System Comets at similar heliocentric distances (Feldman et al., 2004) and to the results of Licandro et al. (2020). Scaling our measured spectroscopic upper limit on the gas production rate to a OH gas production rate using the median ratio of to hydroxyl production rate for Solar System comets (A’Hearn et al., 1995) results in an estimated spectroscopic upper limit to 2.4 mol/s and an mass loss rate in water of 80 kg/s.
3.5 Orbital evolution
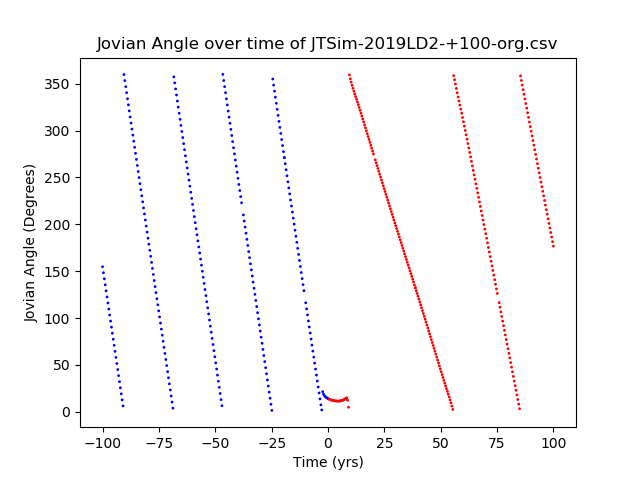
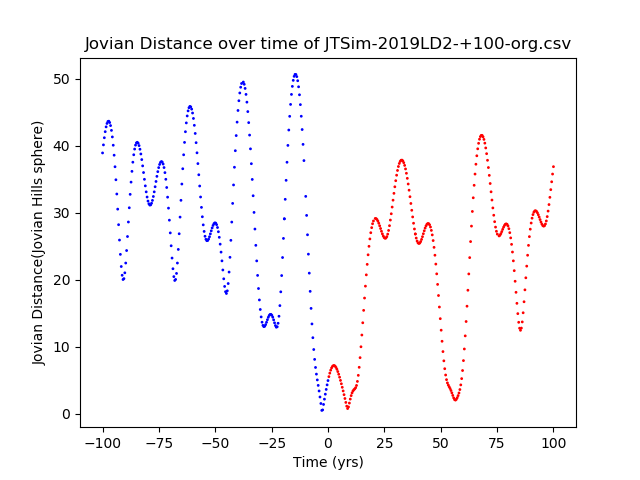
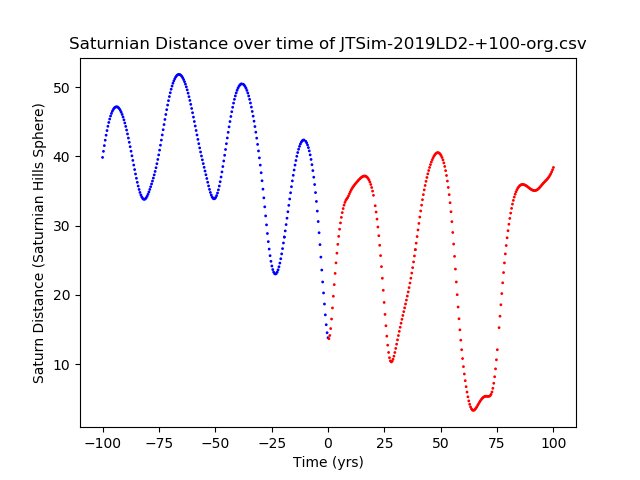
In order to investigate the long-term dynamics of 2019 LD2, we simulated 27,000 clones of its orbit. The clone set is created by using 1,000 three-dimentional locations using the positional uncertainties. The velocity uncertainties are accounted for by creating 27 clones in the three-dimensional velocity space at each positional location for a total of 27,000 clones. Orbital six-vectors were generated with uncertainties from the JPL Horizons Orbit Solution dated 2020 May 20 00:43:28 and set for the 2019 September 15 00:00 UTC epoch. In addition, we use the major gravitational components of the Solar system (Sun, Venus, Earth, Mars, Jupiter, Saturn, Uranus and Neptune.). The simulations were conducted using REBOUND (Rein & Liu, 2012) with the hybrid MERCURIUS integrator (Rein et al., 2019). We ran two sets of integrations, a short-term set, integrated for 100 years, and a long-term set for years. For each simulation set, we use a time-step size of 0.025 years. For the long-term integrations, we output every 1,000 years and analyze the time at which the clones escape the Solar System (distance from Sun larger than 1000 au).
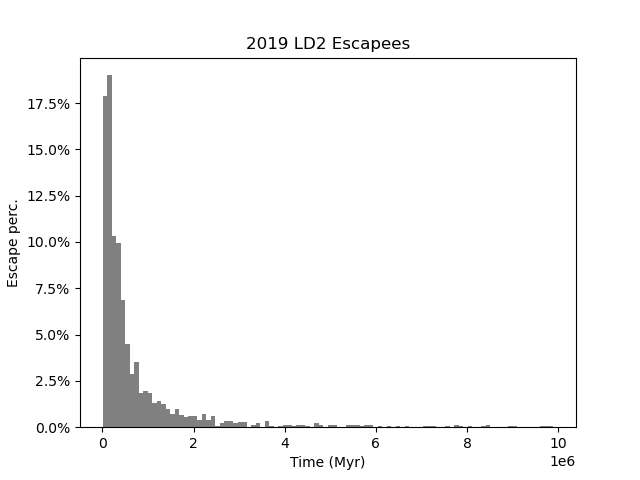
The short-term integrations replicate the previous work of Steckloff et al. (2020) and Hsieh et al. (2021). In the simulations, we find that the clones entered the Jovian region approximately 2.37 years ago, and are ejected from the region 8.70 years in the future (See top left panel of Fig. 8 for a clone example). As was found previously, 2019 LD2 transitions from a Centaur, with an approximate semi-major axis of 8.6 au to a Jupiter family comet with a semi-major axis of 6.2 au, spending 11.0712 years in the Jovian region (semi-major axis 5.2 au). In the long-term simulations ( years) we find that half of the clones escape the Solar System in 3.4 years and 78.8 of the clones escape the Solar system within the first years as seen in the bottom-right panel of Fig. 8. After 3.8 Myrs, 95 of the P/2019 LD2 clones have escaped.
4 Discussion and Conclusions
From our observations spanning multiple observatories, transitioning comet P/2019 LD2 exhibits interesting features in comparison with other short period Solar System comets. P/2019 LD2 has a higher value of of 85-200 cm (A’Hearn et al., 1995) at a helio-centric distance between 4.7 and 4.6 au compared to other short period comets at a similar helio-centric distance (Kelley et al., 2013; Ivanova et al., 2014; Bauer et al., 2015) and a km-scale nucleus (Fernández et al., 2013) as well as reddish to neutral color properties (Jewitt, 2015). The comet’s morphology when observed over multiple epochs since 2019 April exhibits the presence of a tail suggesting sustained activity versus an impulsive event. In addition, P/2019 LD2 has a moderate upper limit for the production of CO/CO2 of 1027 mol/s and 1026 mol/s, respectively, based on our Spitzer observations taken in 2020 January. It is also very active when compared to 29P (although 29P is located at a slightly farther heliocentric distance of 6 au) on a per unit surface area basis (150cm/(1.8 km)250 cm/km2 for P/2019 LD2) vs (1000 cm /(30.5 km)21 cm/km2 for for 29P, Ivanova et al., 2011), using the latest value for SW1’s size from Schambeau et al. (2019). But this activity seems to produce quite large (100 m) reddish dust particles containing copious amounts of water ice according to our work and that of Kareta et al. (2020b).
In addition to the morphology of the comet indicating sustained activity, photometry of the comet observed between 2019 April and 2019 November by ZTF is consistent with the activity steadily increasing since late 2018 up through the end of 2019 and into 2020 as the comet nears its perihelion on 2020 April 10 UTC. The length of the tail in deep HST imaging as well as our inferred start of activity date of late 2018 implies that the coma consists of 100 m-scale dust ejected at a relatively low velocity of 1 m/s. Although this is roughly consistent with the escape speed of a non-rotating comet nucleus of radius 1.8 km as inferred by our observations, it is unlikely that the dust is being ejected exclusively by rotational mass shedding suggested by the low ejection velocity (e.g. Ye et al., 2019; Lin et al., 2020). Rather, the increased activity of the comet as it nears perihelion suggest that dust is being transported by the sublimation, or that the activity is a product of both the sublimation of volatiles and rotational mass shedding.
The size of the active region on P/2019 LD2 of 0.4 km2 is too large to explain the low ejection velocity of the dust as for other comets with low dust ejection velocities whose activity is driven by the sublimation of volatiles (Jewitt et al., 2014). Subsequent observations of P/2019 LD2 to determine the rotation state of the comet will be necessary to understand if it is rotating near its critical rotation limit indicating the role of rotational mass shedding in its activity or if the comet has the possibility of becoming rotationally disrupted in the near future or if it has disrupted in the recent past (Moreno et al., 2017; Vokrouhlický et al., 2017). Given the 4-5 au location of the comet during its recent epoch of activity, the distance at which water ice begins to sublimate (Meech & Svoren, 2004), it is likely that the activity is being driven primarily by the sublimation of water ice. An additional possible mechanism may be the transformation of amorphous water ice into crystalline water as has been suggested before as an activity-driving mechanism for Centaurs (Jewitt, 2009). It is possible for other volatiles such as CO to partially drive the activity of P/2019 LD2 as seen in other distant comets (e.g., Bolin et al., 2020b) and 29P (Gunnarsson et al., 2008), however the lack of detection of the activity at large heliocentric distances (Schambeau et al., 2020) seems to suggest that hyper-volatiles are not the dominant drivers of the activity of P/2019 LD2. If the lack of hyper-volatiles driving the activity of P/2019 LD2 is confirmed, it may suggest that P/2019 LD2 has spent a significant amount of time as a Centaur within 15 au of the Sun (Horner et al., 2004) where these hyper-volatiles may have had a greater chance to become depleted compared to water ice which is non-volatile at that distance.
Additionally, some comets show evidence of a strong transition between H2O-driven and CO-driven activity at heliocentric distances past 3.5 au such as for comets 67P (Läuter et al., 2019) and Hale-Bopp (Biver et al., 1997). Our observation of the activity of P/2019 LD2 and its inferred H2O-driven activity at its heliocentric distance of 4.6 au at the time of our observations is seemingly at odds with the transition to CO-driven activity at larger heliocentric distances as observed for other comets. However, it has been shown that the shape and rotation pole orientation of comets can have a strong effect on the distance at which comet activity is driven by H2O. H2O-driven activity can increase at larger heliocentric distances for comet shapes and orientations deviating from a spherically-shaped comet rotating perpendicular to its orbital plane (Marshall et al., 2019). Therefore, the inferred H2O-driven activity of P/2019 LD2 at its large heliocentric distance of 4.6 au could be explained by it having a non-spherical shape and significant obliquity which has been shown to sustain H2O activity at these heliocentric distances in comet-activity models.
P/2019 LD2 is beginning to enter the region where water ice begins to appreciably sublimate at rates high enough so that a patch of pure water ice in the surface would disappear on year-long timescales (Lisse et al., 2020). The beginnings of mobilization of water ice for a weakly structured surface such as found on 67P (O’Rourke et al., 2020) could lead to the slow flaking off of large chunks of the loosest, weakest material that had never felt such stresses before. In this scenario gas will evolve at low levels in order to drive dust off the object. The material driven off should be water ice rich, as this ice is the last, most refractory ice expected in a cometary body before it is totally volatile ice depleted. We then may expect to see P/2019 LD2’s activity modulated by its motion towards/away from the Sun over an orbit similar to how the activity of Main Belt Comets are modulated as they travel inside/outside the 2.5 au water “ice line” where water ice boils furiously into vacuum (Hsieh et al., 2015a, b), P/2019 LD2’s activity could be modulated by its traversing the water ice turn on line of activity. Future monitoring observations over the next years will determine if this is the case, as is suggested by the smoothly increasing towards perihelion values we find for P/2019 LD2, they do not appear to be describing an impulsive outburst.
In our long-term simulations ( years), we show the temporary nature of 2019 LD2. Up to 78.8 of our orbital clones escape in the first years. The half-life of the clones is approximately 3.4 years. This is an order of magnitude smaller than the mean half-life of Centaurs ( years Horner et al., 2004) and more comparable to lifetimes of Jupiter Family group comets of years (Levison & Duncan, 1994).
Without a robust assessment of survey selection effects (e.g., Jedicke et al., 2016; Boe et al., 2019) it is difficult to assess the true population of comets in a temporary co-orbital configuration with Jupiter and transitioning between the Centaur and Jupiter family comet populations (Sarid et al., 2019). However, we can use our estimated size of P/2019 LD2 in comparison with the population estimates of Centaurs in the transition region (Steckloff et al., 2020). Steckloff et al. (2020) predict that there are 40-1,000 objects in the transition region with radius 1-3 km with fewer if cometary fading is considered in the population estimate (Brasser & Wang, 2015). Using these transition object population estimates and our estimate of the radius of P/2019 LD2 of 1.8 km suggests there are 100 objects the size of P/2019 LD2 in the transition region at any given time. Additional monitoring of P/2019 LD2 and objects like it in the gateway region will be required to understand their activity drivers and population.
consortium). Funding for the DPAC has been provided by national institutions, in particular the institutions participating in the Gaia Multilateral Agreement. Hubble Space Telescope, Spitzer Space Telescope, Keck I Telescope, P48 Oschin Schmidt telescope/Zwicky Transient Facility, Apache Point Astrophysical Research Consortium 3.5 m telescope, Liverpool Telescope, Lulin Optical Telescope, Mount Laguna Observatory 40-inch Telescope
References
- A’Hearn (1982) A’Hearn, M. F. 1982, in IAU Colloq. 61: Comet Discoveries, Statistics, and Observational Selection, ed. L. L. Wilkening, 433–460
- A’Hearn et al. (1995) A’Hearn, M. F., Millis, R. C., Schleicher, D. O., Osip, D. J., & Birch, P. V. 1995, Icarus, 118, 223, doi: 10.1006/icar.1995.1190
- A’Hearn et al. (1984) A’Hearn, M. F., Schleicher, D. G., Millis, R. L., Feldman, P. D., & Thompson, D. T. 1984, AJ, 89, 579, doi: 10.1086/113552
- Bauer et al. (2013) Bauer, J. M., Grav, T., Blauvelt, E., et al. 2013, ApJ, 773, 22, doi: 10.1088/0004-637X/773/1/22
- Bauer et al. (2015) Bauer, J. M., Stevenson, R., Kramer, E., et al. 2015, ApJ, 814, 85, doi: 10.1088/0004-637X/814/2/85
- Bellm et al. (2019) Bellm, E. C., Kulkarni, S. R., Graham, M. J., et al. 2019, 131, 018002, doi: 10.1088/1538-3873/aaecbe
- Biver et al. (1997) Biver, N., Bockelée-Morvan, D., Colom, P., et al. 1997, Earth Moon and Planets, 78, 5, doi: 10.1023/A:1006229818484
- Boe et al. (2019) Boe, B., Jedicke, R., Meech, K. J., et al. 2019, Icarus, 333, 252, doi: 10.1016/j.icarus.2019.05.034
- Bohren & Huffman (1983) Bohren, C. F., & Huffman, D. R. 1983, Absorption and scattering of light by small particles
- Bolin et al. (2019) Bolin, B., Fernandez, Y., Bauer, J., Helou, G., & Lisse, C. 2019, Spitzer investigation of the first known active Trojan, 2019 LD2, Spitzer Proposal
- Bolin et al. (2020a) Bolin, B. T., Bodewits, D., Fernandez, Y., & Lisse, C. M. 2020a, Determining the cause of activity of the first active Trojan, 2019 LD2, HST Proposal
- Bolin & Lisse (2020) Bolin, B. T., & Lisse, C. M. 2020, MNRAS, 497, 4031, doi: 10.1093/mnras/staa2192
- Bolin et al. (2018) Bolin, B. T., Weaver, H. A., Fernandez, Y. R., et al. 2018, ApJ, 852, L2, doi: 10.3847/2041-8213/aaa0c9
- Bolin et al. (2020b) Bolin, B. T., Lisse, C. M., Kasliwal, M. M., et al. 2020b, AJ, 160, 26, doi: 10.3847/1538-3881/ab9305
- Brasser & Wang (2015) Brasser, R., & Wang, J. H. 2015, A&A, 573, A102, doi: 10.1051/0004-6361/201423687
- Burns et al. (1979) Burns, J. A., Lamy, P. L., & Soter, S. 1979, Icarus, 40, 1, doi: 10.1016/0019-1035(79)90050-2
- Chandler et al. (2020) Chandler, C. O., Kueny, J. K., Trujillo, C. A., Trilling, D. E., & Oldroyd, W. J. 2020, ApJ, 892, L38, doi: 10.3847/2041-8213/ab7dc6
- Cochran (1985) Cochran, A. L. 1985, AJ, 90, 2609, doi: 10.1086/113966
- Combi et al. (2004) Combi, M. R., Harris, W. M., & Smyth, W. H. 2004, Gas dynamics and kinetics in the cometary coma: theory and observations, ed. M. C. Festou, H. U. Keller, & H. A. Weaver, 523
- De Sanctis et al. (2000) De Sanctis, M. C., Capria, M. T., Coradini, A., & Orosei, R. 2000, AJ, 120, 1571, doi: 10.1086/301512
- DeMeo & Carry (2013) DeMeo, F. E., & Carry, B. 2013, Icarus, 226, 723, doi: 10.1016/j.icarus.2013.06.027
- Deustua et al. (2017) Deustua, S. E., Mack, J., Bajaj, V., & Khandrika, H. 2017, WFC3/UVIS Updated 2017 Chip-Dependent Inverse Sensitivity Values, Tech. rep.
- Dones et al. (2015) Dones, L., Brasser, R., Kaib, N., & Rickman, H. 2015, Space Sci. Rev., 197, 191, doi: 10.1007/s11214-015-0223-2
- Dressel (2012) Dressel, L. 2012, Wide Field Camera 3 Instrument Handbook for Cycle 21 v. 5.0
- Duncan et al. (2004) Duncan, M., Levison, H., & Dones, L. 2004, Dynamical evolution of ecliptic comets, ed. M. C. Festou, H. U. Keller, & H. A. Weaver, 193
- Farnham et al. (2000) Farnham, T. L., Schleicher, D. G., & A’Hearn, M. F. 2000, Icarus, 147, 180, doi: 10.1006/icar.2000.6420
- Fazio et al. (2004) Fazio, G. G., Hora, J. L., Allen, L. E., et al. 2004, ApJS, 154, 10, doi: 10.1086/422843
- Feldman et al. (2004) Feldman, P. D., Cochran, A. L., & Combi, M. R. 2004, Spectroscopic investigations of fragment species in the coma, ed. M. C. Festou, H. U. Keller, & H. A. Weaver, 425
- Fernández et al. (1999) Fernández, J. A., Tancredi, G., Rickman, H., & Licandro, J. 1999, A&A, 352, 327
- Fernández (2009) Fernández, Y. R. 2009, Planet. Space Sci., 57, 1218, doi: 10.1016/j.pss.2009.01.003
- Fernández et al. (2013) Fernández, Y. R., Kelley, M. S., Lamy, P. L., et al. 2013, Icarus, 226, 1138, doi: 10.1016/j.icarus.2013.07.021
- Fitzsimmons et al. (2020) Fitzsimmons, A., Young, D., Armstrong, J., Moss, S., & Sato, H. 2020, Minor Planet Electronic Circulars, 2020-K134, 1
- Gladman et al. (2008) Gladman, B., Marsden, B. G., & Vanlaerhoven, C. 2008, Nomenclature in the Outer Solar System, ed. M. A. Barucci, H. Boehnhardt, D. P. Cruikshank, A. Morbidelli, & R. Dotson, 43–57
- Graham et al. (2019) Graham, M. J., Kulkarni, S. R., Bellm, E. C., et al. 2019, PASP, 131, 078001, doi: 10.1088/1538-3873/ab006c
- Gunnarsson et al. (2008) Gunnarsson, M., Bockelée-Morvan, D., Biver, N., Crovisier, J., & Rickman, H. 2008, A&A, 484, 537, doi: 10.1051/0004-6361:20078069
- Hanuš et al. (2018) Hanuš, J., Delbo, M., Alí-Lagoa, V., et al. 2018, Icarus, 299, 84, doi: 10.1016/j.icarus.2017.07.007
- Haser (1957) Haser, L. 1957, Bulletin de la Societe Royale des Sciences de Liege, 43, 740
- Horner & Evans (2006) Horner, J., & Evans, N. W. 2006, MNRAS, 367, L20, doi: 10.1111/j.1745-3933.2006.00131.x
- Horner et al. (2004) Horner, J., Evans, N. W., & Bailey, M. E. 2004, Mon. Not. R. Astron. Soc., 354, 798, doi: 10.1111/j.1365-2966.2004.08240.x
- Horner et al. (2004) Horner, J., Evans, N. W., & Bailey, M. E. 2004, MNRAS, 355, 321, doi: 10.1111/j.1365-2966.2004.08342.x
- Horner & Lykawka (2012) Horner, J., & Lykawka, P. S. 2012, MNRAS, 426, 159, doi: 10.1111/j.1365-2966.2012.21717.x
- Hsieh et al. (2021) Hsieh, H. H., Fitzsimmons, A., Novaković, B., Denneau, L., & Heinze, A. N. 2021, Icarus, 354, 114019, doi: 10.1016/j.icarus.2020.114019
- Hsieh et al. (2015a) Hsieh, H. H., Denneau, L., Wainscoat, R. J., et al. 2015a, Icarus, 248, 289, doi: 10.1016/j.icarus.2014.10.031
- Hsieh et al. (2015b) Hsieh, H. H., Hainaut, O., Novaković, B., et al. 2015b, ApJ, 800, L16, doi: 10.1088/2041-8205/800/1/L16
- Huehnerhoff et al. (2016) Huehnerhoff, J., Ketzeback, W., Bradley, A., et al. 2016, in Proc. SPIE, Vol. 9908, Ground-based and Airborne Instrumentation for Astronomy VI, 99085H
- Ivanova et al. (2014) Ivanova, O., Borysenko, S., & Golovin, A. 2014, Icarus, 227, 202, doi: 10.1016/j.icarus.2013.08.026
- Ivanova et al. (2011) Ivanova, O. V., Skorov, Y. V., Korsun, P. P., Afanasiev, V. L., & Blum, J. 2011, Icarus, 211, 559, doi: 10.1016/j.icarus.2010.10.026
- Ivezić et al. (2001) Ivezić, Ž., Tabachnik, S., Rafikov, R., et al. 2001, AJ, 122, 2749, doi: 10.1086/323452
- Ivezić et al. (2002) Ivezić, Ž., Lupton, R. H., Jurić, M., et al. 2002, AJ, 124, 2943, doi: 10.1086/344077
- Jedicke et al. (2016) Jedicke, R., Bolin, B., Granvik, M., & Beshore, E. 2016, Icarus, 266, 173, doi: 10.1016/j.icarus.2015.10.021
- Jewitt (2015) Jewitt, D. 2015, AJ, 150, 201, doi: 10.1088/0004-6256/150/6/201
- Jewitt et al. (2015) Jewitt, D., Hsieh, H., & Agarwal, J. 2015, The Active Asteroids, ed. P. Michel, F. E. DeMeo, & W. F. Bottke, 221–241
- Jewitt et al. (2014) Jewitt, D., Ishiguro, M., Weaver, H., et al. 2014, AJ, 147, 117, doi: 10.1088/0004-6256/147/5/117
- Jewitt (2009) Jewitt, D. C. 2009, in European Planetary Science Congress 2009, 13
- Jewitt & Meech (1987) Jewitt, D. C., & Meech, K. J. 1987, ApJ, 317, 992, doi: 10.1086/165347
- Jordi et al. (2006) Jordi, K., Grebel, E. K., & Ammon, K. 2006, A&A, 460, 339, doi: 10.1051/0004-6361:20066082
- Jurić et al. (2002) Jurić, M., Ivezić, Ž., Lupton, R. H., et al. 2002, AJ, 124, 1776, doi: 10.1086/341950
- Kareta et al. (2020a) Kareta, T., Volk, K., Noonan, J. W., et al. 2020a, Research Notes of the American Astronomical Society, 4, 74, doi: 10.3847/2515-5172/ab963c
- Kareta et al. (2020b) Kareta, T., Woodney, L. M., Schambeau, C., et al. 2020b, arXiv e-prints, arXiv:2011.09993. https://arxiv.org/abs/2011.09993
- Kasliwal et al. (2019) Kasliwal, M. M., Cannella, C., Bagdasaryan, A., et al. 2019, PASP, 131, 038003, doi: 10.1088/1538-3873/aafbc2
- Kelley et al. (2013) Kelley, M. S., Fernández, Y. R., Licandro, J., et al. 2013, Icarus, 225, 475, doi: 10.1016/j.icarus.2013.04.012
- Kelley et al. (2019) Kelley, M. S. P., Bodewits, D., Ye, Q., et al. 2019, in Astronomical Society of the Pacific Conference Series, Vol. 523, Astronomical Data Analysis Software and Systems XXVII, ed. P. J. Teuben, M. W. Pound, B. A. Thomas, & E. M. Warner, 471
- Kinoshita et al. (2005) Kinoshita, D., Chen, C.-W., Lin, H.-C., et al. 2005, Chinese J. Astron. Astrophys., 5, 315, doi: 10.1088/1009-9271/5/3/011
- Krist et al. (2011) Krist, J. E., Hook, R. N., & Stoehr, F. 2011, in Society of Photo-Optical Instrumentation Engineers (SPIE) Conference Series, Vol. 8127, Optical Modeling and Performance Predictions V, 81270J
- Läuter et al. (2019) Läuter, M., Kramer, T., Rubin, M., & Altwegg, K. 2019, MNRAS, 483, 852, doi: 10.1093/mnras/sty3103
- Levison & Duncan (1994) Levison, H. F., & Duncan, M. J. 1994, Icarus, 108, 18, doi: 10.1006/icar.1994.1039
- Licandro et al. (2020) Licandro, J., Pinilla-Alonso, N., de Leon, J., et al. 2020, in AAS/Division for Planetary Sciences Meeting Abstracts, Vol. 52, AAS/Division for Planetary Sciences Meeting Abstracts, 404.06
- Lin et al. (2020) Lin, Z.-Y., Cheng, Y.-L., Vincent, J.-B., et al. 2020, PASJ, doi: 10.1093/pasj/psaa069
- Lisse et al. (2020) Lisse, C., Bauer, J., Cruikshank, D., et al. 2020, Nature Astronomy, 4, 930, doi: 10.1038/s41550-020-01219-6
- Lisse et al. (2019) Lisse, C. M., Young, L. A., Cruikshank, D., Sandford, S., & Schmitt, B. 2019, Submitted to Icarus
- Lisse et al. (2020) Lisse, C. M., Young, L. A., Cruikshank, D. P., et al. 2020, arXiv e-prints, arXiv:2009.02277. https://arxiv.org/abs/2009.02277
- Marshall et al. (2019) Marshall, D., Rezac, L., Hartogh, P., Zhao, Y., & Attree, N. 2019, A&A, 623, A120, doi: 10.1051/0004-6361/201833959
- Marzari et al. (2002) Marzari, F., Scholl, H., Murray, C., & Lagerkvist, C. 2002, Origin and Evolution of Trojan Asteroids, 725–738
- Masci et al. (2019) Masci, F. J., Laher, R. R., Rusholme, B., et al. 2019, PASP, 131, 018003, doi: 10.1088/1538-3873/aae8ac
- McCarthy et al. (1998) McCarthy, J. K., Cohen, J. G., Butcher, B., et al. 1998, Society of Photo-Optical Instrumentation Engineers (SPIE) Conference Series, Vol. 3355, Blue channel of the Keck low-resolution imaging spectrometer, ed. S. D’Odorico, 81–92
- McDonnell et al. (1986) McDonnell, J. A. M., Alexander, W. M., Burton, W. M., et al. 1986, Nature, 321, 338, doi: 10.1038/321338a0
- Meech & Svoren (2004) Meech, K. J., & Svoren, J. 2004, Using cometary activity to trace the physical and chemical evolution of cometary nuclei, ed. M. C. Festou, H. U. Keller, & H. A. Weaver, 317
- Mommert et al. (2019) Mommert, M., Kelley, M., de Val-Borro, M., et al. 2019, The Journal of Open Source Software, 4, 1426, doi: 10.21105/joss.01426
- Morbidelli et al. (2005) Morbidelli, A., Levison, H. F., Tsiganis, K., & Gomes, R. 2005, Nature, 435, 462, doi: 10.1038/nature03540
- Moreno et al. (2017) Moreno, F., Pozuelos, F. J., Novaković, B., et al. 2017, ApJ, 837, L3, doi: 10.3847/2041-8213/aa6036
- Murray & Dermott (1999) Murray, C. D., & Dermott, S. F. 1999, Solar system dynamics
- Nesvorný et al. (2018) Nesvorný, D., Parker, J., & Vokrouhlický, D. 2018, AJ, 155, 246, doi: 10.3847/1538-3881/aac01f
- Nesvorný et al. (2017) Nesvorný, D., Vokrouhlický, D., Dones, L., et al. 2017, ApJ, 845, 27, doi: 10.3847/1538-4357/aa7cf6
- Ofek (2012) Ofek, E. O. 2012, The Astrophysical Journal, 749, 10
- Oke et al. (1995) Oke, J. B., Cohen, J. G., Carr, M., et al. 1995, PASP, 107, 375, doi: 10.1086/133562
- O’Rourke et al. (2020) O’Rourke, L., Heinisch, P., Blum, J., et al. 2020, Nature, 586, 697, doi: 10.1038/s41586-020-2834-3
- Perley (2019) Perley, D. A. 2019, PASP, 131, 084503, doi: 10.1088/1538-3873/ab215d
- Reach et al. (2013) Reach, W. T., Kelley, M. S., & Vaubaillon, J. 2013, Icarus, 226, 777, doi: 10.1016/j.icarus.2013.06.011
- Rein & Liu (2012) Rein, H., & Liu, S.-F. 2012, Astron. Astrophys., 537, A128, doi: 10.1051/0004-6361/201118085
- Rein et al. (2019) Rein, H., Hernandez, D. M., Tamayo, D., et al. 2019, Mon. Not. R. Astron. Soc., 485, 5490, doi: 10.1093/mnras/stz769
- Roig & Nesvorný (2015) Roig, F., & Nesvorný, D. 2015, AJ, 150, 186, doi: 10.1088/0004-6256/150/6/186
- Sarid & Prialnik (2009) Sarid, G., & Prialnik, D. 2009, Meteoritics and Planetary Science, 44, 1905, doi: 10.1111/j.1945-5100.2009.tb02000.x
- Sarid et al. (2019) Sarid, G., Volk, K., Steckloff, J. K., et al. 2019, ApJ, 883, L25, doi: 10.3847/2041-8213/ab3fb3
- Sato et al. (2020) Sato, H., Heinze, A., & Nakano, S. 2020, Central Bureau Electronic Telegrams, 4780, 1
- Schambeau et al. (2020) Schambeau, C., Fernandez, Y., Belton, R., et al. 2020, Central Bureau Electronic Telegrams, 4821, 1
- Schambeau et al. (2019) Schambeau, C. A., Fernández, Y. R., Samarasinha, N. H., Woodney, L. M., & Kundu, A. 2019, AJ, 158, 259, doi: 10.3847/1538-3881/ab53e2
- Schleicher & Bair (2011) Schleicher, D. G., & Bair, A. N. 2011, AJ, 141, 177, doi: 10.1088/0004-6256/141/6/177
- Smith & Nelson (1969) Smith, C. E., & Nelson, B. 1969, PASP, 81, 74, doi: 10.1086/128742
- Solontoi et al. (2012) Solontoi, M., Ivezić, Ž., Jurić, M., et al. 2012, Icarus, 218, 571, doi: 10.1016/j.icarus.2011.10.008
- Steckloff et al. (2020) Steckloff, J. K., Sarid, G., Volk, K., et al. 2020, ApJ, 904, L20, doi: 10.3847/2041-8213/abc888
- Steele et al. (2004) Steele, I. A., Smith, R. J., Rees, P. C. T., et al. 2004, in SPIE Astronomical Telescopes + Instrumentation
- Tonry (2011) Tonry, J. L. 2011, PASP, 123, 58, doi: 10.1086/657997
- Vokrouhlický et al. (2019) Vokrouhlický, D., Nesvorný, D., & Dones, L. 2019, AJ, 157, 181, doi: 10.3847/1538-3881/ab13aa
- Vokrouhlický et al. (2017) Vokrouhlický, D., Pravec, P., Durech, J., et al. 2017, A&A, 598, A91, doi: 10.1051/0004-6361/201629670
- Werner et al. (2004) Werner, M. W., Roellig, T. L., Low, F. J., et al. 2004, ApJS, 154, 1, doi: 10.1086/422992
- Ye et al. (2019) Ye, Q., Kelley, M. S. P., Bodewits, D., et al. 2019, ApJ, 874, L16, doi: 10.3847/2041-8213/ab0f3c
| Date1 | Facility2 | Filter3 | |||||||
|---|---|---|---|---|---|---|---|---|---|
| UTC | () | (au) | (au) | (∘) | (∘) | (days) | |||
| 2019 Apr 26 | ZTF111Serendipitous observation of P/2019 LD2 with ZTF, but included in this table because of its inclusion in the top-left panel of Fig. 1. | 2.17 | 1.76 | 4.693 | 4.147 | 10.99 | -1.56 | -343.97 | |
| 2019 Sep 07 | ARC | , | 1.4 | 1.81 | 4.622 | 4.279 | 12.23 | -0.74 | -216.58 |
| 2020 Jan 25-26 | Spitzer | 4.5 m | 4.584 | 4.256222Spitzer-centric | 12.61II | 0.23II | -76.58 | ||
| 2020 Apr 01 | HST | F350LP | 4.578 | 5.023 | 10.71 | -0.44 | -9.58 | ||
| 2020 May 27 | MLO 1.0-m | ,, | 1.92 | 1.49 | 4.580 | 4.221 | 12.38 | -2.50 | 46.42 |
| 2020 May 29 | LT | ,,, | 1.21 | 1.75 | 4.580 | 4.193 | 12.27 | -2.56 | 48.42 |
| 2020 June 23-27 | LOT | ,, | 1.47 | 1.14 | 4.583 | 3.848 | 9.59 | -3.00 | 75.42 |
| 2020 July 10 | LOT | ,, | 1.45 | 1.15 | 4.586 | 3.707 | 7.11 | -2.97 | 90.42 |
| 2020 Aug 19 | Keck I | Sp.333https://www2.keck.hawaii.edu/inst/lris/filters.html | 0.85 | 1.80 | 4.594 | 3.608 | 3.20 | -1.76 | 130.42 |
| Date1 | filter6 | mag7 | 11 | C12 | |||||||
|---|---|---|---|---|---|---|---|---|---|---|---|
| UTC | (au) | (au) | (∘) | (days) | () | (cm) | (km2) | ||||
| 2019 Apr 09 - 10:32 | 4.704 | 4.391 | 12.0 | -360.20 | 19.33 | 0.15 | 2.36 | 1.72 | 85.28 | 127.69 | |
| 2019 Apr 12 - 10:32 | 4.702 | 4.345 | 11.9 | -357.32 | 19.27 | 0.16 | 2.83 | 1.66 | 87.90 | 131.53 | |
| 2019 Apr 15 - 09:59 | 4.700 | 4.300 | 11.7 | -354.47 | 19.13 | 0.15 | 1.82 | 2.02 | 97.23 | 145.35 | |
| 2019 Apr 20 - 09:33 | 4.697 | 4.227 | 11.4 | -349.70 | 18.97 | 0.23 | 1.87 | 1.83 | 107.69 | 160.77 | |
| 2019 Apr 20 - 10:04 | 4.697 | 4.226 | 11.4 | -349.68 | 18.83 | 0.23 | 2.44 | 1.51 | 122.45 | 182.81 | |
| 2019 Apr 26 - 09:00 | 4.693 | 4.142 | 11.0 | -343.97 | 19.69 | 0.14 | 2.14 | 1.91 | 83.20 | 124.00 | |
| 2019 Apr 26 - 09:07 | 4.693 | 4.142 | 11.0 | -343.96 | 19.38 | 0.13 | 2.18 | 2.12 | 110.69 | 164.97 | |
| 2019 Apr 26 - 11:26 | 4.693 | 4.141 | 11.0 | -343.87 | 18.89 | 0.07 | 1.90 | 1.41 | 109.63 | 163.38 | |
| 2019 Apr 26 - 11:36 | 4.693 | 4.141 | 11.0 | -343.86 | 19.18 | 0.07 | 1.68 | 1.37 | 83.93 | 125.08 | |
| 2019 May 02 - 10:03 | 4.689 | 4.061 | 10.4 | -338.17 | 18.95 | 0.11 | 2.47 | 1.56 | 97.64 | 145.18 | |
| 2019 May 02 - 10:32 | 4.689 | 4.061 | 10.4 | -338.15 | 18.99 | 0.09 | 1.82 | 1.41 | 94.11 | 139.93 | |
| 2019 May 31 - 08:22 | 4.672 | 3.763 | 6.1 | -310.33 | 18.76 | 0.07 | 1.60 | 1.44 | 85.34 | 125.82 | |
| 2019 May 31 - 10:34 | 4.672 | 3.762 | 6.1 | -310.24 | 18.96 | 0.07 | 1.79 | 1.44 | 112.44 | 165.78 | |
| 2019 Jun 01 - 09:04 | 4.671 | 3.755 | 6.0 | -309.33 | 18.57 | 0.05 | 1.78 | 1.38 | 100.81 | 148.64 | |
| 2019 Jun 02 - 09:34 | 4.671 | 3.748 | 5.8 | -308.35 | 18.49 | 0.07 | 2.53 | 1.37 | 107.32 | 158.24 | |
| 2019 Jun 02 - 10:57 | 4.671 | 3.748 | 5.8 | -308.29 | 18.95 | 0.08 | 1.93 | 1.52 | 111.35 | 164.18 | |
| 2019 Jun 03 - 11:33 | 4.670 | 3.741 | 5.6 | -307.30 | 18.52 | 0.18 | 1.99 | 1.71 | 163.56 | 241.16 | |
| 2019 Jun 04 - 07:01 | 4.670 | 3.736 | 5.5 | -306.52 | 18.06 | 0.06 | 2.07 | 1.67 | 156.64 | 230.96 | |
| 2019 Jun 04 - 08:31 | 4.670 | 3.736 | 5.5 | -306.46 | 18.68 | 0.09 | 2.55 | 1.40 | 140.25 | 206.79 | |
| 2019 Jun 06 - 06:37 | 4.668 | 3.725 | 5.1 | -304.60 | 18.36 | 0.08 | 1.99 | 1.77 | 116.28 | 171.48 | |
| 2019 Jun 06 - 08:33 | 4.668 | 3.724 | 5.1 | -304.53 | 18.63 | 0.09 | 2.11 | 1.39 | 143.63 | 211.82 | |
| 2019 Jun 07 - 09:33 | 4.668 | 3.719 | 4.9 | -303.52 | 18.14 | 0.06 | 1.87 | 1.39 | 140.87 | 207.78 | |
| 2019 Jun 08 - 06:36 | 4.667 | 3.714 | 4.8 | -302.67 | 18.57 | 0.09 | 1.90 | 1.73 | 94.15 | 138.88 | |
| 2019 Jun 08 - 09:12 | 4.667 | 3.713 | 4.8 | -302.57 | 18.56 | 0.08 | 2.07 | 1.37 | 150.52 | 222.03 | |
| 2019 Jun 09 - 06:36 | 4.667 | 3.709 | 4.6 | -301.71 | 18.38 | 0.06 | 1.89 | 1.70 | 111.02 | 163.79 | |
| 2019 Jun 10 - 07:02 | 4.666 | 3.704 | 4.5 | -300.72 | 18.34 | 0.06 | 1.90 | 1.56 | 114.39 | 168.78 | |
| 2019 Jun 10 - 08:03 | 4.666 | 3.704 | 4.5 | -300.68 | 18.70 | 0.10 | 2.27 | 1.40 | 130.13 | 192.01 | |
| 2019 Jun 11 - 09:43 | 4.666 | 3.699 | 4.3 | -299.65 | 18.90 | 0.10 | 1.93 | 1.42 | 107.13 | 158.11 | |
| 2019 Jun 14 - 08:02 | 4.664 | 3.688 | 3.9 | -296.81 | 18.74 | 0.22 | 2.03 | 1.38 | 121.43 | 179.30 | |
| 2019 Jun 20 - 07:50 | 4.661 | 3.673 | 3.3 | -291.02 | 18.61 | 0.22 | 2.51 | 1.38 | 132.47 | 195.84 | |
| 2019 Jun 20 - 08:17 | 4.661 | 3.673 | 3.3 | -291.00 | 18.15 | 0.10 | 1.97 | 1.37 | 127.68 | 188.75 | |
| 2019 Jun 23 - 09:02 | 4.659 | 3.669 | 3.2 | -288.07 | 18.23 | 0.08 | 2.41 | 1.43 | 117.79 | 174.17 | |
| 2019 Jun 23 - 10:34 | 4.659 | 3.669 | 3.2 | -288.00 | 18.77 | 0.18 | 2.57 | 1.84 | 113.53 | 167.87 | |
| 2019 Jun 26 - 07:37 | 4.657 | 3.667 | 3.2 | -285.22 | 18.21 | 0.05 | 1.87 | 1.37 | 119.75 | 177.06 | |
| 2019 Jun 26 - 08:02 | 4.657 | 3.667 | 3.2 | -285.20 | 18.80 | 0.08 | 2.19 | 1.38 | 110.22 | 162.98 | |
| 2019 Jul 01 - 06:45 | 4.655 | 3.671 | 3.5 | -280.41 | 18.33 | 0.05 | 1.84 | 1.40 | 108.62 | 160.51 | |
| 2019 Jul 01 - 06:46 | 4.655 | 3.671 | 3.5 | -280.41 | 18.33 | 0.05 | 1.77 | 1.39 | 108.62 | 160.51 | |
| 2019 Jul 01 - 07:44 | 4.655 | 3.671 | 3.5 | -280.37 | 18.34 | 0.06 | 2.37 | 1.38 | 107.63 | 159.04 | |
| 2019 Jul 01 - 07:44 | 4.655 | 3.671 | 3.5 | -280.37 | 18.34 | 0.06 | 2.18 | 1.38 | 107.63 | 159.04 | |
| 2019 Jul 03 - 07:10 | 4.654 | 3.674 | 3.8 | -278.45 | 18.17 | 0.05 | 2.31 | 1.37 | 127.49 | 188.29 | |
| 2019 Jul 03 - 07:32 | 4.654 | 3.674 | 3.8 | -278.44 | 18.58 | 0.07 | 2.14 | 1.37 | 138.51 | 204.56 | |
| 2019 Jul 04 - 07:36 | 4.653 | 3.676 | 3.9 | -277.46 | 18.09 | 0.05 | 2.04 | 1.38 | 137.86 | 203.57 | |
| 2019 Jul 06 - 06:43 | 4.652 | 3.681 | 4.2 | -275.56 | 18.74 | 0.09 | 1.92 | 1.38 | 121.73 | 179.68 | |
| 2019 Jul 08 - 07:32 | 4.651 | 3.687 | 4.5 | -273.59 | 18.48 | 0.07 | 1.92 | 1.39 | 156.89 | 231.49 | |
| 2019 Jul 09 - 05:29 | 4.651 | 3.690 | 4.6 | -272.70 | 18.13 | 0.04 | 1.58 | 1.48 | 137.39 | 202.69 | |
| 2019 Jul 09 - 07:36 | 4.651 | 3.690 | 4.6 | -272.61 | 18.61 | 0.07 | 1.84 | 1.40 | 139.94 | 206.46 | |
| 2019 Jul 10 - 06:01 | 4.650 | 3.694 | 4.8 | -271.71 | 18.21 | 0.06 | 2.02 | 1.41 | 128.82 | 190.02 | |
| 2019 Jul 10 - 06:02 | 4.650 | 3.694 | 4.8 | -271.71 | 18.06 | 0.06 | 2.30 | 1.41 | 147.90 | 218.17 | |
| 2019 Jul 10 - 06:13 | 4.650 | 3.694 | 4.8 | -271.70 | 18.27 | 0.06 | 1.96 | 1.39 | 121.89 | 179.80 | |
| 2019 Jul 10 - 06:31 | 4.650 | 3.694 | 4.8 | -271.69 | 18.20 | 0.07 | 2.44 | 1.38 | 130.01 | 191.77 | |
| 2019 Jul 10 - 06:41 | 4.650 | 3.694 | 4.8 | -271.68 | 18.15 | 0.05 | 2.04 | 1.37 | 136.14 | 200.81 | |
| 2019 Jul 10 - 06:42 | 4.650 | 3.694 | 4.8 | -271.68 | 18.18 | 0.06 | 2.14 | 1.37 | 132.43 | 195.34 | |
| 2019 Jul 11 - 07:29 | 4.649 | 3.698 | 4.9 | -270.68 | 18.70 | 0.13 | 1.90 | 1.40 | 130.73 | 192.82 | |
| 2019 Jul 12 - 06:32 | 4.649 | 3.702 | 5.1 | -269.74 | 18.23 | 0.11 | 2.46 | 1.37 | 128.40 | 189.36 | |
| 2019 Jul 12 - 06:33 | 4.649 | 3.702 | 5.1 | -269.74 | 18.25 | 0.10 | 2.35 | 1.37 | 126.06 | 185.90 | |
| 2019 Jul 12 - 07:24 | 4.649 | 3.702 | 5.1 | -269.71 | 18.53 | 0.15 | 2.01 | 1.40 | 154.37 | 227.66 | |
| 2019 Jul 13 - 06:03 | 4.648 | 3.706 | 5.3 | -268.79 | 18.12 | 0.10 | 2.49 | 1.39 | 143.40 | 211.46 | |
| 2019 Jul 13 - 07:51 | 4.648 | 3.707 | 5.3 | -268.72 | 18.80 | 0.24 | 1.69 | 1.45 | 121.56 | 179.25 | |
| 2019 Jul 16 - 05:21 | 4.647 | 3.721 | 5.8 | -265.91 | 18.57 | 0.28 | 2.10 | 1.39 | 154.15 | 227.28 | |
| 2019 Jul 16 - 06:32 | 4.647 | 3.721 | 5.8 | -265.86 | 18.26 | 0.16 | 1.92 | 1.39 | 129.40 | 190.79 | |
| 2019 Jul 20 - 06:54 | 4.645 | 3.745 | 6.5 | -261.96 | 18.65 | 0.16 | 2.67 | 1.45 | 148.69 | 219.26 | |
| 2019 Jul 21 - 05:12 | 4.645 | 3.751 | 6.6 | -261.05 | 18.22 | 0.04 | 1.52 | 1.38 | 140.36 | 206.99 | |
| 2019 Jul 21 - 05:13 | 4.645 | 3.751 | 6.6 | -261.05 | 18.18 | 0.04 | 1.58 | 1.38 | 145.63 | 214.76 | |
| 2019 Jul 21 - 05:43 | 4.644 | 3.751 | 6.6 | -261.03 | 18.17 | 0.05 | 1.44 | 1.37 | 146.91 | 216.66 | |
| 2019 Jul 21 - 06:07 | 4.644 | 3.751 | 6.7 | -261.01 | 18.34 | 0.05 | 1.46 | 1.38 | 126.07 | 185.94 | |
| 2019 Jul 21 - 06:44 | 4.644 | 3.752 | 6.7 | -260.99 | 18.35 | 0.09 | 2.67 | 1.43 | 124.98 | 184.33 | |
| 2019 Jul 21 - 06:44 | 4.644 | 3.752 | 6.7 | -260.99 | 18.31 | 0.08 | 2.71 | 1.44 | 129.68 | 191.25 | |
| 2019 Jul 30 - 06:02 | 4.640 | 3.820 | 8.2 | -252.26 | 18.21 | 0.05 | 1.85 | 1.42 | 155.19 | 229.33 | |
| 2019 Jul 30 - 06:03 | 4.640 | 3.820 | 8.2 | -252.26 | 18.20 | 0.04 | 1.70 | 1.42 | 156.63 | 231.45 | |
| 2019 Jul 30 - 06:29 | 4.640 | 3.820 | 8.2 | -252.24 | 18.27 | 0.05 | 1.92 | 1.49 | 146.85 | 217.00 | |
| 2019 Jul 30 - 06:30 | 4.640 | 3.820 | 8.2 | -252.24 | 18.30 | 0.05 | 1.82 | 1.49 | 142.85 | 211.08 | |
| 2019 Aug 03 - 04:02 | 4.638 | 3.856 | 8.8 | -248.45 | 18.31 | 0.10 | 1.65 | 1.40 | 147.13 | 217.68 | |
| 2019 Aug 12 - 03:38 | 4.634 | 3.949 | 10.0 | -239.69 | 18.11 | 0.16 | 3.23 | 1.39 | 192.88 | 286.40 | |
| 2019 Aug 16 - 07:30 | 4.632 | 3.996 | 10.5 | -235.63 | 18.34 | 0.16 | 1.83 | 1.78 | 162.34 | 241.48 | |
| 2019 Aug 19 - 03:27 | 4.631 | 4.030 | 10.8 | -232.87 | 18.33 | 0.09 | 1.41 | 1.38 | 168.23 | 250.52 | |
| 2019 Aug 23 - 04:03 | 4.629 | 4.080 | 11.2 | -228.94 | 18.73 | 0.09 | 1.80 | 1.39 | 191.39 | 285.49 | |
| 2019 Aug 28 - 04:52 | 4.627 | 4.145 | 11.6 | -224.02 | 18.34 | 0.06 | 1.73 | 1.54 | 180.68 | 269.98 | |
| 2019 Aug 28 - 04:53 | 4.627 | 4.145 | 11.6 | -224.02 | 18.37 | 0.06 | 1.78 | 1.54 | 175.75 | 262.63 | |
| 2019 Aug 28 - 05:28 | 4.627 | 4.146 | 11.6 | -223.99 | 18.43 | 0.06 | 1.56 | 1.71 | 166.38 | 248.63 | |
| 2019 Aug 28 - 05:29 | 4.627 | 4.146 | 11.6 | -223.99 | 18.51 | 0.06 | 1.68 | 1.72 | 154.56 | 230.97 | |
| 2019 Aug 29 - 04:45 | 4.627 | 4.159 | 11.7 | -223.05 | 18.37 | 0.06 | 2.22 | 1.53 | 177.51 | 265.38 | |
| 2019 Aug 29 - 04:46 | 4.627 | 4.159 | 11.7 | -223.05 | 18.43 | 0.07 | 2.42 | 1.53 | 167.97 | 251.11 | |
| 2019 Aug 29 - 05:46 | 4.627 | 4.159 | 11.7 | -223.00 | 18.37 | 0.06 | 1.60 | 1.86 | 177.51 | 265.38 | |
| 2019 Aug 29 - 05:46 | 4.627 | 4.159 | 11.7 | -223.00 | 18.38 | 0.06 | 1.62 | 1.87 | 175.88 | 262.95 | |
| 2019 Aug 29 - 06:13 | 4.627 | 4.159 | 11.7 | -222.99 | 18.85 | 0.14 | 1.96 | 2.13 | 180.81 | 270.31 | |
| 2019 Sep 02 - 03:50 | 4.625 | 4.212 | 12.0 | -219.17 | 18.94 | 0.11 | 1.84 | 1.43 | 172.19 | 257.81 | |
| 2019 Sep 02 - 05:06 | 4.625 | 4.213 | 12.0 | -219.12 | 18.56 | 0.09 | 2.20 | 1.70 | 154.25 | 230.94 | |
| 2019 Sep 03 - 03:40 | 4.624 | 4.226 | 12.0 | -218.20 | 18.73 | 0.14 | 1.85 | 1.41 | 210.23 | 314.76 | |
| 2019 Sep 09 - 03:04 | 4.622 | 4.309 | 12.3 | -212.35 | 18.97 | 0.26 | 1.95 | 1.40 | 176.75 | 265.04 | |
| 2019 Sep 09 - 05:38 | 4.622 | 4.311 | 12.3 | -212.25 | 18.65 | 0.22 | 2.84 | 2.23 | 149.88 | 224.75 | |
| 2019 Sep 25 - 03:09 | 4.616 | 4.540 | 12.5 | -196.68 | 18.61 | 0.12 | 4.13 | 1.57 | 173.11 | 259.86 | |
| 2019 Sep 25 - 04:55 | 4.616 | 4.542 | 12.5 | -196.61 | 19.11 | 0.23 | 2.74 | 2.55 | 173.26 | 260.09 | |
| 2019 Oct 01 - 03:35 | 4.614 | 4.628 | 12.4 | -190.78 | 18.95 | 0.12 | 2.15 | 1.67 | 207.61 | 311.48 | |
| 2019 Oct 09 - 02:21 | 4.611 | 4.742 | 12.2 | -182.98 | 19.16 | 0.25 | 1.78 | 1.49 | 178.27 | 267.18 | |
| 2019 Oct 12 - 02:42 | 4.610 | 4.785 | 12.0 | -180.02 | 18.50 | 0.12 | 2.11 | 1.62 | 208.92 | 312.79 | |
| 2019 Oct 16 - 02:42 | 4.608 | 4.840 | 11.8 | -176.09 | 19.09 | 0.17 | 2.40 | 1.70 | 195.32 | 292.15 | |
| 2019 Oct 19 - 02:09 | 4.607 | 4.881 | 11.6 | -173.17 | 18.71 | 0.12 | 1.47 | 1.59 | 176.65 | 263.96 | |
| 2019 Oct 19 - 02:36 | 4.607 | 4.882 | 11.6 | -173.15 | 19.10 | 0.14 | 1.94 | 1.74 | 195.56 | 292.23 | |
| 2019 Oct 22 - 02:40 | 4.606 | 4.922 | 11.4 | -170.20 | 19.14 | 0.15 | 2.32 | 1.852 | 190.28 | 284.07 | |
| 2019 Oct 26 - 02:30 | 4.605 | 4.975 | 11.1 | -166.27 | 19.42 | 0.22 | 3.93 | 1.891 | 148.68 | 221.69 | |
| 2019 Oct 26 - 02:35 | 4.605 | 4.975 | 11.1 | -166.27 | 18.57 | 0.12 | 2.23 | 1.935 | 205.24 | 306.01 | |
| 2019 Nov 08 - 01:48 | 4.601 | 5.135 | 9.9 | -153.51 | 18.60 | 0.19 | 2.13 | 1.755 | 204.05 | 302.88 |