Self-initiated behavioural change and disease resurgence on activity-driven networks
Abstract
We consider a population that experienced a first wave of infections, interrupted by strong, top-down, governmental restrictions and did not develop a significant immunity to prevent a second wave (i.e. resurgence). As restrictions are lifted, individuals adapt their social behaviour to minimize the risk of infection. We consider two scenarios. In the first, individuals reduce their overall social activity towards the rest of the population. In the second scenario, they maintain a normal social activity within a small community of peers (i.e., social bubble) while reducing social interactions with the rest of the population. In both cases, we consider possible correlations between social activity and behaviour change, reflecting for example the social dimension of certain occupations. We model these scenarios considering a Susceptible-Infected-Recovered epidemic model unfolding on activity-driven networks. Extensive analytical and numerical results show that i) a minority of very active individuals not changing behaviour may nullify the efforts of the large majority of the population, and ii) imperfect social bubbles of normal social activity may be less effective than an overall reduction of social interactions.
I Introduction
The spreading of infectious diseases and human behaviour are fundamentally intertwined Funk et al. (2010); Verelst et al. (2016); Funk et al. (2015); Gross and Blasius (2008); Marceau et al. (2010). On one side, the unfolding of epidemics might induce people to modify social contacts, habits, and mobility. On the other, such changes might drastically affect the course of the outbreak.
Behavioural change is a blanket term used to describe a wide range of (re)actions. More in detail, these can be classified into two main categories. The first consists of bottom-up, self-initiated changes implemented by individuals according to their perceived risk and susceptibility as well as to the perceived barriers and benefits linked to each action Rosenstock (1974); Hochbaum (1958); West et al. (2020); Gozzi et al. (2020). These individual decisions vary from social distancing and increased hygiene to the adoption of healthy diets and the use of personal protective equipment such as face masks Funk et al. (2010); Verelst et al. (2016). The second category, instead, describes top-down, governmental interventions aimed at interrupting chains of infection by banning (or limiting) large gatherings, mobility within and across countries, as well as strict lockdown and cordon sanitarie Funk et al. (2010); Verelst et al. (2016); Guzzetta et al. (2020).
The literature on the subject provides a wealth of theoretical models developed to capture behavioural change and characterise their effects on the disease Funk et al. (2010); Verelst et al. (2016). These studies differ according to the level of analysis, from single homogeneously mixed populations to individual based contact networks, and according to the mechanisms adopted to model changes in behaviours. Several works tackle the problem by considering variations in individuals’ features or in diseases’ parameters Perra et al. (2011); Moinet et al. (2018); Meloni et al. (2011); Chinazzi et al. (2020); Kraemer et al. (2020); Hébert-Dufresne et al. (2020), while others focus on changes in connectivity patterns Granell et al. (2013); Mancastroppa et al. (2020); Gross and Blasius (2008); Gross et al. (2006); Rizzo et al. (2014). Across the board, such variations are linked to i) disease prevalence and/or ii) individuals’ beliefs and (mis)information circulating in the system. The first approach, typically, does not affect the threshold properties of the spreading. In fact, in this case, behavioural change start to be implemented only after the initial growth of the infected population. Nonetheless, prevalence-induced behavioural change can drastically reduce the final disease burden. The second approach, instead, can also affect threshold properties and thus modify the conditions necessary for a macroscopic outbreak even in the case of simple, homogeneously mixed populations Perra et al. (2011); Wang et al. (2016).
After the first COVID-19 wave, many countries gradually lifted the top-down measures implemented to curb the spreading of the SARS-CoV-2 virus. Such interventions have been largely induced by the local spreading and in particular by the burden to the healthcare systems. When such measures were relaxed, self-initiated behavioural change (nudged by new regulations) became fundamental. Indeed, evidence from serological studies and modelling efforts indicated that the immunity resulting from the first wave was very far from the one required for herd immunity Herzog et al. (2020); Stringhini et al. (2020); O’Driscoll et al. (2020). In this context, we present a theoretical framework aimed at investigating the effects of behavioural changes on disease resurgence on time-varying contact networks Holme and Saramäki (2012); Holme (2015); Masuda and Holme (2017). In particular, we consider the following, unfortunately realistic, scenario. We imagine a population that experienced a first wave of infections which due to strict, top-down measures, was interrupted early. We imagine that interventions are lifted and that people reduce their social interactions (respect to the usual baseline) either because mindful of the risk of propagating the virus (if infected) or because concerned by the risk of infection (if not infected). In doing so, we explore the effects on disease resurgence if such changes are implemented only by a fraction of the population selected i) at random and ii) according to the propensity individuals have to establish social interactions. We adopt activity-driven networks, a class of time-varying networks, to model the temporal interactions between individuals Perra et al. (2012a); Karsai et al. (2014); Ubaldi et al. (2016, 2017); Alessandretti et al. (2017); Nadini et al. (2018). Although they are a simple approximation of real contact networks, they capture an important property of human interactions: the heterogeneity of human activity. In fact, evidence from a wide range of real datasets capturing human interactions in various contexts suggest that the propensity per unit time of people to establish social connections (i.e. the activity), is highly heterogeneous Perra et al. (2012a); Karsai et al. (2014); Ubaldi et al. (2016); Ribeiro et al. (2013); Tomasello et al. (2014). Here, we first consider the basic formulation of the model in which, at each time step, active nodes create random connections with others Perra et al. (2012a). In these settings, we derive the analytical expression of the epidemic threshold of a Susceptible-Infected-Recovered model Keeling and Rohani (2011) unfolding on top of the temporal networks as a function of the parameters and mechanisms defining the behavioural changes. Interestingly, we find a closed-form expression for the basic reproductive number that is symmetrical respect to the reduction of activity of susceptible and infected nodes. Since the isolation of large numbers of individuals comes at high societal costs, this underlines the advantages of a configuration with strong isolation of infected. This point becomes even more relevant at the early stage of a possible second wave of infections when the number of infected is relatively small.
Furthermore, we find that in the case of partial adoption assigned in increasing order of activity an almost perfect level of conformity is required to avoid disease resurgence. This highlights that the lack of adoption of a small number of highly socially active individuals may jeopardize large collective efforts.
We then consider a more realistic variation of activity-driven networks able to capture the mesoscopic organisation of real sociograms in tightly connected groups (i.e. communities) Nadini et al. (2018); Fortunato (2010). In these settings, we rely on numerical simulations to characterise the effects of behavioural changes. In doing so, we consider two different types of adaptive behaviours. The first is a reduction of activity. The second instead is inspired by the concept of social bubbles: nodes keep their social propensity but they direct it towards a small social group. We model this scenario by increasing the probability of interactions within communities. Results show that the presence of communities increases the threshold making it more difficult for a disease to spread. Furthermore, behavioural changes aimed at reducing activity have a much stronger effect on the spreading with respect to those aimed at increasing the cohesiveness of small social groups.
The paper is organised as follows. In Section II we introduce activity-driven networks. In Section III we describe the spreading of infectious diseases on this class of time-varying networks. In doing so, we first describe the various mechanisms of behavioural changes induced in the population and then characterize their effects on the spreading of the disease. In Section IV we present our conclusions.
II Activity-driven networks
In activity-driven networks, the temporal interactions between nodes are defined in two steps. The first is the node activation defining the subset of nodes that, at each time step, are active and willing to establish social interactions. The second is the partner selection defining with whom each active node will connect. Nodes’ activation is modelled assigning to each node an activity . This quantity, extracted from a distribution , describes the rate at which each node is active per unit time. As mentioned above, observations in several real networks suggest that such distribution is heterogeneous Perra et al. (2012a); Karsai et al. (2014); Ubaldi et al. (2016); Ribeiro et al. (2013); Tomasello et al. (2014). For simplicity, in the following we assume with to avoid divergences. Several mechanisms have been proposed for the second step Perra et al. (2012a); Karsai et al. (2014); Ubaldi et al. (2016, 2017); Alessandretti et al. (2017); Nadini et al. (2018); Brett et al. (2019). Here, we consider two: random and community-based partner selection.
II.1 Random partner selection
In the basic formulation of the model, each active node creates random connections with others Perra et al. (2012a). Connections are done without recollection of past interactions. Thus, the process is memoryless. In these simple settings, the network’s temporal dynamics can be summarised as follows:
-
•
at each time , the network is initially disconnected;
-
•
each node is active with probability creating random connections;
-
•
each connection is deleted, time incremented to , and the process restarts from the first point.
In other words, each connection lasts for a duration (without loss of generality here we set ) and it is created randomly by active nodes. Thus, at each time step, the network is mostly made up of disconnected stars centered around active nodes. It can be easily shown that the distribution of the number of connections of each node (i.e. the degree) in the aggregated network obtained integrating links over several time-steps follows the distribution of the activity Perra et al. (2012a); Starnini and Pastor-Satorras (2013). Hence, heterogeneous activity patterns induce the formation of hubs which are highly active nodes engaging over and over in social interactions. However, since links are created at random, the distribution of links’ weights in the time-integrated network is homogeneous and thus very far from observations in real networks Onnela et al. (2007); Karsai et al. (2011); Miritello et al. (2011). In summary, this version of the model captures some important features of real systems and it allows for analytical analyses of dynamical processes unfolding on its structure at comparable time-scales Perra et al. (2012a, b); Liu et al. (2014); Davis et al. (2020); Starnini and Pastor-Satorras (2014); Rizzo et al. (2014); Zino et al. (2016, 2017), but at the same time it is a rough approximation of real social networks.
II.2 Community-based partner selection
This second approach considers a much more realistic partner selection mechanism. In fact, social networks are organised in tightly connected groups (i.e. communities), which emerge and evolve in time Fortunato (2010). As a result, the vast majority of connections takes place within such circles of friends rather than across them Karsai et al. (2011); Onnela et al. (2007). To capture this fundamental aspect of social interactions, each node is assigned to a particular community . The size of each community is extracted from a distribution Nadini et al. (2018). In these settings, the dynamics of the network follows these steps:
-
•
at each time , the network is initially disconnected;
-
•
each node is active with probability creating connections;
-
•
with probability each connection is done selecting at random one of the nodes in the same community and with probability selecting at random in any other community;
-
•
each connection is deleted, time incremented to and the process restarts from the first point.
As done above, without loss of generality we set . The parameter regulates the modularity of the emerging network. For (and in case of community sizes ) the network unfolds very similarly to the first model. Instead for the network will be formed by completely disconnected communities.
III Behavioural changes induced by disease spreading on activity-driven networks
We study the spreading of an infectious disease unfolding at a comparable time-scale with respect to the evolution of connections in the contact network. We consider the prototypical Susceptible-Infected-Recovered epidemic model Keeling and Rohani (2011); Pastor-Satorras et al. (2015). Thus, each node can be found in one of three compartments: healthy and susceptible individuals are in the compartment , infectious in , and recovered in . The disease propagates via the connections between susceptible and infectious nodes with a probability of infection, per contact, . Infected nodes recover spontaneously with probability . In the case of an outbreak without residual immunity (i.e. ), the epidemic threshold in a memoryless activity-driven network can be obtained, using a mean-field approach, studying the evolution of the number of infected nodes with activity . In particular, this threshold reads Perra et al. (2012a):
| (1) |
which implies that the disease will be able to spread only if . In this last expression, we introduced the basic reproductive number as the number of secondary infections generated by an index case in a fully susceptible population Keeling and Rohani (2011). Interestingly, the threshold of a SIR (for a SIS the threshold is the same) model is driven by the first and second moment of the activity distribution rather than the time-aggregated properties of the graph.
In the case of activity-driven networks with communities, we do not have a closed expression for the threshold. However, it is interesting to notice how the presence of communities, and more in general the repetition of a small subset of ties Sun et al. (2015); Tizzani et al. (2018), affects very differently SIR and SIS models Nadini et al. (2018). In fact, while in the case of permanent immunity (SIR) the repetition of contacts within communities hampers the spreading, it helps the diffusion of diseases able to reach an endemic state (SIS). In other words, modularity pushes the threshold of SIR models to higher values while facilitates the spreading of SIS models, pushing the threshold to lower values.
As mentioned in the introduction, in this work we investigate the following scenario. A highly infectious disease spreads in the network, but its course is halted by strict top-down interventions. In this first wave, the large majority of individuals has not been affected, thus the system is far from herd immunity (i.e. ). As the measures are lifted, individuals (maybe nudged by laws and regulations) implement behavioural changes with the aim of protecting themselves and the others and thus avoid - or mitigate - a second wave.
As a first step, we model the implementation of behavioural changes reducing the activity of susceptibles by a factor and the activity of infected by a factor . This model has been presented first by Rizzo et al Rizzo et al. (2014). As a second step, we extend this approach by studying the effect of adoption rates. We consider that such changes in behaviour are implemented only by a fraction of nodes selected either at random or as a function of the activity. In fact, the adoption of behavioural changes can be more costly for very active people (maybe due to their occupation) and thus less likely to be applied Rosenstock (1974); Hochbaum (1958). As a third step, we further extend the literature exploring the interplay between behavioural changes and the modularity of the network. This corresponds to the fact that individuals might keep the same activity but cut connections with people outside their close-knit social circles. Also in this case, we study the role of adoption considering only a fraction of nodes engaging in any form of behavioural change.
III.1 Perfect adoption
Following the order described above, we first consider a scenario in which, as a way to reduce the risk of infection, susceptible individuals reduce their activity of a factor and infected by a factor . Assuming that nodes of the same activity are statistically equivalent, we can write the evolution of the number of infected node of activity class as:
where holds for all activity classes. The first term in the right hand side describes recovery process. The second captures susceptible nodes that become active and select as partner an infected individual in any other activity class. The third term, instead, describes susceptible nodes that are selected by active and infected nodes in any activity class. In the early stages of the possible second wave, we assume and thus .
In other words, the first wave was stopped well before the disease was able to affect a large fraction of the population. In these settings we drop all the second order terms obtaining:
| (3) |
By integrating both sides over all activity classes we have:
| (4) |
where and . To characterise the evolution of we then need to derive an equation for . In particular, multiplying both sides of Eq. 3 by and integrating across all activities:
| (5) |
The epidemic threshold can be obtained studying the stability of the system of differential equations defined by Eq. 4 and Eq. 5. Indeed, the disease will be able to spread only if the largest eigenvalue of the Jacobian matrix of the system is larger than zero. Here, can be written as:
And the threshold, as reported in Ref. Rizzo et al. (2014), is:
| (6) |
This condition implies , where is the right hand side Eq. 6. Notably, when , it reduces to the threshold of activity-driven networks without behavioural changes. However, it is interesting to notice how these two reductions of activity rates do not imply a simple rescaling of the threshold. Indeed, they introduce non-linear terms in the expression. Furthermore, the threshold is symmetric in and meaning that the reduction in activity of susceptibles () and of infected () can be switched without implying any change in the threshold. It is important to notice, however, that in the early stages of the outbreak the number of susceptibles is much larger than the number of infected. Thus, since reductions of activity come with high social costs, combinations of parameters with lower values of rather than are desirable.
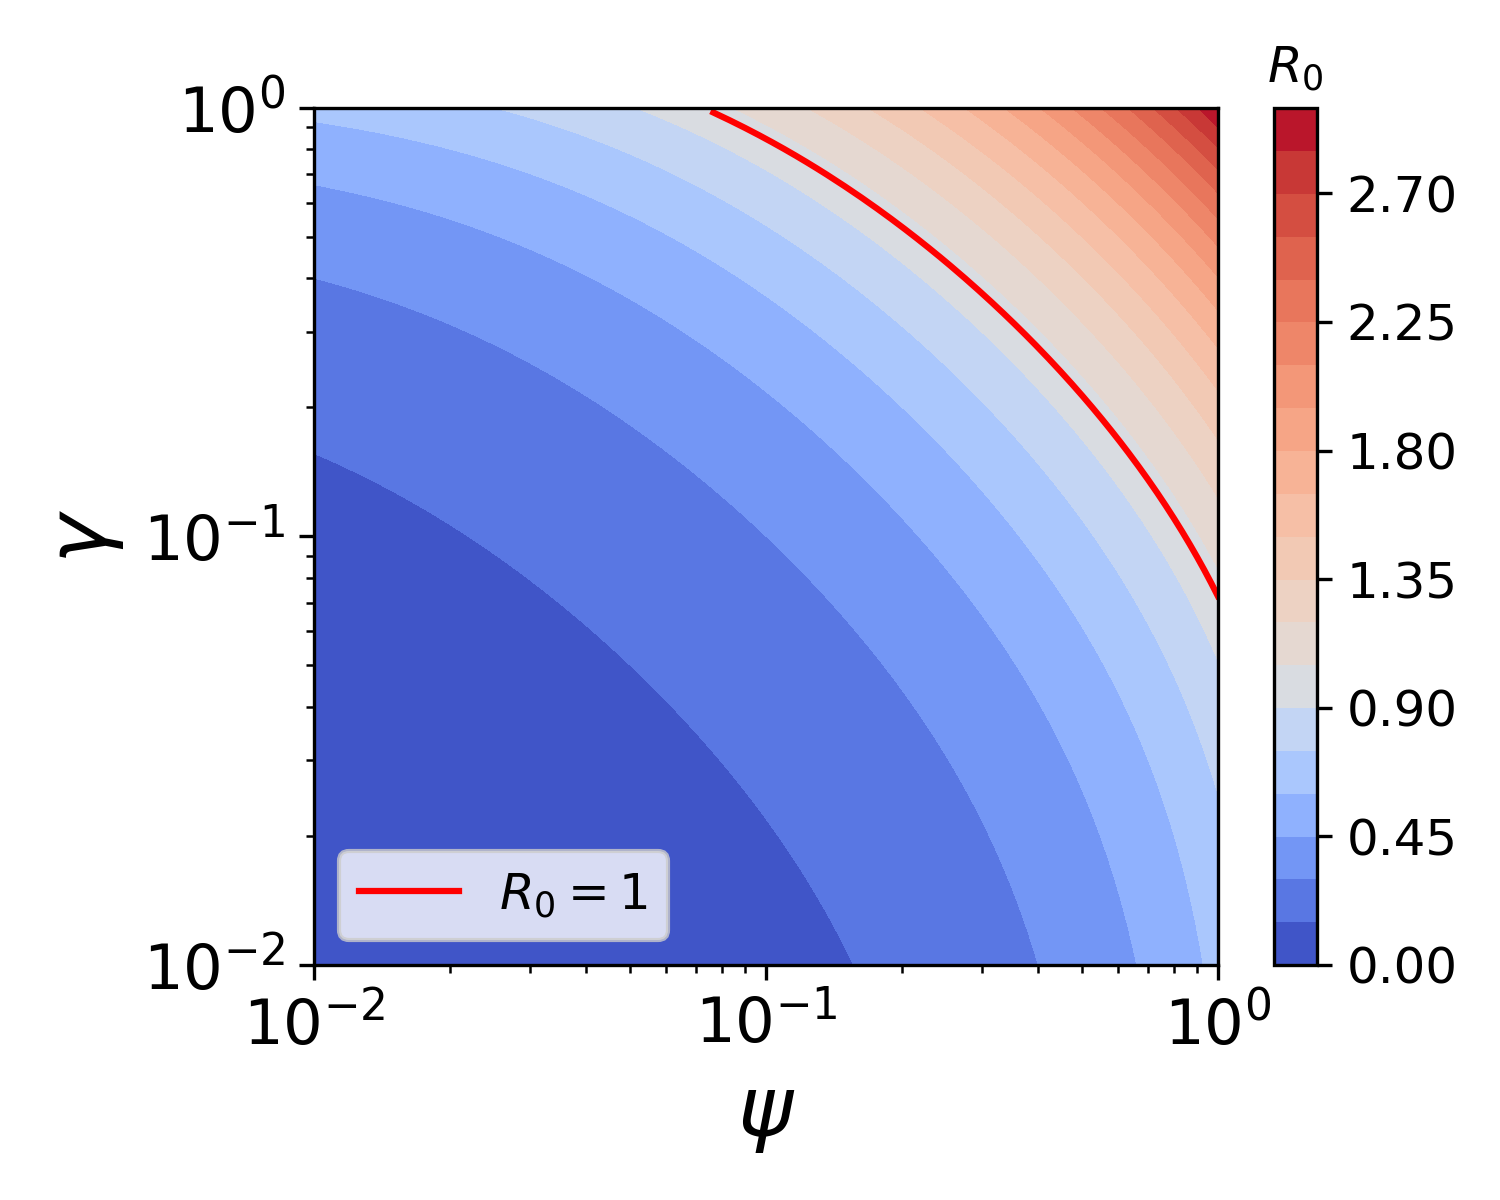
In Fig. 1-a we show the basic reproductive number obtained from Eq. 6 as a function of and . We consider a scenario in which, without behavioural changes (i.e. for ), we have that . Hence, the disease is supercritical and able to spread in the population. Introducing increasingly stronger behavioural changes implemented by susceptible and infected (i.e. as both and decrease), becomes progressively smaller. The red line in figure splits the parameters space in two: to its left, we find the combinations of and such that , while to its right we have those combinations that are not strong enough to push below and thus prevent the onset of a second wave. From the plot, we see that when (i.e. susceptible nodes do not implement any behavioural change), infected nodes need to reduce their activity to less than of the original in order to stop the resurgence of the disease.
III.2 Non-perfect adoption
So far we have assumed that all nodes modify their behaviours in response to the outbreak. However, it is more realistic to assume that only a fraction of the population is willing - or able - to reduce the activity.
For this reason, we first consider that the propensity to implement behavioural changes is independent of node’s features and only function of its status. Thus, we can assume that, across all activity classes, a fraction of susceptibles and a fraction of infected will reduce the activity. In these settings, it can be easily shown that the system of differential equations describing the early-stage dynamics of the disease is equal to the one derived before provided these two transformations: and . Hence, the threshold can be rewritten as:
| (7) |
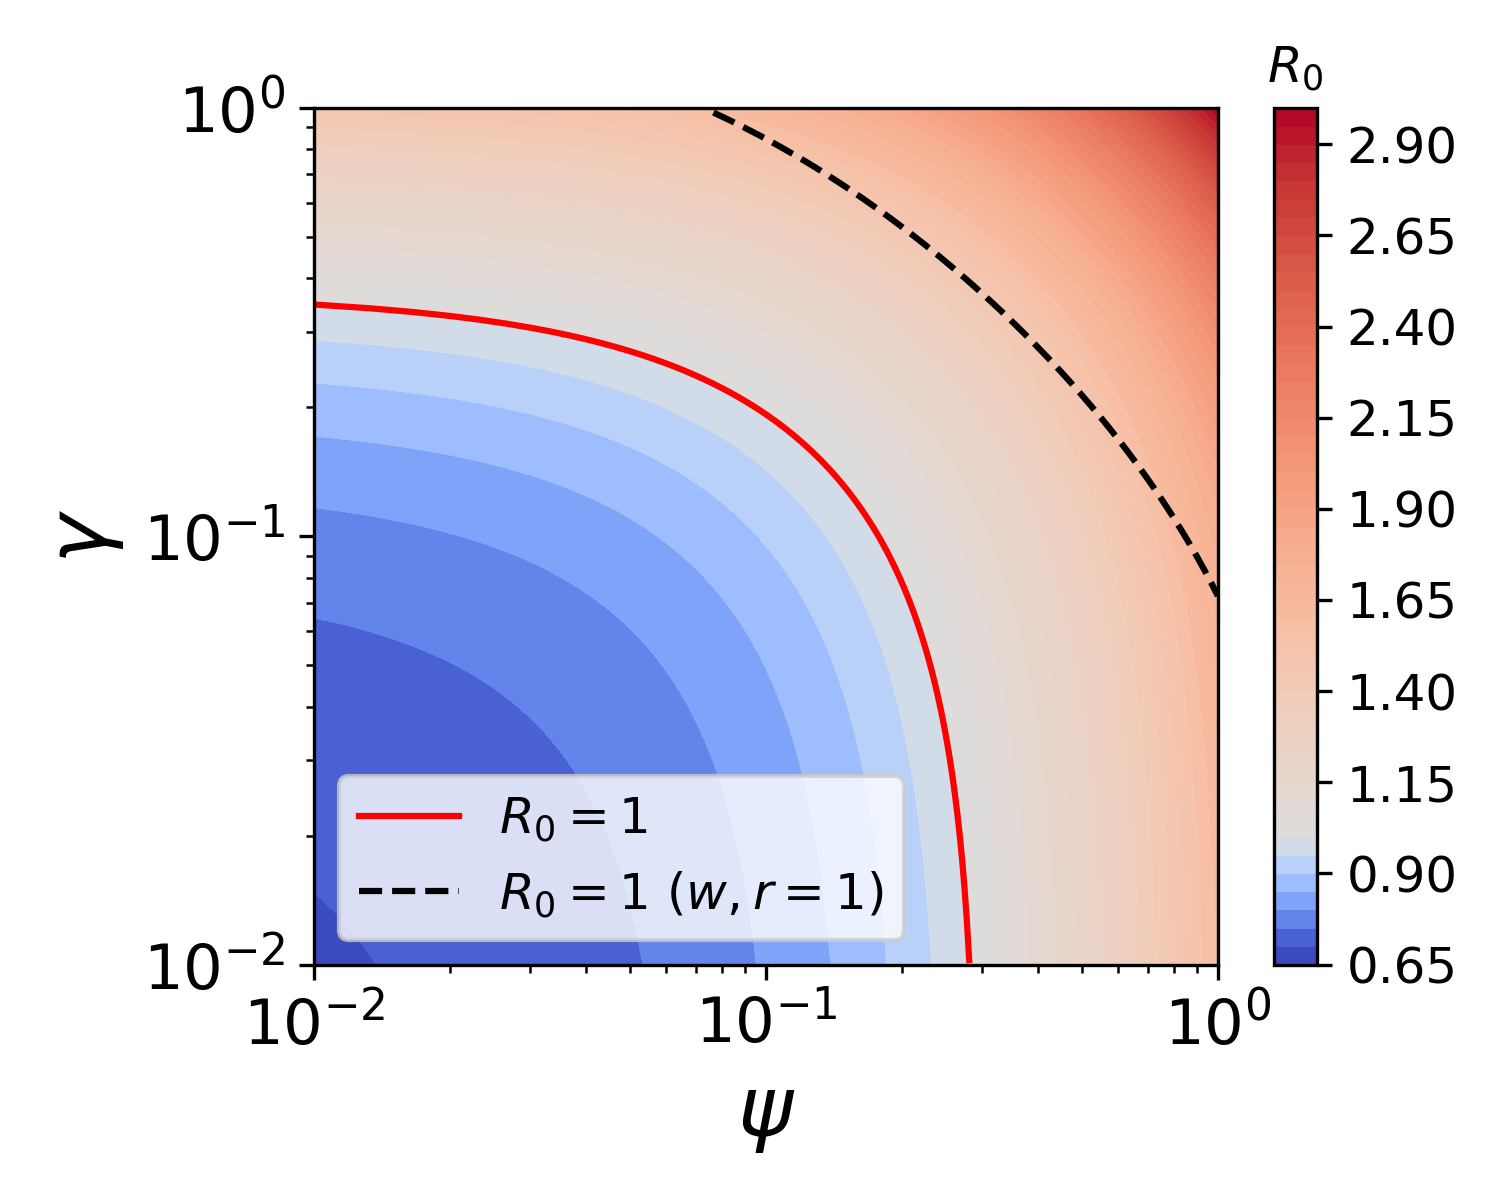
In other words, the case of random adoption across classes does not alter the dynamics but simply rescales the reduction parameters. Not surprisingly, obtaining the same increase of the threshold requires an extra reduction of activity of the fraction of the population that complies. We can see these effects in Fig. 1-b where we show (calculated from Eq. 7) as a function of and for fixed values of and . As expected, in the case of random adoption the threshold is shifted towards lower values of and with respect to the previous case (grey dashed line). This implies that larger reductions of activity are required in order to stop the disease from spreading. Furthermore, since and have different values and therefore weighs differently the reduction parameters, the is not symmetrical in and (but in and ).
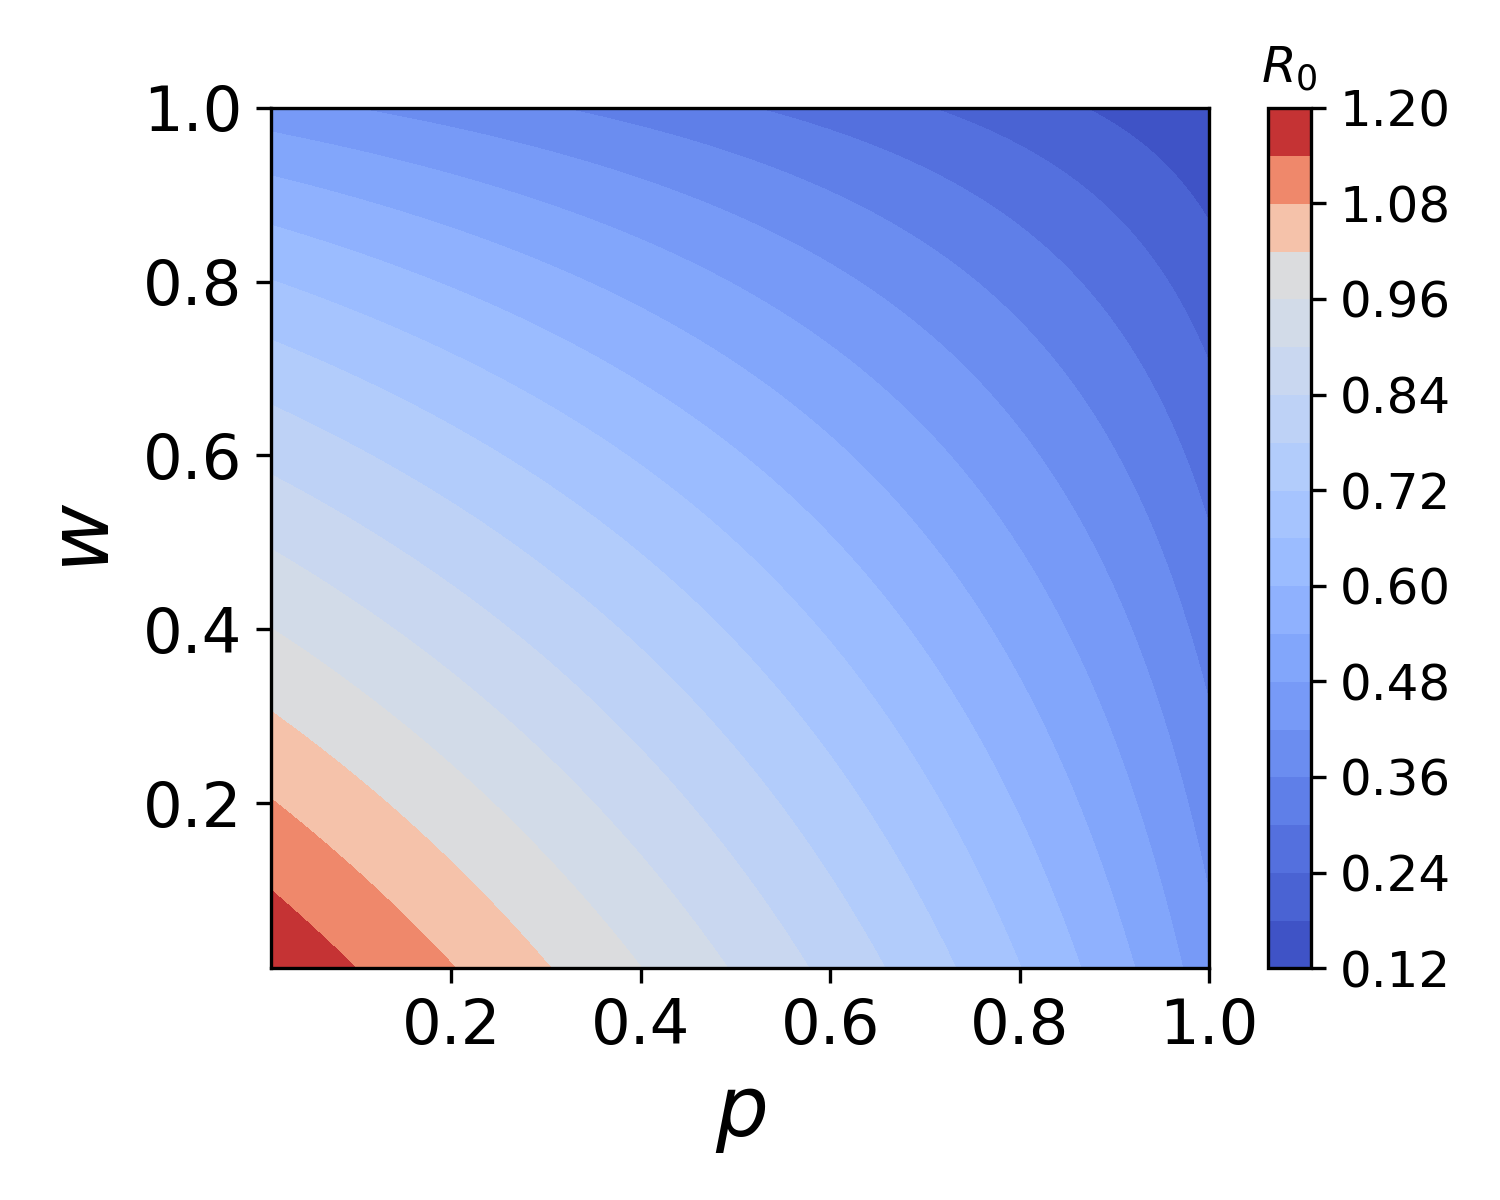
In Fig. 1-c, instead, we show as a function of and for fixed values of and . We observe that and interpolate between two opposite regimes. By reducing their values, the adoption of behavioural changes becomes increasingly less significant. Consequently, assumes values closer to those described in Eq. 1 which captures a system without behavioural changes. Conversely, by increasing the values of and , the values of become progressively closer to Eq. 6 which describes a system with adoption of behavioural changes.
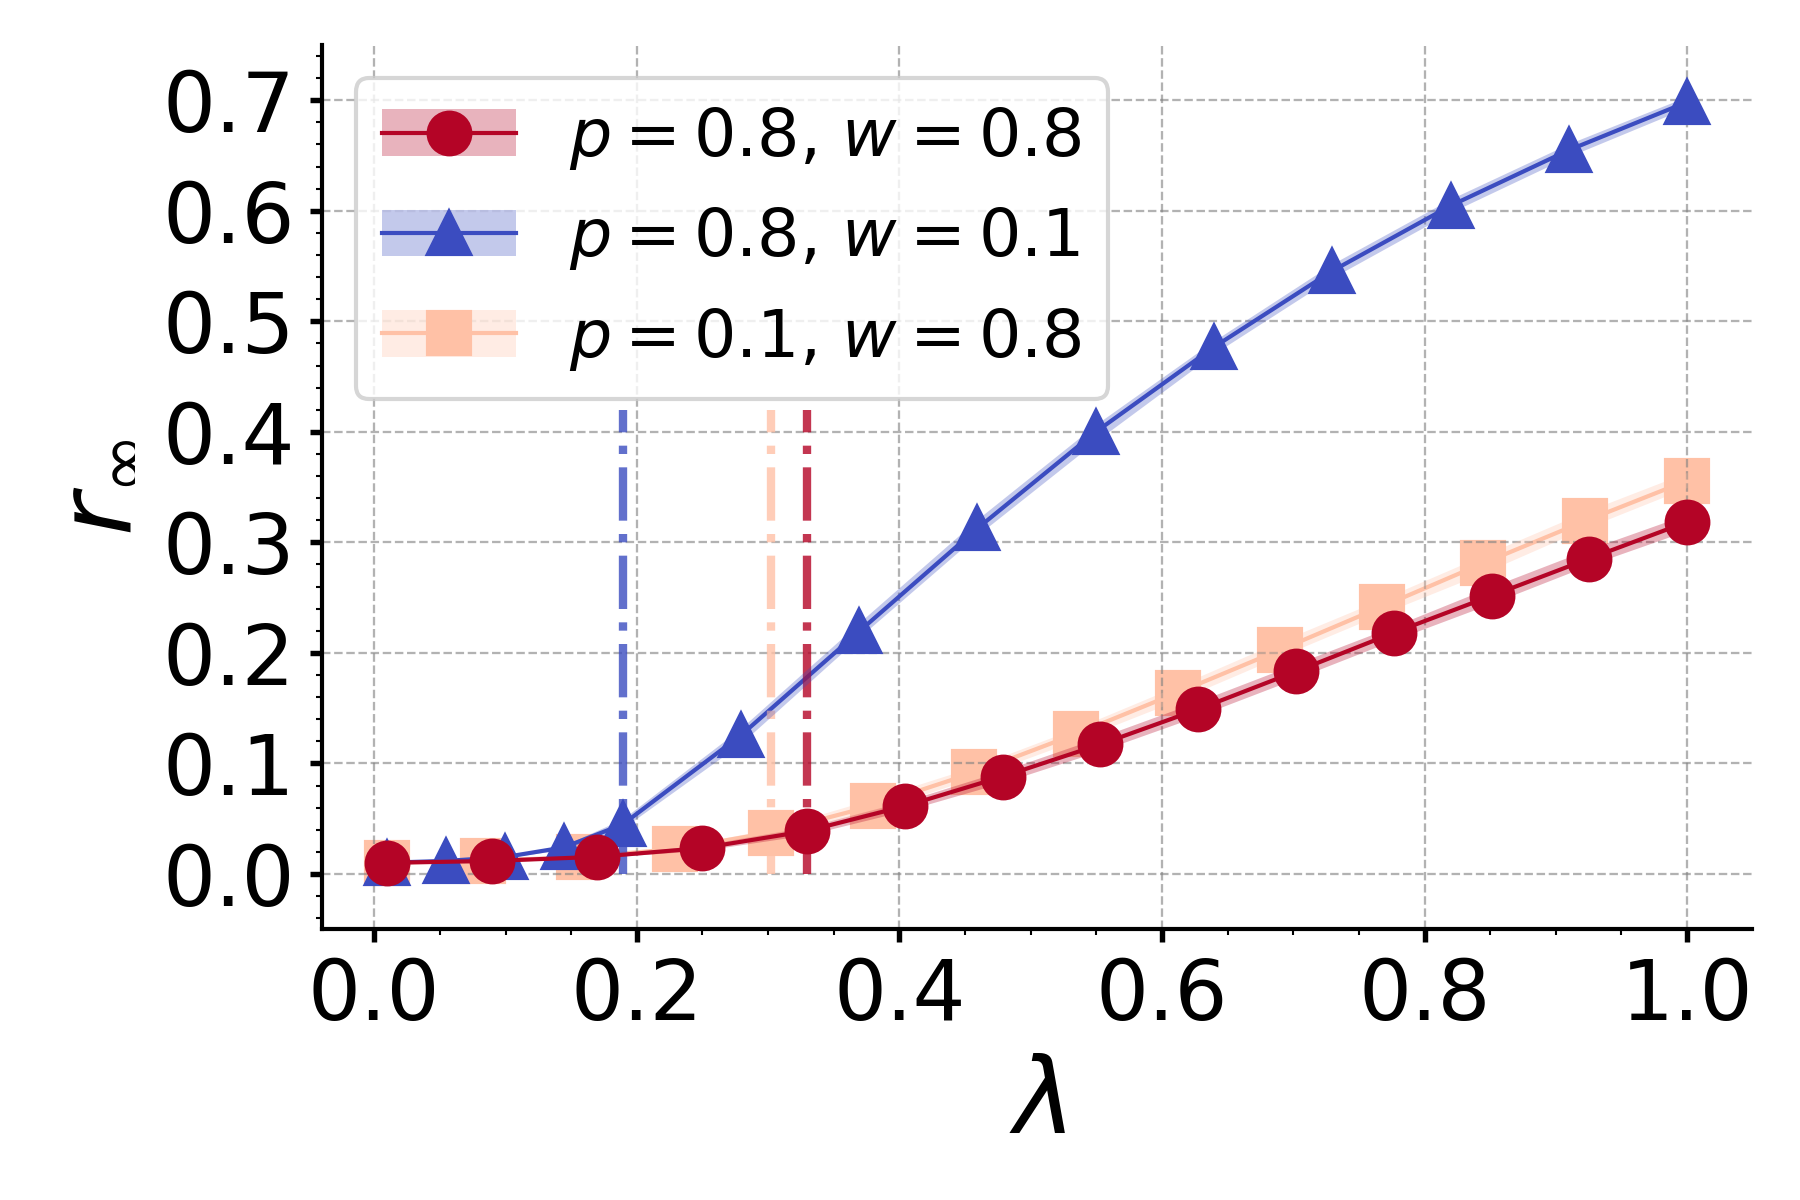
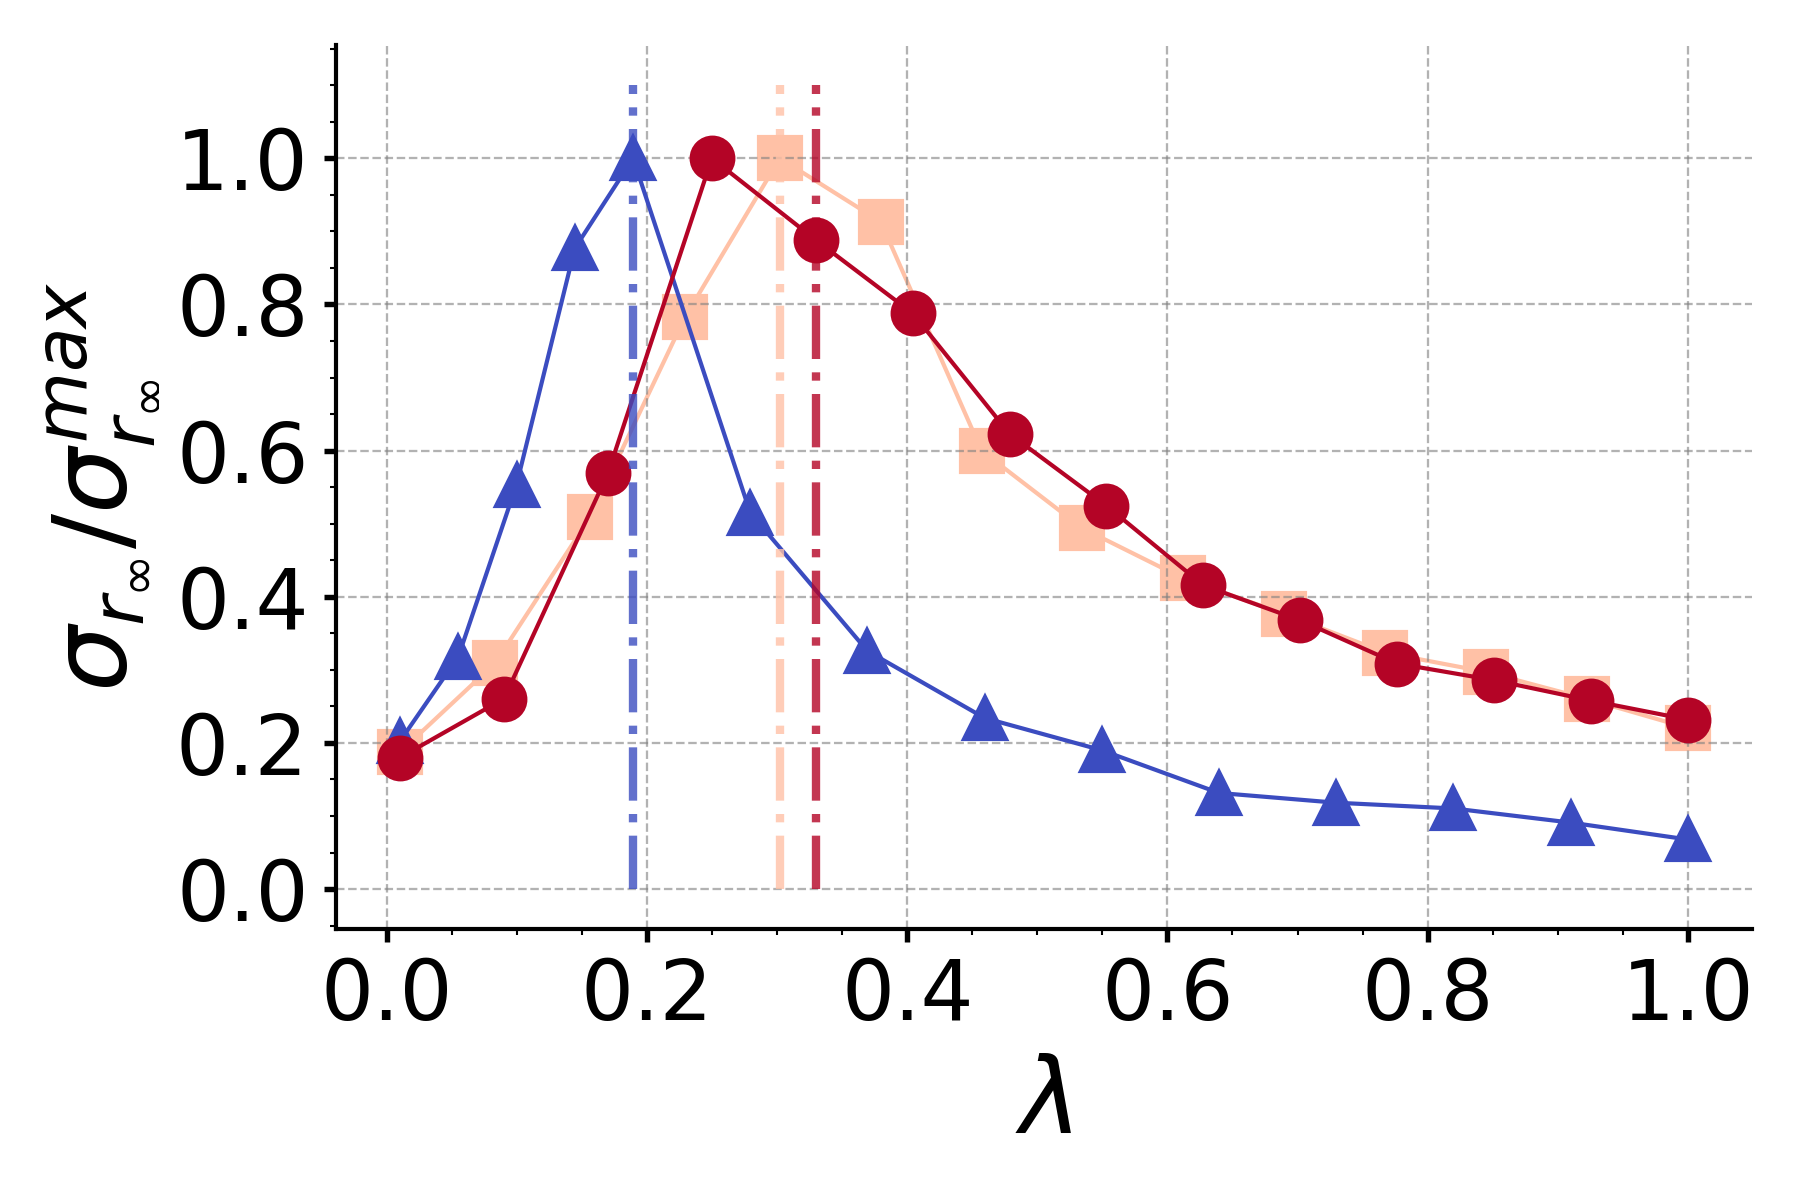
We test the analytical solution derived in Eq. 7 by means of numerical simulations. In particular, we consider a case in which infected individuals reduce more their activity (due to their illness status, for example) with respect to the susceptibles by setting , and . In Fig. 2-a, we plot as a function of , for different values of and . Reasonably, the epidemic size grows with the infectiousness of the pathogen and it decreases when a larger fraction of individuals implement behavioural changes. As expected from the theory, the final epidemic size obtained with of susceptibles and infected implementing behavioural changes is very similar to the one obtained with only of susceptibles and of infected engaging in such changes. Taking into account that at the beginning of the possible second wave the number of infected is much smaller than the number of susceptible, and given the high socio-economic cost of isolating individuals, a setting in which infected reduce more their social interactions is clearly more desirable. In Fig. 2-b, instead, we represent, for different combinations of parameters, the relative variance of the final epidemic size as a function of Moinet et al. (2018). This is defined as . Because of the critical behaviour of the epidemic process we are considering, the maximum is reached at the threshold. As expected, we observe that, for the different combinations of parameters considered, the normalized relative variance peaks around the theoretical threshold values, providing a numerical validation of the analytical expression found previously.

III.3 Non-perfect adoption depending on activity
Moving to even more realistic scenarios, we now consider the case in which the propensity of implementing behavioural changes is linked to the activity. We can imagine that, due to the higher barriers and costs associated with the change in behaviour, nodes with larger activity will be less prone to such changes. A natural example are individuals that due to the nature of their job cannot easily reduce the number of their interactions. For simplicity, we consider that only susceptible nodes with activity lower or equal to and infected nodes with activity lower or equal than will implement behavioural change. In other words, nodes with activity larger than a given threshold will not change their behaviour. Therefore, the maximum fraction of individuals changing behaviour is linked to the activity cut-off value as follows:
| (8) |
In general, since the health status of each node affects the type of behavioural change, the fraction of, say, infected nodes adopting behavioural change is smaller that the respective .
In these settings, the equation regulating the change of number of infected in a specific activity class at early stages of the spreading can be written:
| (9) | |||||
where is a heaviside step function equal to one for and zero otherwise. Integrating over all activities and introducing we get:
| (10) |
where we defined . In order to understand the early dynamics we need to get an equation for . To this end, we can multiply both terms of Eq. 9 for and integrating across all activities we obtain:
| (11) | |||||
where we defined:
| (12) | |||||
which is a modulation of the second moment of the activity distribution. From this stand point we can write the Jacobian matrix of the system of differential equations. To simplify further the notation, we define:
| (13) | ||||
| (14) |
Therefore, the threshold behaviour is encoded in the system of differential equations:
| (15) | ||||
| (16) |
The disease will be able to grow only if the largest eigenvalue of the Jacobian matrix of this system is larger than zero. The Jacobian matrix can be written as:
| (17) |
The eigenvalues can be found solving the characteristic equation:
| (18) |
leading to:
| (19) |
The threshold condition can be written as:
| (20) |
Substituting the values of with those from equation 12, 13, 14, we obtain the threshold as a function of the activity moments:
| (21) |
where
| (22) | |||||
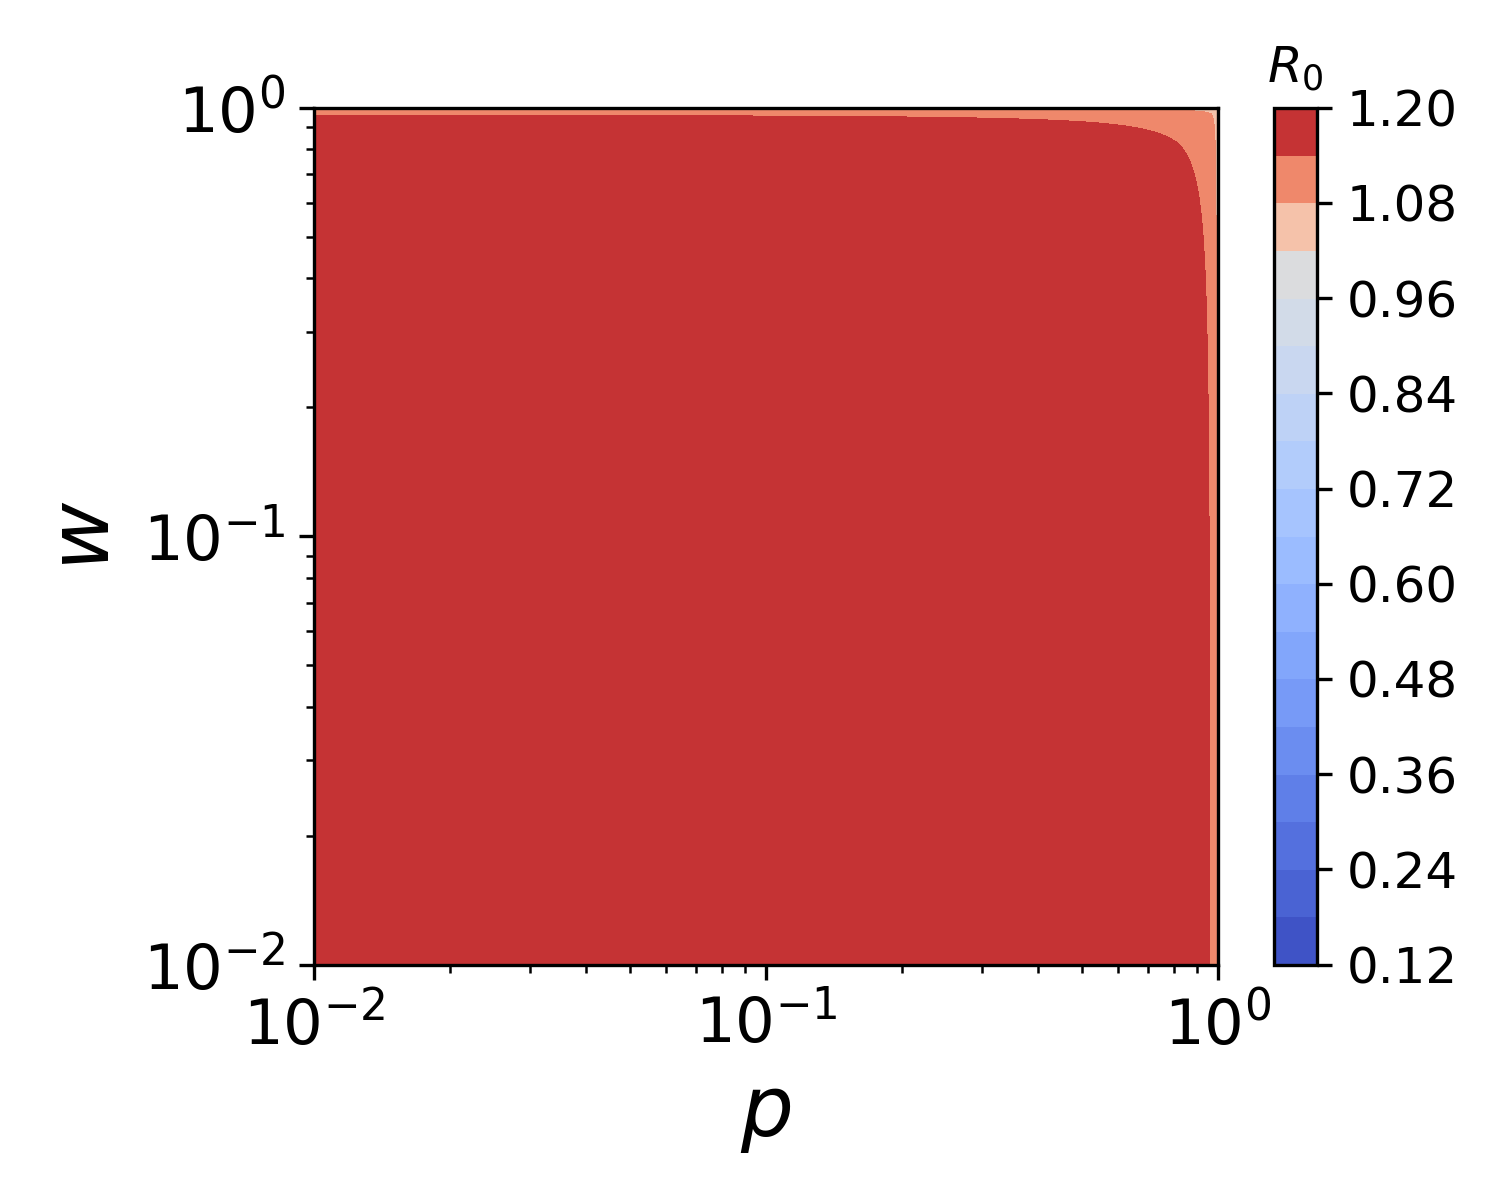
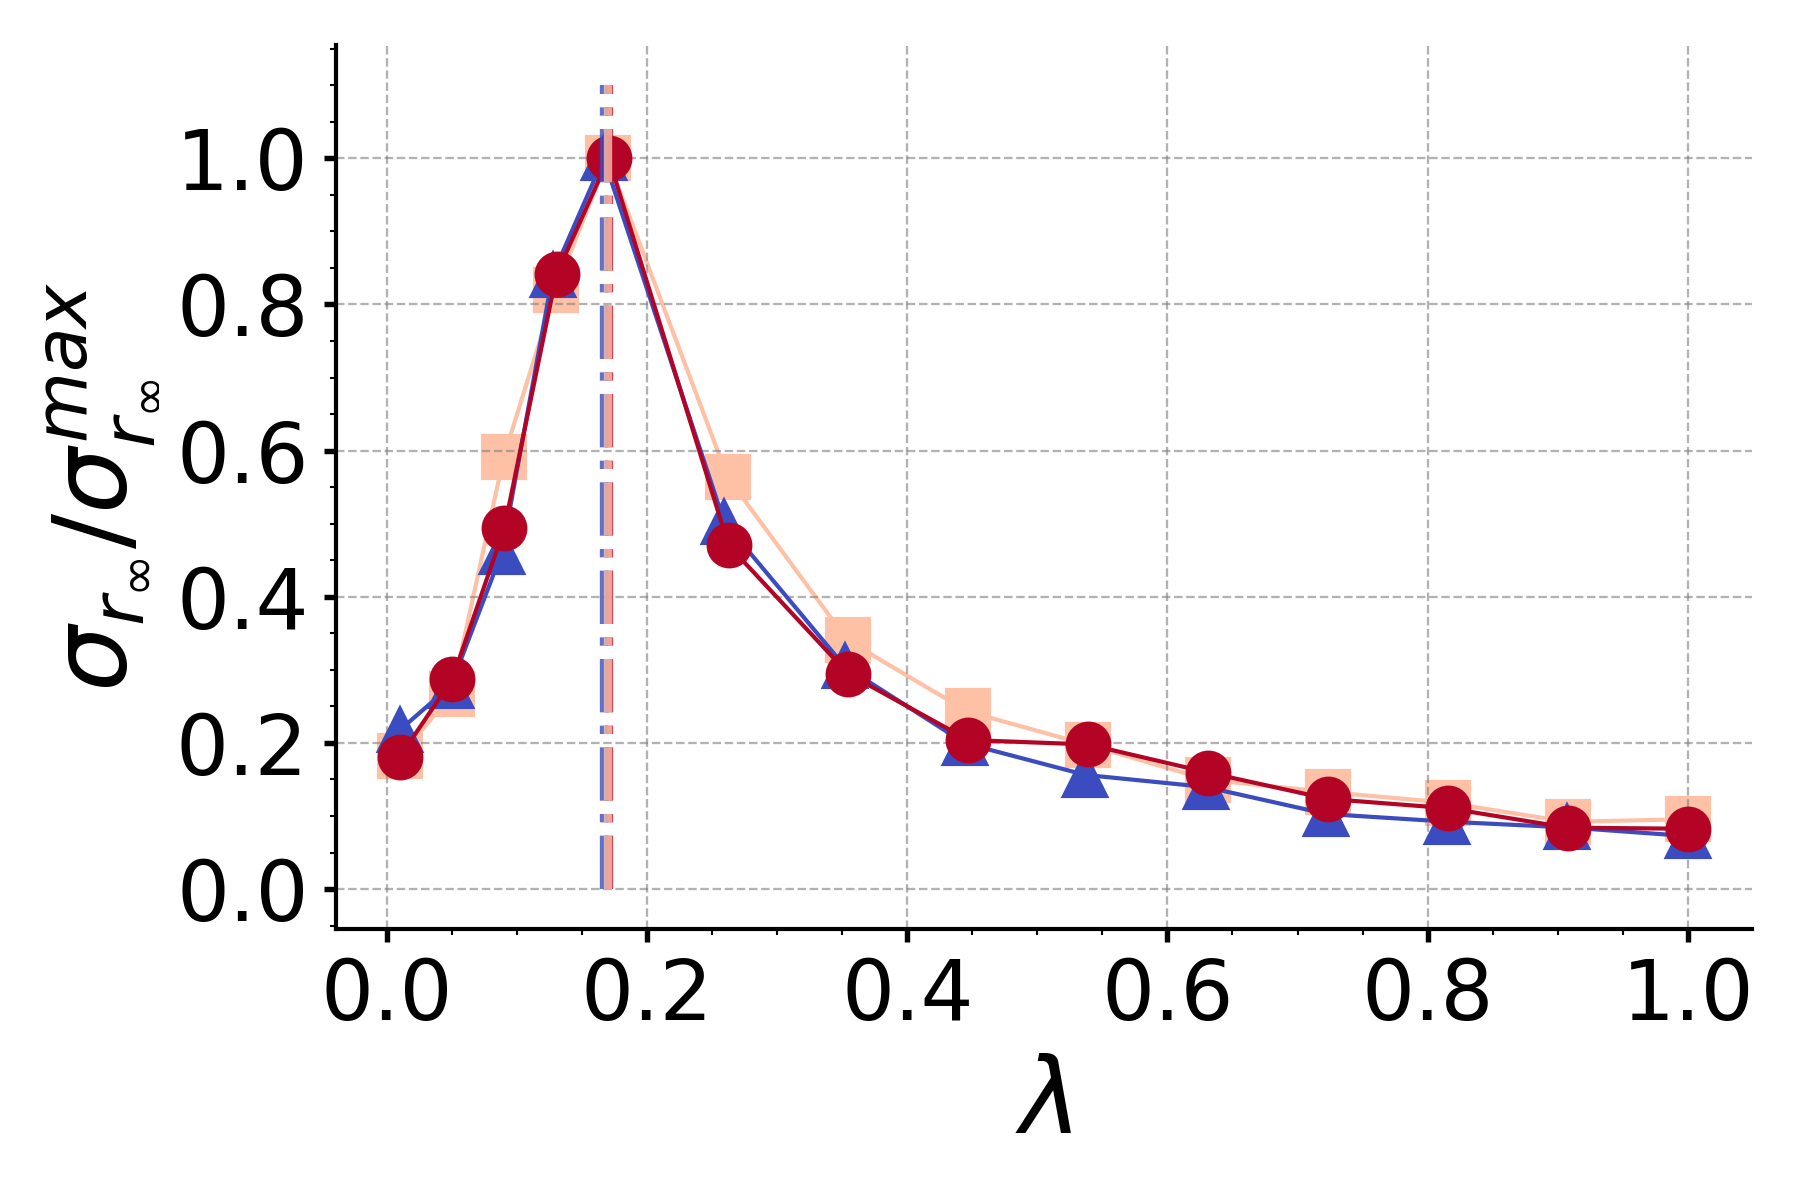
We can verify that, if , we find again the result of Eq. 7. In Fig. 1-d we compare the effects of different values of and on in the case of random and activity-based adoption using Eq. 8 to compute the correspondent values of and . Very differently from the case of a random fraction of adopting nodes (Fig. 1-c), an almost perfect conformity to the behavioural measures is needed to halt the spreading and push below . Indeed, even if the majority of individuals reduces the activity, the interactions of the most activity nodes are sufficient for a disease to spread. This is line with the study of immunization strategies in activity-driven networks Liu et al. (2014). In fact, the strategic immunization of few central, most active nodes has been shown sufficient to halt the spreading. This implies that these nodes are indeed key to sustain the unfolding on the virus. Hence, the highly heterogeneous activity of people plays a fundamental role in this phenomenon. In Fig. 2-c-d we test the analytical solution by means of numerical simulations. We plot and as functions of , for different values of and . Interestingly, we observe that large differences in and result in very similar attack rate profiles and thresholds. This confirm how the spreading is controlled by the most active nodes that are not compliant and how the efforts of large majority of the population might be vane if a minority of highly active node does not change behaviour. Also, Fig. 2-d confirms the validity of the theoretical analysis. Indeed, in all scenarios considered the estimated in the simulations are well peaked around the analytical predictions.
III.4 The role of communities
Moving forward we switch to the second, more realistic, time-varying network model where the link creation mechanism is function of nodes’ membership to tightly connected groups, i.e. communities. The analysis that follows is based only on numerical simulations, indeed as mentioned above we do not have a closed-form expression for the threshold of activity-driven networks with communities even in the absence of behavioural change Nadini et al. (2018). The presence of a modular structure allows us to study two different types of changes in behaviours. The first is analogous to what we presented above: as a way to protect themselves and the others, nodes reduce their social propensity. We label this as activity reduction (AR). The second instead takes inspiration from the idea of social bubbles Leng et al. (2020). Indeed, individuals might keep the same social propensity but direct it only towards a limited group of people. To this end, we hypothesize that nodes keep the same activity but increment the share of intra-community connections leading to an increase in the modularity of the emergent social network. We label this as modularity increase (MI).
III.4.1 Activity reduction
As done above, in this scenario we imagine that individuals change behaviours by reducing their activity by a factor if susceptible and by a factor if infected. Furthermore, we consider the case of non-perfect adoption and compare random with activity-based adoption. In Fig. 3-a we show the behaviour of the epidemic size as a function of . We set , and . We consider a modularity , and for simplicity we set the size of each community to be the same (). Thus of links are created within communities and each one is made up of ten nodes. Few observations are in order. First, as seen before, random adoption is characterized by a larger threshold and a smaller final epidemic size with respect to the other case. Therefore, when the most active nodes are not adapting their behaviour the system is more fragile to the spreading of a virus. Second, we plot as dashed lines the analytical thresholds computed in absence of communities from Eq. 21. In both cases, the presence of tightly connected groups of nodes increases the threshold. This result is in line with past research showing that high values of modularity slow down the spreading of SIR (as well as SI) models Nadini et al. (2018); Onnela et al. (2007); Karsai et al. (2011); Salathé and Jones (2010); Stegehuis et al. (2016); Scarpino et al. (2016).
III.4.2 Modularity increase
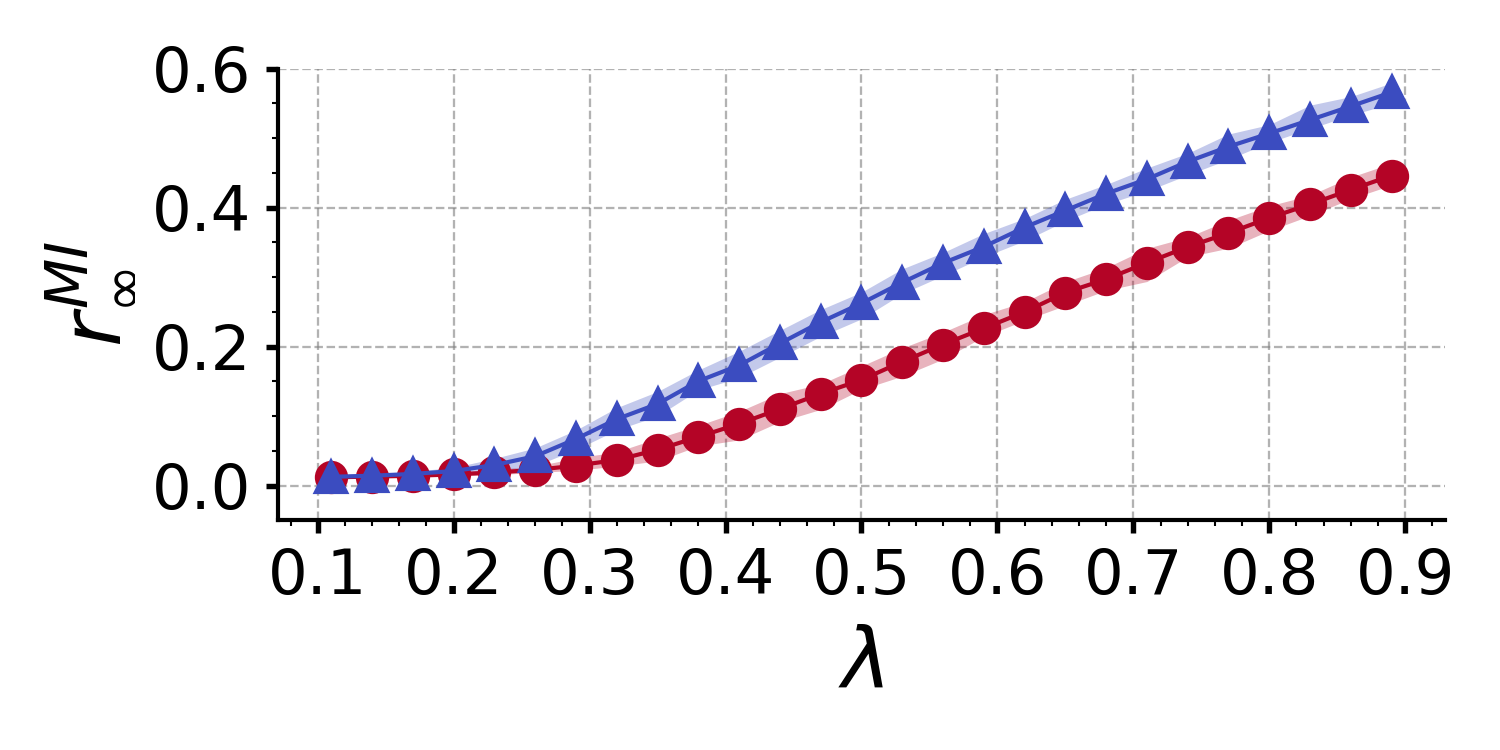
The explicit membership to communities allows considering also another type of behavioural change where individuals keep the same activity but reduce, as a way to lower the infection risk, ties outside their close circle of friends (community). Therefore, the system moves towards isolated social bubbles. In Fig. 3-b we show the behaviour of the epidemic size as a function of . All the other parameters are set equal to the previous case. In particular, the default (baseline) value of modularity is . However, the fraction of nodes implementing social distancing measures increases the modularity according to their disease status: susceptible nodes are characterized by and infected nodes by . In order to compare this scenario with the previous one, we set parameters such that the variation of behaviour of nodes changing behaviour has the same magnitude. More in detail, susceptible nodes change their behaviour by (previously we set to , implying a reduction of activity) and infected by . Therefore, behavioural change induce a and . Also in this case, random adoption has a bigger impact on the spreading.
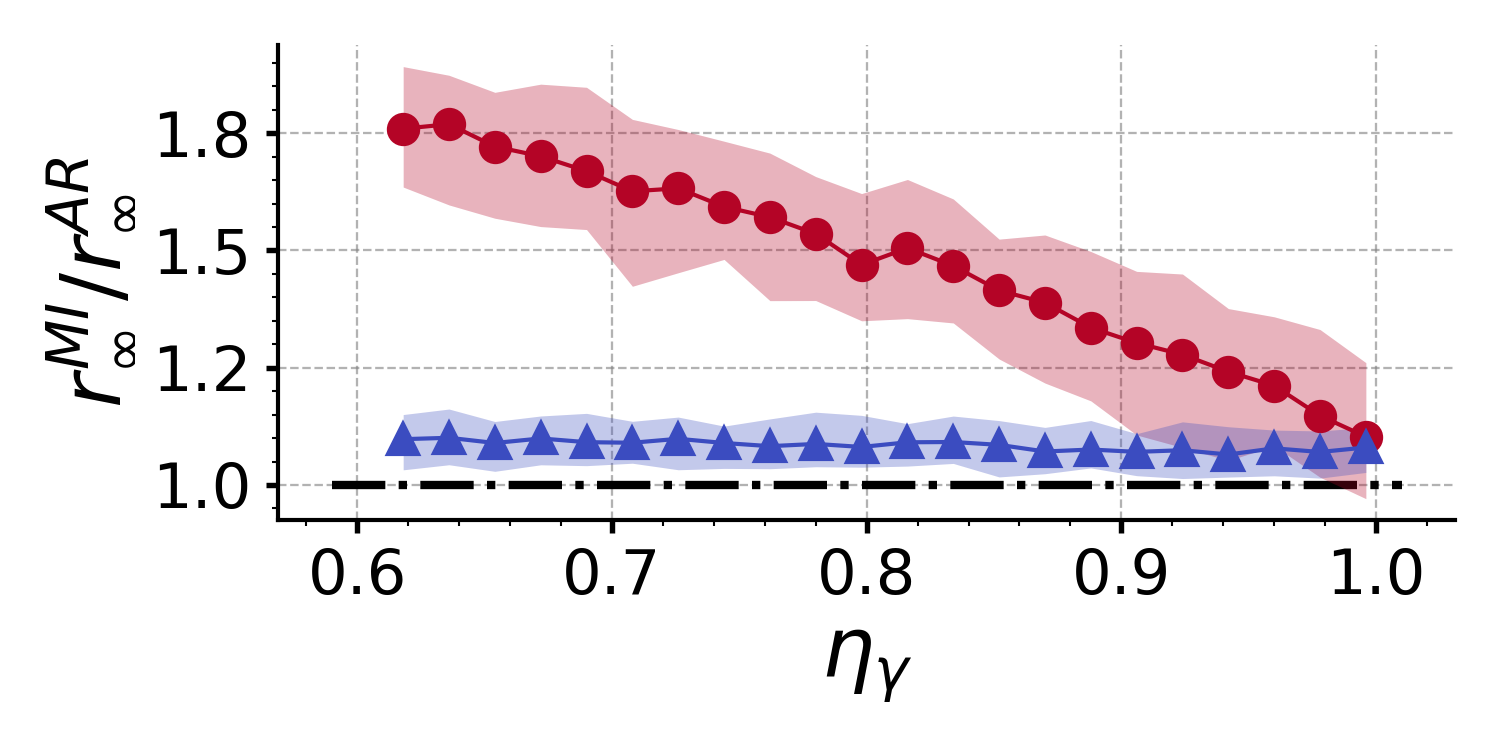
By comparing the y-scales of the two scenarios presented in Fig. 3-a-b, it is clear that the reduction of activity (AR) implies a lower epidemic size with respect to the increase of modularity (MI). We further investigate this point in Fig. 3-c. To compare these two very different kinds of behavioural change, we fix all the parameters and we study the ratio of the epidemic sizes as a function of modularity of susceptible nodes. In particular, we set , , , , and plot as a function of . In other words, we compare the epidemic size obtained when of nodes reduce activity with what happens when they increase network modularity. The first observation is that, both in case of random and activity-based adoption, the MI strategy leads to higher epidemic sizes. Indeed, the obtained ratio is always greater than one. However, while in the case of random adoption increasing the modularity of susceptible nodes has a strong effect on the epidemic size (which progressively decreases), this effect is not observed in case of activity-based adoption. This result further confirms how the spreading patterns are largely controlled by nodes in high activity classes that do not comply with the social distancing measures.

IV Conclusions
In this work, we studied the effects of self-initiated behavioural change on disease resurgence using activity-driven networks as a modeling framework for social interactions. We imagined a population that experienced a first wave of infections that was stopped early through strict top-down interventions and did not develop significant immunity to prevent a second wave. We focused on the reactions of individuals’ that, when restrictions are lifted, may adopt behavioural measures aimed at protecting themselves by reducing or changing their social interactions. As we write, this scenario is unfortunately extremely realistic and concerning: after the easing of the strict measures established during spring 2020, most Western countries are now facing the second wave of the COVID-19 pandemic.
More in detail, we modeled behavioural change by reducing the activity of susceptible and infected individuals and, having in mind the idea of social bubbles, by increasing the share of connections within tight social circles with respect to their baseline. In doing so, we explored the effect of behaviour adoption by considering only a fraction of nodes engaging in behavioural protective measures selected either at random or as function of their activity. In fact, the most socially active nodes, maybe due to the nature of their job, cannot easily modify their behaviours.
Considering first the simplest version of activity-driven networks, where links are memory-less and random, we derived the analytical threshold of a Susceptible-Infected-Recovered epidemic model. In doing so, we extended the work done by Rizzo et al Rizzo et al. (2014) accounting for non-perfect adoption. Interestingly, in case nodes adapting their behaviours are selected randomly in the population, we found that the expression for the basic reproductive number is symmetrical in a combination of activity reduction and level of adoption of susceptible and infected. Given the high socio-economic cost associated with isolating large numbers of people, this finding underlines the importance of efficient isolation of the infected, especially at the beginning of a possible second wave when their number is relatively small. Furthermore, the numerical simulations showed that, in the settings considered, the final epidemic size was mainly dependent on the reduction in activity of the infected.
In case adherence is assigned in increasing order of activity, we found that an almost perfect level of adoption is needed in order to avoid the disease to rise again. This effect is deeply connected to the high heterogeneity of human interactions, and it highlights that even small levels of lack of adoption by very active nodes may have a huge impact on the spreading. Furthermore, this finding is in line with previous studies of targeted immunization strategies on time-varying networks which show how immunizing the most highly active nodes is extremely effective in hampering the spreading of contagion phenomena Liu et al. (2014); Vestergaard et al. (2014); Masuda and Holme (2017); Wang et al. (2016).
We then moved to even more realistic scenarios, taking into account the tendency of people to cluster in tightly connected groups. To this aim, we considered a modified formulation of the activity-driven model in which nodes are assigned to communities and tend to establish links inside their community more often than with outside nodes Nadini et al. (2018). In this setting, we modeled behavioural change by considering two mechanisms: i) reducing the activity of nodes and ii) keeping the same level of activity but limiting the contacts outside communities and thus increase network’s modularity. Using numerical simulations, we observed that the modularity of the network increases the threshold with respect to the previous case. This is in line with past observations on synthetic and real time-varying networks Nadini et al. (2018); Onnela et al. (2007); Karsai et al. (2011); Salathé and Jones (2010); Stegehuis et al. (2016); Davis et al. (2020); Han et al. (2015). Furthermore, random adoption is characterized by a larger threshold and a smaller epidemic size with respect to the case of adoption assigned in increasing order of activity. Finally, we found that an activity reduction strategy is more efficient than increasing the modularity across the range of parameters studied. This finding highlights how imperfect social bubbles might not be as effective as an overall reduction of social activities.
Of course, this work comes with limitations. First of all, our contribution is only theoretical and limited by the set of assumptions that were made. As such, it should not be indented as a precise representation of reality and especially of the current pandemic landscape. Although we focused on some fundamental features of realistic epidemiological models (e.g. heterogeneity of contacts, modularity, behavioural change), we overlooked many others such as including several connected populations, considering an age-structured population and the complex nature of real self-initiated behavioural change Rosenstock (1974); Hochbaum (1958); Hayden (2013); Funk et al. (2010); Verelst et al. (2016); St-Onge et al. (2020). We have limited ourselves to an exploration of the phase space rather than fitting the parameters using real data. Furthermore, we have neglected high-order complex temporal dynamics of real time-varying networks Lambiotte et al. (2019); Battiston et al. (2020); Petri and Barrat (2018). We leave these extensions and model calibration for the future.
In conclusion, our work contributes to the characterization of self-initiated behavioural change in the context of disease resurgence on time-varying networks. It highlights the importance of accounting for the heterogeneity of social activation patterns when gauging the efficiency of adaptive strategies aimed at hampering the spreading of infectious diseases on temporal networks.
Acknowledgements
All authors thank the High Performance Computing facilities at Greenwich University. N.G. acknowledges support from the Doctoral Training Alliance.
References
- Funk et al. (2010) S. Funk, M. Salathé, and V. A. A. Jansen, Journal of The Royal Society Interface 7, 1247 (2010), https://royalsocietypublishing.org/doi/pdf/10.1098/rsif.2010.0142 .
- Verelst et al. (2016) F. Verelst, L. Willem, and P. Beutels, Journal of The Royal Society Interface 13 (2016), 10.1098/rsif.2016.0820, https://royalsocietypublishing.org/doi/pdf/10.1098/rsif.2016.0820 .
- Funk et al. (2015) S. Funk, S. Bansal, C. T. Bauch, K. T. Eames, W. J. Edmunds, A. P. Galvani, and P. Klepac, Epidemics 10, 21 (2015), challenges in Modelling Infectious DIsease Dynamics.
- Gross and Blasius (2008) T. Gross and B. Blasius, Journal of the Royal Society Interface 5, 259 (2008).
- Marceau et al. (2010) V. Marceau, P.-A. Noël, L. Hébert-Dufresne, A. Allard, and L. J. Dubé, Physical Review E 82, 036116 (2010).
- Rosenstock (1974) I. M. Rosenstock, Health Education Monographs 2, 354 (1974), https://doi.org/10.1177/109019817400200405 .
- Hochbaum (1958) G. Hochbaum, Public Participation in Medical Screening Programs: A Socio-psychological Study, Public Health Service publication (U.S. Department of Health, Education, and Welfare, Public Health Service, Bureau of State Services, Division of Special Health Services, Tuberculosis Program, 1958).
- West et al. (2020) R. West, S. Michie, G. J. Rubin, and R. Amlôt, Nature Human Behaviour , 1 (2020).
- Gozzi et al. (2020) N. Gozzi, D. Perrotta, D. Paolotti, and N. Perra, PLoS computational biology 16, e1007879 (2020).
- Guzzetta et al. (2020) G. Guzzetta, F. Riccardo, V. Marziano, P. Poletti, F. Trentini, A. Bella, X. Andrianou, M. Del Manso, M. Fabiani, S. Bellino, et al., arXiv preprint arXiv:2004.12338 (2020).
- Perra et al. (2011) N. Perra, D. Balcan, B. Gonçalves, and A. Vespignani, PloS one 6 (2011).
- Moinet et al. (2018) A. Moinet, R. Pastor-Satorras, and A. Barrat, Physical Review E 97, 012313 (2018).
- Meloni et al. (2011) S. Meloni, N. Perra, A. Arenas, S. Gómez, Y. Moreno, and A. Vespignani, Scientific reports 1, 62 (2011).
- Chinazzi et al. (2020) M. Chinazzi, J. T. Davis, M. Ajelli, C. Gioannini, M. Litvinova, S. Merler, A. P. y Piontti, K. Mu, L. Rossi, K. Sun, et al., Science (2020).
- Kraemer et al. (2020) M. U. Kraemer, C.-H. Yang, B. Gutierrez, C.-H. Wu, B. Klein, D. M. Pigott, L. du Plessis, N. R. Faria, R. Li, W. P. Hanage, et al., Science 368, 493 (2020).
- Hébert-Dufresne et al. (2020) L. Hébert-Dufresne, D. Mistry, and B. M. Althouse, arXiv preprint arXiv:2003.10604 (2020).
- Granell et al. (2013) C. Granell, S. Gómez, and A. Arenas, Physical review letters 111, 128701 (2013).
- Mancastroppa et al. (2020) M. Mancastroppa, R. Burioni, V. Colizza, and A. Vezzani, arXiv preprint arXiv:2004.07902 (2020).
- Gross et al. (2006) T. Gross, C. J. D. D’Lima, and B. Blasius, Physical review letters 96, 208701 (2006).
- Rizzo et al. (2014) A. Rizzo, M. Frasca, and M. Porfiri, Physical Review E 90, 042801 (2014).
- Wang et al. (2016) Z. Wang, C. T. Bauch, S. Bhattacharyya, A. d’Onofrio, P. Manfredi, M. Perc, N. Perra, M. Salathé, and D. Zhao, Physics Reports 664, 1 (2016).
- Herzog et al. (2020) S. Herzog, J. De Bie, S. Abrams, I. Wouters, E. Ekinci, L. Patteet, A. Coppens, S. De Spiegeleer, P. Beutels, P. Van Damme, N. Hens, and H. Theeten, medRxiv (2020), 10.1101/2020.06.08.20125179, https://www.medrxiv.org/content/early/2020/06/09/2020.06.08.20125179.full.pdf .
- Stringhini et al. (2020) S. Stringhini, A. Wisniak, G. Piumatti, A. S. Azman, S. A. Lauer, H. Baysson, D. De Ridder, D. Petrovic, S. Schrempft, K. Marcus, I. Arm-Vernez, S. Yerly, O. Keiser, S. Hurst, K. Posfay-Barbe, D. Trono, D. Pittet, L. Getaz, F. Chappuis, I. Eckerle, N. Vuilleumier, B. Meyer, A. Flahault, L. Kaiser, and I. Guessous, medRxiv (2020), 10.1101/2020.05.02.20088898, https://www.medrxiv.org/content/early/2020/05/06/2020.05.02.20088898.full.pdf .
- O’Driscoll et al. (2020) M. O’Driscoll, G. R. Dos Santos, L. Wang, D. A. Cummings, A. S. Azman, J. Paireau, A. Fontanet, S. Cauchemez, and H. Salje, Nature (2020).
- Holme and Saramäki (2012) P. Holme and J. Saramäki, Physics reports 519, 97 (2012).
- Holme (2015) P. Holme, The European Physical Journal B 88, 234 (2015).
- Masuda and Holme (2017) N. Masuda and P. Holme, Temporal network epidemiology (Springer, 2017).
- Perra et al. (2012a) N. Perra, B. Gonçalves, R. Pastor-Satorras, and A. Vespignani, Scientific reports 2, 469 (2012a).
- Karsai et al. (2014) M. Karsai, N. Perra, and A. Vespignani, Scientific reports 4, 4001 (2014).
- Ubaldi et al. (2016) E. Ubaldi, N. Perra, M. Karsai, A. Vezzani, R. Burioni, and A. Vespignani, Scientific reports 6, 35724 (2016).
- Ubaldi et al. (2017) E. Ubaldi, A. Vezzani, M. Karsai, N. Perra, and R. Burioni, Scientific reports 7, 46225 (2017).
- Alessandretti et al. (2017) L. Alessandretti, K. Sun, A. Baronchelli, and N. Perra, Physical Review E 95, 052318 (2017).
- Nadini et al. (2018) M. Nadini, K. Sun, E. Ubaldi, M. Starnini, A. Rizzo, and N. Perra, Scientific reports 8, 1 (2018).
- Ribeiro et al. (2013) B. Ribeiro, N. Perra, and A. Baronchelli, Scientific reports 3, 3006 (2013).
- Tomasello et al. (2014) M. V. Tomasello, N. Perra, C. J. Tessone, M. Karsai, and F. Schweitzer, Scientific reports 4, 5679 (2014).
- Keeling and Rohani (2011) M. J. Keeling and P. Rohani, Modeling infectious diseases in humans and animals (Princeton University Press, 2011).
- Fortunato (2010) S. Fortunato, Physics reports 486, 75 (2010).
- Brett et al. (2019) T. Brett, G. Loukas, Y. Moreno, and N. Perra, Physical Review E 99, 050303 (2019).
- Starnini and Pastor-Satorras (2013) M. Starnini and R. Pastor-Satorras, Physical Review E 87, 062807 (2013).
- Onnela et al. (2007) J.-P. Onnela, J. Saramäki, J. Hyvönen, G. Szabó, D. Lazer, K. Kaski, J. Kertész, and A.-L. Barabási, Proceedings of the national academy of sciences 104, 7332 (2007).
- Karsai et al. (2011) M. Karsai, M. Kivelä, R. K. Pan, K. Kaski, J. Kertész, A.-L. Barabási, and J. Saramäki, Physical Review E 83, 025102 (2011).
- Miritello et al. (2011) G. Miritello, E. Moro, and R. Lara, Physical Review E 83, 045102 (2011).
- Perra et al. (2012b) N. Perra, A. Baronchelli, D. Mocanu, B. Gonçalves, R. Pastor-Satorras, and A. Vespignani, Physical review letters 109, 238701 (2012b).
- Liu et al. (2014) S. Liu, N. Perra, M. Karsai, and A. Vespignani, Phys. Rev. Lett. 112, 118702 (2014).
- Davis et al. (2020) J. T. Davis, N. Perra, Q. Zhang, Y. Moreno, and A. Vespignani, Nature Physics 16, 590 (2020).
- Starnini and Pastor-Satorras (2014) M. Starnini and R. Pastor-Satorras, Physical Review E 89, 032807 (2014).
- Zino et al. (2016) L. Zino, A. Rizzo, and M. Porfiri, Physical review letters 117, 228302 (2016).
- Zino et al. (2017) L. Zino, A. Rizzo, and M. Porfiri, Journal of Complex Networks 5, 924 (2017).
- Pastor-Satorras et al. (2015) R. Pastor-Satorras, C. Castellano, P. Van Mieghem, and A. Vespignani, Reviews of modern physics 87, 925 (2015).
- Sun et al. (2015) K. Sun, A. Baronchelli, and N. Perra, The European Physical Journal B 88, 1 (2015).
- Tizzani et al. (2018) M. Tizzani, S. Lenti, E. Ubaldi, A. Vezzani, C. Castellano, and R. Burioni, Physical Review E 98, 062315 (2018).
- Leng et al. (2020) T. Leng, C. Whie, J. Hilton, A. J. Kucharski, L. J. Pellis, H. Stage, N. G. Davies, M. J. Keeling, and S. Flasche, medRxiv (2020).
- Salathé and Jones (2010) M. Salathé and J. H. Jones, PLoS Comput Biol 6, e1000736 (2010).
- Stegehuis et al. (2016) C. Stegehuis, R. Van Der Hofstad, and J. S. Van Leeuwaarden, Scientific reports 6, 1 (2016).
- Scarpino et al. (2016) S. V. Scarpino, A. Allard, and L. Hébert-Dufresne, Nature Physics 12, 1042 (2016).
- Vestergaard et al. (2014) C. L. Vestergaard, M. Génois, and A. Barrat, Physical Review E 90, 042805 (2014).
- Han et al. (2015) D. Han, M. Sun, and D. Li, Physica A: Statistical Mechanics and its Applications 432, 354 (2015).
- Hayden (2013) J. Hayden, Introduction to Health Behavior Theory (Jones & Bartlett Learning, 2013).
- St-Onge et al. (2020) G. St-Onge, V. Thibeault, A. Allard, L. J. Dubé, and L. Hébert-Dufresne, arXiv preprint arXiv:2003.05924 (2020).
- Lambiotte et al. (2019) R. Lambiotte, M. Rosvall, and I. Scholtes, Nature physics 15, 313 (2019).
- Battiston et al. (2020) F. Battiston, G. Cencetti, I. Iacopini, V. Latora, M. Lucas, A. Patania, J.-G. Young, and G. Petri, Physics Reports (2020).
- Petri and Barrat (2018) G. Petri and A. Barrat, Physical review letters 121, 228301 (2018).