The SAMI Galaxy Survey: Stellar Populations of Passive Spiral Galaxies in different environments
Abstract
We investigate the stellar populations of passive spiral galaxies as a function of mass and environment, using integral field spectroscopy data from the Sydney-AAO Multi-object Integral field spectrograph Galaxy Survey. Our sample consists of cluster passive spirals and group/field passive spirals, as well as a set of S0s used as a control sample. The age and [Z/H] estimated by measuring Lick absorption line strength indices both at the center and within do not show a significant difference between the cluster and the field/group passive spirals. However, the field/group passive spirals with log(M⋆/M show decreasing [/Fe] along with stellar mass, which is dex smaller than that of the cluster passive spirals. We also compare the stellar populations of passive spirals with S0s. In the clusters, we find that passive spirals show slightly younger age and lower [/Fe] than the S0s over the whole mass range. In the field/group, stellar populations show a similar trend between passive spirals and S0s. In particular, [/Fe] of the field/group S0s tend to be flattening with increasing mass above log(M⋆/M, similar to the field/group passive spirals. We relate the age and [/Fe] of passive spirals to their mean infall time in phase-space; we find a positive correlation, in agreement with the prediction of numerical simulations. We discuss the environmental processes that can explain the observed trends. The results lead us to conclude that the formation of the passive spirals and their transformation into S0s may significantly depend on their environments.
1. Introduction
Stellar populations of nearby galaxies allow us to better understand the formation histories of galaxies. Red galaxies, which are generally non star-forming, are more likely to be spheroid dominated, whereas blue galaxies, young and star-forming, are more likely to be disk dominated, and to have spiral arms (e.g. Humason 1936; Fioc & Rocca-Volmerange 1999; Bershady et al. 2000; Mignoli et al. 2009). There is however a population of galaxies that bridges both classes: passive spirals are red and quiescent, yet have prominent spiral patterns typical of star-forming galaxies (e.g. van den Bergh 1976; Wilkerson 1980; Bothun & Sullivan 1980; Phillipps 1988; Cayatte et al. 1994). After the discovery of ‘anemic’ spiral galaxies in the Virgo cluster by van den Bergh (1976) and a significant number of passive spirals with apparently no/weak sign of ongoing star formation have been found in all environments, both at low and high redshift. The formation and evolution of these galaxies have received considerable attention observationally and theoretically (e.g. Couch et al. 1998; Dressler et al. 1999; Poggianti et al. 1999; Bekki et al. 2002; Goto et al. 2003; Yamauchi & Goto 2004; Moran et al. 2006; Cortese & Hughes 2009; Hughes & Cortese 2009; Lee et al. 2008; Mahajan & Raychaudhury 2009; Wolf et al. 2009; Masters et al. 2010; Fraser-McKelvie et al. 2016; Fraser-McKelvie et al. 2018; Pak et al. 2019). Despite this large number of studies, several questions still remain debated, such as (1) the origin(s) of passive spirals, (2) physical processes responsible for shutting down star formation without destroying their spiral structures, and (3) evolutionary connections with S0s.
The existence of passive spirals may be the evidence for the morphological transformation of spirals into S0s. The numerical simulations from Bekki et al. (2002) show how cluster environmental quenching processes can transform spirals into S0s, passing through an intermediate passive spiral phase. The spiral arm structures fade over several Gyrs, after the gas is stripped. However, they also claim that the passive spirals are found anywhere from galaxies in isolation to the centers of clusters, and hence that no single mechanism can completely explain their origin.
Goto et al. (2003) suggested that the formation of passive spirals in the intermediate to high-density environments is closely related with cluster environmental effects: ram pressure stripping (Gunn & Gott, 1972), harassment (Moore et al., 1999), thermal evaporation (Cowie & Songaila, 1977), strangulation (Larson et al. 1980), galaxy-galaxy interactions including major (Toomre & Toomre, 1972) and minor (Walker et al., 1996) mergers and tidal interactions.
Secular evolution possibly caused by a bar is another possible mechanism for quenching spiral galaxies (Kormendy & Kennicutt 2004; Athanassoula 2013), which may convert them into S0s. Bars are common structures in disk galaxies in the local universe. Recent work on the bars of nearby disk galaxies suggests that the bar fraction is up to in the optical bands (Marinova & Jogee 2007; Reese et al. 2007; Barazza et al. 2008). The fraction rises to in near-infrared studies (Knapen et al. 2000; Menéndez-Delmestre et al. 2007). While all of these devoted studies have drawn attention to passive spirals, it is still under debate which is the dominant pathway of evolution from the passive spirals to S0s.
To find the evolutionary connections between passive spirals and S0s in the perspective of stellar populations, Pak et al. (2019) investigated nine passive spirals using the Calar Alto Legacy Integral Field Area (CALIFA) survey (Sánchez et al. 2012; Husemann et al. 2013). When comparing stellar populations (see figures 5 and 7 in Pak et al. 2019), the S0s were found to have a wider range of age, metallicity and -abundance than the passive spirals at all radii out to . The stellar populations of passive spirals were fully encompassed within the spread of the S0 stellar populations, although the distributions of the passive spirals appeard skewed toward younger ages, higher metallicities, and lower -abundances. However, the environmental dependence was weakly constrained because the number of passive spirals was too small. Thus, investigating the environments of passive spirals using a larger sample may provide further constraints on their quenching mechanisms.
Here, we investigate the spatially resolved stellar populations of passive spirals as a function of their environment using the Sydney-Australian Astronomical Observatory Multi-object Integral Field Spectrograph (SAMI; Croom et al. 2012) Galaxy Survey (Bryant et al., 2015) and the Galaxy and Mass Assembly (GAMA; Driver et al. 2011; Hopkins et al. 2013) survey. In this study, we aim to explore the environmental dependence of the formation and evolution of passive spirals and their evolutionary connections with S0s, and to provide further constraints on the quenching mechanisms.
This paper is organized as follows. Section 2 describes the galaxy samples and the analysis methods. The stellar population properties of passive spirals depending on environments and the comparison with S0s are shown in Section 3. The formation and evolution of passive spirals is discussed in Section 4. Finally, in Section 5, we summarize our results and draw conclusions. Throughout the paper we adopt a standard CDM cosmology with , , and km s-1 Mpc-1. All broadband data are given in the AB photometric system.
2. Data and Sample
The SAMI Galaxy Survey is a spatially-resolved spectroscopic survey for over galaxies in the redshift range of z . The SAMI instrument (Croom et al., 2012) using fused fiber bundles (Hexabundles, Bland-Hawthorn et al. 2011; Bryant et al. 2014) is mounted at the prime focus on the m Anglo-Australian Telescope at Siding Spring Observatory in Australia. SAMI fibers are fed to the double-beam AAOmega spectrograph (Saunders et al. 2004; Smith et al. 2004; Sharp et al. 2006). Details of the galaxy sample of SAMI Galaxy Survey are described in Bryant et al. (2015), and additional details of the cluster sample are described in Owers et al. (2017). Besides galaxies from eight clusters, over galaxies were targeted from the three GAMA regions centered on , and h right ascension at dec (G09, G12, and G15 regions; Driver et al. 2011). For all observed galaxies, the SAMI Galaxy Survey measured resolved optical properties such as star formation rate, age, metallicities, and stellar and ionized gas kinematics (van de Sande et al. 2017; Scott et al. 2018).
2.1. Sample Selection
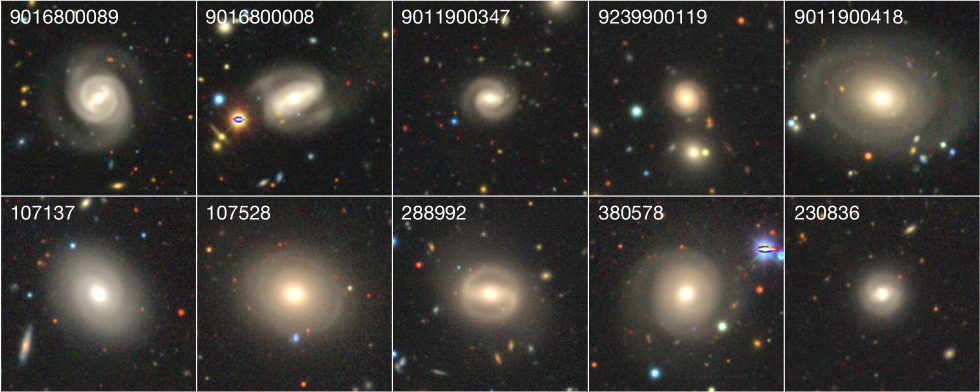
Firstly, the passive spirals are classified by visual inspection (MP and JHL) using composite color images from the fourteenth data release of the Sloan Digital Sky Survey (SDSS DR14; Abolfathi et al. 2018) and the Dark Energy Camera Legacy Survey (DECaLS; Dey et al. 2016) for the SAMI sample. We select red spiral galaxies with prominent red arms (e.g. and in Figure 1). We also select the galaxies in which the light distribution is not smooth and the arms are open (not a ring). In this case, the arms could be less prominent but still exist (e.g. and in Figure 1). The selected passive spirals are classified as from E to Early-spiral classes by Cortese et al. (2016). We removed the galaxies that are too inclined to tell if they have spiral arms or not, from the sample: in E () and E/S0 () classes, () in S0 class, () in S0/Early-spiral class, and ) in Early-spiral class. The galaxies showing clear dust lanes and star-forming arms are also excluded: () and () in S0/Early-spiral and Early-spiral classes, respectively. In addition, we removed the four candidates (out of galaxies from E to Early-spiral types) that appear distorted probably due to interactions with neighbors, for which the distinction between spiral arms and tidal features is ambiguous.
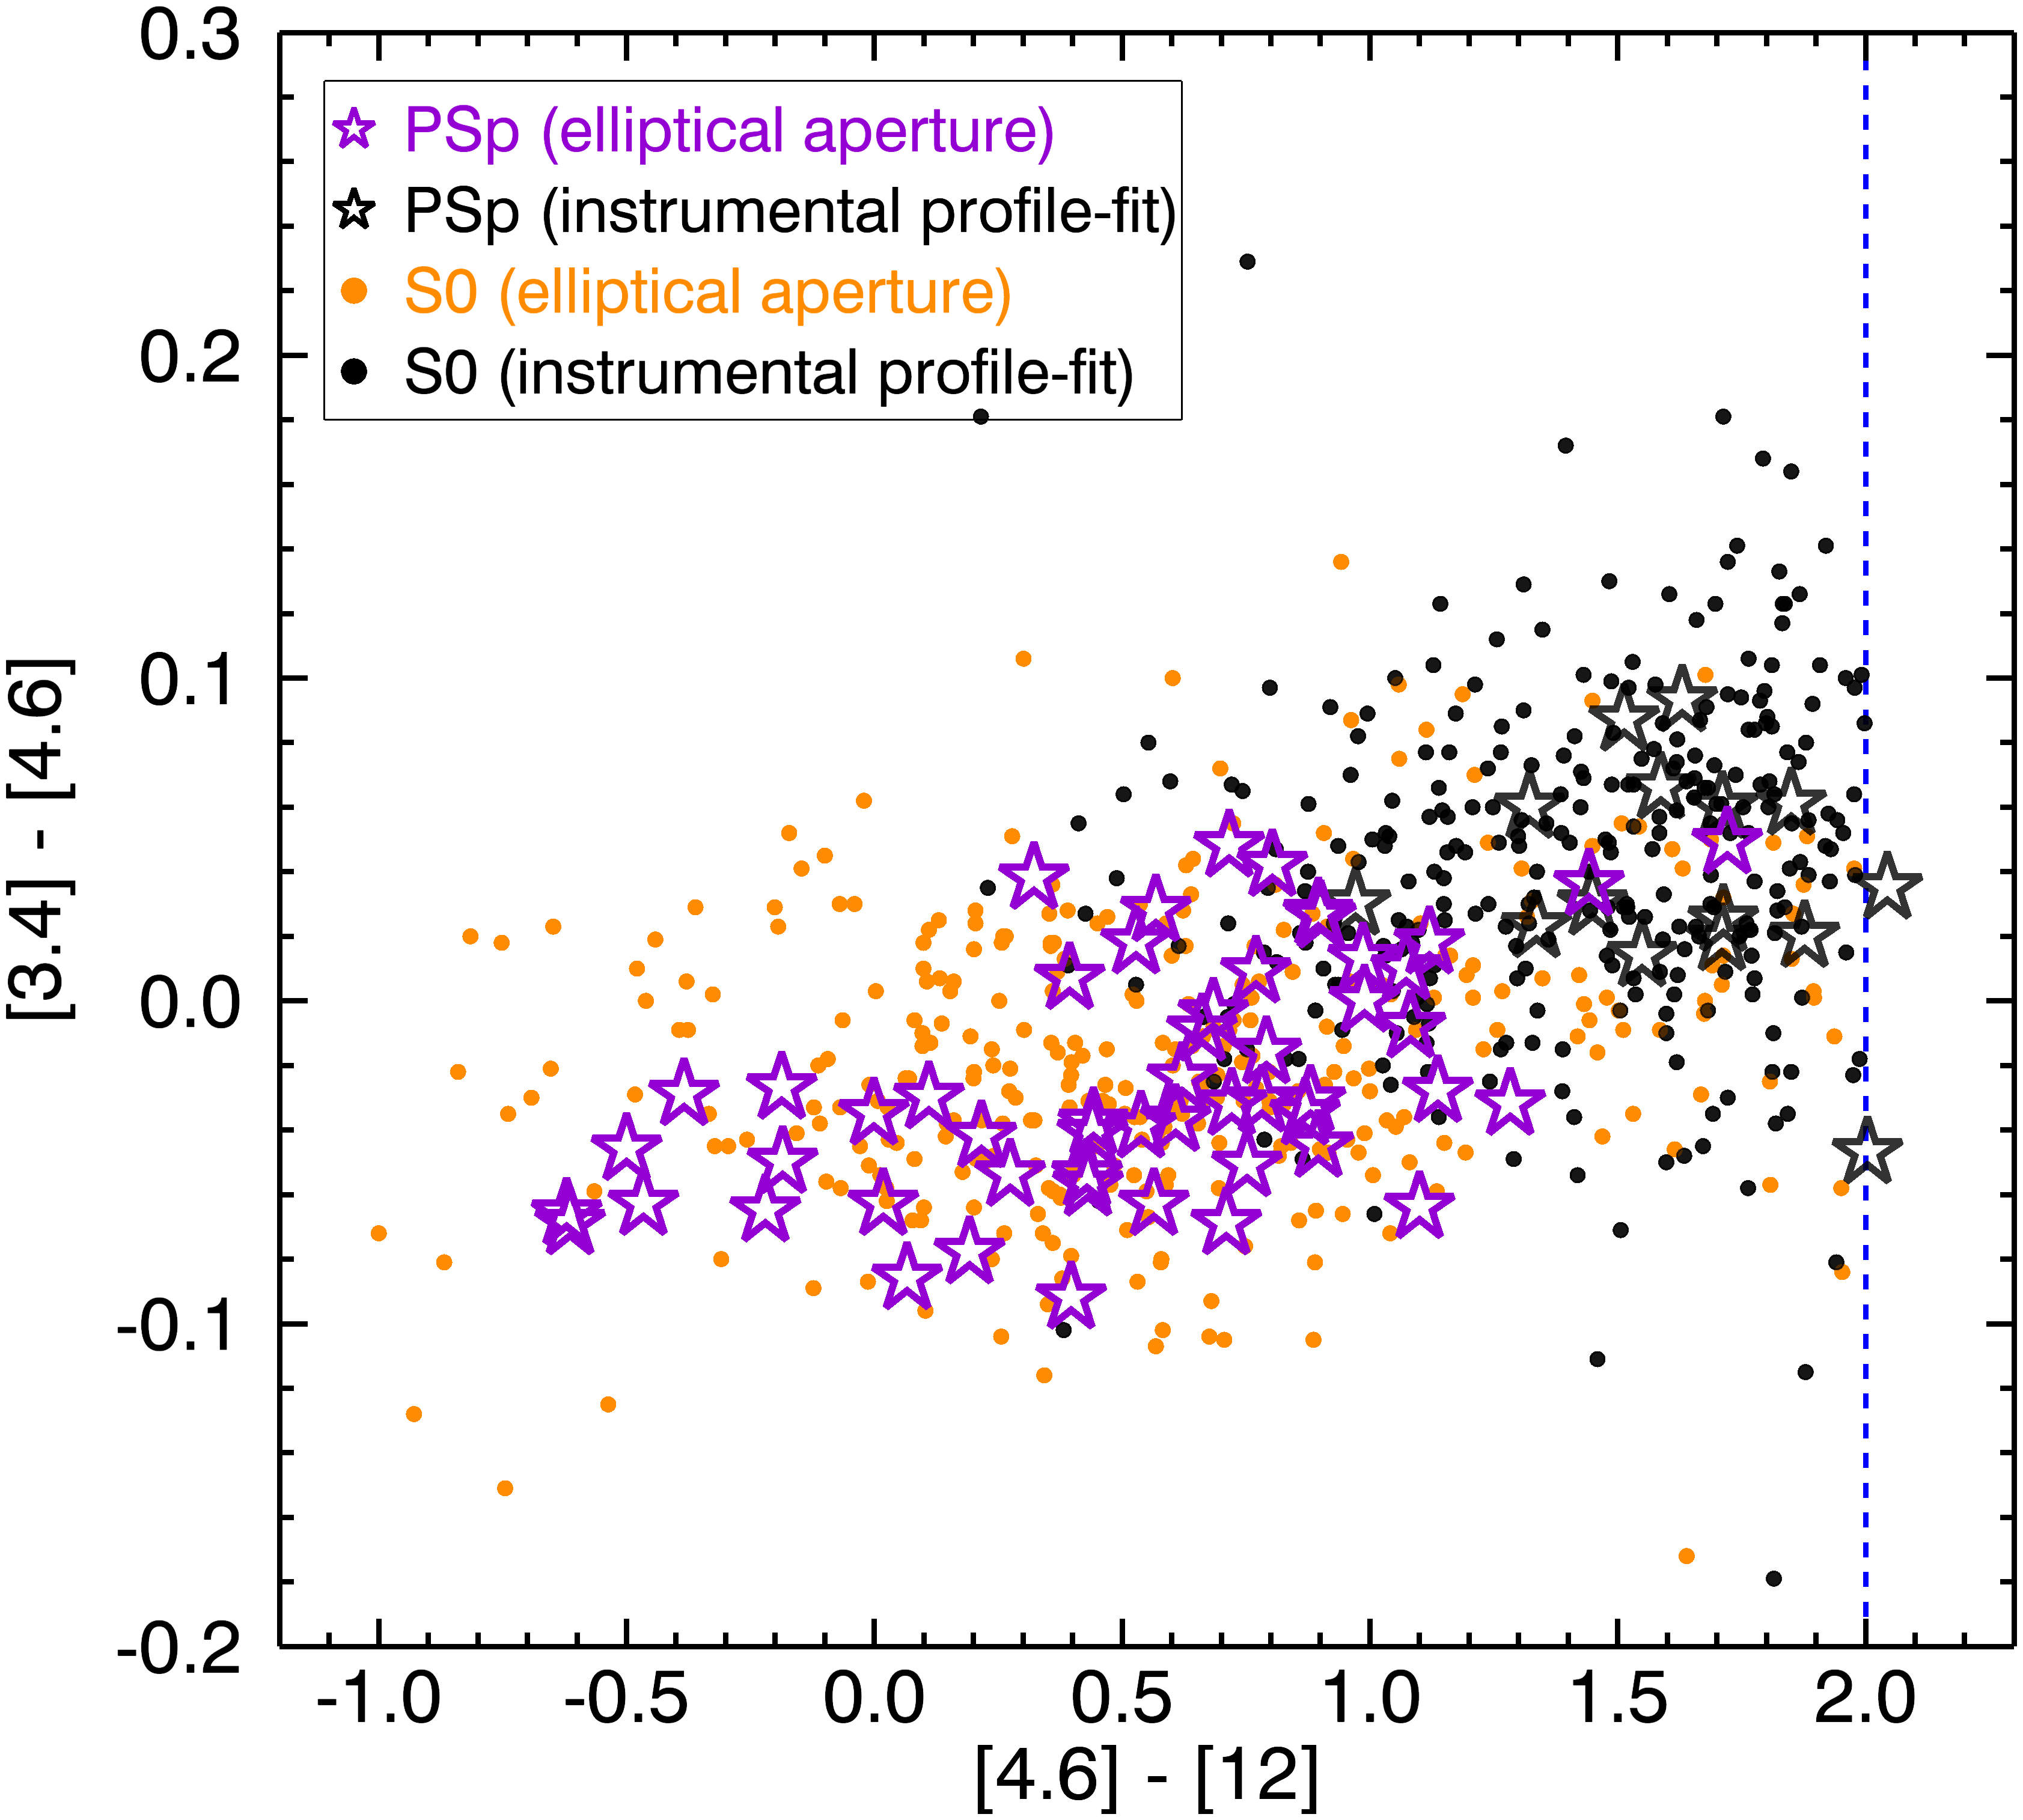
Secondly, the galaxies are selected with m and m using WISE colors (Jarrett et al., 2017), which is a good indicator for distinguishing quiescent galaxies and excluding optically red galaxies due to dust-obscured star formation (Figure 2). With these criteria, we find passive spirals: from the SAMI clusters and in the SAMI-GAMA regions (group/field environments), respectively. Several examples of the final sample are shown in Figure 1. In the finally selected passive spirals, most of passive spirals are classified as S0/Early-spiral and Early-spiral classes (; ). The rest are classified as E (4), E/S0 (8), S0 (7), and unknown (1) types. We identified weak spiral structures in the four galaxies classified as Es by Cortese et al. (2016).
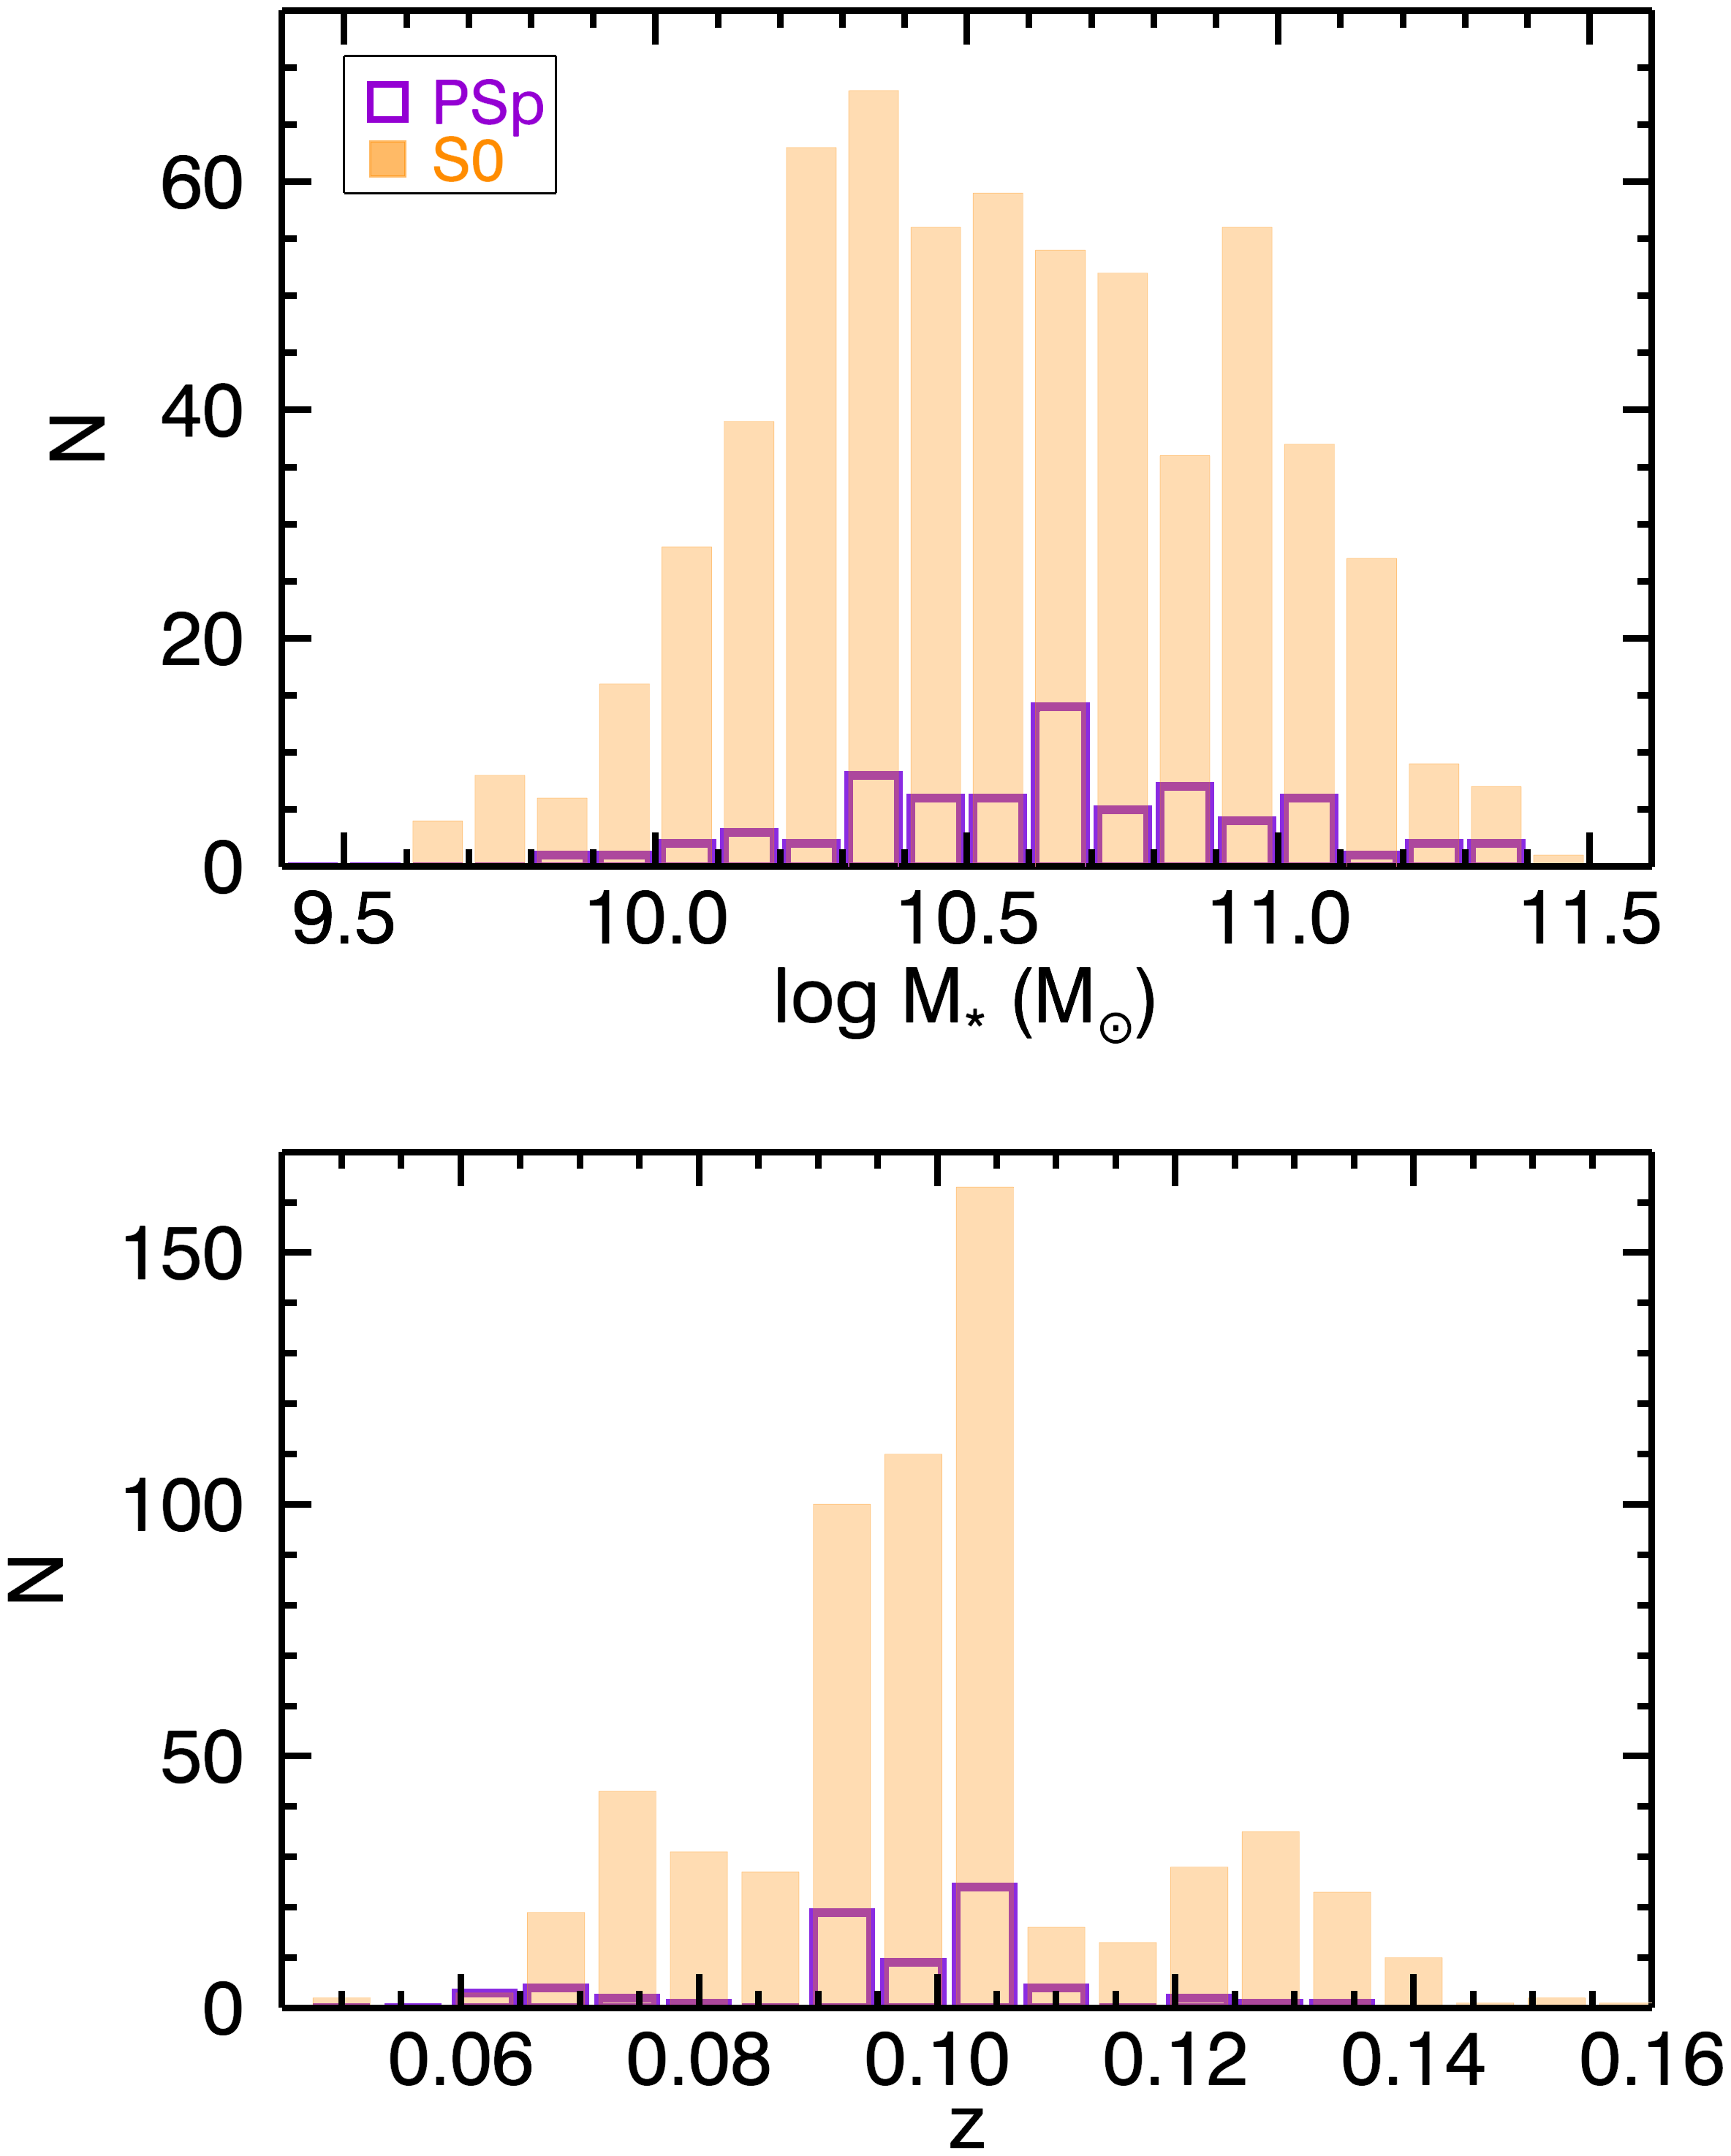
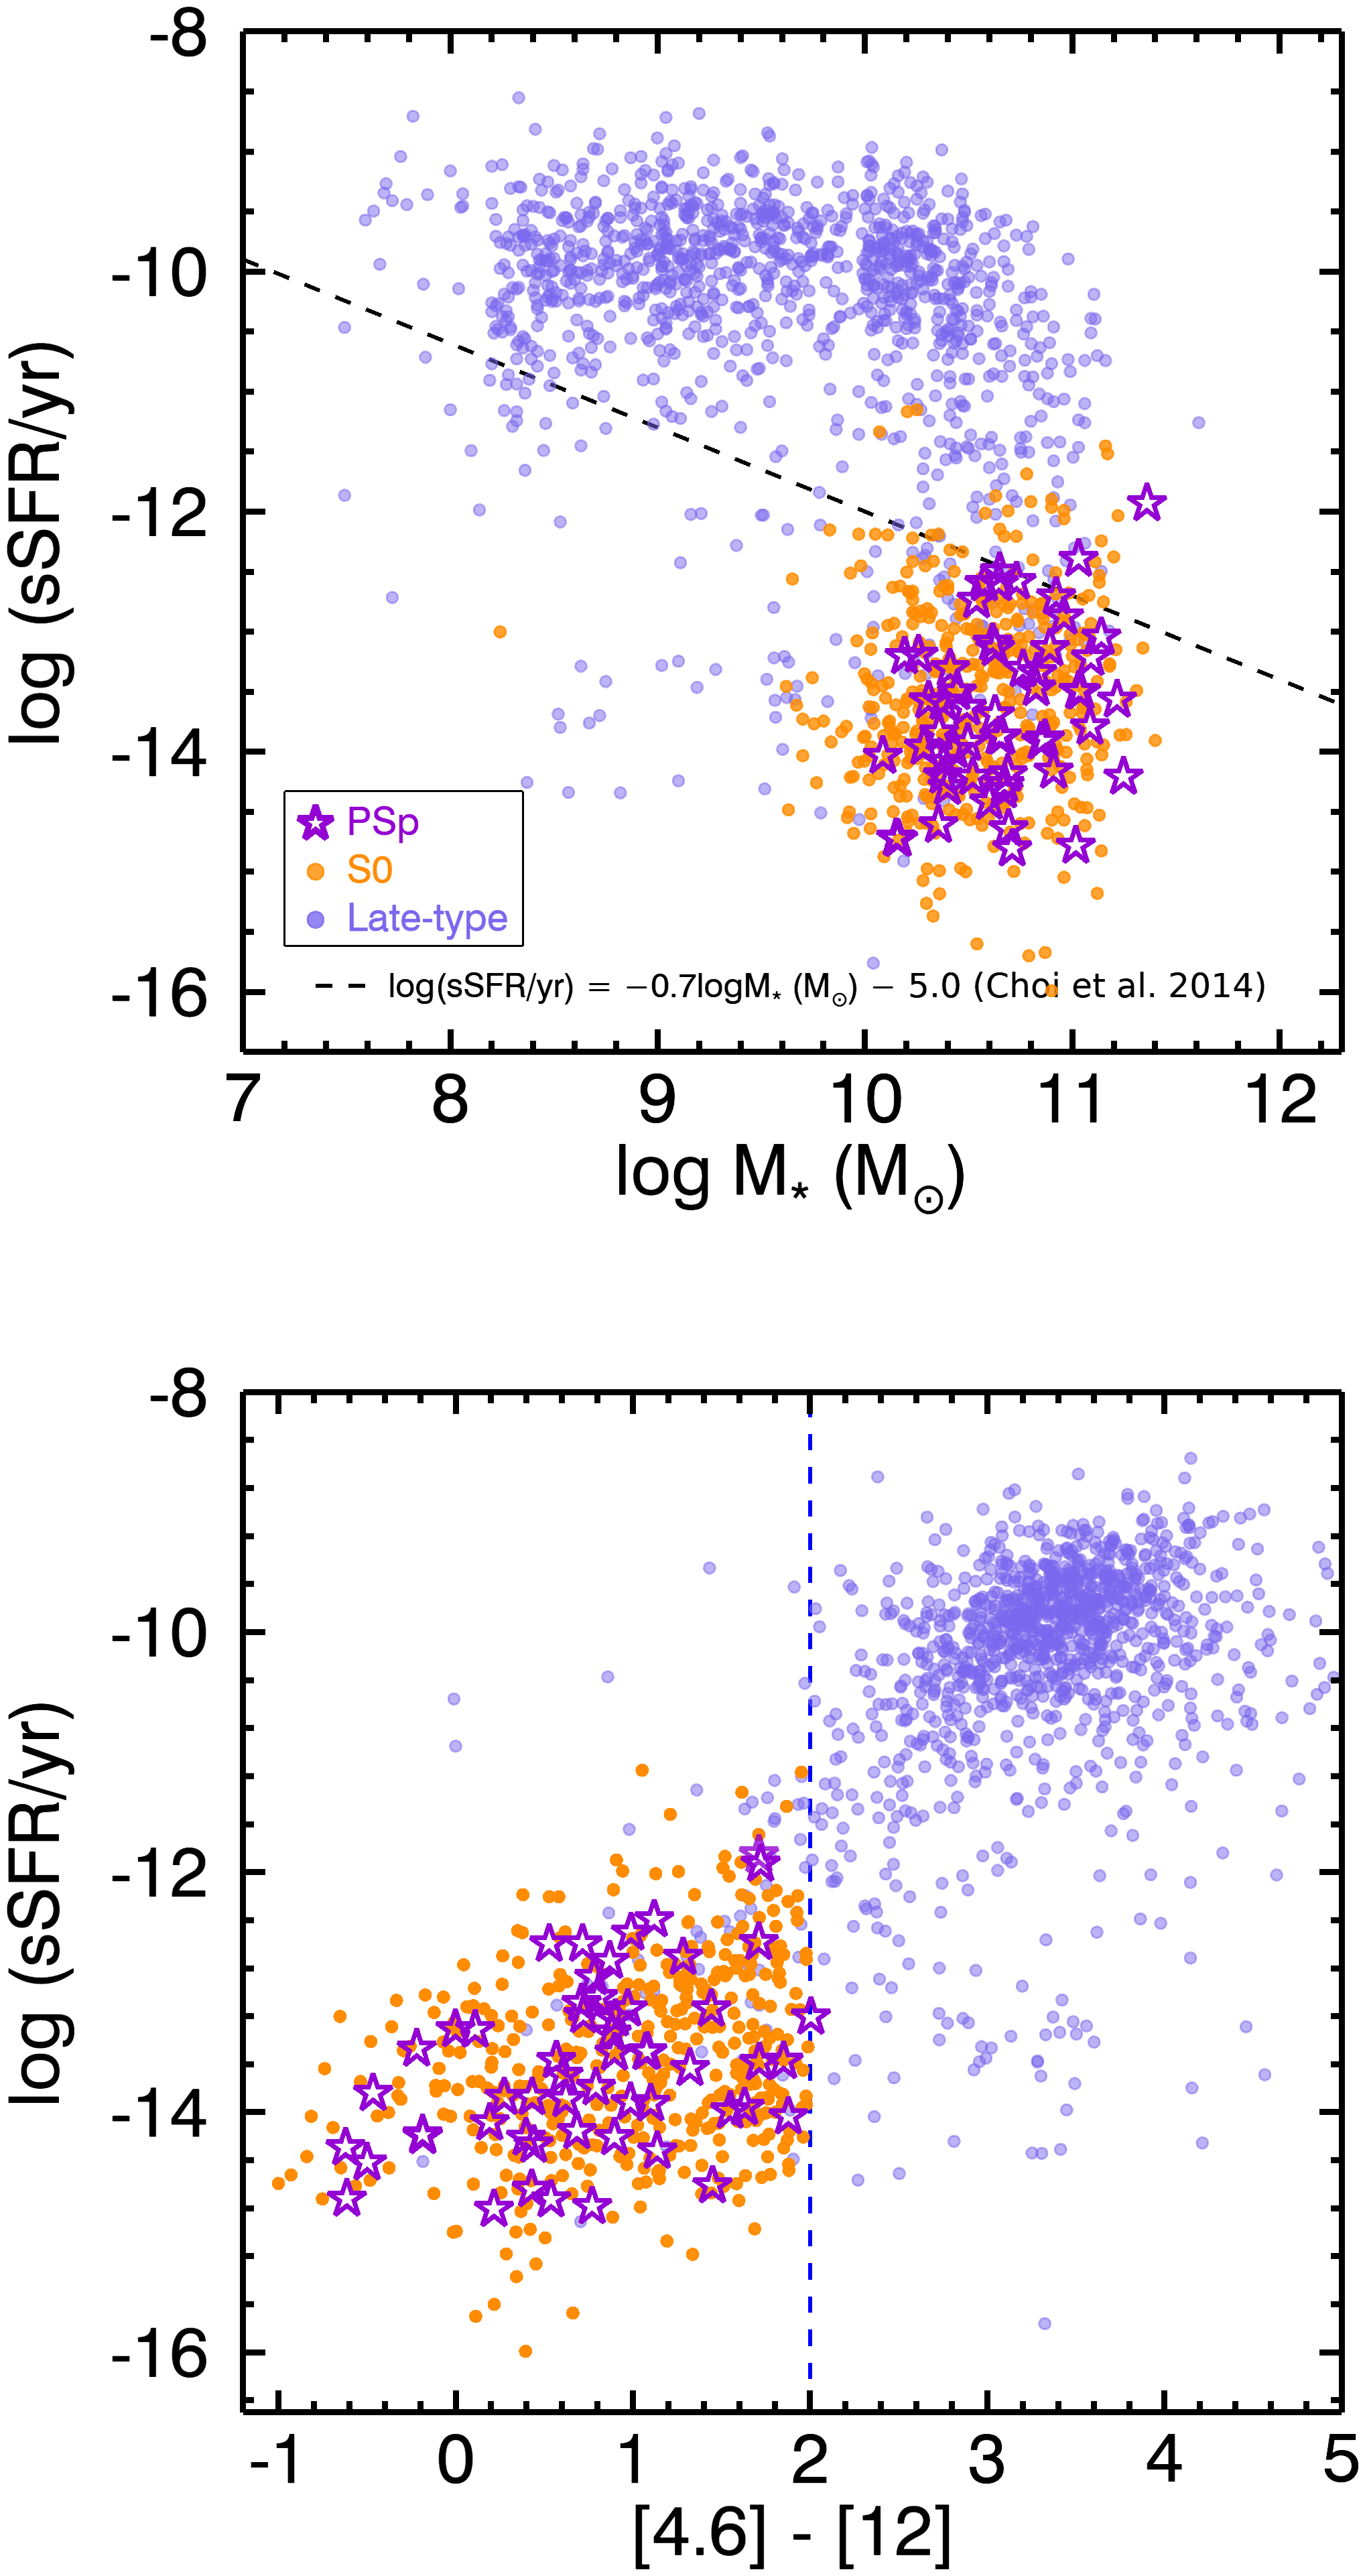
As a comparison sample, we select S0s by adopting the SAMI visual morphology classification (Cortese et al. 2016). In our analysis, the S0 comparison sample consists of E/S0, S0, and S0/Early-spiral subtypes. Our S0s are also controlled by their WISE colors in the same manner as our passive spirals (Figure 2), in order to strictly exclude star-forming S0s. Therefore, in the S0/Early-spiral subtype, the galaxies without arms and with no/weak star formation are classified as control S0 sample. Among all S0s, and are selected in the cluster and the GAMA regions, respectively. Hereafter, we refer to our sample as the ‘cluster passive spirals/S0s’ and the ‘field/group passive spirals/S0s’. Figure 3 presents the stellar mass and redshift distributions of the final sample. As seen in Figure 4, which presents specific star formation rate as a function of mass and the WISE [4.6]-[12] color, our final sample is mostly well distinguished from the star-forming late-type galaxies (blue circles). A few passive spirals and S0s above the threshold of quiescent galaxies (dashed line in the top panel of Figure 4) do not change our conclusion.
2.2. Measurements of the Stellar Population Properties
The measurements of stellar populations are obtained from Scott et al. (2017). The measured 20 Lick indices include five Balmer indices (H, H, H, H, H), six iron-dominated indices (Fe4383, Fe4531, Fe5015, Fe5270, Fe5335, Fe5406), four molecular indices (CN1, CN2, Mg1, Mg2) and five more indices in the SAMI blue wavelength range (Ca4227, G4300, Ca4455, C4668, Mg). Each index was measured from the observed spectrum after correcting for broadening and emission lines. Luminosity-weighted simple stellar population-equivalent age, metallicity and -abundance ratio were measured by using the minimization method (Proctor et al., 2004) fitted to the stellar population models of Schiavon (2007) and Thomas et al. (2011). The full details of the analysis are in section 3 of Scott et al. (2018). We adopt the measurements within a arcsec diameter aperture (center) and within an elliptical aperture with a major axis radius of . The arcsec diameter mostly corresponds to less than half for passive spirals.
3. Results
3.1. Passive spiral galaxies: comparison between cluster and field/group environments
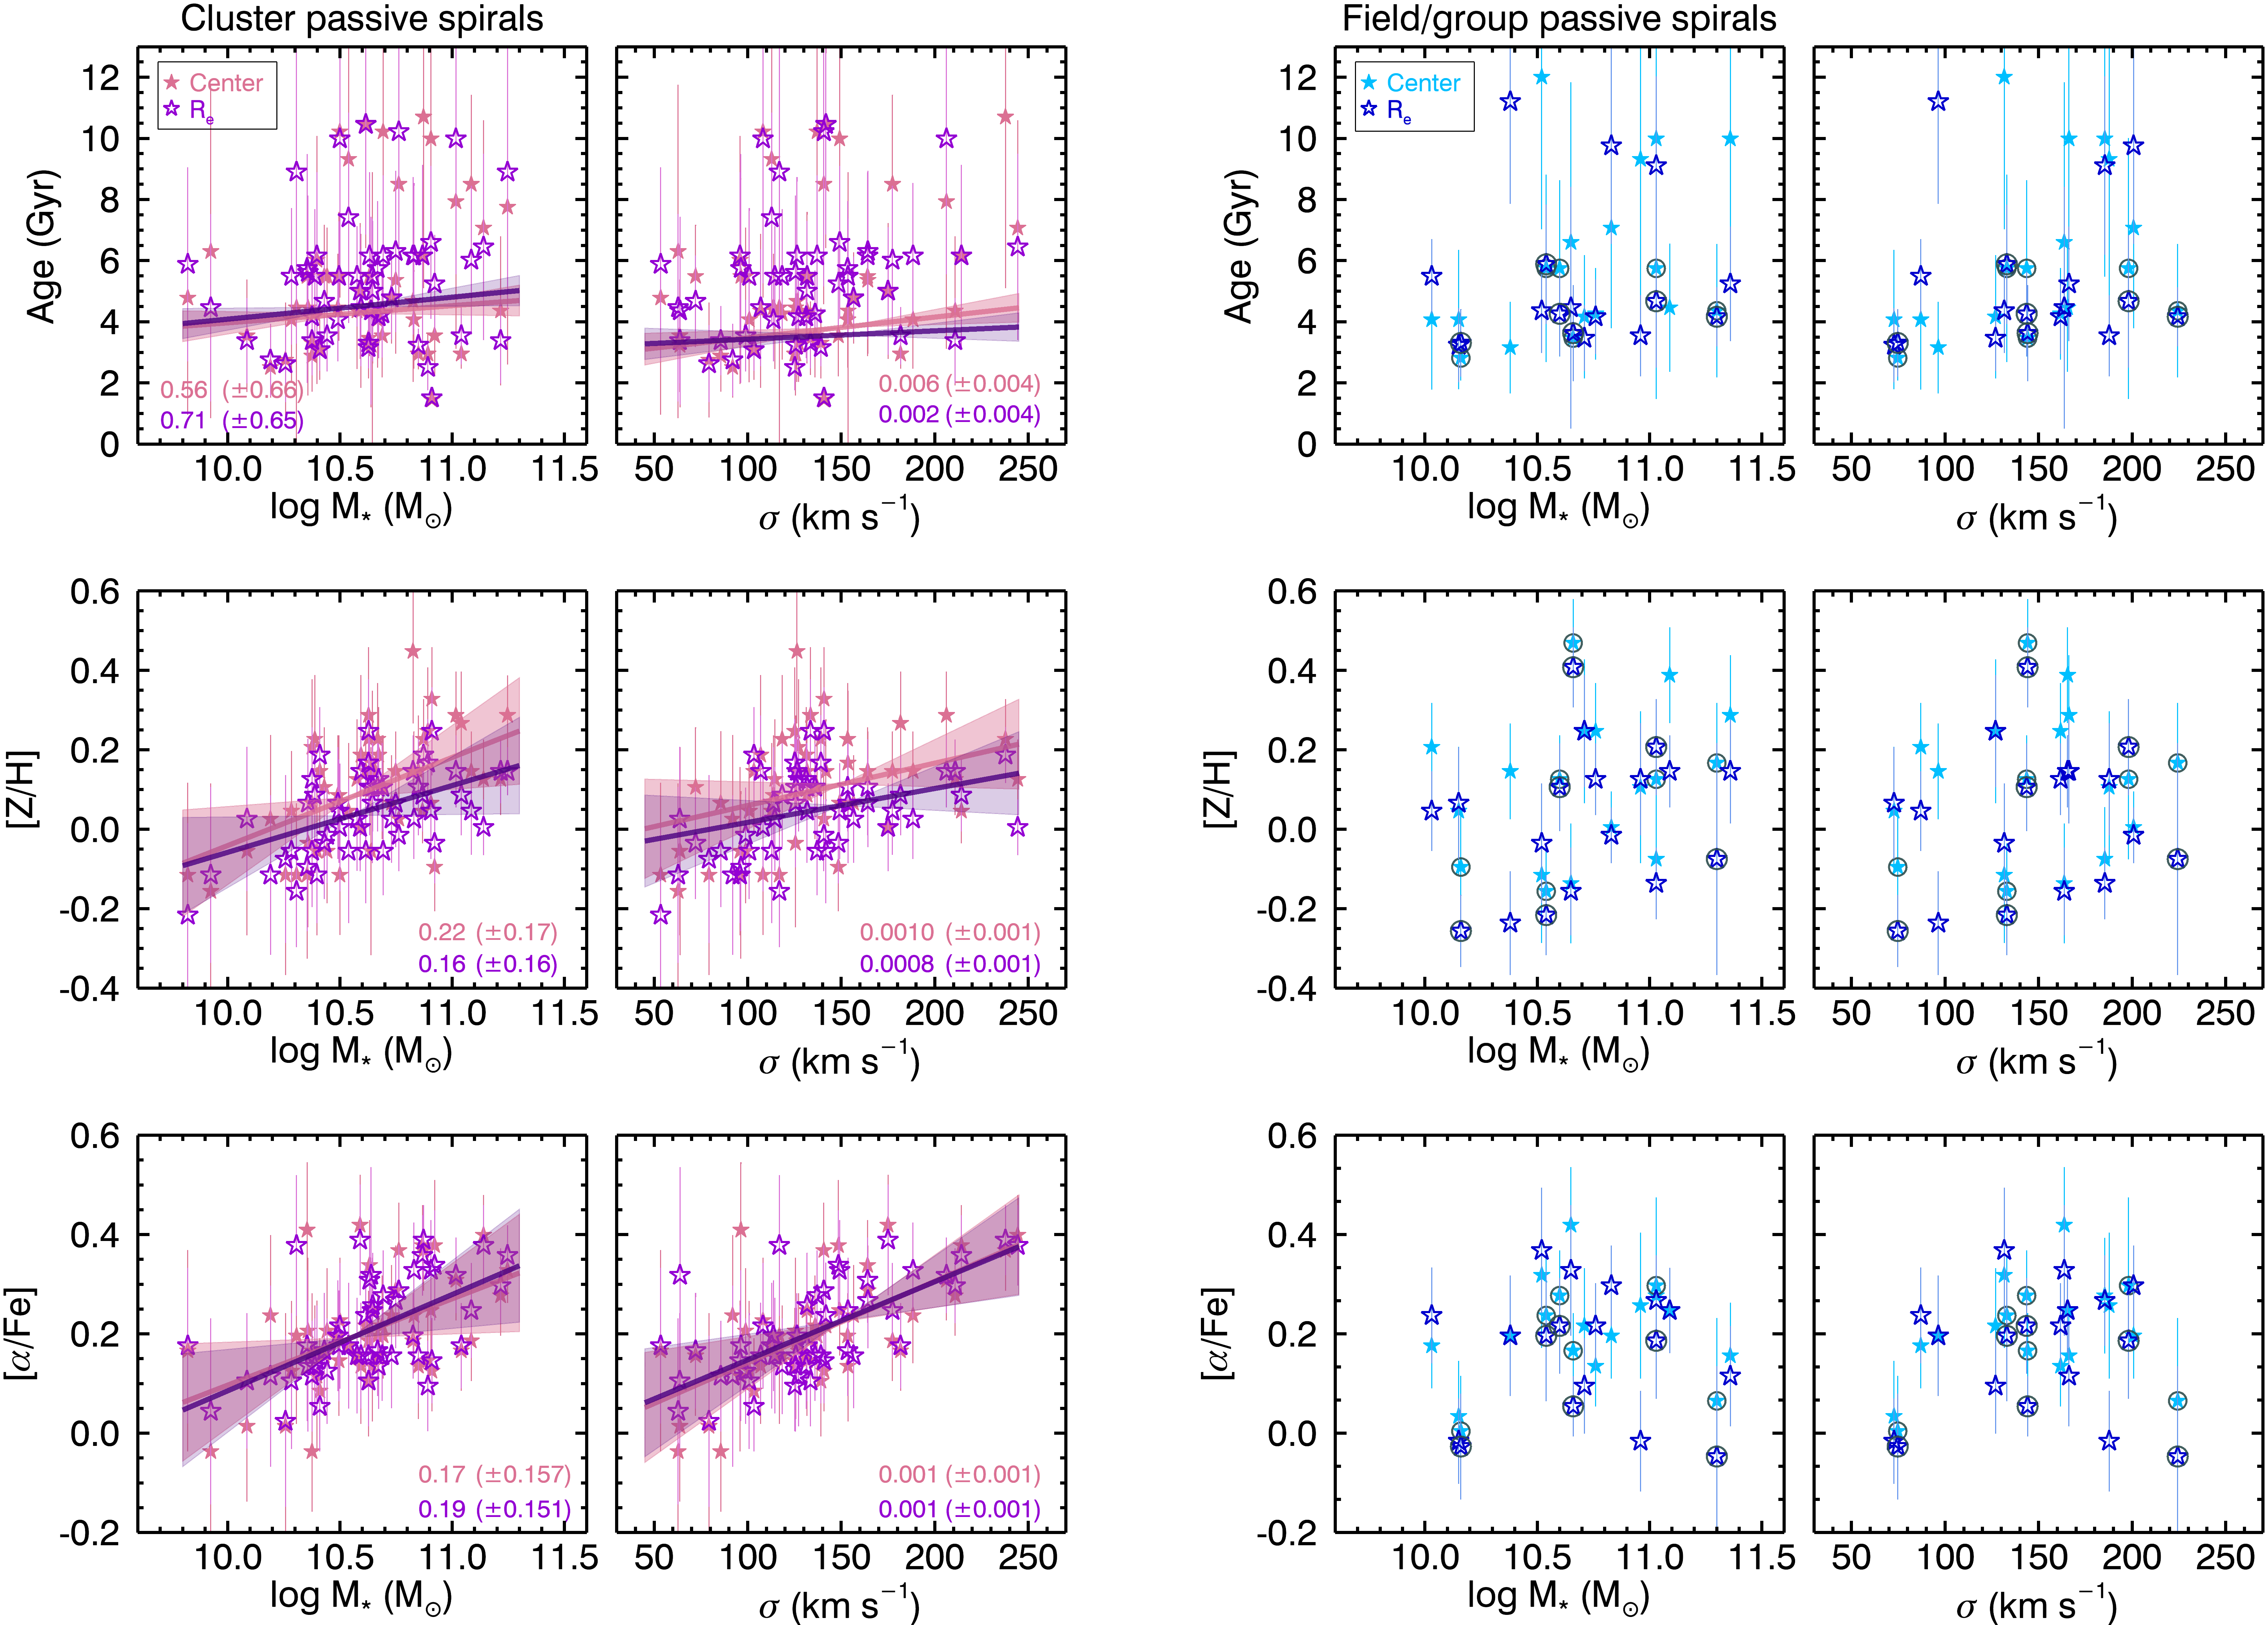
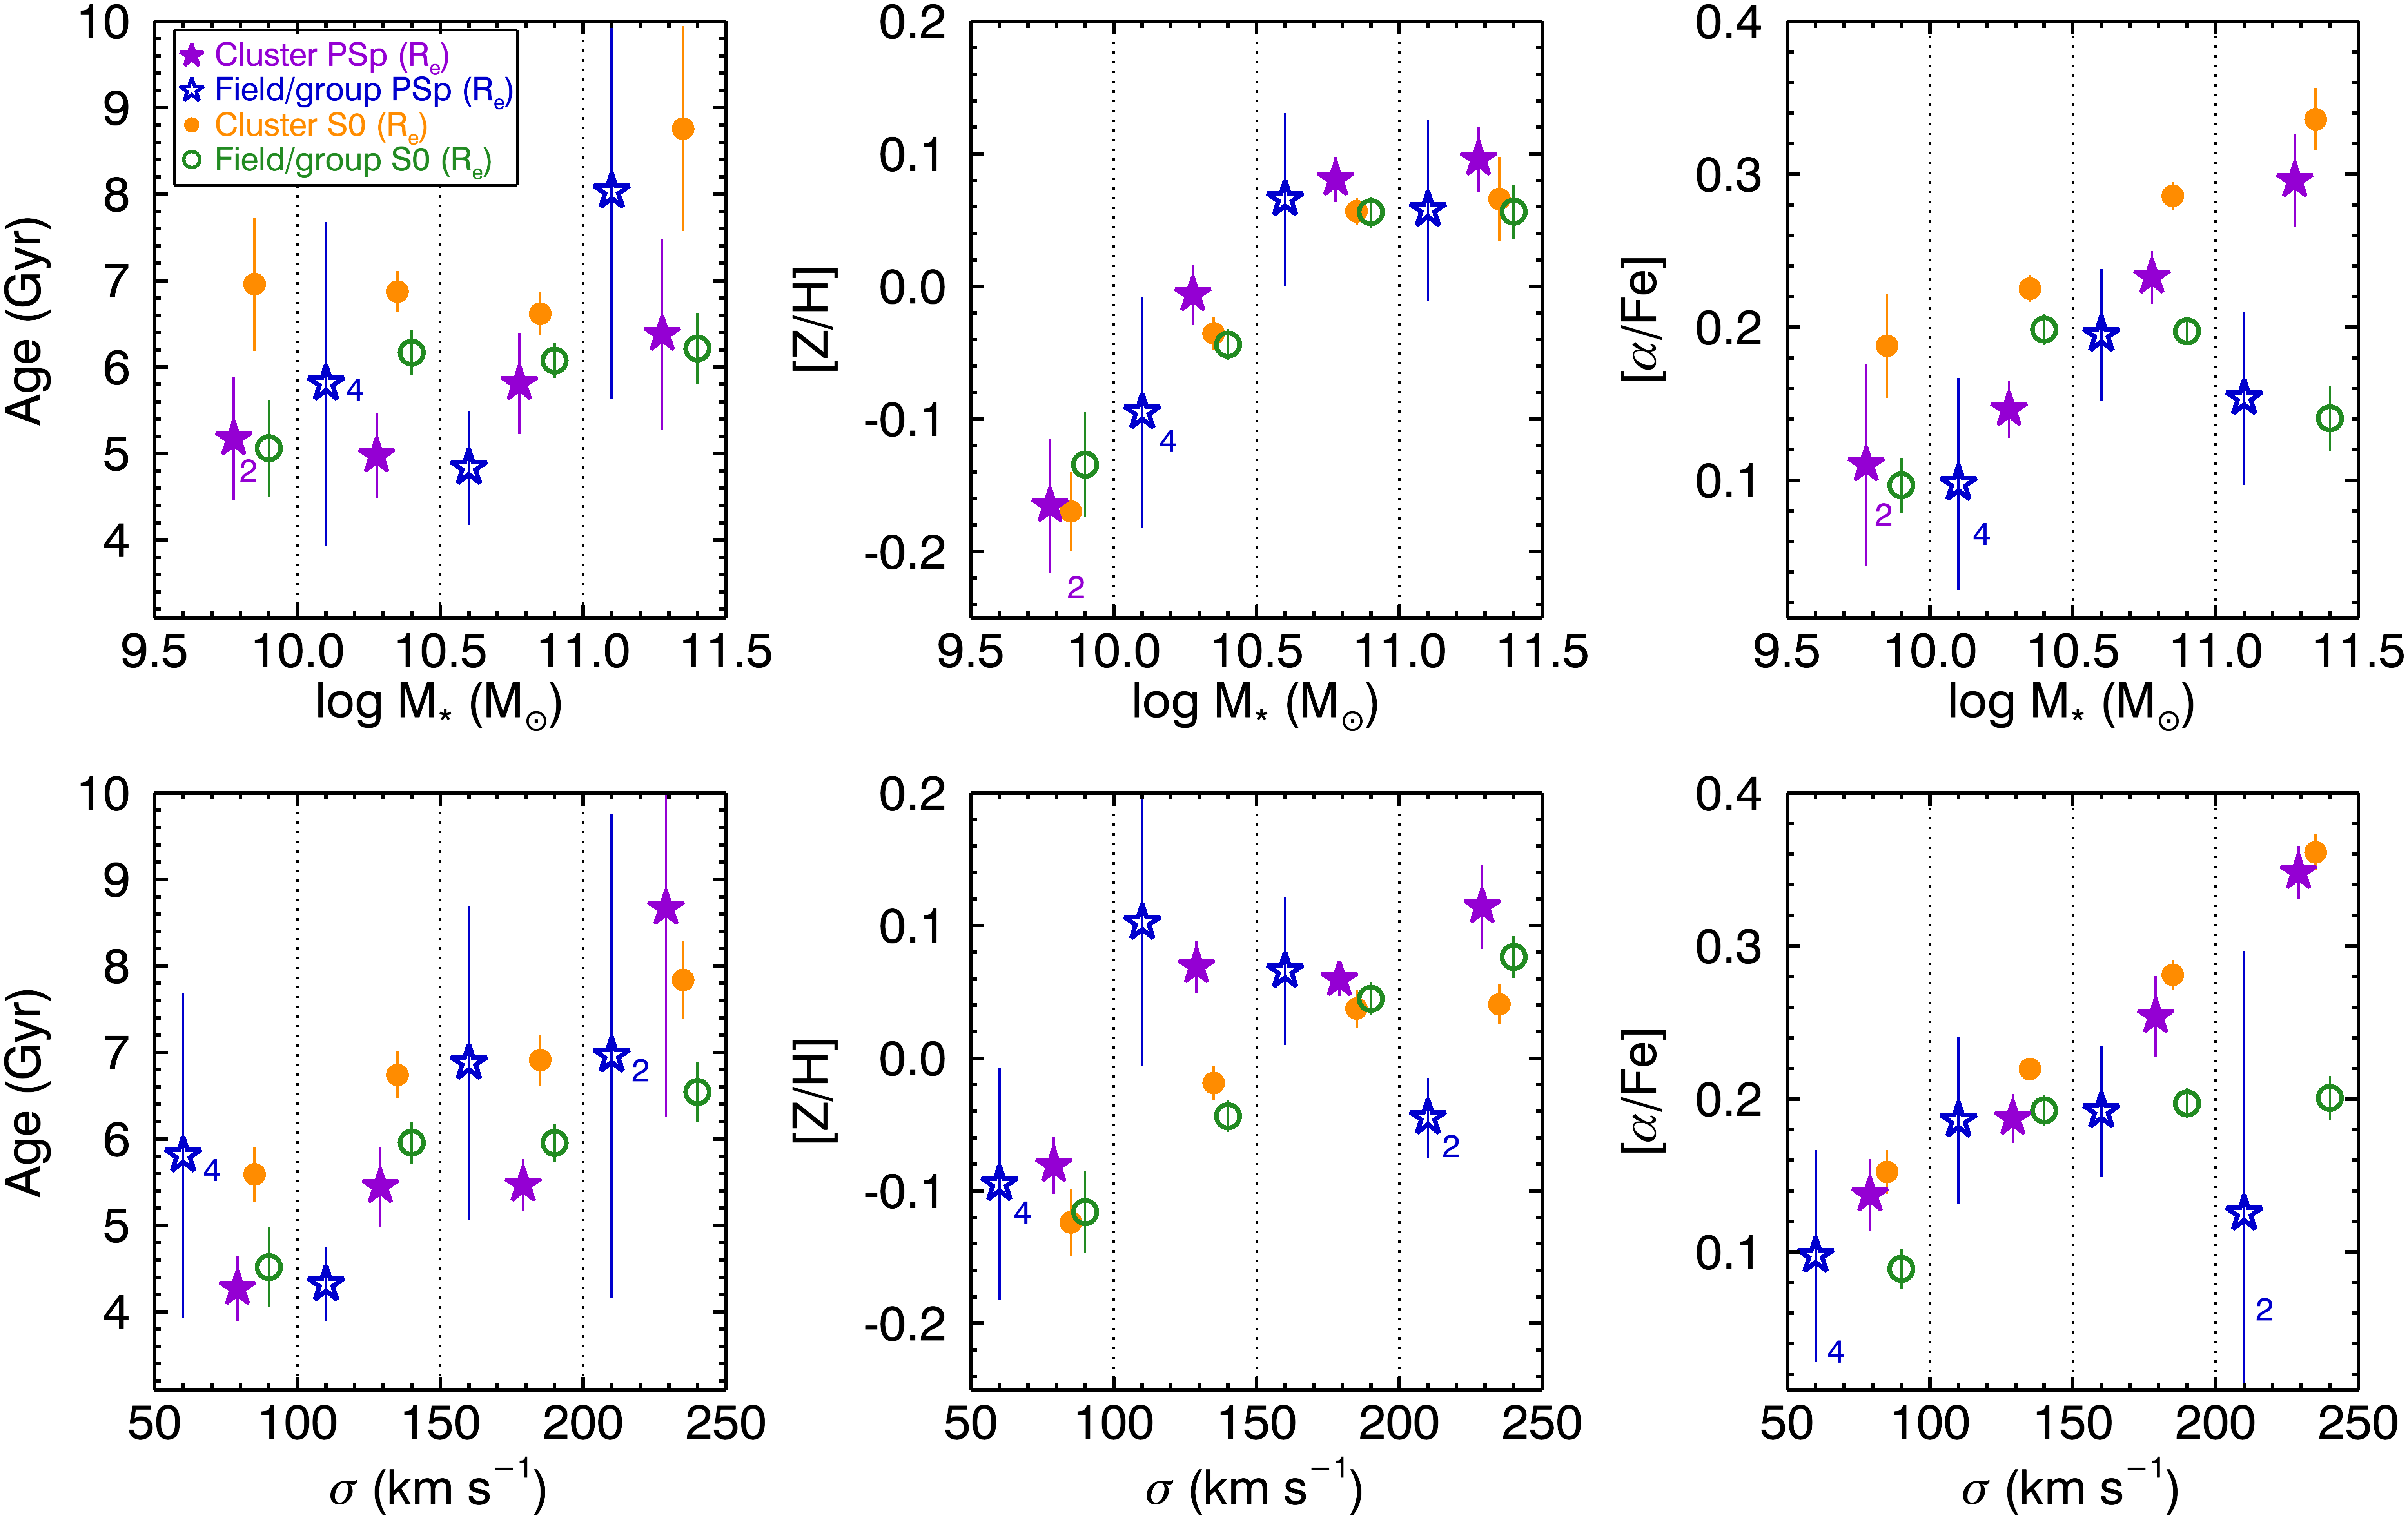
Figure 5 presents the age, [Z/H] and [/Fe] within arcsec and as a function of stellar mass and velocity dispersion () for the cluster and field/group passive spirals. The is measured from the spectrum inside a circular aperture of radius , as described in Scott et al. (2018) using the method from van de Sande et al. (2017).
Age shows no correlation with either mass or both in the cluster and field/group passive spirals. [Z/H] shows a very marginal difference between the two environments. In the clusters, [Z/H] tends to increase with mass (and ) with a large scatter and to be systematically higher in the center () than within one (), whereas such a correlation is hardly detected in the field/groups. The environmental dependence also appears to be tight for [/Fe] ( in the center and within one ): the cluster passive spirals have obviously higher [/Fe] than the field/group passive spirals at the massive/high-dispersion end.
We investigate the environment of the field/group passive spirals by using the group catalog from Treyer et al. (2018). Among galaxies, six are in isolation, the rest of them are in the groups with a wide range of halo mass (log M⋆/M⊙) . All isolated passive spirals are young ( Gyr) but are not distinct in [Z/H] or [/Fe], as shown in Figure 5.
3.2. Passive spirals vs. S0s: comparison between cluster and field/group environments
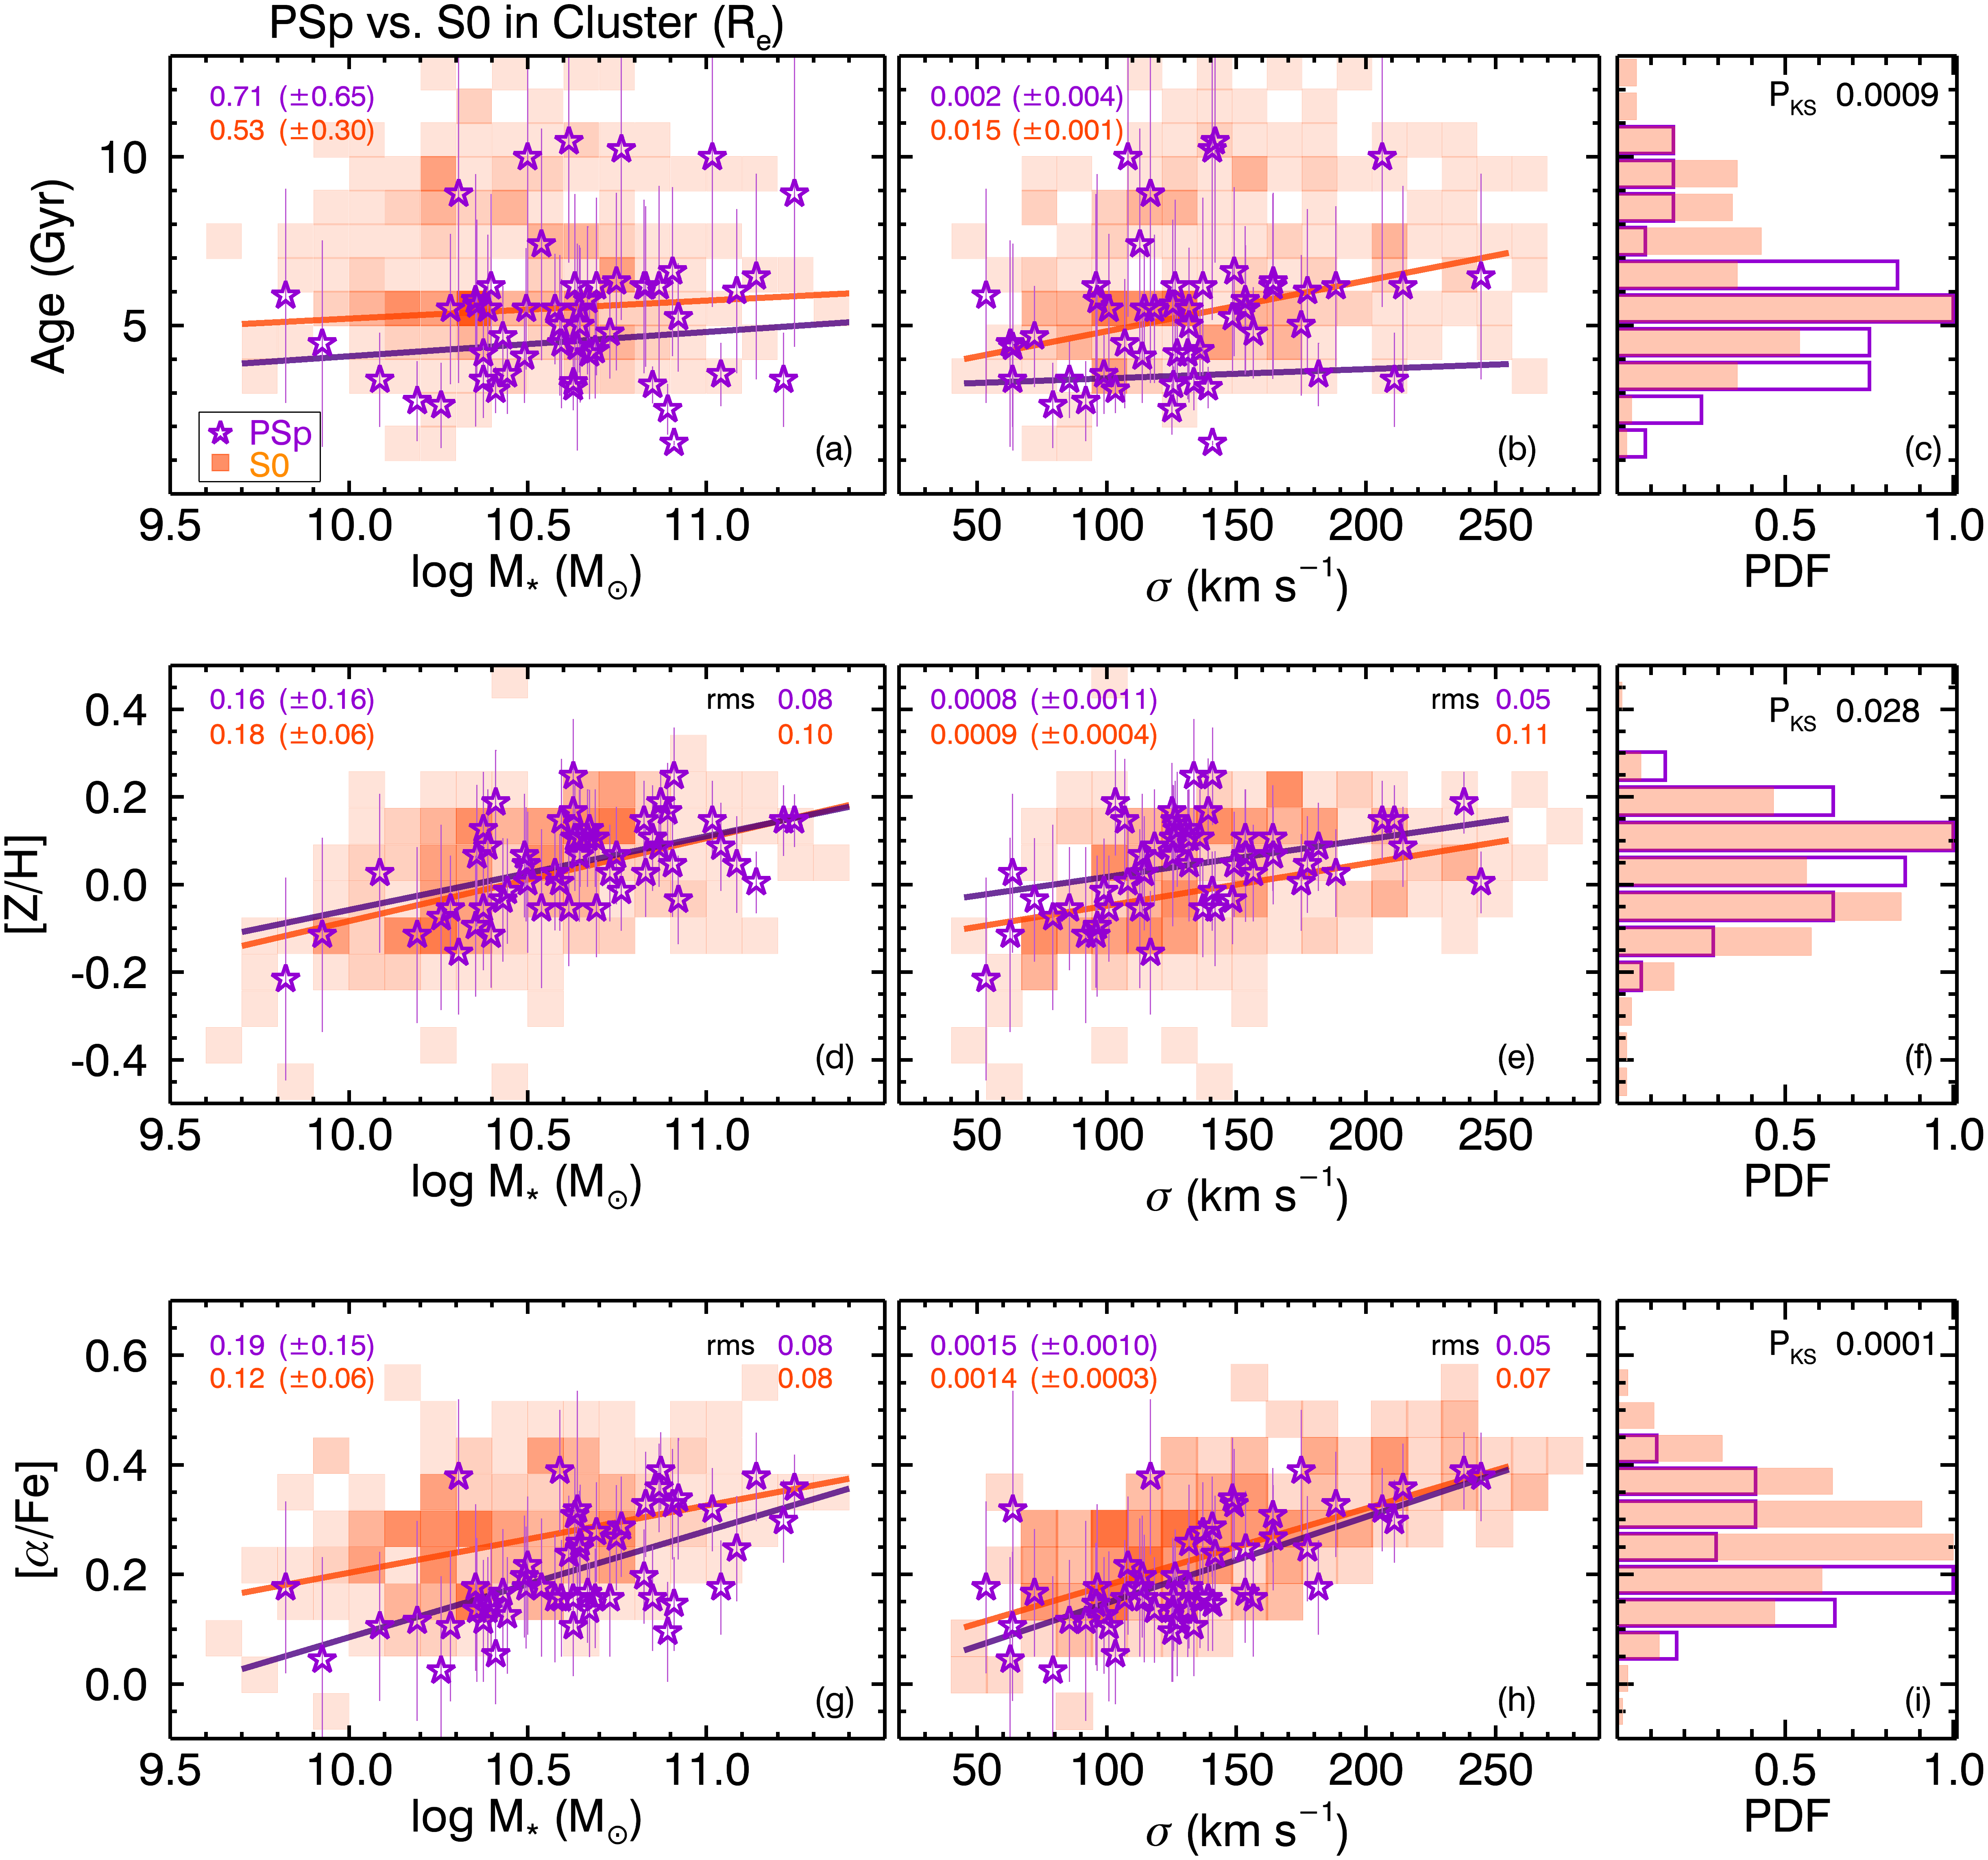
We compare age, [Z/H] and [/Fe] within with stellar mass and between passive spirals and S0s in the cluster and field/group. Figure 6 shows that cluster passive spirals tend to be slightly younger, more metal-rich and less -enhanced than S0s as a function of mass (and ), which results in the clear differences of the histograms. A two-dimensional Kolmogorov-Smirnov (KS) test of similarity in the cumulative distributions between passive spirals and S0s yields a probability (PKS) of for age, for [Z/H] and for [/Fe]. These differences are clearer in the lower mass (or ) range.
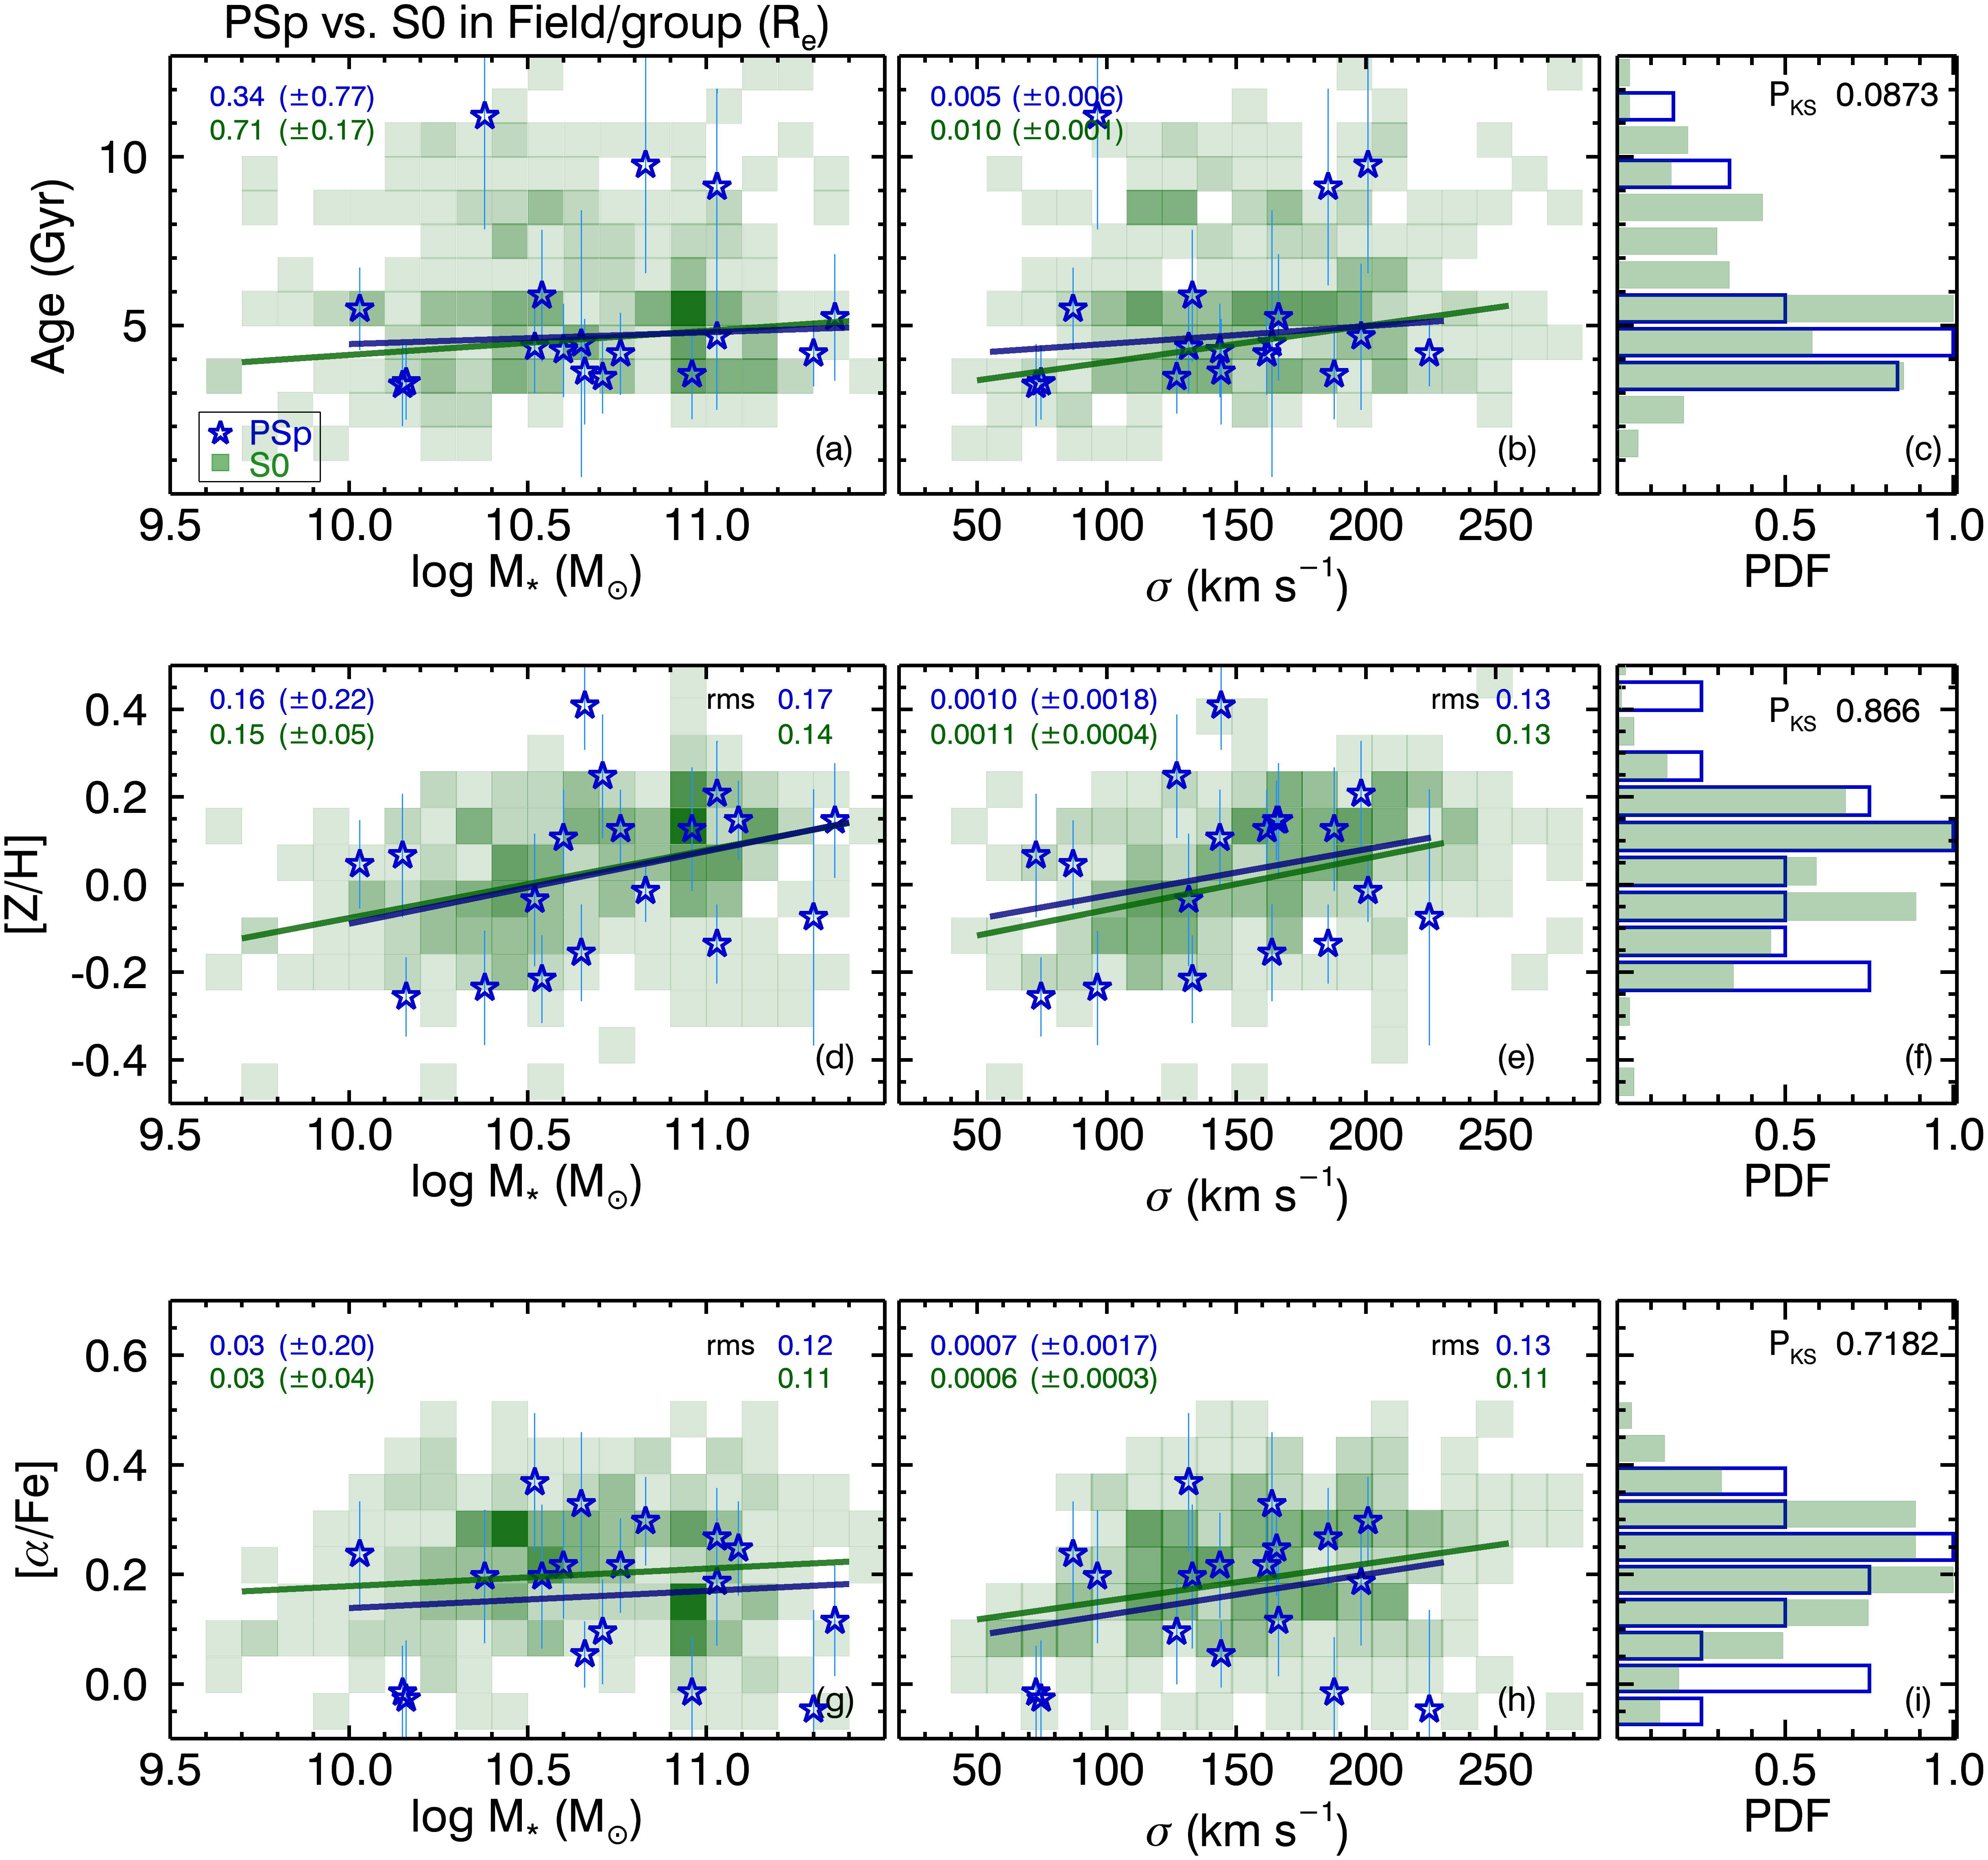
Unlike in the clusters, the distribution of [/Fe] shows no notable difference (P in Figure 7i) between the field/group passive spirals and S0s in Figure 7. Interestingly, the [/Fe] - mass() correlation slope in the field/groups appears to be shallower than in the clusters for S0, as well as for passive spirals. The slope in [/Fe] is nearly constant () or even decreasing with stellar mass at the high-mass end for the field/group S0s, similar to the passive spirals (). In addition, field/group S0s tend to have slightly larger scatter in both [Z/H] and [/Fe] compared to cluster S0s. This is particularly evident at the high-mass end (see rms values in the top right corner of the Figures 6 and 7). We estimated the spearman’s rank coefficient for [/Fe], to quantitatively compare its mass () dependence between environments: () for cluster PSp and () for field/group PSp, and () for cluster S0s and () for field/group S0s. Since the comparisons show that massive field/group PSp and S0 galaxies tend to have lower [/Fe] than cluster ones, we suspect that galaxies in low-density environments may have more extended star-formation histories (de La Rosa et al., 2011). The results of spearman’s rank coefficient and the significance for [Z/H] and [/Fe] are summarized in Table 1.
| PSp | S0 | |||
|---|---|---|---|---|
| (P0) | (P0) | |||
| [Z/H] | Cluster | log M⋆ (M | 0.53 (5e-05) | 0.48 (4e-17) |
| (km s-1) | 0.45 (0.001) | 0.41 (2e-12) | ||
| Field/group | log (M⋆/M | 0.42 (0.080) | 0.38 (5e-13) | |
| (km s-1) | 0.22 (0.367) | 0.40 (3e-14) | ||
| [/Fe] | Cluster | log (M⋆/M | 0.56 (1e-05) | 0.36 (9e-10) |
| (km s-1) | 0.63 (6e-07) | 0.65 (2e-33) | ||
| Field/group | log (M⋆/M | -0.06 (0.823) | 0.04 (0.492) | |
| (km s-1) | 0.09 (0.726) | 0.24 (9e-06) |
Note. — The Spearman’s rank correlation coefficient () will be between a value of and . indicates a perfect negative correlation and indicates a perfect positive correlation.
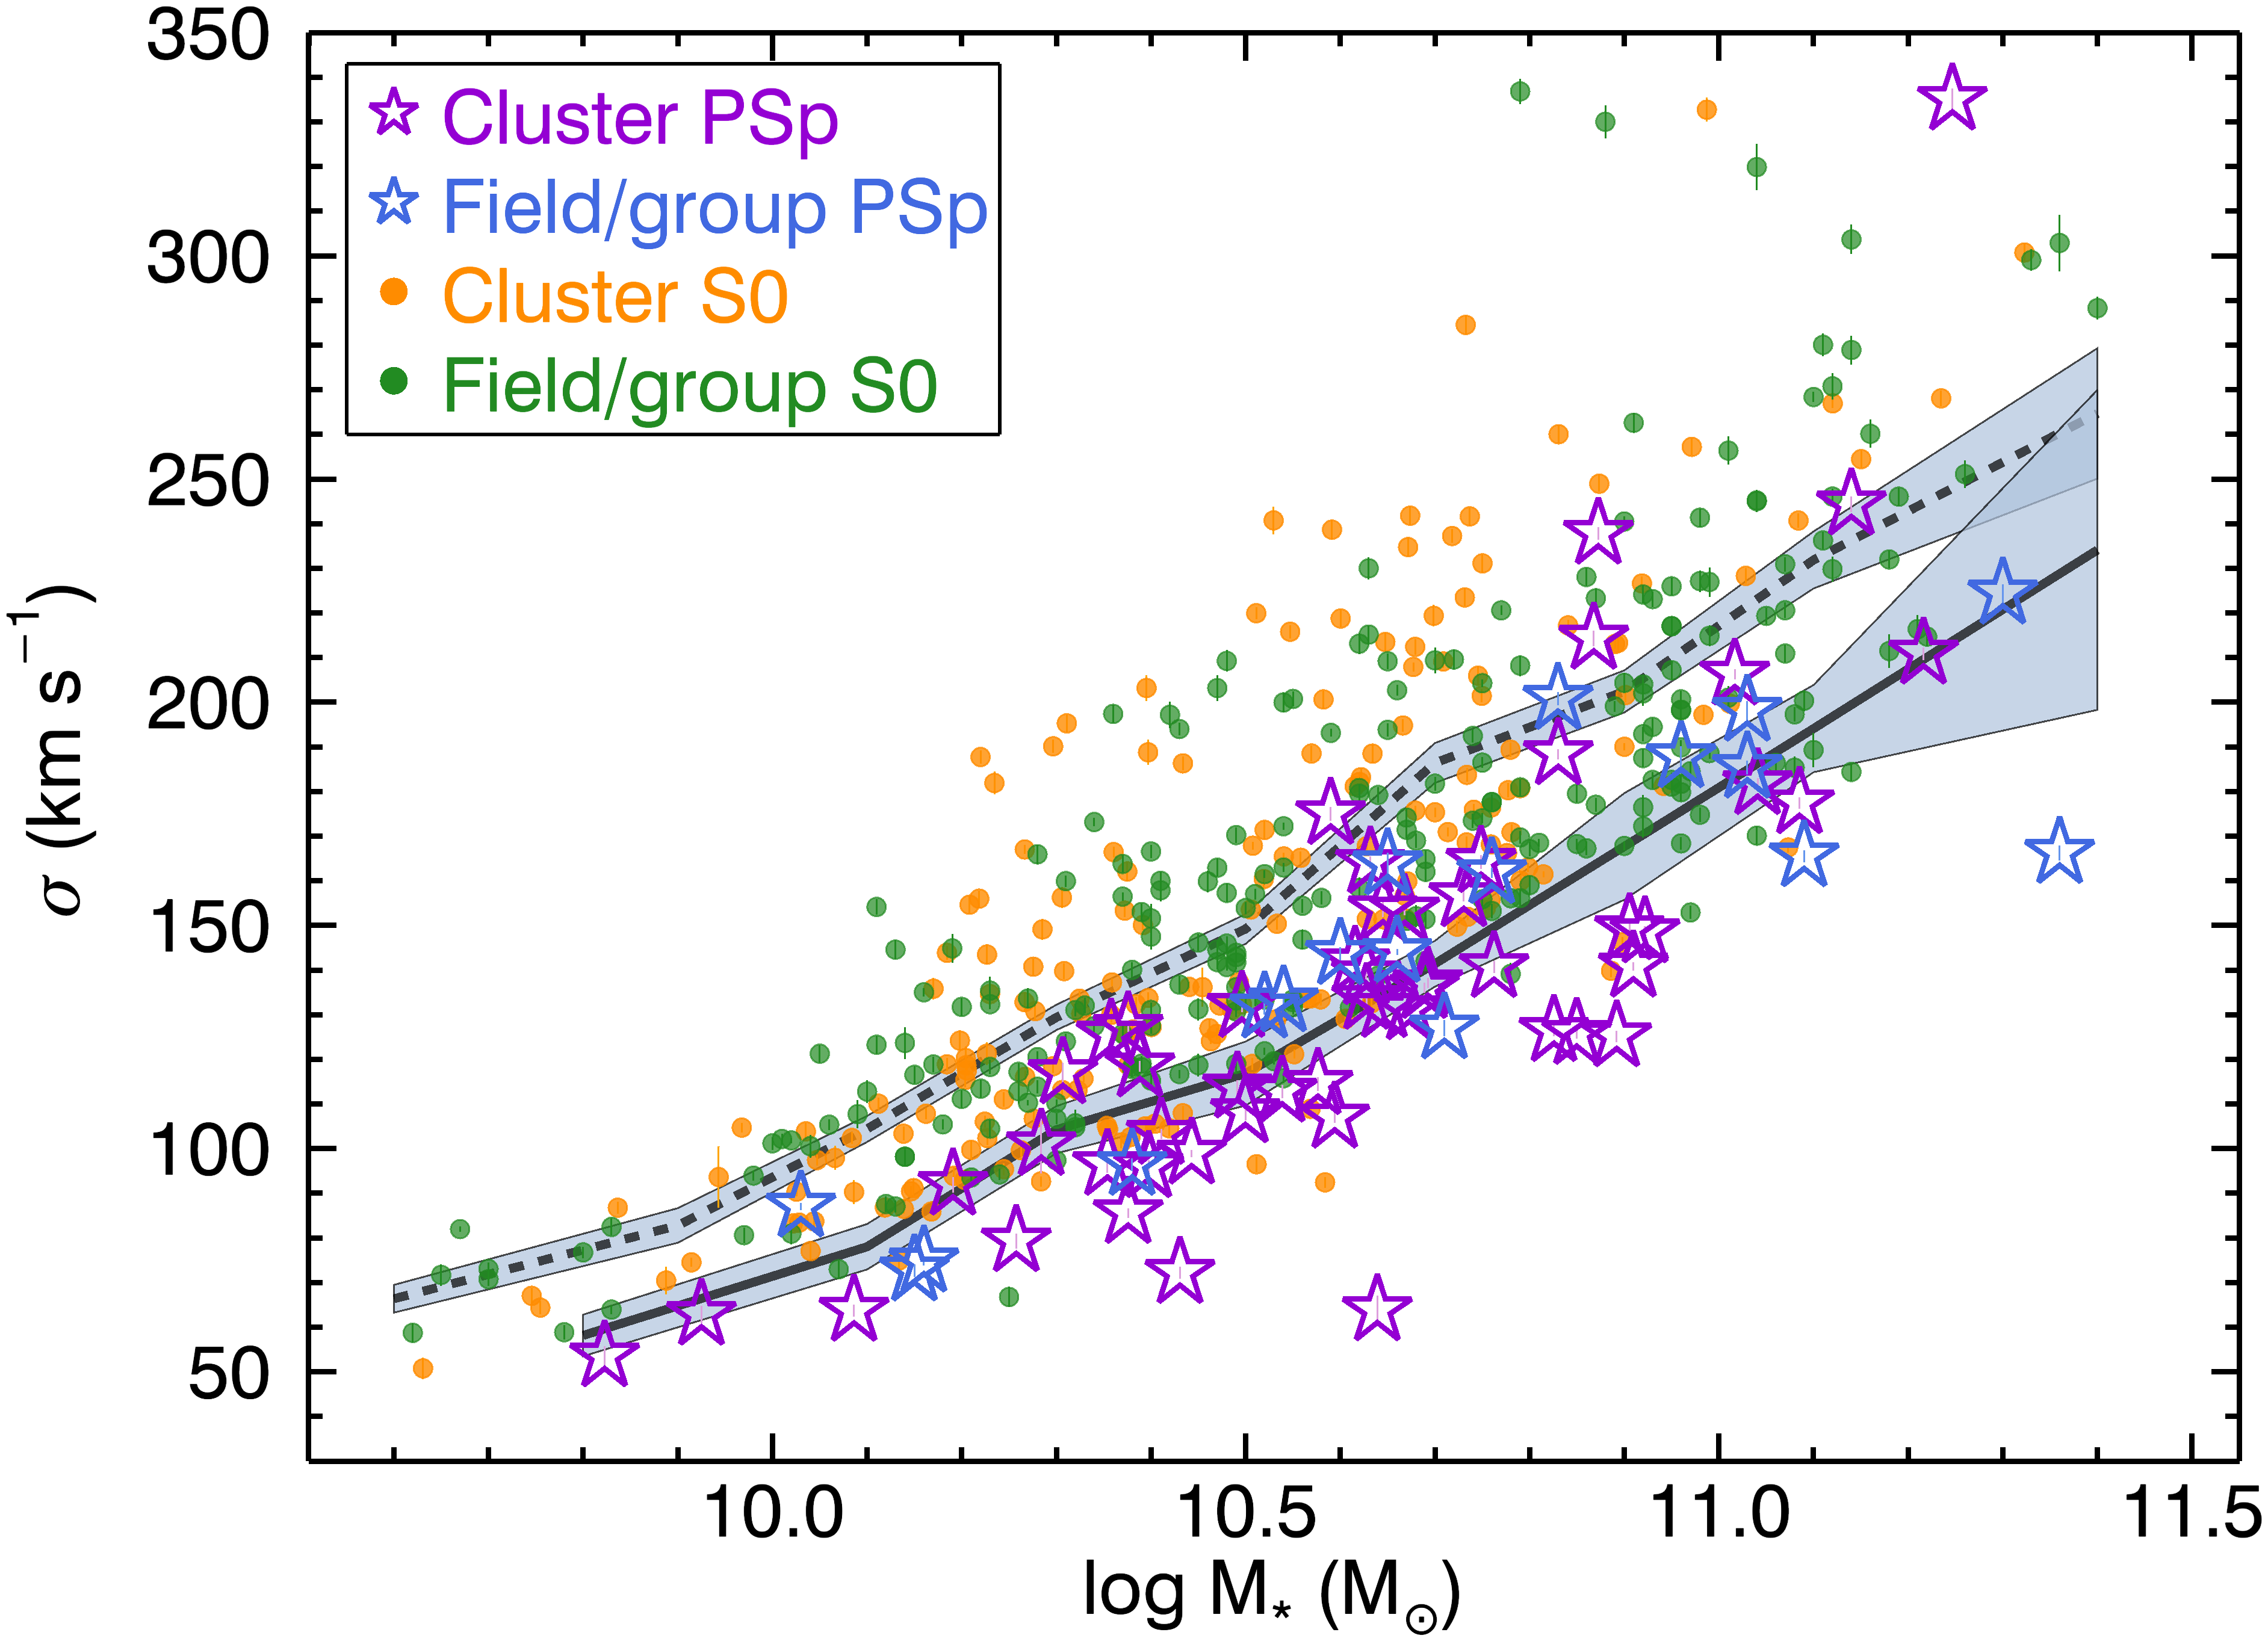
Figure 8 shows the stellar mass versus for the passive spirals and S0s. The of passive spirals tends to be lower (mean in all stellar mass range km s-1) than that of S0s at a given stellar mass. This may imply that some S0s suffer a kind of dynamical heating after star formation stops. Loss of stellar mass in the galaxies could be also playing a role in mass relations Joshi et al. (2020). The environmental dependence of the stellar mass relations at a given galaxy type appears not to be significant.
In Figure 9, in order to compare all together, we show the mean of stellar population parameters with stellar mass (top panels) and (bottom panels) bins for all subdivisions as shown by the Figures 5 - 7. We present the number of galaxies in case the galaxies less than in each bin for caution. It is clear that [/Fe] flattens and/or bends over at log (M⋆/M⊙) or km s-1 for the field/group passive spirals and S0s.
4. Discussion
In the previous section we have shown that stellar populations show different trends between cluster and field/group passive spirals, especially for [/Fe]. Here, we discuss the possible origins of these different trends between environments and between passive spirals and S0s.
From our results, [/Fe] increases with mass (and ) for both passive spirals and S0s, in the clusters. This finding is consistent with previous studies: for early-type galaxies both metallicity and -abundance correlate tightly with stellar mass (and ; Bernardi et al. 2006; McDermid et al. 2015). In particular, the [/Fe] - mass correlation (Figures 6g, 6h) is an evidence that the more massive galaxies quenched in a short timescale at earlier epochs. Notably, cluster passive spirals have slightly younger age and, crucially, lower -abundance compared to cluster S0s (Figure 6). If passive spirals and S0s commonly originate from star-forming spiral galaxies, this means that passive spirals had undergone star formation for a longer timescale and became quiescent more recently than S0s. The mean age of cluster and field/group passive spirals is Gyrs. This is coincident with the simulations from Bekki et al. (2002), in which spiral arm structures are found to fade over several Gyrs, after gas is stripped.
Bekki & Couch (2011) argued that the progenitors of cluster S0s might be reshaped and quenched even before cluster infall, through mergers and/or tidal interactions in galaxy groups or cluster outskirts (pre-processing; De Lucia et al. 2012, Oh et al. 2018). On the other hand, the fact that passive spirals are younger and less -enhanced than S0s in the clusters suggests that passive spirals may have reached the clusters without severe interactions with neighbors. After infall, they may have experienced star formation quenching by cluster environmental effects such as thermal evaporation (Cowie & Songaila 1977), ram-pressure stripping (Gunn & Gott 1972), starvation or strangulation (Larson et al. 1980; Bekki et al. 2002). This would naturally explain why passive spirals show younger age and longer star-formation timescale than S0s.
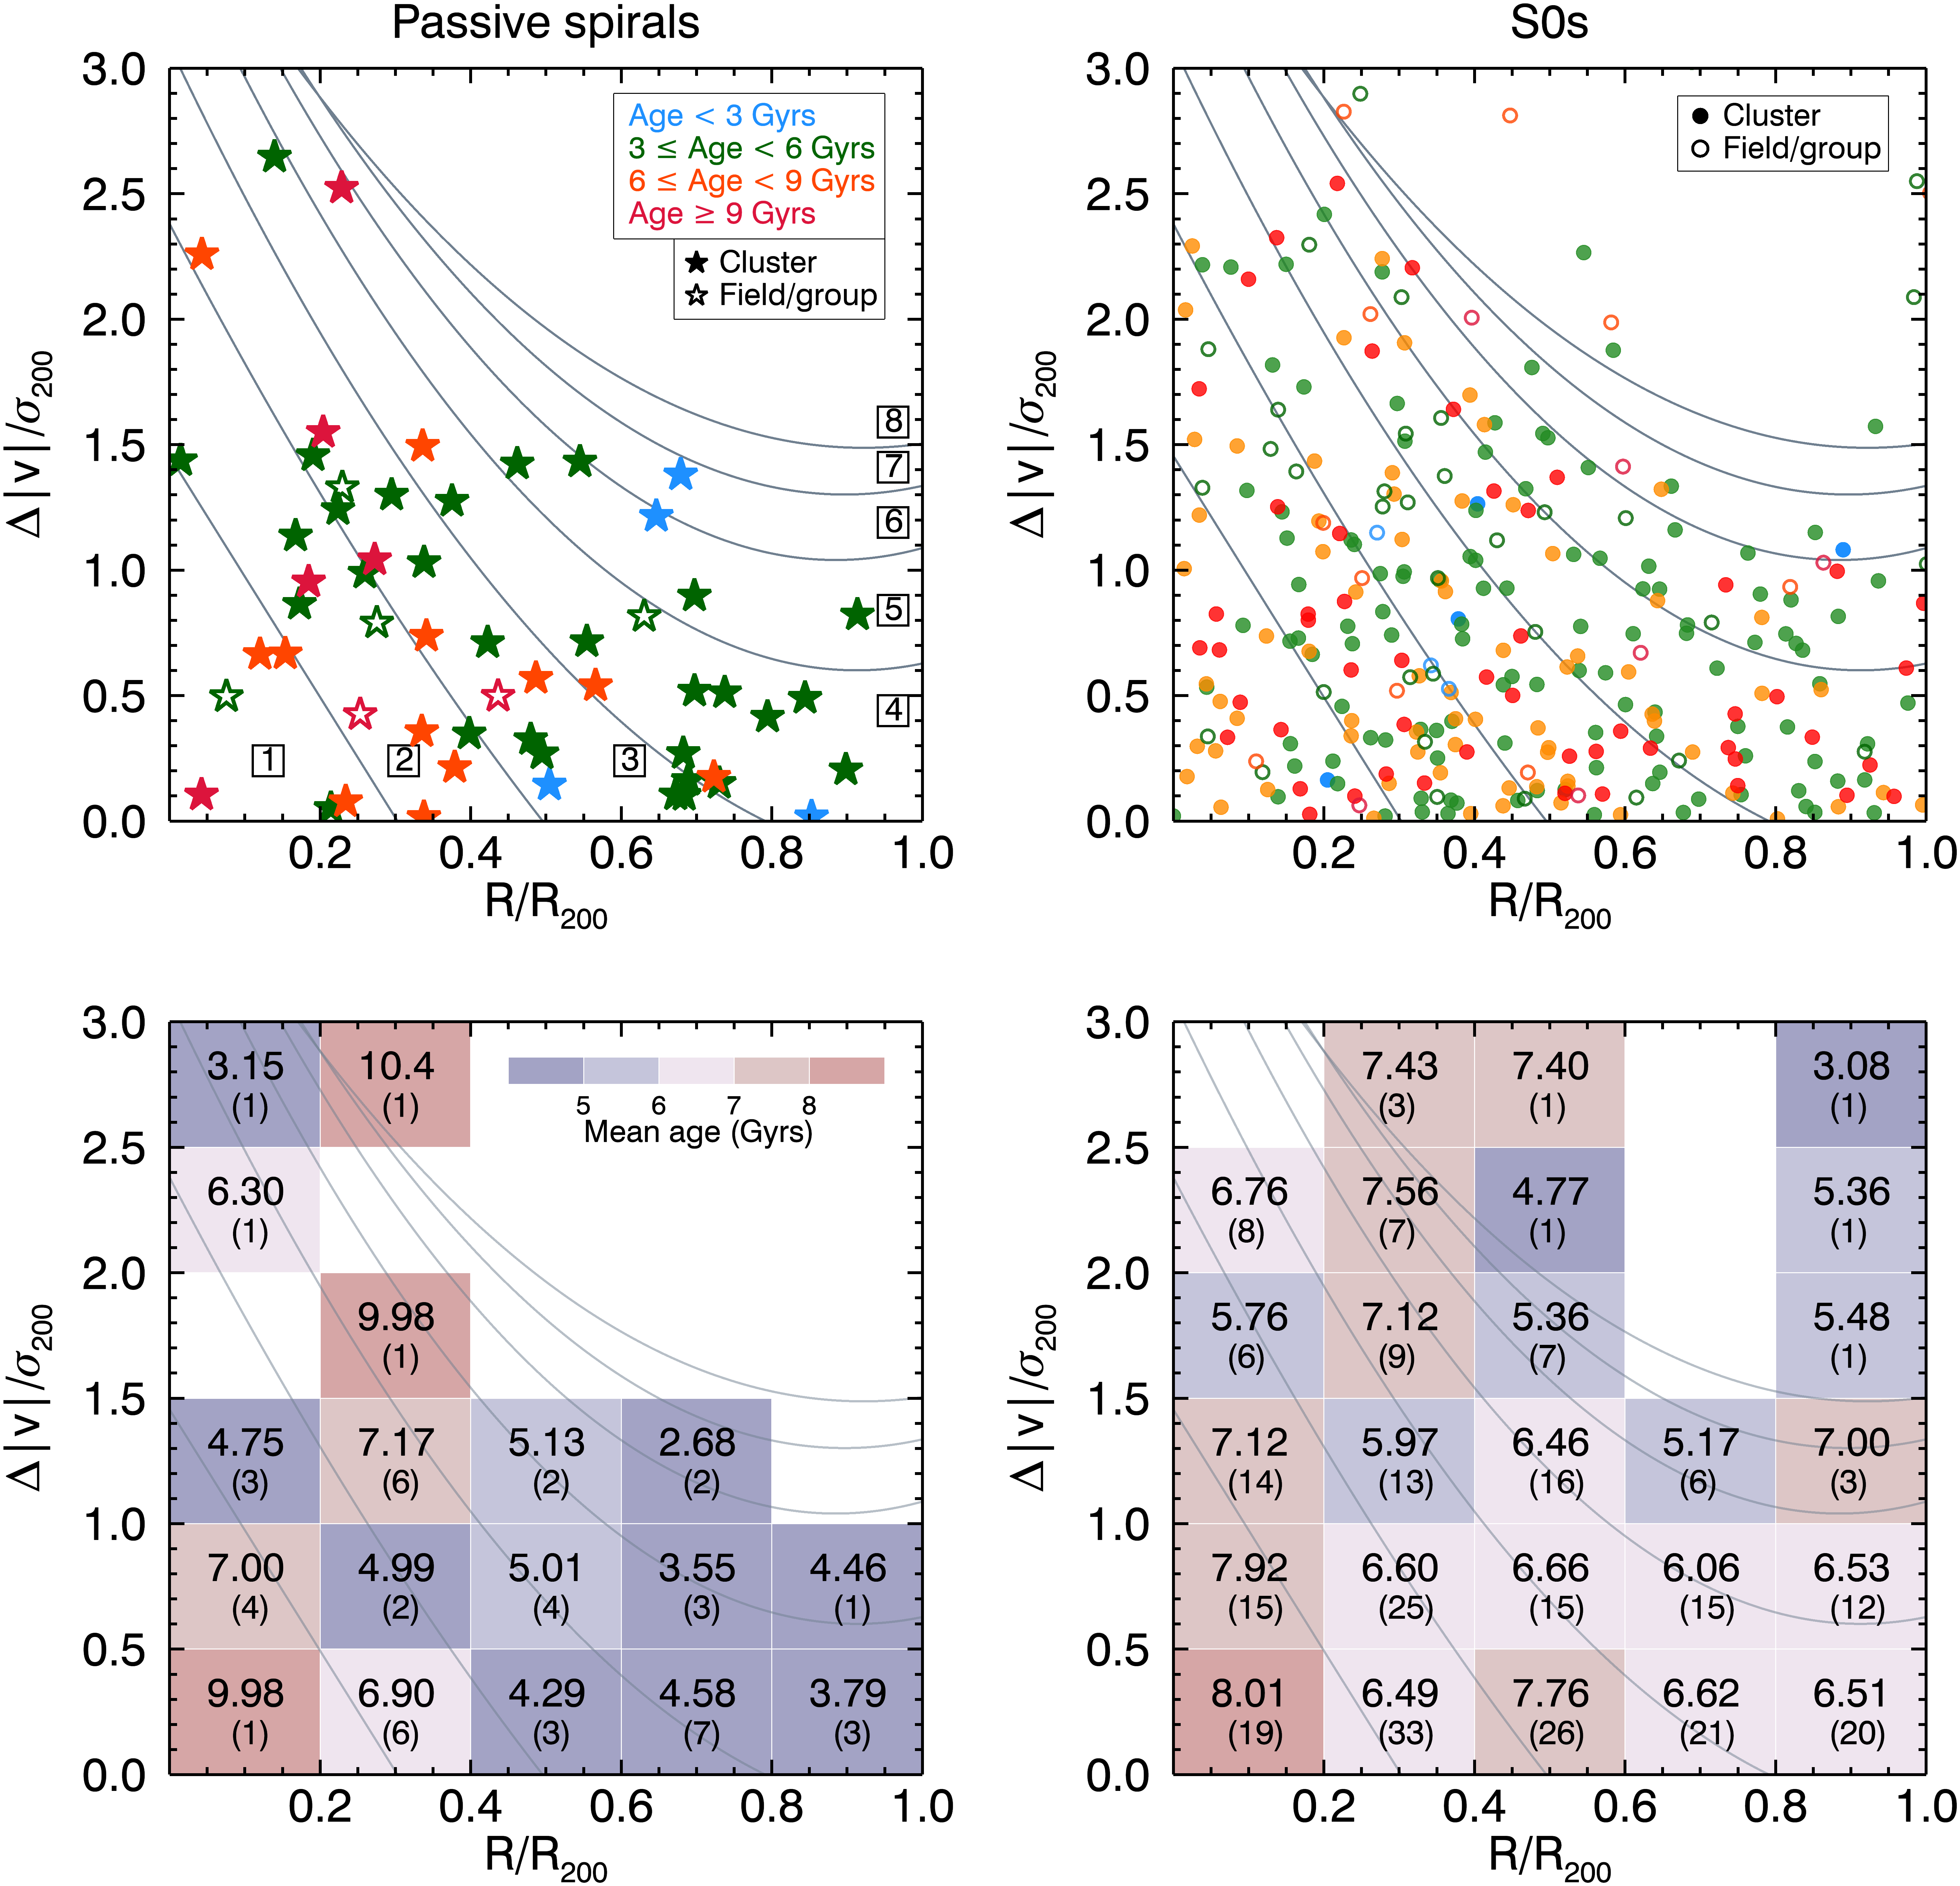
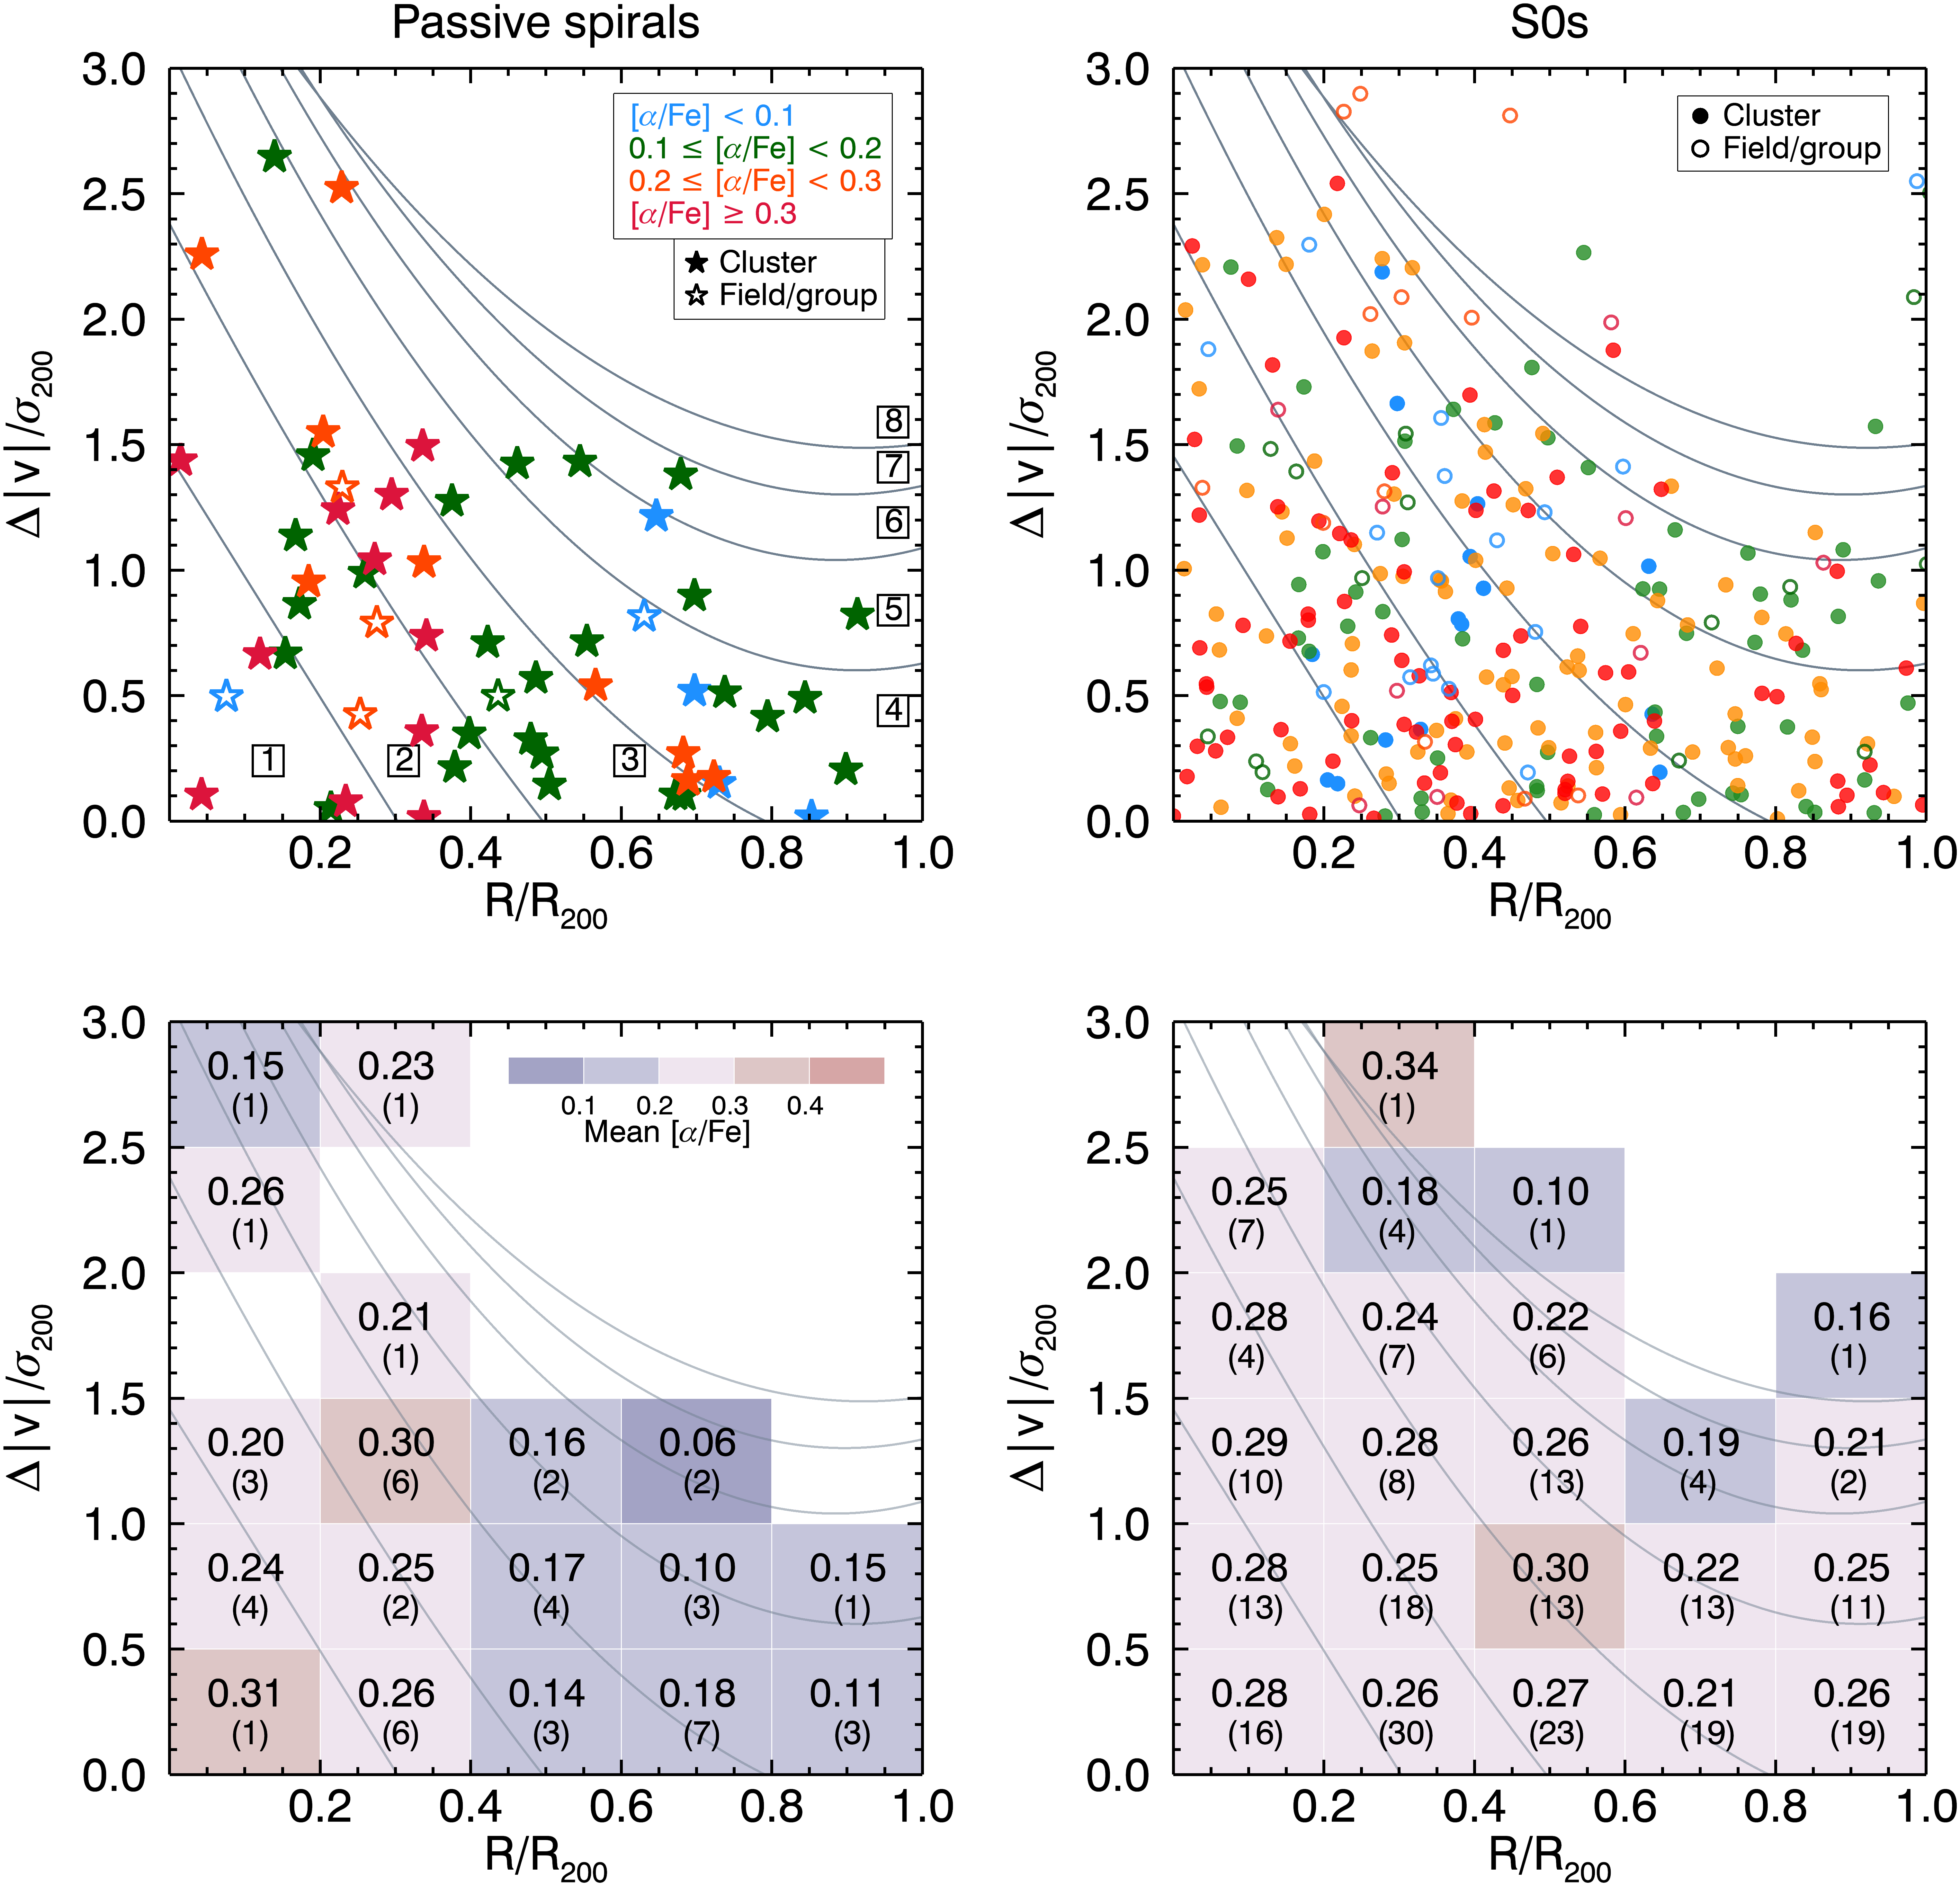
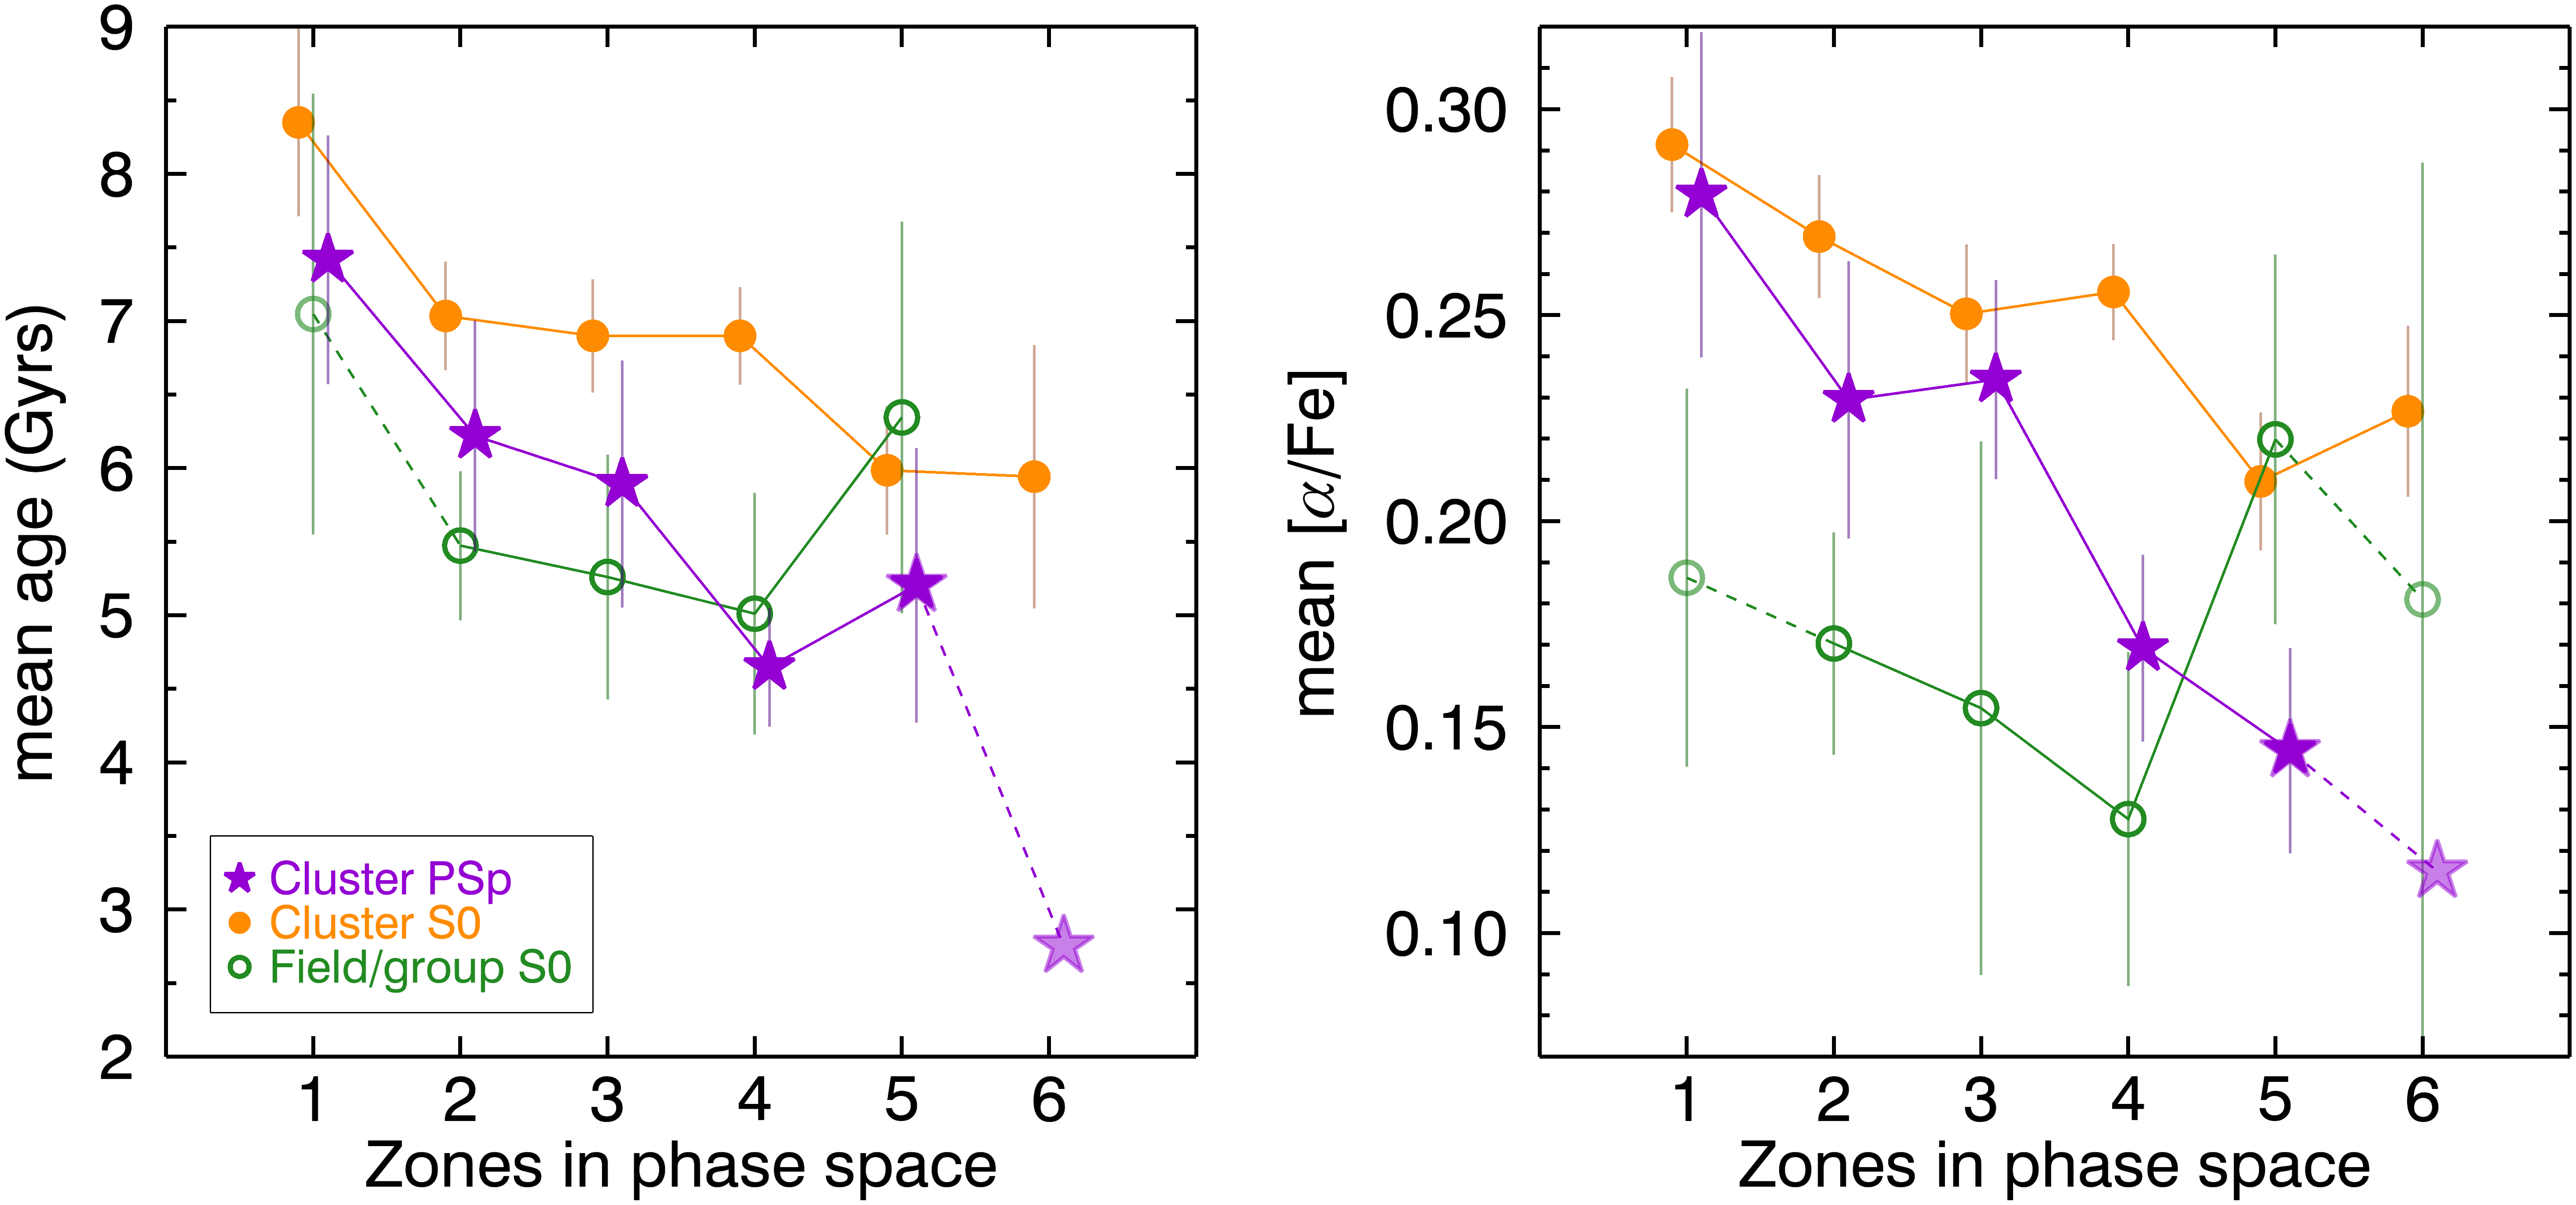
As an additional check for the scenario for clusters, we inspect the distribution of stellar ages and [/Fe] of all the cluster passive spirals in the projected phase-space diagram (Figures 10 and 11). We compare the observed distribution with the analytic curves from Pasquali et al. (2019), which grade the average infall time ( time elapsed since the first infall) of the galaxies. The distribution of the average infall time of the galaxies systematically shifts from high to low value with increasing zone number in their simulations (1 for the earliest infall, while 8 for the latest infall; see figure 4 in Pasquali et al. 2019). The stellar ages and [/Fe] of passive spirals and S0s show an overall shift from older to younger ages and from more -enhanced to less -enhanced along R/R200 and /: galaxies with smaller R/R200 and / tend to have suffered quenching earlier. This is clearly seen in Figure 12. Furthermore, cluster S0s show older mean age and more -enhanced than cluster passive spirals in all zones. This is similar to the results from Pasquali et al. (2019) and Smith et al. (2019) with much larger SDSS sample.
In summary, star-forming spiral galaxies may be quenched through mergers or interactions before falling into a cluster, becoming relatively old and -enhanced S0s. Otherwise, without significant tidal events, spiral galaxies may arrive in the infall region of a cluster with ongoing star formation. Such spiral galaxies may suffer star formation quenching by cluster environmental effects and eventually evolve into S0s via the transitional phase of passive spirals. Those S0s (or passive spirals) have younger ages and lower -enhancements than the S0s formed through mergers at an earlier epoch.
As shown in Figure 9, S0s tend to be more -enhanced (by dex at a given mass bin) than passive spirals in the cluster environments, while their metallicities are similar, which indicates that cluster S0s have suffered more rapid chemical enrichment and star formation quenching than cluster passive spirals. However, such a difference in [/Fe] between passive spirals and S0s in clusters is hardly found in massive field/group passive spirals and S0s, which implies that their formation processes in low-density environments may be different from those in clusters.
In field/group environments, the trend of [/Fe] is different from the well-known linear correlation between [/Fe] and stellar mass: they appear to be flattened or even decreasing with increasing mass at log (M⋆/M, both for passive spirals and S0s (see Figure 7g and h). According to Bernardi et al. (2006), the stars in early-type galaxies formed at slightly earlier times and on a slightly shorter timescale in dense regions than in less dense regions. Our finding shows that the different quenching timescale between high- and low-density environments is due to the difference at the high-mass end. At log (M⋆/M, passive spirals or S0s in low-density environments appear to have longer star-formation timescales, unlike those in high-density environments. That is, in low-density environments, star-formation quenching mechanisms may be weak or, alternatively, there may be some mechanisms that prolong star formation.
One possible scenario for low-density environments is that those massive galaxies may be constantly rejuvenated by interactions with gas-rich neighbor galaxies, which is known to be more frequent in low-density environments with relatively low velocity-dispersion (Toomre & Toomre 1972, Lavery & Henry 1988, Byrd & Valtonen 1990). Radial transfer of gas to the central region and subsequent triggering of new star formation may influence light-weighted [Z/H] and [/Fe] in interacting galaxies. Although the change of metallicity by interactions may depend on the properties of the interacting neighbors, [/Fe] is expected to decrease as star formation is going on. Alternatively, massive passive spirals and S0s in low-density environments may be supplied with fuel for star formation by tidal stirring (Mayer et al., 2001) or gas accretion. Since gas stripping is not strong in low-density environments, they can keep forming stars using accreted gas, and consequently become relatively young and -depressed galaxies. However, the suggested scenarios need to be verified using a much larger sample, because the sample size of our low-density galaxies () is not sufficient.
5. Summary and Conclusions
We have investigated the stellar populations of passive spirals with respect to their environment using a large sample from the SAMI Galaxy Survey. We found that star formation timescale of passive spirals appears to be different between clusters and field/groups. In the low-density environments, passive spirals show no [/Fe]-mass correlation, and have low [/Fe] values even at the highest stellar mass. This indicates that passive spiral galaxies may have different formation histories depending on their environments, which confirms the previous findings that environmental effects play a key role on the star-formation quenching in spiral galaxies (Barsanti et al. 2018; Schaefer et al. 2017; Schaefer et al. 2019).
We discussed possible processes that can result in the observed trends, focusing on the difference between the environments. Like massive galaxies in clusters, those in low-density regions may have experienced burst of star formation making them old, metal-rich and -enhanced at earlier epochs as well. However, cold gas accretion may occur more easily in low-density environments, which consequently prolongs star formation - with the effect being most noticeable at the high-mass end. Alternatively, gas fuel by wet minor mergers can also make lower [/Fe].
In clusters, there may be various and complex mechanisms that accelerate galaxy evolution. However, here we suggest two simplified channels that transform spirals to S0s through the passive spiral phase (Owers et al. 2019): (1) S0s may be formed by late-late or early-late type merger at early epoch before infall to a cluster halo. The starburst triggered by merger and subsequent mass-quenching may have made them old, metal-rich and -enhanced. (2) Spirals may be transformed into S0s via the passive spiral phase, by losing gas without morphological distortion. Their gas can be stripped away predominantly in the halo and outer disks by ram-pressure stripping or other cluster mechanisms, while passing through the cluster. After losing their gas, spirals become quiescent, and evolve secularly holding their spiral structures a few Gyrs - this is the passive spiral phase (Bekki et al., 2002). Our findings provide observational evidence that there are multiple channels to form passive spirals and the formation mechanisms closely depend on their environments. Future studies on the detailed structures and kinematics of passive spirals may be beneficial to verify and elaborate our scenarios.
Acknowledgments
We gratefully thank the anonymous referee for constructive comments that have significantly improved this manuscript. This work was supported by UST Young Scientist Research Program through the University of Science and Technology (No. 2019YS10). The SAMI Galaxy Survey is based on observations made at the Anglo-Australian Telescope. The Sydney-AAO Multi-object Integral field spectrograph (SAMI) was developed jointly by the University of Sydney and the Australian Astronomical Observatory. The SAMI input catalogue is based on data taken from the Sloan Digital Sky Survey, the GAMA Survey and the VST ATLAS Survey. The SAMI Galaxy Survey is supported by the Australian Research Council Centre of Excellence for All Sky Astrophysics in 3 Dimensions (ASTRO 3D), through project number CE170100013, the Australian Research Council Centre of Excellence for All-sky Astrophysics (CAASTRO), through project number CE110001020, and other participating institutions. The SAMI Galaxy Survey website is http://sami-survey.org/. Parts of this research were conducted by the Australian Research Council Centre of Excellence for All Sky Astrophysics in 3 Dimensions (ASTRO 3D), through project number CE170100013. JvdS acknowledges support of an Australian Research Council Discovery Early Career Research Award (project number DE200100461) funded by the Australian Government. FDE acknowledges funding through the H2020 ERC Consolidator Grant 683184. JBH is supported by an ARC Laureate Fellowship that funds Jesse van de Sande and an ARC Federation Fellowship that funded the SAMI prototype. H.J. is supported by the National Research Foundation of Korea(NRF) grant funded by the Korea government(MSIT) (No. 2019R1F1A1041086). TMB is supported by an Australian Government Research Training Program Scholarship. JJB acknowledges support of an Australian Research Council Future Fellowship (FT180100231). MSO acknowledges the funding support from the Australian Research Council through a Future Fellowship (FT140100255).
References
- Abolfathi et al. (2018) Abolfathi, B., Aguado, D. S., Aguilar, G., et al. 2018, ApJS, 235, 42
- Athanassoula (2013) Athanassoula, E. 2013, Bars and secular evolution in disk galaxies: Theoretical input, ed. J. Falcón-Barroso & J. H. Knapen, 305
- Barazza et al. (2008) Barazza, F. D., Jogee, S., & Marinova, I. 2008, ApJ, 675, 1194
- Barsanti et al. (2018) Barsanti, S., Owers, M. S., Brough, S., et al. 2018, ApJ, 857, 71
- Bekki & Couch (2011) Bekki, K., & Couch, W. J. 2011, Transformation from spirals into S0s with bulge growth in groups of galaxies, arXiv:1105.0531
- Bekki et al. (2002) Bekki, K., Couch, W. J., & Shioya, Y. 2002, ApJ, 577, 651
- Bernardi et al. (2006) Bernardi, M., Nichol, R. C., Sheth, R. K., Miller, C. J., & Brinkmann, J. 2006, AJ, 131, 1288
- Bershady et al. (2000) Bershady, M. A., Jangren, A., & Conselice, C. J. 2000, AJ, 119, 2645
- Bland-Hawthorn et al. (2011) Bland-Hawthorn, J., Bryant, J., Robertson, G., et al. 2011, Optics Express, 19, 2649
- Bothun & Sullivan (1980) Bothun, G. D., & Sullivan, W. T., I. 1980, ApJ, 242, 903
- Bryant et al. (2014) Bryant, J. J., Bland-Hawthorn, J., Fogarty, L. M. R., Lawrence, J. S., & Croom, S. M. 2014, MNRAS, 438, 869
- Bryant et al. (2015) Bryant, J. J., Owers, M. S., Robotham, A. S. G., et al. 2015, MNRAS, 447, 2857
- Byrd & Valtonen (1990) Byrd, G., & Valtonen, M. 1990, ApJ, 350, 89
- Cayatte et al. (1994) Cayatte, V., Kotanyi, C., Balkowski, C., & van Gorkom, J. H. 1994, AJ, 107, 1003
- Choi et al. (2014) Choi, J., Conroy, C., Moustakas, J., et al. 2014, ApJ, 792, 95
- Cortese & Hughes (2009) Cortese, L., & Hughes, T. M. 2009, MNRAS, 400, 1225
- Cortese et al. (2016) Cortese, L., Fogarty, L. M. R., Bekki, K., et al. 2016, MNRAS, 463, 170
- Couch et al. (1998) Couch, W. J., Barger, A. J., Smail, I., Ellis, R. S., & Sharples, R. M. 1998, ApJ, 497, 188
- Cowie & Songaila (1977) Cowie, L. L., & Songaila, A. 1977, Nature, 266, 501
- Croom et al. (2012) Croom, S. M., Lawrence, J. S., Bland-Hawthorn, J., et al. 2012, MNRAS, 421, 872
- de La Rosa et al. (2011) de La Rosa, I. G., La Barbera, F., Ferreras, I., & de Carvalho, R. R. 2011, MNRAS, 418, L74
- De Lucia et al. (2012) De Lucia, G., Weinmann, S., Poggianti, B. M., Aragón-Salamanca, A., & Zaritsky, D. 2012, MNRAS, 423, 1277
- Dey et al. (2016) Dey, A., Rabinowitz, D., Karcher, A., et al. 2016, Society of Photo-Optical Instrumentation Engineers (SPIE) Conference Series, Vol. 9908, Mosaic3: a red-sensitive upgrade for the prime focus camera at the Mayall 4m telescope, 99082C
- Dressler et al. (1999) Dressler, A., Smail, I., Poggianti, B. M., et al. 1999, ApJS, 122, 51
- Driver et al. (2011) Driver, S. P., Hill, D. T., Kelvin, L. S., et al. 2011, MNRAS, 413, 971
- Fioc & Rocca-Volmerange (1999) Fioc, M., & Rocca-Volmerange, B. 1999, A&A, 351, 869
- Fraser-McKelvie et al. (2018) Fraser-McKelvie, A., Brown, M. J. I., Pimbblet, K., Dolley, T., & Bonne, N. J. 2018, MNRAS, 474, 1909
- Fraser-McKelvie et al. (2016) Fraser-McKelvie, A., Brown, M. J. I., Pimbblet, K. A., et al. 2016, MNRAS, 462, L11
- Goto et al. (2003) Goto, T., Okamura, S., Sekiguchi, M., et al. 2003, PASJ, 55, 757
- Gunn & Gott (1972) Gunn, J. E., & Gott, III, J. R. 1972, ApJ, 176, 1
- Hopkins et al. (2013) Hopkins, A. M., Driver, S. P., Brough, S., et al. 2013, MNRAS, 430, 2047
- Hughes & Cortese (2009) Hughes, T. M., & Cortese, L. 2009, MNRAS, 396, L41
- Humason (1936) Humason, M. L. 1936, ApJ, 83, 10
- Husemann et al. (2013) Husemann, B., Jahnke, K., Sánchez, S. F., et al. 2013, A&A, 549, A87
- Jarrett et al. (2017) Jarrett, T. H., Cluver, M. E., Magoulas, C., et al. 2017, ApJ, 836, 182
- Joshi et al. (2020) Joshi, G. D., Pillepich, A., Nelson, D., et al. 2020, arXiv e-prints, arXiv:2004.01191
- Knapen et al. (2000) Knapen, J. H., Shlosman, I., & Peletier, R. F. 2000, ApJ, 529, 93
- Kormendy & Kennicutt (2004) Kormendy, J., & Kennicutt, Jr., R. C. 2004, ARA&A, 42, 603
- Larson et al. (1980) Larson, R. B., Tinsley, B. M., & Caldwell, C. N. 1980, ApJ, 237, 692
- Lavery & Henry (1988) Lavery, R. J., & Henry, J. P. 1988, ApJ, 330, 596
- Lee et al. (2008) Lee, J. H., Lee, M. G., Park, C., & Choi, Y.-Y. 2008, MNRAS, 389, 1791
- Mahajan & Raychaudhury (2009) Mahajan, S., & Raychaudhury, S. 2009, MNRAS, 400, 687
- Marinova & Jogee (2007) Marinova, I., & Jogee, S. 2007, ApJ, 659, 1176
- Markwardt (2009) Markwardt, C. B. 2009, Astronomical Society of the Pacific Conference Series, Vol. 411, Non-linear Least-squares Fitting in IDL with MPFIT, ed. D. A. Bohlender, D. Durand, & P. Dowler, 251
- Masters et al. (2010) Masters, K. L., Mosleh, M., Romer, A. K., et al. 2010, MNRAS, 405, 783
- Mayer et al. (2001) Mayer, L., Governato, F., Colpi, M., et al. 2001, ApJ, 559, 754
- McDermid et al. (2015) McDermid, R. M., Alatalo, K., Blitz, L., et al. 2015, MNRAS, 448, 3484
- Medling et al. (2018) Medling, A. M., Cortese, L., Croom, S. M., et al. 2018, MNRAS, 475, 5194
- Menéndez-Delmestre et al. (2007) Menéndez-Delmestre, K., Sheth, K., Schinnerer, E., Jarrett, T. H., & Scoville, N. Z. 2007, ApJ, 657, 790
- Mignoli et al. (2009) Mignoli, M., Zamorani, G., Scodeggio, M., et al. 2009, A&A, 493, 39
- Moore et al. (1999) Moore, B., Lake, G., Quinn, T., & Stadel, J. 1999, MNRAS, 304, 465
- Moran et al. (2006) Moran, S. M., Ellis, R. S., Treu, T., et al. 2006, ApJ, 641, L97
- Oh et al. (2018) Oh, S., Kim, K., Lee, J. H., et al. 2018, ApJS, 237, 14
- Owers et al. (2017) Owers, M. S., Allen, J. T., Baldry, I., et al. 2017, MNRAS, 468, 1824
- Owers et al. (2019) Owers, M. S., Hudson, M. J., Oman, K. A., et al. 2019, ApJ, 873, 52
- Pak et al. (2019) Pak, M., Lee, J. H., Jeong, H., et al. 2019, ApJ, 880, 149
- Pasquali et al. (2019) Pasquali, A., Smith, R., Gallazzi, A., et al. 2019, MNRAS, 484, 1702
- Phillipps (1988) Phillipps, S. 1988, A&A, 194, 77
- Poggianti et al. (1999) Poggianti, B. M., Smail, I., Dressler, A., et al. 1999, ApJ, 518, 576
- Proctor et al. (2004) Proctor, R. N., Forbes, D. A., & Beasley, M. A. 2004, MNRAS, 355, 1327
- Reese et al. (2007) Reese, A. S., Williams, T. B., Sellwood, J. A., Barnes, E. I., & Powell, B. A. 2007, AJ, 133, 2846
- Sánchez et al. (2012) Sánchez, S. F., Kennicutt, R. C., Gil de Paz, A., et al. 2012, A&A, 538, A8
- Saunders et al. (2004) Saunders, W., Bridges, T., Gillingham, P., et al. 2004, Society of Photo-Optical Instrumentation Engineers (SPIE) Conference Series, Vol. 5492, AAOmega: a scientific and optical overview, ed. A. F. M. Moorwood & M. Iye, 389–400
- Schaefer et al. (2017) Schaefer, A. L., Croom, S. M., Allen, J. T., et al. 2017, MNRAS, 464, 121
- Schaefer et al. (2019) Schaefer, A. L., Croom, S. M., Scott, N., et al. 2019, MNRAS, 483, 2851
- Schiavon (2007) Schiavon, R. P. 2007, ApJS, 171, 146
- Scott et al. (2017) Scott, N., Brough, S., Croom, S. M., et al. 2017, MNRAS, 472, 2833
- Scott et al. (2018) Scott, N., van de Sande, J., Croom, S. M., et al. 2018, MNRAS, 481, 2299
- Sharp et al. (2006) Sharp, R., Saunders, W., Smith, G., et al. 2006, Society of Photo-Optical Instrumentation Engineers (SPIE) Conference Series, Vol. 6269, Performance of AAOmega: the AAT multi-purpose fiber-fed spectrograph, 62690G
- Smith et al. (2004) Smith, G. A., Saunders, W., Bridges, T., et al. 2004, Society of Photo-Optical Instrumentation Engineers (SPIE) Conference Series, Vol. 5492, AAOmega: a multipurpose fiber-fed spectrograph for the AAT, ed. A. F. M. Moorwood & M. Iye, 410–420
- Smith et al. (2019) Smith, R., Pacifici, C., Pasquali, A., & Calderón-Castillo, P. 2019, ApJ, 876, 145
- Thomas et al. (2011) Thomas, D., Maraston, C., & Johansson, J. 2011, MNRAS, 412, 2183
- Toomre & Toomre (1972) Toomre, A., & Toomre, J. 1972, ApJ, 178, 623
- Treyer et al. (2018) Treyer, M., Kraljic, K., Arnouts, S., et al. 2018, MNRAS, 477, 2684
- van de Sande et al. (2017) van de Sande, J., Bland-Hawthorn, J., Fogarty, L. M. R., et al. 2017, ApJ, 835, 104
- van den Bergh (1976) van den Bergh, S. 1976, ApJ, 206, 883
- Walker et al. (1996) Walker, I. R., Mihos, J. C., & Hernquist, L. 1996, ApJ, 460, 121
- Wilkerson (1980) Wilkerson, M. S. 1980, ApJ, 240, L115
- Wolf et al. (2009) Wolf, C., Aragón-Salamanca, A., Balogh, M., et al. 2009, MNRAS, 393, 1302
- Yamauchi & Goto (2004) Yamauchi, C., & Goto, T. 2004, MNRAS, 352, 815