Mass-radius relation of intermediate-age disk super star clusters of M82
Abstract
We present a complete set of structural parameters for a sample of 99 intermediate-age Super Star Cluster (SSCs) in the disk of M82, and carry out a survival analysis using the semi-analytical cluster evolution code EMACSS. The parameters are based on the profile-fitting analysis carried out in a previous work, with the mass-related quantities derived using a mass-to-light ratio for a constant age of 100 Myr. The SSCs follow a power-law mass function with an index , and a log-normal size function with a typical half-light radius, =4.3 pc, which are both comparable with the values for clusters in the Magellanic Clouds, rather than in giant spirals. The majority of the SSCs follow a power-law mass-radius relation with an index of 0.05. A dynamical analysis of M82 SSCs using EMACSS suggests that 23% of the clusters are tidally-limited, with the rest undergoing expansion at present. Forward evolution of these clusters suggests that the majority would dissolve in 2 Gyr. However, a group of four massive compact clusters, and another group of five SSCs at relatively large galactocentric distances, are found to survive for a Hubble time. The model-predicted mass, , and core radius of these surviving SSCs at 12 Gyr are comparable with the corresponding values for the sample of Galactic globular clusters.
keywords:
galaxies: clusters: general – (Galaxy:) globular clusters: general – catalogues1 Introduction
Stability of auto-gravitating systems such as star clusters is controlled by the relation between their mass (M), radius (R) and velocity dispersion () (Spitzer, 1987). For virialised systems, these three quantities are related by the equality . Evolution of stars in clusters and the dynamical evolution of clusters change the mass and independently, thus forcing a change of their radius (Gieles et al., 2010). The final evolutionary fate of the clusters is dictated by the cluster’s ability to maintain virial equilibrium throughout its lifetime. The presence of globular clusters (GCs), the oldest objects in the Universe, suggests that at least some clusters were able to maintain this equilibrium. These surviving clusters are found to have inter-relation between two of these three quantities, which is manifested by the fundamental plane relations (Djorgovski & Meylan, 1994; McLaughlin & van der Marel, 2005). Elliptical galaxies, which are also auto-gravitating systems but on much larger scale, also follow fundamental plane relations (Djorgovski & Davis, 1987). The most well-known relation among these is the Faber-Jackson relation (Luminosity), which implies a mass-radius relation of the form with =0.5, under virial equilibrium conditions (Faber & Jackson, 1976). The distribution of the half-light radius () of Galactic GCs, on the other hand, peaks 2.5 pc, almost without any dependence on their masses (Harris, 1996). Gieles et al. (2010) and Gieles (2013) attribute such a behaviour to the expansion of clusters during early dynamical evolution. These studies found that massive GCs ( M⊙) are less prone to expansion and retain the mass-radius relation with =0.5.
Terlevich et al. (2018) analysed the long-term evolutionary behaviour of Young Massive Clusters (YMCs) in magnitude () vs central velocity dispersion () plane. They found that the evolved YMCs show a break in the vs relation with the mass at the break corresponding to M⊙, with systems more massive than this value following the relation for elliptical galaxies, and lower mass systems following the relation for the GCs. GCs being the oldest clusters, they sample the properties of surviving clusters. In order to understand the general evolutionary behaviour of clusters, it is mandatory to study also the sample of clusters that do not survive for Hubble time. We are likely to encounter such clusters in samples of clusters of intermediate ages (– yr). At these ages cluster evolution is expected to be dominated by the early expansion. The size of the expanding clusters is eventually limited by the tidal radius (), which in galaxies with flat rotation curve is given by , where is the galactocentric radius. Thus, tidally-limited clusters located at similar are expected to follow a mass-radius relation with 0.33.
Many efforts had been made to observationally obtain the relation between the radius containing half the mass and the cluster mass, i.e. the mass-radius relation for clusters younger than GCs in nearby galaxies. Fall & Chandar (2012) found =0.5 for intermediate age (– yr) massive clusters in the LMC, SMC and other Milky Way satellites. On the other hand, massive clusters in NGC7252 and NGC1316 support =0.3 (Bastian et al., 2013; Kissler-Patig et al., 2006; Bastian et al., 2006; Maraston et al., 2004). Even shallower relation () have been found in a variety of galaxies: in M31 (Barmby et al., 2009), in a sample of spiral galaxies (Larsen, 2004), in the nearby interacting galaxies NGC 5194/5195 (M51) (Bastian et al., 2005; Lee et al., 2005; Hwang & Lee, 2010), and in the merger galaxy NGC3256 (Zepf et al., 1999).
M82 disk clusters offer a great opportunity to understand the evolution of clusters at intermediate ages. The disk has a rich population of SSCs that span 3 orders of magnitude in mass (– M⊙), distributed in relatively small range of (0.5–4.0 kpc) (Mayya et al., 2008). These clusters were formed in a disk-wide burst following its fly-by interaction with M81 500 Myr ago (Yun, 1999; Mayya et al., 2006). Spectroscopically determined ages of SSCs show a peak 150 Myr, with relatively narrow age range (50–350 Myr) (Konstantopoulos et al., 2009). Use of SSP models indicates that the error in the mass determined assuming a constant age of 100 Myr introduced due to the age spread at the most amounts to a factor of 2.5, which is small compared to the 1000-fold range of masses (Bruzual & Charlot, 2003). The galaxy is relatively nearby (3.63 Mpc; Freedman et al., 1994), which allows accurate determination of structural parameters using the HST/ACS images. Such an analysis has already been carried out by Cuevas-Otahola et al. (2020, hereinafter Paper I). We use this latter dataset to study the mass-radius relation at intermediate ages.
In §2, we briefly describe the properties of the sample of SSCs in the disk of M82 and present the obtained distributions of masses and half-light radius. In §3 we discuss the mass-radius relationship at different masses and radii, as well as the relation between surface brightness and core radius for our sample SSCs. We also perform some analytical simulations to understand the relation between these SSCs and the observed GCs. We discuss and summarise our results in §4.
| ID | ||||||||||||||
|---|---|---|---|---|---|---|---|---|---|---|---|---|---|---|
| (kpc) | (pc) | (pc) | (pc) | () | () | () | () | () | () | |||||
| (1) | (2) | (3) | (4) | (5) | (6) | (7) | (8) | (9) | (10) | (11) | (12) | (13) | (14) | (15) |
| D1 | 0.70 | 2.73 | 0.57 | 1.67 | 31.67 | 0.94 | 4.99 | 5.06 | 5.68 | 6.57 | 4.39 | 5.32 | 13.35 | 0.04 |
| D8 | 2.61 | 3.39 | 2.21 | 4.07 | 11.76 | 0.85 | 2.33 | 2.98 | 4.62 | 5.51 | 2.17 | 3.49 | 2.29 | 0.06 |
| D23 | 3.75 | 3.43 | 1.01 | 1.83 | 37.77 | 0.99 | 3.71 | 4.03 | 4.98 | 5.87 | 3.57 | 4.54 | 5.78 | 0.01 |
| D50 | 0.86 | 3.85 | 1.71 | 2.75 | 11.97 | 0.94 | 3.62 | 4.17 | 5.53 | 6.42 | 3.59 | 4.74 | 8.12 | 0.06 |
| D51 | 2.20 | 3.99 | 3.94 | 6.13 | 5.53 | 0.45 | 1.80 | 2.71 | 4.78 | 5.67 | 1.79 | 3.29 | 1.71 | 0.09 |
| D163 | 1.06 | 4.00 | 4.53 | 7.04 | 5.91 | 0.41 | 2.51 | 3.48 | 5.68 | 6.56 | 2.51 | 4.07 | 4.23 | 0.11 |
| D199 | 1.30 | 4.00 | 1.20 | 1.86 | 17.38 | 0.99 | 3.84 | 4.23 | 5.27 | 6.15 | 3.84 | 4.82 | 7.73 | 0.03 |
| D296 | 1.25 | 4.00 | 2.82 | 4.38 | 10.55 | 0.85 | 3.21 | 3.97 | 5.75 | 6.64 | 3.21 | 4.56 | 7.07 | 0.05 |
| D303 | 3.20 | 3.89 | 2.05 | 3.27 | 8.79 | 0.87 | 2.09 | 2.72 | 4.24 | 5.12 | 2.07 | 3.30 | 1.59 | 0.05 |
Description of the columns: (1) Cluster ID. (2) Galacto-centric radius in kiloparsecs. (3) Moffat-EFF power-law index (from Paper I except that 4 are set to 4). (4) Core radius in parsecs (calculated using Eq. 2). (5) Half-light radius in parsecs (calculated using Eq. 3). (6) Tidal radius in parsecs (see Appendix A). (7) Fraction of the total mass of Moffat-EFF profile within the tidal radius (calculated using Eq. 6). (8-13) Logarithm of central mass volume density, central mass surface density, total mass, total luminosity, half-light mass volume density, and average surface brightness within , respectively. The mass-related quantities (columns 8, 9, 10, 12 and 14) are obtained from the corresponding luminosity-related quantities assuming a mass-to-light ratio for an SSP of 100 Myr and using a Kroupa IMF (Kroupa, 2001). The effects of a different age choice in the values in columns 8, 9, 10, and 12 are given by adding the term and in column 14 by multiplying by . (14) Projected central velocity dispersion (see Appendix A). (15) Initial half-mass to Jacobi radius ratio. This table is shown in its entirety in the electronic edition. A portion is shown here for guidance, which is constituted by the most interesting set of SSCs (see §3.3).
2 Sample and the derived parameters
In this work, we analyse the mass-radius relation for the M82 disk SSCs sample studied in Paper I. The sample consists of 99 SSCs from the M82 disk SSCs sample of 393 clusters from Mayya et al. (2008), selected on the archival images of the HST Legacy Survey (Mutchler et al., 2007). In Paper I, we have demonstrated that the sub-sample of 99 SSCs represents the bright end of the total sample. The structural parameters were derived for the best-fitting Moffat-EFF (Elson et al., 1987), King (King, 1966) and Wilson (Wilson, 1975) models. We found that the Moffat-EFF model is the best-fit for 95% of the cases, and hence in this study we use the parameters of this model. The Moffat-EFF model had been used in the characterisation of clusters of intermediate age in other galaxies, e.g. the LMC, SMC (Mackey & Gilmore, 2003a, b), Antennae (Whitmore & Schweizer, 1995), M83 and NGC1313/628 (Ryon et al., 2015; Ryon et al., 2017).
In Paper I, we presented the results for the core radius and the power-law index for the disk sample. In this paper, we use the results of the profile fitting to calculate the full set of structural parameters, that includes half-light radius , central mass density (), central surface density (), central velocity dispersion, luminosity and mass. We include also an important quantity related to the initial conditions of the cluster with respect to the galaxy tidal field, i.e., the initial half-mass to Jacobi radius ratio (See §3.2). Some of these parameters depend on the dynamical evolution of the cluster, and hence this dataset is useful to test the predictions of models of dynamical evolution at intermediate ages. In Table 1, we summarise all the derived parameters in the V-band for the Moffat-EFF model for all the clusters. We note that not all the tabulated parameters are independent of each other. Nevertheless, considering their usefulness we list them.
2.1 Age and extinction of the clusters
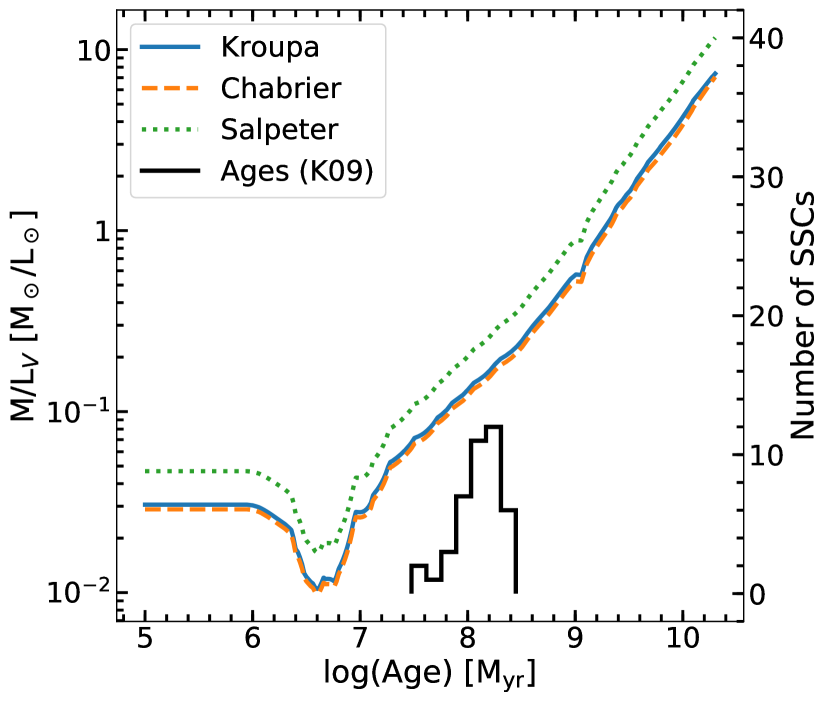
Among the set of Moffat-EFF parameters, , and are directly derived from the best-fit model, whereas the other parameters are derived assuming an age and extinction. In the first place, most of the disk clusters in M82 are believed to have formed in a disk-wide burst around 300 Myr ago following the last fly-by interaction with its neighbour M81 (Yun, 1999; Mayya et al., 2006). Available spectroscopic ages for a sample of 42 disk SSCs (Konstantopoulos et al., 2009) are plotted in Fig. 1 (the inset). The majority has ages between 100–300 Myr, with the median 150 Myr. The relatively small dispersion in ages supports the burst-origin scenario for the formation of disk SSCs. In this figure, we also show the mass-to-light ratio () variation as a function of age using Bruzual & Charlot (2003) Simple Stellar Population models (SSPs). lies between 0.08 to 0.2 in the V-band for the range of ages of M82 SSCs for Kroupa (Kroupa, 2001) and Chabrier (Chabrier, 2003) Initial Mass Functions (IMFs). The values are around a factor of 2.5 higher for Salpeter IMF (Salpeter, 1955). Given the burst-origin for the disk SSCs, all the disk SSCs, including those for which we do not have spectroscopic ages, are expected to have ages between 100–300 Myr. In order to determine the effects of the age in the derived parameters, we have fitted a power-law function of the form to the mass-to-light ratio values, with the age varying between 50–500 Myr, which gives . If some SSC is as young as 50 Myr, its mass would be 67% of the mass reported here, and if the SSC is as old as 500 Myr, its mass would be 2.5 times higher. Extinction is the second parameter that affects the values of some of the derived parameters. Mayya et al. (2008) tabulated based on B-V and B-I colour excesses over that expected for an SSP of 100 Myr age, and using Cardelli et al. (1989) extinction curve. We used their values here.
2.2 Model-derived parameters
2.2.1 Total luminosities and masses
From Paper I, we recall the form of the Moffat-EFF intensity profile :
| (1) |
where is the semi-major axis of the observed profile, is the total asymptotic luminosity of the profile, is the power-law index, is the characteristic radius which is related to the core radius, by:
| (2) |
The best-fitting model using equation 1 directly gives , which immediately allows the calculation of total mass, assuming a mass-to-light ratio () value from SSP models for a fixed age of 100 Myr. We used a in the visual band of 0.13 corresponding to a Kroupa SSP model of Bruzual & Charlot (2003).
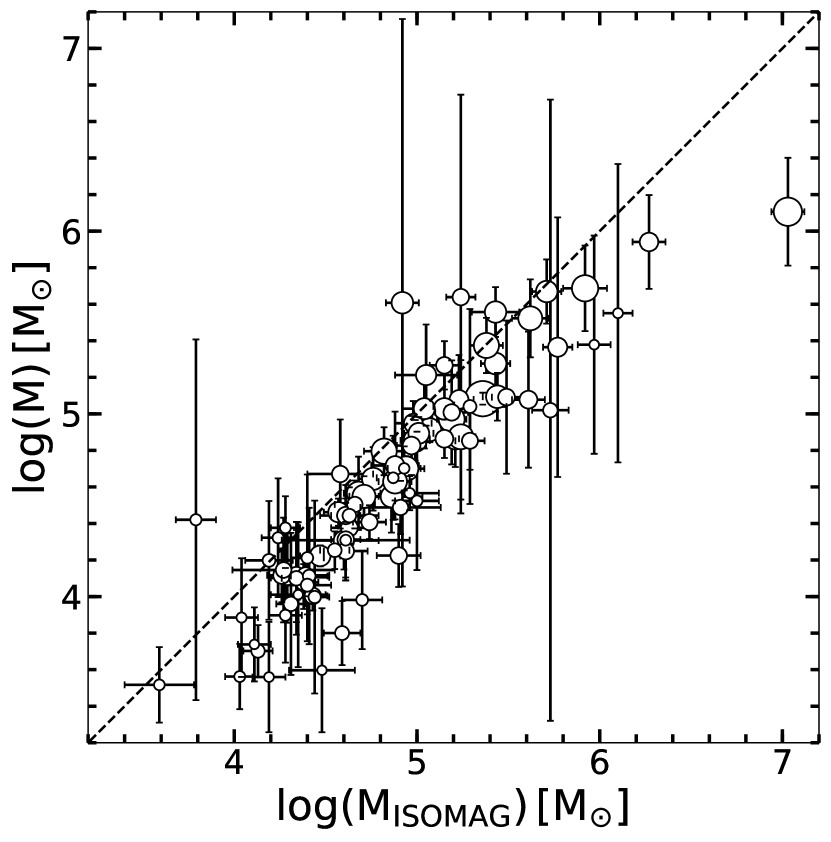
Mayya et al. (2008) derived photometric masses () for all the disk clusters assuming a constant age of 100 Myr and using isophote magnitudes obtained by SExtractor. The model-derived mass is expected to be more accurate than , due to a more careful treatment of the local background for subtraction. In Fig. 2, we compare these two masses. For the sake of comparison, we used the Girardi et al. (2002) SSPs to be consistent with the mass calculated in Mayya et al. (2008). The errors on (x-axis) take into account the errors in the determination of magnitude and the extinction, whereas the errors on model-derived masses (y-axis) are obtained by propagating the errors of the best-fit parameters. As expected, there is good agreement between the two mass determinations. However, masses are systematically larger by dex. This is due to underestimation of background in the SExtractor-determined ISOMAG. The masses derived here are current masses (not initial masses) and take into account mass-loss from stars during the evolution of clusters.
2.2.2 Model-derived , , ,
The half-mass radius, the radius that contains half of the total mass is traditionally used as a proxy to the cluster size in most theoretical works. For clusters that do not have strong colour gradients, it is identical to the observationally measurable quantity, the half-light radius, . For the Moffat-EFF profile, the is analytically related to the fitted structural parameters and by
| (3) |
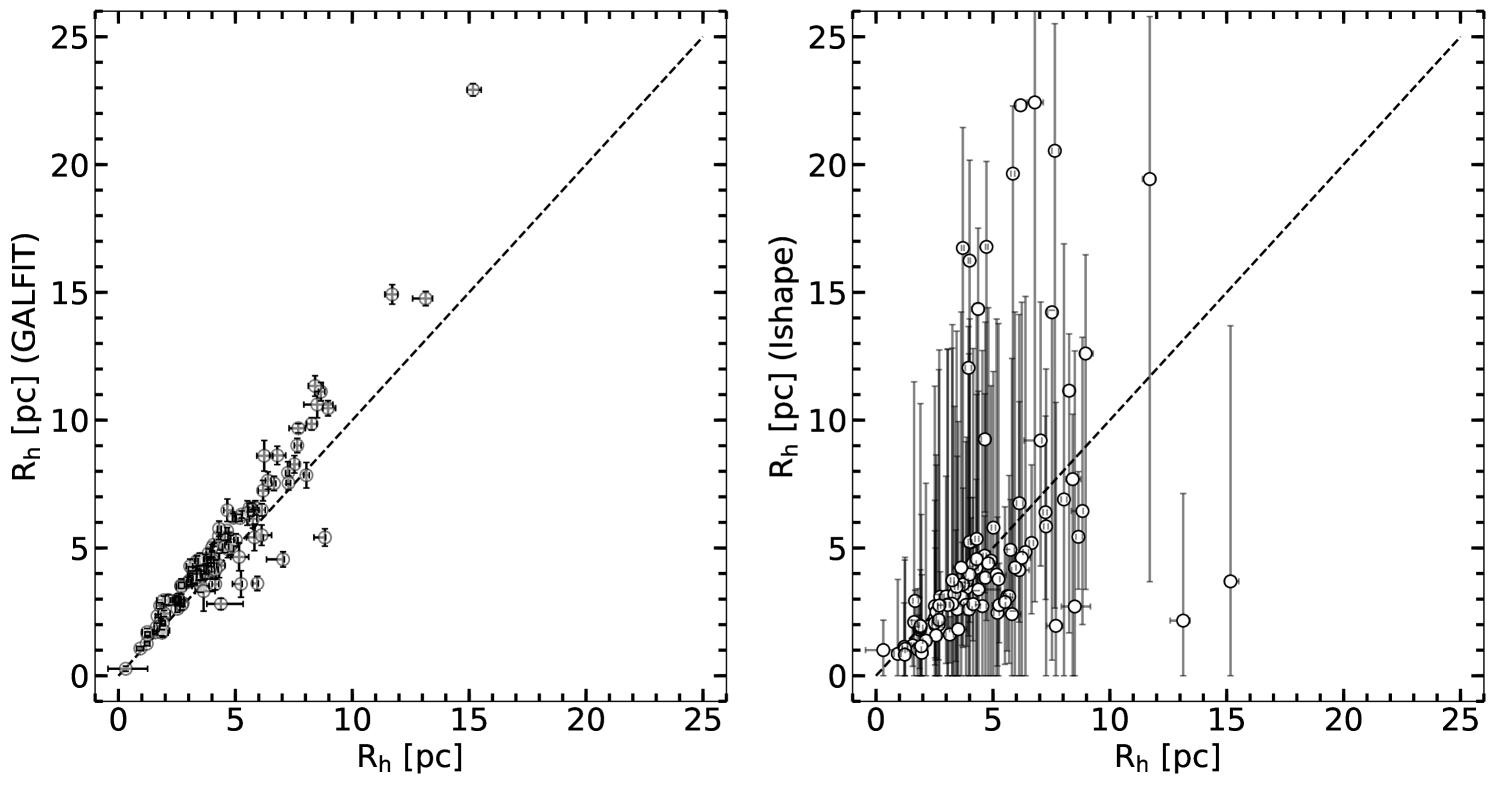
The errors on and are propagated to obtain the errors on the derived . In Figure 3, we compare the calculated using our code with the corresponding values obtained by us using two other popularly used codes, galfit (Peng et al., 2010) and Ishape (Larsen, 1999). For this purpose, we used the fits that we carried out using these codes in Paper I. As in Paper I for , the agreement between measurements is excellent with galfit, whereas there is a larger dispersion of the values obtained with Ishape.
Another parameter of interest is the central mass density , which is related to the central luminosity density by . The is obtained from the best-fitting following the prescription of Elson et al. (1987).
Moffat-EFF profile is an empirical profile and hence does not have the underlying equations that describe the radial density structure and stability of a cluster. However, the velocity dispersion profile of a spherical cluster that has a Moffat-EFF profile can be derived under the simplifying assumptions of hydrostatic equilibrium and isotropic velocity distribution. Elson et al. (1987) found the solution for the velocity dispersion profile for such a cluster under the presence of the tidal force of the host galaxy. We used their equation 16 to obtain velocity dispersion profile (r) for each one of the M82 clusters. These (r) profiles are then projected onto the plane of the sky, following the method described in Appendix A, where we also show the resulting (r) profiles for one illustrative cluster at various values of galacto-centric distances. It can be seen that the (r) in the presence of a tidal field drops abruptly to zero at a finite radius, in spite of the observed intensity profiles not showing any truncation. The radius where (r) reaches zero is the tidal radius , and hence the contribution to the intensity outside this radius comes from unbound stars. The projected central velocity dispersion , which is a direct observational quantity, and , are tabulated in columns 14 and 5 of Table 1, respectively. The most massive of our clusters, D1 (known in the literature as M82-F) has been the target of measurements. The value calculated for this cluster from our fitting (13.35 km/s) agrees well with the observed values of 13.40.7 km/s obtained by Smith & Gallagher (2001) and 12.40.3 km/s obtained by McCrady & Graham (2007).
The presence of unbound stars just outside the tidal radius is expected at intermediate ages because it takes 5–10 orbital periods around the parent galaxy for the unbound stars to be stripped away (Elson et al., 1987). For the circular velocity of M82, orbital period varies from 30 Myr at 0.5 kpc to 250 Myr at 4 kpc, which implies a tidal stripping timescale of 150–300 Myr at the inner-most radius of the disk. At other galactocentric distances it would take 1 Gyr for tidal stripping. This explains the prevalescense of Moffat-EFF profiles for M82 disk SSCs which are 100 Myr old. From the obtained values it is possible to compute the bound mass of the clusters , by integrating the volume density profile in the limits 0 and .
2.3 Cluster mass function
Mass distribution of star clusters in galaxies is found to follow a power-law function. The power-law slope for young clusters is well-established and is close to 2 (de Grijs et al., 2003a) over a range of 3 orders of magnitude in mass (– M⊙). Observational characterisations of the mass function for evolving populations (age 10 Myr) in several nearby galaxies, such as M51 (Bik et al., 2003), Antennae (Zhang & Fall, 1999), the starburst galaxies NGC 3310 and NGC 6745 (de Grijs et al., 2003b), and LMC (de Grijs & Goodwin, 2008) do not provide any compelling evidence for a change, neither in form, nor in the slope of the power-law function. However, young SSCs in the nuclear region of M82 have shown a tendency for a slightly flatter slope with McCrady & Graham (2007) obtaining a slope of 1.9 and Mayya et al. (2008) obtaining a value of 1.8. The distribution at the high-mass end of the CMF falls sharply, which is found to be a common characteristic (Larsen, 2009) and is often fitted with a Schechter function (Schechter, 1976). Clusters loose mass during their evolution, both due to stellar evolution, and dynamical processes (Gieles & Alexander, 2017). The former process is not expected to alter the slope of the function, as long as the IMF of stars is independent of the mass of the clusters, whereas the impact of the latter process is mass-dependent and hence will influence the CMF of evolving clusters (Gieles, 2009).
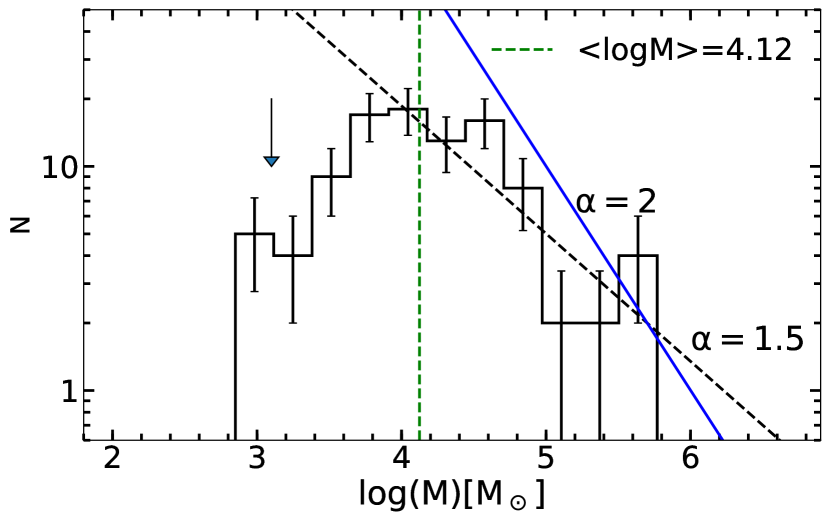
Availability of a large population of SSCs, all formed over a short interval of time around 100 Myr ago in M82 disk, allows to study the CMF of almost a coeval population. Such a study was carried out in Mayya et al. (2008) using the photometric masses for the SSCs studied here, finding an =1.5, for SSCs of mass above . We reanalyse the CMF using the masses obtained from Eq. 1. In Fig. 4, we show the distribution of model-derived masses. The distribution is a power-law function with =1.5 for , reproducing the results of Mayya et al. (2008) for the subsample of clusters analysed here. The distribution remains nearly flat between (1–4), dropping steeply for lower masses, below the completeness limit.
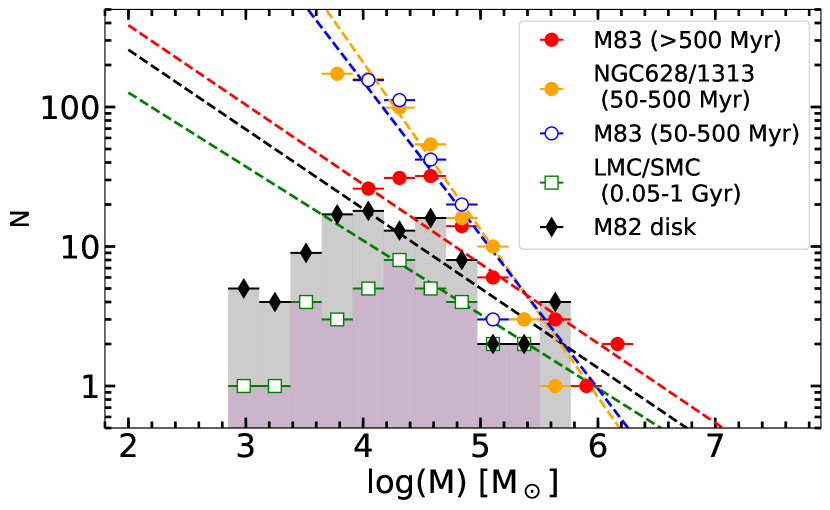
In the bottom panel of Fig. 4, we compare the distribution of masses of the M82 disk SSCs with those in other galaxies where a fit of basic structural parameters had been carried out: LMC/SMC (Mackey & Gilmore, 2003a, b), M83, NGC1313 and NGC628 (Ryon et al., 2015; Ryon et al., 2017). The distribution and the slope of the high-mass end of the mass function for LMC/SMC intermediate-age clusters compares very well with those of M82. On the other hand, intermediate-age SSCs in M83 and NGC628/1313 have the same slope as for young clusters (). The slope of the high-mass end of the distribution of old clusters (>500 Myr) in M83 is similar to that in M82. These tendencies are remarkably similar to the tendencies we have found in the distributions of in Paper I.
The M82 data for disk SSCs are clearly not compatible with =2.0 found for young clusters in other galaxies. The mass function is also flatter than that for its young clusters in the nuclear region, which as discussed above, is marginally flatter than that for cluster populations in other star-forming galaxies. Thus, even if M82 disk SSCs were formed with a flatter IMF as in the case for clusters in its nuclear region (=1.8), the CMF has evolved, implying that the cluster evolution in the disk of M82 is mass-dependent. The most important dynamical process that is at work at the ages of M82 SSCs is the tidal effect on the clusters from the gravitational potential of the host galaxy. Our analysis of the structural parameters allows us to investigate this issue, which we will carry out in §3
2.4 distribution
Clusters in their early phase are expected to undergo adiabatic expansion leading to an increase in their radius. This is principally driven by the loss of residual gas from the cluster volume (Goodwin & Bastian, 2006). Evidence for such an expansion has been observationally found by Bastian et al. (2008) for extragalactic star clusters of age 100 Myr. Clusters in the LMC/SMC are also found to be in expansion (Mackey & Gilmore, 2003a, b). In the presence of a tidal field, sizes of the expanding clusters are limited by the tidal radius (King, 1962). At late times, contraction of the core due to core-collapse may reduce the cluster sizes before they reach the tidal radius. Gieles (2013) found that only a third of the Milky Way GCs have reached their tidal radii, with the rest still expanding. We here study the distribution of half-light radius for our sample of intermediate-age SSCs in the disk of M82 and compare them with distributions of different-age clusters in other galaxies.
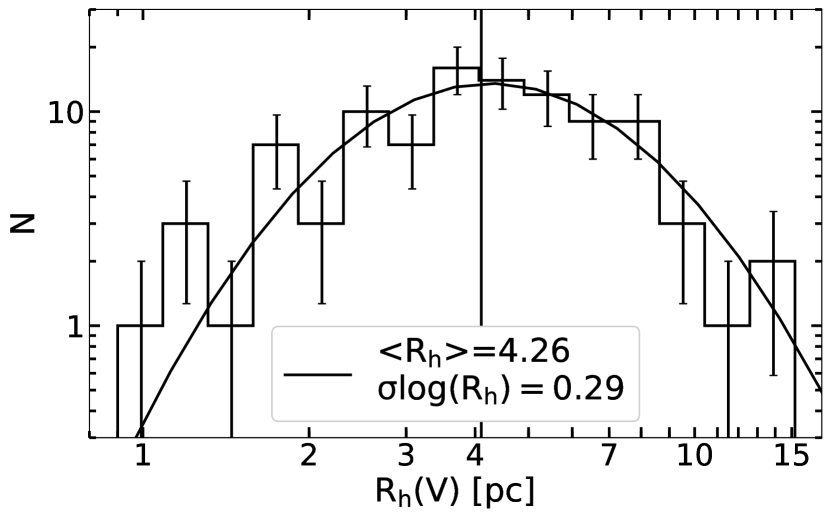
In Fig. 5, we show the distribution of in the V band in logarithmic bins for the M82 disk SSCs. The distribution is well-fitted with a log-normal function with 0.3 dex, centered at 4.26 pc. This value is slightly higher than the values of for young SSCs (Portegies Zwart et al., 2010). In particular, for the young SSC R136 in the LMC, Mackey & Gilmore (2003a) reported an value as small as 1.3 pc which is a factor of 3 smaller compared to our mean values in M82. Our values are comparable to those of Galactic GCs.
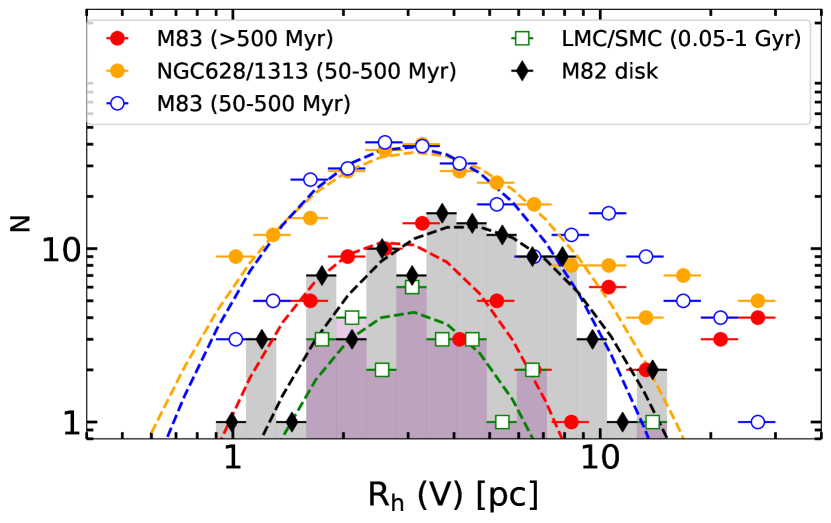
We compare the M82 distribution with that for intermediate-age SSCs in other galaxies using the same sample described in §2.3. LMC/SMC clusters have a mean value similar to that in M82, although the distribution in LMC/SMC does not show the tail towards high values. On the other hand, the distribution is slightly shifted toward lower values for intermediate-age and old clusters in NGC1313/628 and M83. These differences in the mean values of the distribution are similar to the tendencies of the distribution presented in Paper I. These differences could be related to the morphological type of the host galaxies — giant galaxies such as M83 are expected to have intense tidal fields, which play an important role in limiting the sizes of clusters.
3 Mass-radius relation and the fundamental plane
Mayya et al. (2008) found a trend of more massive SSCs in M82 being slightly larger than the less massive ones. In their study, they had used the Sextractor-derived FWHM as a proxy for sizes. We here re-revisit the mass-radius relation using the obtained in this work for the sub-sample of M82 disk SSCs.
3.1 Mass-radius relation
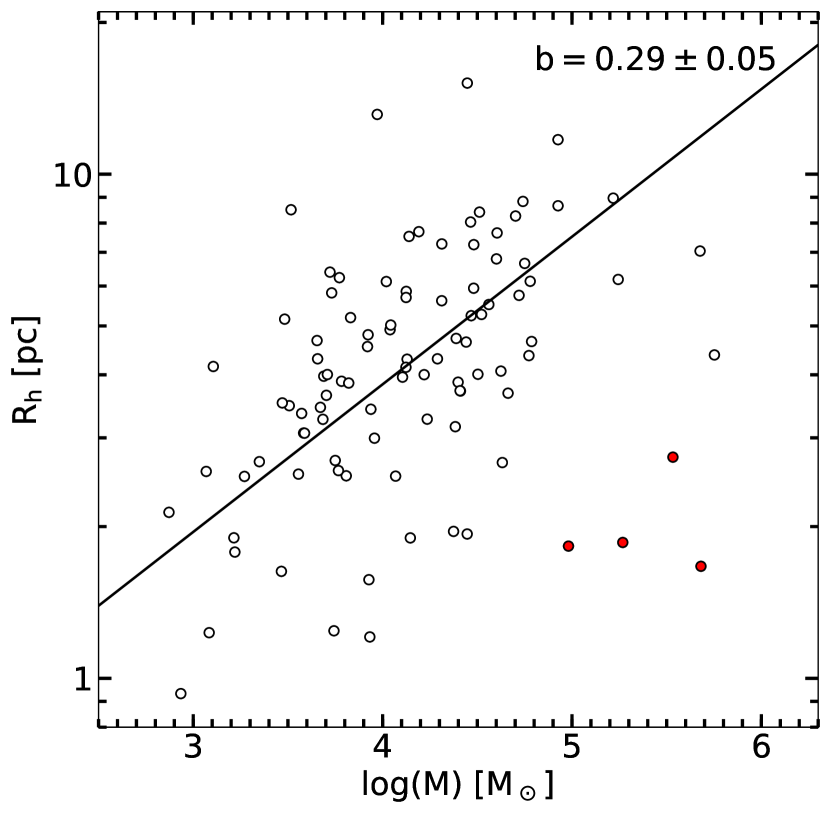
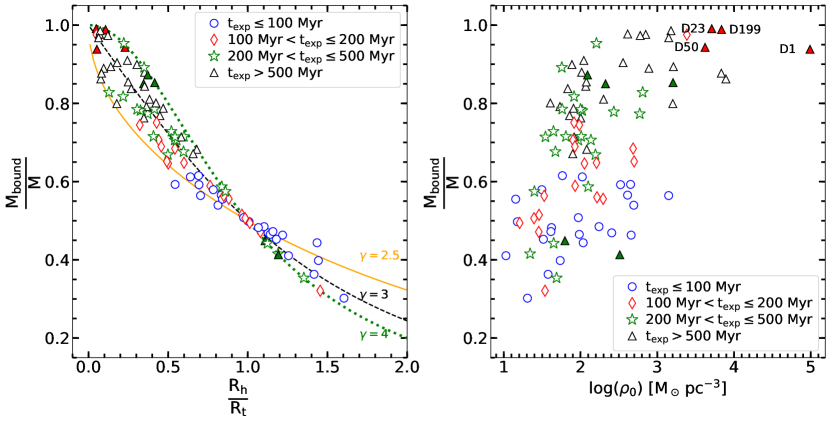
In Fig. 6, we plot the versus mass for the M82 disk sample analysed here. The majority of the SSCs (open circles) follows a trend of radius increasing with the cluster mass over two orders of magnitude in mass. Even after taking into account the dispersion over this trend, we recognise a group of 4 SSCs (shown by red filled circles), which are among the most massive clusters in our sample, that seem to be not following this trend. A least square fitting to the sample of SSCs excluding these 4 SSCs gives us a relation of the form: with . We used the orthogonal slope as defined in Isobe et al. (1990) to carry out the fitting. The observed power-law index is close to 1/3, the value expected for tidally-limited clusters.
The observed slope is distinct from 0.5, which is the value expected for virialized clusters (Gieles et al., 2010). Hence, at the outset it would seem that the majority of the M82 disk clusters are tidally-limited, with the group of 4 massive clusters being more compact than their tidal values. We refer to this group of 4 clusters as the massive-compact SSCs henceforth in this paper. The tidal radius for a cluster of M⊙ in the disk of M82 is 30–50 pc between galacto-centric radius of 0.5 kpc and 4 kpc, which is much larger than the average half-mass radius at birth of compact clusters (typically less than 1 pc, Baumgardt et al., 2010; Banerjee & Kroupa, 2017). Hence, clusters need to expand so as to be tidally-limited. A detailed computation of the dynamical evolution of clusters under the tidal influence of M82’s gravitational field is required in order to understand whether the majority of M82 clusters are tidally-limited. We carried out such a study, whose results are presented below.
3.2 Cluster evolution using EMACSS tool
We carried out the evolution of M82 clusters using EMACSS (Evolve Me a Cluster of StarS; Alexander & Gieles, 2012; Alexander et al., 2014), a publicly available fast evolutionary code. In this simplified analytical code, the dynamical evolution of a cluster is treated in terms of the flow of energy normalised to the initial energy and relaxation time. The code allows to study the evolution of clusters in the mass-radius plane for an assumed initial mass-radius relation in the presence of a tidal field of a singular isothermal halo, which is parameterised by a flat rotation curve (Gieles et al., 2010). Based on CO velocities for the nuclear region and stellar and HI velocities in the rest of the disk Sofue (1998) suggested almost a Keplerian rotation curve for M82, implying the absence of a massive halo (see also Mayya & Carrasco, 2009). However, more recent studies using the star cluster velocities suggest a flat rotation curve with a circular velocity of 100 km s-1 (i.e. Konstantopoulos et al., 2009; Greco et al., 2012). In order to determine the influence of tidal forces in shaping the observed mass-radius relation at intermediate ages, we considered clusters at several values of galacto-centric radius (), covering the disk from 0.5 to 5 kpc, and evolved them from their birth up to 12 Gyr. The results are saved at specific epochs of interest, especially at 100 Myr, which is the assumed canonical age of our sample of SSCs.
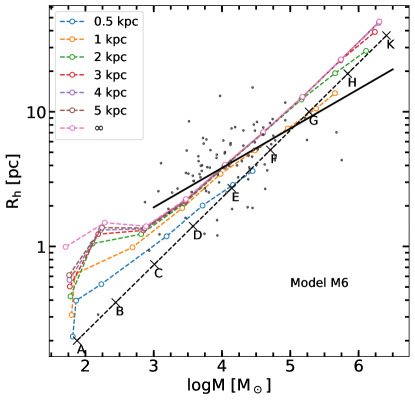
The first set of initial mass-radius relation we used is the virial mass-radius relation, following its use by Gieles et al. (2010). Under virial equilibrium, these relations correspond to constant surface brightness within the half-mass radius (), in which case . The complete set of initial mass-radius values explored by us is given in Tab. 2, where each model name identified by M1, M2, M3, M4, M5, M6, M7, M8 and M9 corresponds to a particular mass-radius relation with a fixed , and consists of a set of 9 values of mass and radius, identified by letters A, B, C, D, E, F, G, H, and K, with A and K corresponding to the least and most massive cases in each relation, respectively. Each model was evolved under the gravitational potential of M82 located at values from 0.5 kpc to 5 kpc, which covers the full range of s for the disk SSCs in M82. The distributions of initial (t=0) and present (t=100 Myr) values are shown in Figure 7 by vertical bars of blue and red colours, respectively. The figure also shows the observed distribution of for our sample clusters, which is well within the range of values covered by the 100 Myr models.
The four massive compact SSCs, which are outliers in Figure 6, are well described by models M1 to M3. Evolution of these densest clusters in the gravitational field of M82 follows the same locus as for isolated clusters, as can be inferred from the evolution of model M3 in the Appendix Figure 17. Thus, the group of four massive clusters represents a subset of clusters that evolve without the tidal influence of their host galaxy M82. In other words, the evolution of these clusters is independent of their galacto-centric distances.
| Point | M1 | M2 | M3 | M4 | M5 | M6 | M7 | M8 | M9 | |
|---|---|---|---|---|---|---|---|---|---|---|
| (pc) | () | () | () | () | () | () | () | () | () | |
| (=5.8) | (=5.2) | (=4.6) | (=4.5) | (=3.7) | (=3.4) | (=3.1) | (=2.8) | (=2.7) | ||
| (1) | (2) | (3) | (4) | (5) | (6) | (7) | (8) | (9) | (10) | (11) |
| A | 0.20 | 4.3 | 3.7 | 3.1 | 3.0 | 2.2 | 1.9 | (X,X) | (X,X) | (X,X) |
| B | 0.38 | 4.8 | 4.2 | 3.7 | 3.5 | 2.7 | 2.4 | 2.1 | 1.8 | (X,X) |
| C | 0.74 | 5.4 | 4.8 | 4.3 | 4.1 | 3.3 | 3.0 | 2.7 | 2.4 | 2.3 |
| D | 1.41 | 6.0 | 5.4 | 4.8 | 4.7 | 3.9 | 3.6 | 3.3 | 3.0 | 2.9 |
| E | 2.71 | 6.5 | 5.9 | 5.4 | 5.2 | 4.4 | 4.1 | 3.8 | 3.5 | 3.4 |
| F | 5.21 | 7.1 | 6.5 | 6.0 | 5.8 | 5.0 | 4.7 | 4.4 | 4.1 | 4.0 |
| G | 10.00 | 7.7 | 7.1 | 6.5 | 6.4 | 5.6 | 5.3 | 5.0 | 4.7 | 4.6 |
| H | (X,X) | 8.2 | 7.6 | 7.1 | 6.9 | 6.1 | 5.8 | 5.5 | 5.2 | 5.1 |
| K | (X,X) | (X,X) | 8.2 | 7.7 | 7.5 | 6.7 | 6.4 | 6.1 | 5.8 | 5.7 |
Col (1): Point designation with A having the smallest mass and radius, and with K the largest of each model line described in Cols (3)-(11). Col (2) Initial half-mass radius in parsecs. Cols (3)-(11), logarithm of initial mass in units of . In each column is shown in parentheses the corresponding logarithmic surface brightness of each model in units of . (X,X) stands for clusters with inadmissible conditions (above or below the limits for the EMACSS code).
| Point | M1 | M2 | M3 | M4 | M5 | M6 | M7 | M8 | M9 | |
|---|---|---|---|---|---|---|---|---|---|---|
| (kpc) | (,,) | (,,) | (,,) | (,,) | (,,) | (,,) | (,,) | (,,) | (,,) | |
| (1) | (2) | (3) | (4) | (5) | (6) | (7) | (8) | (9) | (10) | (11) |
| A | (0.7,3.9,0) | (0.7,5.1,0) | (0.6,6.5,0) | (0.6,6.8,0) | (0.6,7.1,0) | (0.7,5.0,0) | (X,X,X) | (X,X,X) | (X,X,X) | |
| B | (0.8,1.6,0) | (0.7,2.1,0) | (0.7,2.8,0) | (0.7,2.9,0) | (0.7,3.8,0) | (0.7,3.9,0) | (0.7,3.8,0) | (0.7,2.7,0) | (X,X,X) | |
| C | (0.8,1.6,0) | (0.8,1.6,0) | (0.8,1.6,0) | (0.8,1.6,0) | (0.8,1.7,0) | (0.8,1.9,0) | (0.7,2.1,0) | (0.7,2.2,0) | (0.7,2.2,0) | |
| D | (0.8,1.4,0) | (0.8,1.5,0) | (0.8,1.5,0) | (0.8,1.5,0) | (0.8,1.6,0) | (0.8,1.6,0) | (0.8,1.6,0) | (0.8,1.6,0) | (0.8,1.6,0) | |
| E | (0.8,1.3,0) | (0.8,1.3,0) | (0.8,1.4,0) | (0.8,1.4,0) | (0.8,1.5,0) | (0.8,1.5,0) | (0.8,1.5,0) | (0.8,1.5,0) | (0.8,1.5,0) | |
| F | (0.8,1.3,0) | (0.8,1.3,0) | (0.8,1.3,0) | (0.8,1.3,0) | (0.8,1.3,0) | (0.8,1.4,0) | (0.8,1.4,0) | (0.8,1.4,0) | (0.8,1.4,0) | |
| G | (0.8,1.3,0) | (0.8,1.3,0) | (0.8,1.3,0) | (0.8,1.3,0) | (0.8,1.3,0) | (0.8,1.3,0) | (0.8,1.3,0) | (0.8,1.3,0) | (0.8,1.3,0) | |
| H | (X,X,X) | (0.8,1.3,0) | (0.8,1.3,0) | (0.8,1.3,0) | (0.8,1.3,0) | (0.8,1.3,0) | (0.8,1.3,0) | (0.8,1.3,0) | (0.8,1.3,0) | |
| K | (X,X,X) | (X,X,X) | (0.8,1.3,0) | (0.8,1.3,0) | (0.8,1.3,0) | (0.8,1.3,0) | (0.8,1.3,0) | (0.8,1.3,0) | (0.8,1.3,0) | |
| A | 2 | (0.7,3.9,0.01) | (0.7,5.1,0.01) | (0.6,5.9,0.02) | (0.5,5.9,0.03) | (0.4,4.4,0.05) | (0.8,2.1,0.05) | (X,X,X) | (X,X,X) | (X,X,X) |
| B | 2 | (0.8,1.6,0.01) | (0.7,2.1,0.02) | (0.7,2.7,0.03) | (0.7,2.8,0.03) | (0.5,3.0,0.06) | (0.5,2.7,0.08) | (0.4,2.3,0.10) | (0.8,1.2,0.10) | (X,X,X) |
| C | 2 | (0.8,1.6,0.01) | (0.8,1.6,0.02) | (0.8,1.6,0.03) | (0.8,1.6,0.04) | (0.7,1.6,0.07) | (0.6,1.7,0.09) | (0.6,1.6,0.12) | (0.5,1.5,0.16) | (0.5,1.4,0.17) |
| D | 2 | (0.8,1.4,0.02) | (0.8,1.5,0.03) | (0.8,1.5,0.04) | (0.8,1.5,0.04) | (0.8,1.5,0.08) | (0.8,1.5,0.11) | (0.7,1.4,0.13) | (0.7,1.4,0.17) | (0.7,1.3,0.19) |
| E | 2 | (0.8,1.3,0.02) | (0.8,1.3,0.03) | (0.8,1.4,0.05) | (0.8,1.4,0.06) | (0.8,1.4,0.10) | (0.8,1.4,0.13) | (0.8,1.4,0.16) | (0.7,1.3,0.22) | (0.6,1.2,0.24) |
| F | 2 | (0.8,1.3,0.03) | (0.8,1.3,0.04) | (0.8,1.3,0.06) | (0.8,1.3,0.07) | (0.8,1.3,0.13) | (0.8,1.3,0.16) | (0.7,1.3,0.21) | (0.6,1.0,0.28) | (0.5,0.9,0.30) |
| G | 2 | (0.8,1.3,0.03) | (0.8,1.3,0.05) | (0.8,1.3,0.08) | (0.8,1.3,0.09) | (0.8,1.3,0.16) | (0.8,1.2,0.20) | (0.6,1.0,0.27) | (0.5,0.8,0.30) | (0.4,0.7,0.30) |
| H | 2 | (X,X,X) | (0.8,1.3,0.06) | (0.8,1.3,0.10) | (0.8,1.3,0.11) | (0.8,1.2,0.20) | (0.7,1.0,0.26) | (0.5,0.8,0.30) | (0.3,0.5,0.30) | (0.3,0.5,0.30) |
| K | 2 | (X,X,X) | (X,X,X) | (0.8,1.3,0.12) | (0.8,1.3,0.13) | (0.7,1.0,0.26) | (0.5,0.8,0.30) | (0.3,0.6,0.30) | (0.2,0.4,0.30) | (0.1,0.3,0.30) |
Col (1): Point designation with A having the smallest mass and radius, and with K the largest of each model line described in Cols (3)-(11) in Tab. 3. Col (2) Galactocentric radius in kiloparsecs. Cols (3)-(11), model mass at 100 Myr to initial mass ratio , model at 100 Myr to initial ratio , model initial to Jacobi radius ratio, . The latter values is 0 for isolated clusters, since in such cases . (X,X) stands for clusters with inadmissible conditions (above or below the limits for the EMACSS code).
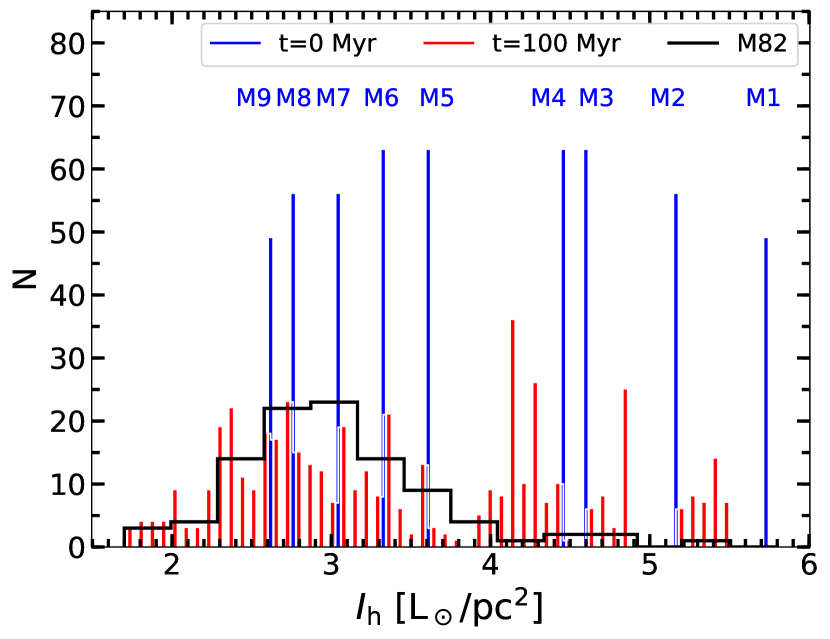
In Figure 7, it can be noticed that the values for majority of the clusters are below that for the model M3, and lie between that for the models M4 and M9. We now explore the parameter-space of initial mass-radius values that explain the observed trend for the majority of our clusters.
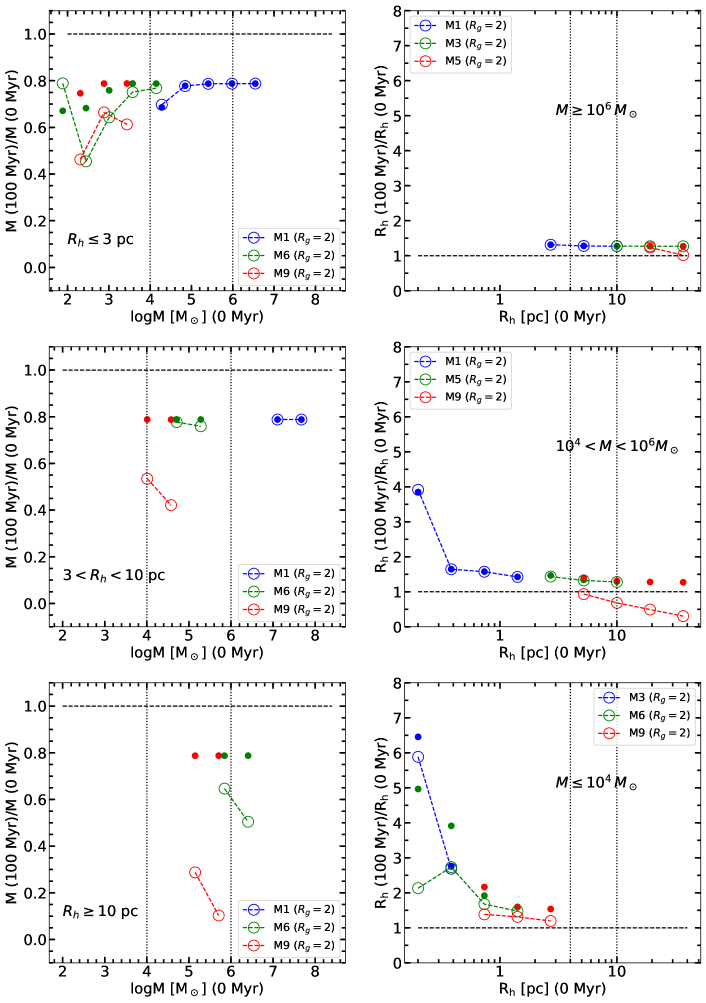
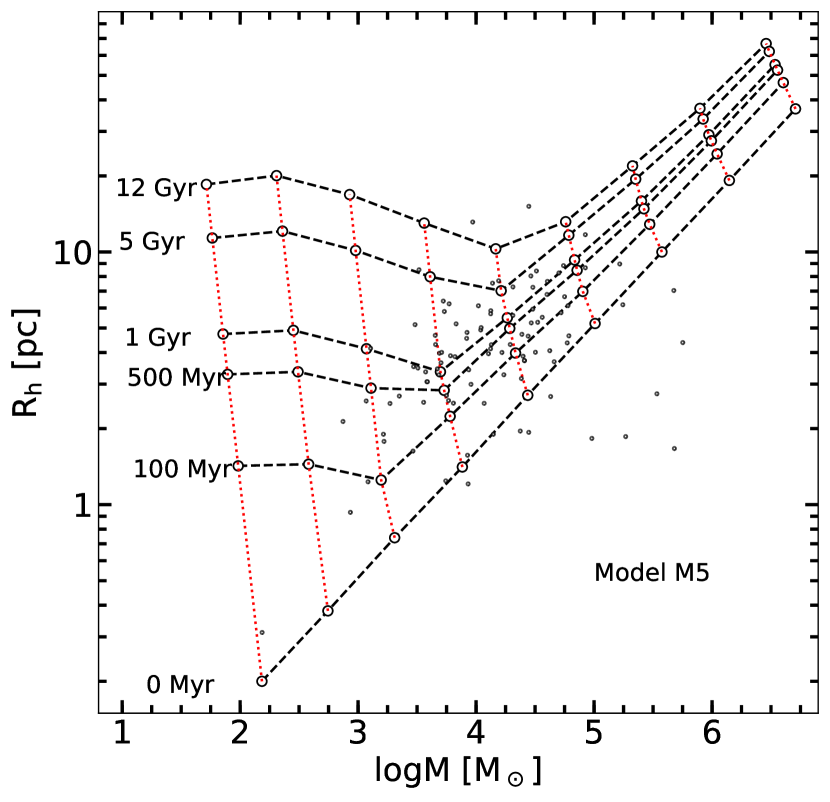
In Fig. 8, we compare the mass (left panels) and the radius (right panels) of illustrative models at =0 and =100 Myr. The mass evolution is split into 3 radius bins, and radius evolution is split into three mass bins. Given the mass-radius relation at birth, all models do not populate all the diagrams. We have carefully chosen 3 models in each panel to illustrate the overall behaviour of clusters in the first 100 Myr in the M82 disk. Numerical results for all models can be found in Table 3. Location of models are shown both for clusters evolving in isolation (solid circles) and under the potential of M82 at = 2 kpc (empty circles joined by dashed lines). Models for which evolutionary results at 2 kpc is identical to evolution in isolated conditions are those for which locations of empty circles, which are intentionally shown bigger, coincide with that of solid circles. Evolution of these models would be identical at all galacto-centric distances larger than 2 kpc. All clusters are in a state of expansion during the first 100 Myr for all of our models. In the presence of tidal fields, the expansion is halted when the cluster radius reaches the tidal radius.
We first discuss the mass-loss during the first 100 Myr of evolution. All clusters loose a minimum of 20% of mass, which is due to mass-loss during stellar evolution, rather than dynamical processes. Compact clusters (3 pc) do not loose additional mass if they are more massive than M⊙. On the other hand, clusters born with (3 pc) are all susceptible to mass-loss due to dynamical effects, unless they are more massive than M⊙. Clusters born with average surface brightness 3.4 L (models M6–M9) loose more than 30% of their initial mass. As expected, the quantity of mass lost is larger if they are born less dense and/or with a large radius.
The plots involving radius evolution suggest that all massive SSCs ( M⊙) denser than M5 evolve identical to that of isolated clusters and are in a state of expansion. Clusters born with surface densities similar or less than that of M5 have already expanded to their maximum radius and are tidally-limited. For the intermediate mass range ( M⊙), only very dense (denser than M5) and those born with small radius (4 pc) are not perturbed by the tidal fields at 2 kpc (empty circles and solid circles coincide), and hence they are in a state of expansion. Rest of the models have already tidally-limited (i.e. empty circles are below the solid circles). The trend is similar for M⊙, except that clusters have to be born denser than M4 model and 1 pc so as to avoid expanding to the tidal limit at =2 kpc. Model M9 represents a special set of initial conditions, characterised by initial radius larger than the tidal radius at =5 kpc. Clusters with these initial conditions do not survive at smaller .
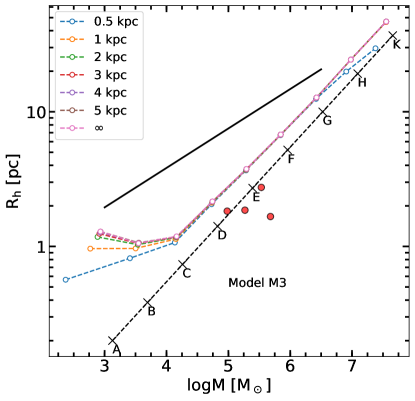
The evolutionary trajectory at other values of is similar to that described above. At kpc, majority of the models less dense than M6 are tidally-limited at 100 Myr of evolution. This is illustrated in Fig. 17 (in the Appendix). At kpc, the behaviour is similar to that of isolated models.
In summary, cluster evolution critically depends on the initial mean stellar density of the clusters, which is related to the observed mean surface brightness through the mass-to-light ratio, . Clusters expand during this phase, hence decreases. The amount of change in depends on the initial , with models less denser than M4 forming a broad group with =2.4–3.6 , which covers the observed range of of M82 SSCs. At the same time, the three highest density models (M1, M2 and M3) separate from this group. The group of four massive-compact SSCs has similar range of surface densities as these models. The plot illustrates that models M1, M2, M3 represent the condition of the group of the four massive-compact SSCs, whereas the models M4–M9 represent that of the rest of the M82 disk SSCs, which are all in the rapid expansion phase.
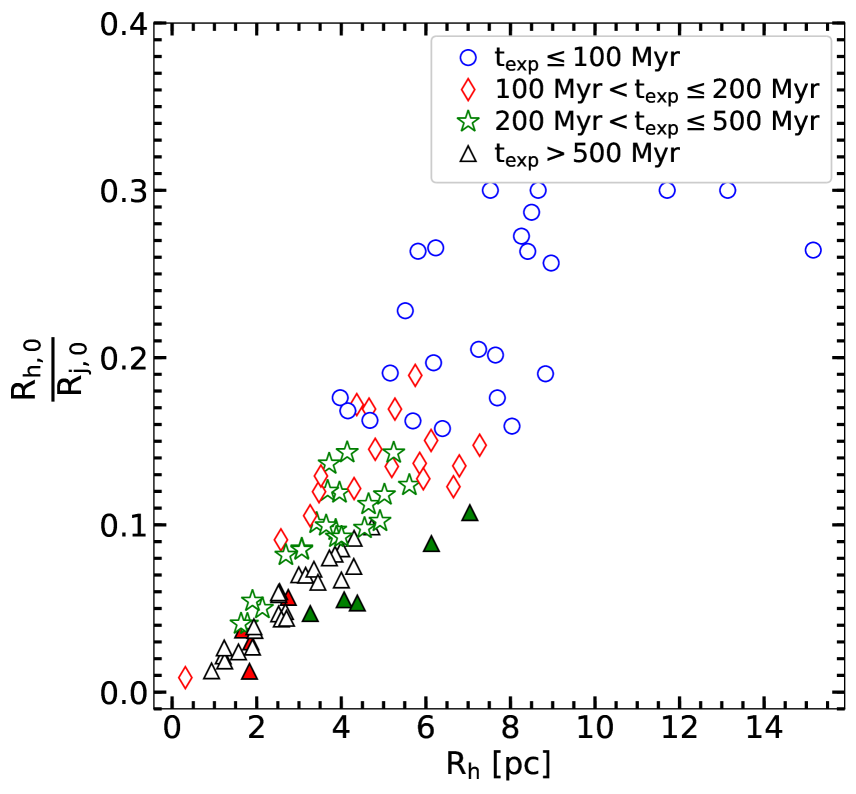
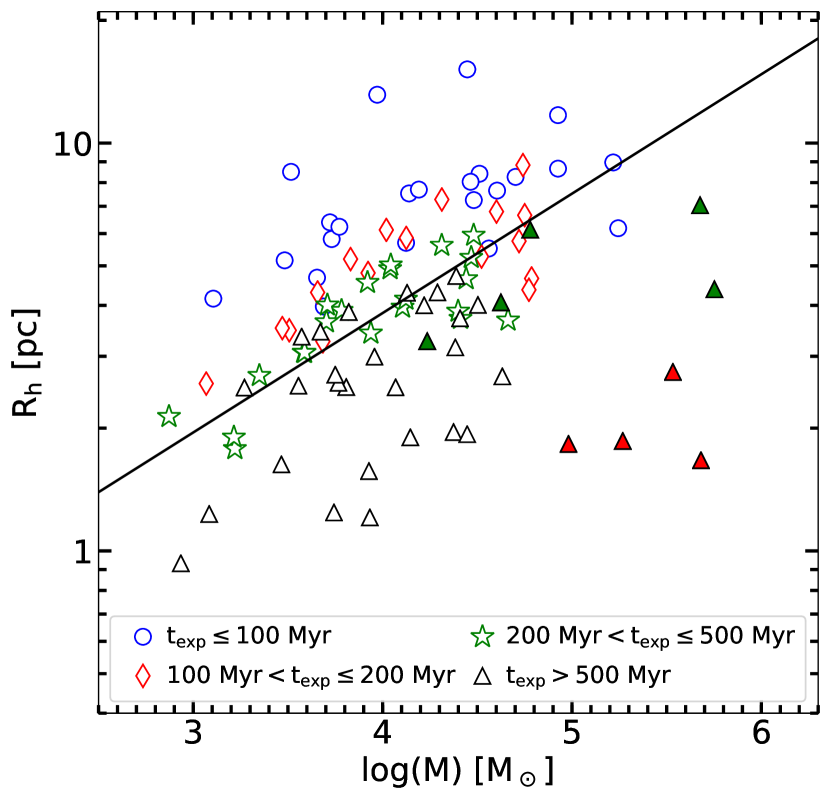
Having discussed the evolutionary behaviour of clusters in the disk of M82, we now return to the implications of the observed mass-radius relation for SSCs in the disk of M82 in Figure 6. In particular, we address the question of whether the derived power-law slope , which is close to the expected value for tidally bound clusters, does really imply the M82 SSCs are tidally bound? In order to address this question, we evolve each M82 SSC using EMACSS so as to reproduce the currently observed and at t=100 Myr at their currently observed . This was achieved by evolving clusters for a variety of initial guess values of and , all placed at the currently observed of the SSC in analysis. In particular, we follow the evolution from t=0 up to the time when the expanding cluster fills the entire volume defined by its tidal radius. In the EMACSS context, the proxy of a cluster volume filling is the half-mass radius to Jacobi Radius () ratio (Alexander et al., 2014), with being greater than 0.19 for tidally limited clusters and less than 0.1 for clusters completely embedded within their tidal radius. A cluster with starts loosing its stars leading to a decrease in its mass and size. Time taken to reach this radius is directly proportional to the initial mean surface density of the clusters. In Figure 9, we plot the initial values of in terms of their current half-mass radii. Points are coded with coloured symbols that are indicative of the time taken to reach the maximum radius, or the expansion timescale, . The majority of tidally limited clusters (blue circles) occupy the upper-envelop of the diagram, with values above 0.17, close to the limiting value 0.19 representing clusters filling their tidal volume. Interestingly, these clusters are on average larger (>4 pc) than clusters with lower values, suggesting that the present-day tidally-limited clusters have been born large, filling a large fraction of their tidal volume. On the other hand, clusters filling their tidal volume at times larger than 500 Myr, are compact (<4 pc) and have values lower than 0.1, suggesting that compact clusters have been born well-embedded within their tidal volume. In Figure 10, we replot the mass-radius relation, coding each point as in the case of Figure 9, in terms of . Twenty three clusters, all with 3 pc, that occupy the top-most envelope of the diagram (blue circles) are tidally limited. The rest of the clusters (3 pc) are still expanding at their present age of 100 Myr, and are not yet tidally-limited in spite of following the relation expected for the tidally-limited clusters. Thirty six of these expanding clusters would take more than 500 Myr to reach the tidal limit, with the four compact-massive clusters taking more than 5 Gyr to do so. In general, low-mass clusters expand at a greater rate as compared to the massive clusters which leads to flattening of the mass-radius relation. Thus, clusters that are born with Virial equilibium would have slope 0.5, when they are in the expansion phase. This is clearly seen in Figure 17 (the bottom-panel), where the trajectory of models M6 at =0.5 kpc at 100 Myr (dashed blue line) is flatter than the initial trajectory (dashed black line; slope=0.5) and is nearly parallel to the observed relation (black line). This explains the observed slope of for the M82 disk clusters.
In EMACSS, the cluster mass is contained within a finite radius. Hundred percent of the cluster stars are bound as long as this radius is smaller than the tidal radius. These characteristics are satisfied by the King and Plummer profiles used by EMACCS for modelling the effects of the tidal field. However, Moffat-EFF profiles have finite mass, but over an infinite radius. Hence, there is always some amount of mass outside the tidal radius. These stars belong to an unbound halo. For example, for a typical cluster of , 30% and 20% of the total cluster mass is in unbound stars for =0.6 and 0.4, respectively. As argued in Section 2.2.2, it takes typically 1 Gyr, which is 10 times the age of our clusters, to get rid of these unbound stars. This is the reason why Moffat-EFF profiles are better fits than the King profiles for the M82 disk SSCs (Cuevas-Otahola et al., 2020).
The mass of our clusters is derived by multiplying the total luminosity of the fitted Moffat-EFF profile by the mass-to-light ratio. Thus our derived mass includes the stellar mass in unbound halos. The calculation of the tidal radius for each M82 SSC allows us to determine the fraction of the bound mass, which is the integration of the Moffat-EFF mass profile up to , to the total mass (Eq. 6). This fraction is expected to decrease for clusters occupying a larger fraction of their tidal radius. In Figure 11 (left), we show this dependence, where we code the symbols based on their expansion time scale. Tidally-bound clusters and clusters in an advanced stage of expansion have less than 80% of their total mass in bound stars. Dense clusters have a higher fraction of mass in bound stars, which is shown in the Figure on the right.
3.3 Long-term evolution and globular cluster progenitors in M82
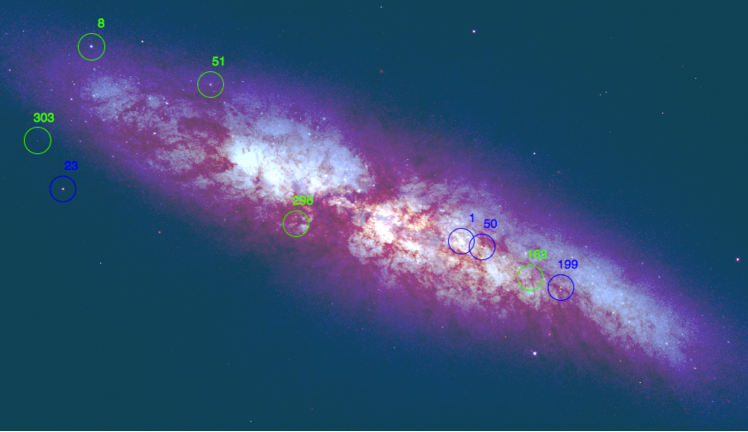
In the previous section, we established that the majority of the clusters in the disk of M82 are in expansion at present and around half of those would take more than 500 Myr to start experiencing the disrupting effect of tidal forces. In order to establish whether any of these SSCs would survive for Hubble time to become GCs, we evolved each of our sample SSCs up to an age of 12 Gyr, using EMACSS from their present-day parameter values. EMACSS is run keeping each SSC at its currently observed galacto-centric distance. We find that only 9% of the sample (9 SSCs; shown by filled symbols in Figure 10) would remain bound after 12 Gyr evolution. These include all the four massive compact SSCs (D1, D23, D50, D199), and a group of five SSCs (D8, D51, D163, D296, D303), which we called compact outer-disk SSCs. These latter group of SSCs survive due to their large galacto-centric distances ( kpc). The rest of the SSCs do not survive for Hubble time. The locations of these nine surviving SSCs are marked in an RGB image in Figure 12. Paper I contains plots of surface brightness profiles and individual RGB images of all the 99 SSCs, including these nine clusters.
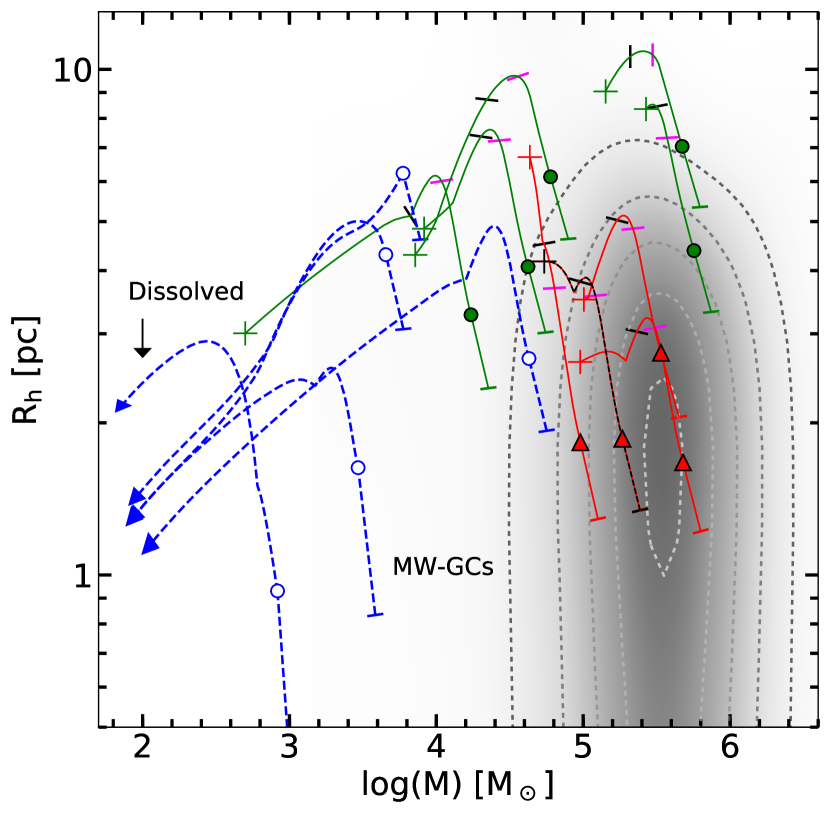
How do their final mass and radius compare with those of the Galactic GCs?. In order to answer this question, in Fig. 13 we show the evolutionary locus in mass-radius diagram for the nine surviving SSCs. For comparison, we also show the evolution of five dissolved clusters. Red and green lines indicate SSCs belonging to the massive-compact and compact outer-disk groups, both of which survive for Hubble time. The blue line indicates five illustrative dissolving SSCs. The final positions of these SSCs are indicated by plus symbols for surviving clusters and by arrows for dissolving clusters. We also show in gray-scale with overlaid contours the distribution of the Galactic GCs in this diagram. Our group of massive-compact clusters ends up with similar masses, but with larger radius than the Galactic GCs, according to the EMACSS predictions. We note that the final size of the real clusters is controlled by the core-collapse, whose treatment in EMACSS is only simplistic and is not reliable at times much longer than the typical core-collapse timescale. N-body simulations that includes a realistic treatment of core-collapse would be required to predict the final post core-collpase radius of these clusters. The final radius obtained by EMACSS at best could be considered as an upper limit. The final obtained mass, on the other hand, is reliable. The location of the surviving massive-compact SSCs in this diagram suggests four SSCs would have masses slightly lower than the median mass for the Galactic GCs ( M⊙). The fourth one occupies the low-mass end of the Galactic GC mass distribution. The group of five surviving outer-disk SSCs ends up with systematically larger radii, and slightly lower masses, as compared to the group of massive-compact SSCs, and hence these are unlikely to be GC-progenitors. Their late-time characteristics resemble very much the characteristics of faint fuzzies discovered by Larsen & Brodie (2000a). We will discuss more about this in §3.4.
We draw special attention to the widely-studied cluster M82-F (our cluster D1), the most massive SSC of the group of four surviving massive-compact clusters. This cluster had been discussed by Smith & Gallagher (2001) as a doomed cluster. Their conclusion was not based on dynamical grounds, instead based on the apparent lack of long-living low-mass stars, which they inferred from the peculiarly low mass-to-light ratio for this object. With the top-heavy IMF, M82-F would not have any stars in the main sequence after 2 Gyr of age (Smith & Gallagher, 2001; McCrady et al., 2005; de Grijs & Parmentier, 2007). On the other hand, we assumed a standard Kroupa IMF, which has sufficient low-mass stars to keep the cluster dynamically stable over the Hubble time.
EMACSS code does not include two processes that are known to play principal role in disrupting a cluster, especially in the disk of a galaxy. These are disk shocks experienced due to the presence of non-axisymmetric structures such as a bar and spiral arms, and disruption caused due to the interaction of the clusters with Giant Molecular Clouds (GMCs) during their passage through spiral arms. In the first place, spiral arm passages and disk shocks act in a similar way, driving a comparable mass-loss to that of the influence of tidal fields (Lamers & Gieles, 2006; Lamers et al., 2010). Moreover, it is well-known that at least two episodes of disk shocks are required to disrupt a cluster (Vesperini & Heggie, 1997). These processes affect severely for cluster masses below , being the most critical one the encounter with GMCs. The disruption time for a cluster with a mass of , 3.75 pc interacting with a Milky Way-like GMC (with , , km/s, with , and , the cloud and cluster velocity dispersions, respectively) is of 2 Gyr (Gieles et al., 2006). From Eq. 22 in Gieles et al. (2006) the disruption due to encounters with Milky Way-like GMCs can be re-written as
| (4) |
with , , , and , dynamical parameters dependent on the environment and dynamical state of the cluster and the cloud (for further details refer to Gieles et al. (2006)). From the latter expression, we obtain 62 Gyr for D23, the least massive cluster of the massive-compact group, which is a factor of 25 larger than the expected for the canonical cluster defined by Gieles et al. (2006). This large disruption time is due to its 10 times larger mass and two times smaller radius as compared to that of the canonical cluster. The disruption time due to collisions with the Milky Way-like GMCs, in general, is larger than the Hubble time for clusters more massive than and more compact than 3 pc. The previously stressed arguments suggest that the four massive compact SSCs are good proto-GC candidates. On the other hand, we find that our fuzzy cluster candidates are prone to be disrupted by GMC encounters in 1 Gyr.
3.4 vs scaling relation
Most of the Galactic GCs fall on a straight line in log-log plots formed by parameters such as the central surface brightness () and core radius (). This is attributed to the existence of a fundamental plane for these old stellar systems (Djorgovski, 1995; McLaughlin, 2000). It is not clear whether systems of only a few hundreds of million years belong to this fundamental plane. We discuss below a projection of this diagram for M82 clusters.
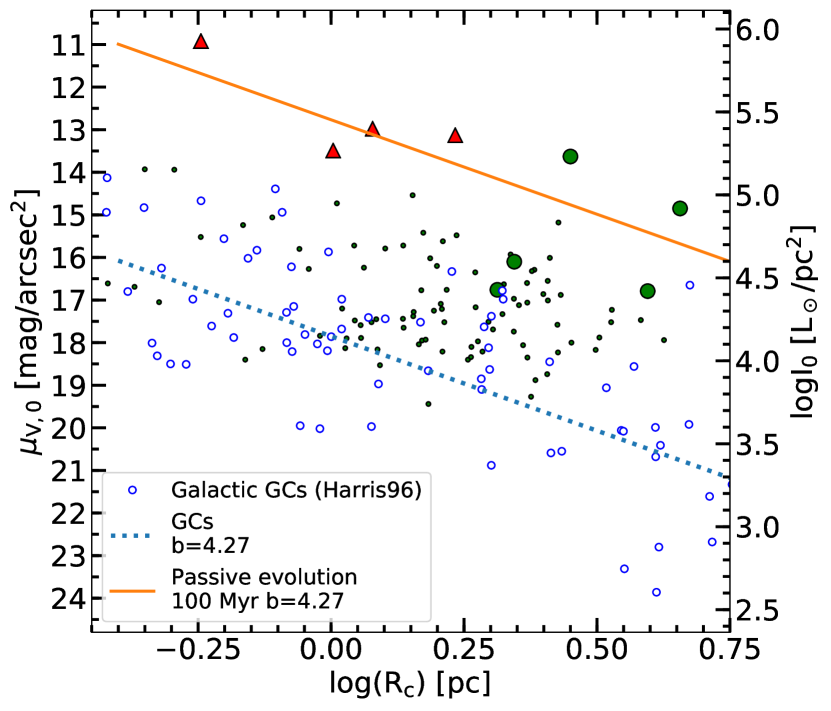
In Fig. 14, we plot in the -band against () for M82 SSCs, and Galactic GCs. The two groups of SSCs surviving for Hubble time are shown by red filled triangles (massive-compact clusters) and green solid circles (compact outer-disk clusters). The rest of the SSCs are shown by black dots, and the Galactic GCs, extracted from Harris (1996) by blue empty circles. We fitted a straight line to the latter sample using a least-square fit which is shown by a blue dotted line, with slope . It can be observed that both the SSCs and the GC samples have large dispersions, with the GC sample dispersion (2.77 mag arcsec-2) twice larger than that of SSCs (1.45 mag arcsec-2). The surviving SSCs fall on a sequence which is parallel to the GC relation, but is shifted to brighter .
This difference might be explained by two evolutionary effects: dynamical evolution of clusters that can change both and and passive evolution leading to an increase in mass-to-light ratios. The former effect is related to the core-collapse, which is expected to maintain the core luminosity constant (Kormendy, 1985; Küpper et al., 2008). Under these circumstances, , i.e. the SSCs will move along a line of slope 5 in Fig. 14, which is only slightly steeper than the plotted line (). Thus, due to core-collapse the intercept of the line defined by our group of massive-compact SSCs would not change much. If all the sample SSCs have the same age of 100 Myr, our clusters are expected to be 5 mag fainter in (V)111These mass-to-light ratios take into account the mass lost due to stellar evolution. due to passive evolution (Bruzual & Charlot, 2003). We plot in orange the line corresponding to passive evolution of GCs (evolving backwards from the GC relation), for a uniform age of 100 Myr. It can be noticed that the four massive-compact SSCs lie on this line. Thus, this group of four massive-compact SSCs not only survive, but also would occupy the same fundamental plane as for the Galactic GCs.
Two of the five SSCs previously discussed as compact outer-disk clusters, lie close to the orange line, with the remaining 3 being fainter by 2–2.5 mag. These clusters after undergoing evolution upto 12 Gyr would be fainter and bigger than the present-day GCs in the Milky Way, thus are unlikely to be classified as GCs. On the other hand, these are excellent candidates for the red extended clusters, also known as faint fuzzies, seen in M101 (Simanton, 2015), and lenticular galaxies (Larsen & Brodie, 2000a). In the lenticular galaxy NGC 1023, the faint fuzzies belong to the disk (Chies-Santos et al., 2013) and are found in a ring at a galacto-centric radius of 5 kpc (Larsen & Brodie, 2000b; Brodie & Larsen, 2002), very similar to the characteristics we find for the group of compact outer-disk SSCs.
4 Conclusions
In this work, we present the complete set of structural parameters corresponding to Moffat-EFF profiles for a sample of 99 SSCs in the disk of M82. The sample had been earlier analysed in Paper I and makes use of HST/ACS imaging data in F435W, F555W and F814W bands. The quantities presented in this work are: core and half-light radius, tidal radius, central surface and mass densities, mean surface density at half-light radius, total and bound mass, luminosities, and projected central velocity dispersions. The fact that the SSCs in the disk of M82 were born in a disk-wide burst around 100–300 Myr ago, allows us to address the evolutionary behaviour of a relatively large and homogenous sample of clusters of intermediate ages. In particular, we discuss the mass function, the size function, and the mass-radius relation in our sample of SSCs, and compare these with similar data in other galaxies. The mass distribution follows a power-law function of index =1.5 for masses above M⊙, a result similar to that obtained for the full sample of 393 SSCs by Mayya et al. (2008). This index is flatter than that found for young SSCs (=2.0). On the other hand, the distribution of half-light radius follows a log-normal form centered at 4.26 pc. We compare the distributions of mass and for M82 with existing data for similar-age (50–500 Myr) and older ( Myr) SSCs in other galaxies. We find that the M82 mass and distributions agree very well with those in the LMC/SMC for similar-age clusters. The distributions also compare well with those in the giant spiral galaxy M83, but for slightly older clusters. On the other hand, the distributions for intermediate-age clusters in M83 and two other spiral galaxies (NGC 628, NGC 1313) do not follow the distributions in M82. This slight difference in behaviour is most likely related to the lower masses of M82 and LMC/SMC as compared to the other galaxies with which we compared our data.
Majority of SSCs in M82 follows a mass-radius relation with a logarithmic slope of 0.05. We identify a group of four massive-compact SSCs that are outliers to this relation. We used the semi-analytical cluster evolutionary code, EMACSS, to understand the observed behaviour of SSCs in the mass-radius space. We considered a set of more than 80 simulated clusters that cover the range of radius, mass and mean stellar densities observed in M82. For each of these simulated clusters, we predicted their evolutionary trajectory in the mass-radius space. From these simulations, we conclude that 23% of the clusters are tidally-limited, with the rest undergoing expansion at present. Thus, the majority of M82 disk clusters are not tidally limited, in spite of they following a mass-radius relation with a logarithmic slope of , a value close to the value expected for tidally-limited clusters. Simulations show that the mass-radius relation for a population of expanding clusters, flattens from the Virial slope of 0.5 at birth. The group of massive-compact SSCs is evolving unaffected by the tidal field of M82, having only a mild (30–50%) expansion during the whole evolution.
Evolving the clusters forward, we find that the majority of clusters tidally truncated as well as those currently experiencing large expansion will dissolve in 2 Gyr. On the other hand, the group of four massive-compact SSCs will survive for Hubble time. The end parameters of these SSCs agree well with the parameters of Galactic GCs, after allowing for the late-time contraction of the cluster due to core-collapse, which has not been properly modelled in EMACSS. The currently observed central surface brightness and the core radius of these four SSCs fall on the fundamental-plane defined by the Galactic GCs, after taking into account dimming introduced due to passive evolution from 100 Myr to 12 Gyr. These comparisons suggest that the group of massive-compact SSCs are candidates to proto-GCs.
We also identified a group of five compact outer-disk SSCs that are not yet tidally truncated and would survive for the Hubble time. These clusters in general loose significant amount of mass during their long-term evolution and end up with larger radii and less mass as compared to the Galactic GCs. Their end values are in excellent agreement with the values observed for faint fuzzies in galaxies.
Acknowledgments
BCO thanks CONACyT for granting PhD research fellowship and for the support through the program of research assistants (grant CB-2019-18276) that enabled her to carry out the work presented here. We also thank CONACyT for the research grants CB-A1-S-25070 (YDM), CB-2014-240426 (IP), and CB-A1-S-22784 (DRG), that allowed the acquisition of a cluster that was used for computations in this work. We thank the anonymous referee for the valuable comments that improved this work significantly.
Data Availability
The data underlying this article are available in the article and in its online supplementary material.
References
- Alexander & Gieles (2012) Alexander P. E. R., Gieles M., 2012, MNRAS, 422, 3415
- Alexander et al. (2014) Alexander P. E. R., Gieles M., Lamers H. J. G. L. M., Baumgardt H., 2014, MNRAS, 442, 1265
- Banerjee & Kroupa (2017) Banerjee S., Kroupa P., 2017, A&A, 597, A28
- Barmby et al. (2009) Barmby P., et al., 2009, AJ, 138, 1667
- Bastian et al. (2005) Bastian N., Gieles M., Lamers H. J. G. L. M., Scheepmaker R. A., de Grijs R., 2005, A&A, 431, 905
- Bastian et al. (2006) Bastian N., Saglia R. P., Goudfrooij P., Kissler-Patig M., Maraston C., Schweizer F., Zoccali M., 2006, A&A, 448, 881
- Bastian et al. (2008) Bastian N., Gieles M., Goodwin S. P., Trancho G., Smith L. J., Konstantopoulos I., Efremov Y., 2008, MNRAS, 389, 223
- Bastian et al. (2013) Bastian N., Cabrera-Ziri I., Davies B., Larsen S. S., 2013, Monthly Notices of the Royal Astronomical Society, 436, 2852
- Baumgardt et al. (2010) Baumgardt H., Parmentier G., Gieles M., Vesperini E., 2010, Monthly Notices of the Royal Astronomical Society, 401, 1832
- Bik et al. (2003) Bik A., Lamers H. J. G. L. M., Bastian N., Panagia N., Romaniello M., 2003, A&A, 397, 473
- Binney & Tremaine (1987) Binney J., Tremaine S., 1987, Galactic dynamics. Princeton University Press
- Brodie & Larsen (2002) Brodie J. P., Larsen S. S., 2002, AJ, 124, 1410
- Bruzual & Charlot (2003) Bruzual G., Charlot S., 2003, MNRAS, 344, 1000
- Cardelli et al. (1989) Cardelli J. A., Clayton G. C., Mathis J. S., 1989, ApJ, 345, 245
- Chabrier (2003) Chabrier G., 2003, PASP, 115, 763
- Chies-Santos et al. (2013) Chies-Santos A. L., Cortesi A., Fantin D. S. M., Merrifield M. R., Bamford S., Serra P., 2013, A&A, 559, A67
- Cuevas-Otahola et al. (2020) Cuevas-Otahola B., Mayya Y. D., Puerari I., Rosa-González D., 2020, MNRAS, 492, 993
- Djorgovski (1995) Djorgovski S., 1995, ApJ, 438, L29
- Djorgovski & Davis (1987) Djorgovski S., Davis M., 1987, ApJ, 313, 59
- Djorgovski & Meylan (1994) Djorgovski S., Meylan G., 1994, AJ, 108, 1292
- Elson et al. (1987) Elson R. A. W., Fall S. M., Freeman K. C., 1987, ApJ, 323, 54
- Faber & Jackson (1976) Faber S. M., Jackson R. E., 1976, ApJ, 204, 668
- Fall & Chandar (2012) Fall S. M., Chandar R., 2012, ApJ, 752, 96
- Freedman et al. (1994) Freedman W. L., et al., 1994, ApJ, 427, 628
- Gieles (2009) Gieles M., 2009, MNRAS, 394, 2113
- Gieles (2013) Gieles M., 2013, Memorie della Societa Astronomica Italiana, 84, 148
- Gieles & Alexander (2017) Gieles M., Alexander P., 2017, in Charbonnel C., Nota A., eds, IAU Symposium Vol. 316, Formation, Evolution, and Survival of Massive Star Clusters. pp 214–221, doi:10.1017/S1743921315010868
- Gieles et al. (2006) Gieles M., Zwart S. F. P., Baumgardt H., Athanassoula E., Lamers H. J. G. L. M., Sipior M., Leenaarts J., 2006, MNRAS, 371, 793
- Gieles et al. (2010) Gieles M., Baumgardt H., Heggie D. C., Lamers H. J. G. L. M., 2010, MNRAS, 408, L16
- Girardi et al. (2002) Girardi L., Bertelli G., Bressan A., Chiosi C., Groenewegen M. A. T., Marigo P., Salasnich B., Weiss A., 2002, A&A, 391, 195
- Goodwin & Bastian (2006) Goodwin S. P., Bastian N., 2006, MNRAS, 373, 752
- Greco et al. (2012) Greco J. P., Martini P., Thompson T. A., 2012, ApJ, 757, 24
- Harris (1996) Harris W. E., 1996, AJ, 112, 1487
- Hwang & Lee (2010) Hwang N., Lee M. G., 2010, ApJ, 709, 411
- Isobe et al. (1990) Isobe T., Feigelson E. D., Akritas M. G., Babu G. J., 1990, ApJ, 364, 104
- King (1962) King I., 1962, AJ, 67, 471
- King (1966) King I. R., 1966, AJ, 71, 64
- Kissler-Patig et al. (2006) Kissler-Patig M., Jordán A., Bastian N., 2006, A&A, 448, 1031
- Konstantopoulos et al. (2009) Konstantopoulos I. S., Bastian N., Smith L. J., Westmoquette M. S., Trancho G., Gallagher III J. S., 2009, ApJ, 701, 1015
- Kormendy (1985) Kormendy J., 1985, ApJ, 295, 73
- Kroupa (2001) Kroupa P., 2001, MNRAS, 322, 231
- Küpper et al. (2008) Küpper A. H. W., Kroupa P., Baumgardt H., 2008, MNRAS, 389, 889
- Lamers & Gieles (2006) Lamers H., Gieles M., 2006, A&A, 455, L17
- Lamers et al. (2010) Lamers H. J. G. L. M., Baumgardt H., Gieles M., 2010, MNRAS, 409, 305
- Larsen (1999) Larsen S. S., 1999, A&AS, 139, 393
- Larsen (2004) Larsen S. S., 2004, A&A, 416, 537
- Larsen (2009) Larsen S. S., 2009, A&A, 494, 539
- Larsen & Brodie (2000a) Larsen S. S., Brodie J. P., 2000a, AJ, 120, 2938
- Larsen & Brodie (2000b) Larsen S. S., Brodie J. P., 2000b, AJ, 120, 2938
- Lee et al. (2005) Lee M. G., Chandar R., Whitmore B. C., 2005, AJ, 130, 2128
- Mackey & Gilmore (2003a) Mackey A. D., Gilmore G. F., 2003a, MNRAS, 338, 85
- Mackey & Gilmore (2003b) Mackey A. D., Gilmore G. F., 2003b, MNRAS, 338, 120
- Maraston et al. (2004) Maraston C., Bastian N., Saglia R. P., Kissler-Patig M., Schweizer F., Goudfrooij P., 2004, A&A, 416, 467
- Mayya & Carrasco (2009) Mayya Y. D., Carrasco L., 2009, in Revista Mexicana de Astronomia y Astrofisica Conference Series. pp 44–55
- Mayya et al. (2006) Mayya Y. D., Bressan A., Carrasco L., Hernandéz-Martinez L., 2006, ApJ, 649, 172
- Mayya et al. (2008) Mayya Y. D., Romano R., Rodríguez-Merino L. H., Luna A., Carrasco L., Rosa-González D., 2008, ApJ, 679, 404
- McCrady & Graham (2007) McCrady N., Graham J. R., 2007, ApJ, 663, 844
- McCrady et al. (2005) McCrady N., Graham J. R., Vacca W. D., 2005, ApJ, 621, 278
- McLaughlin (2000) McLaughlin D. E., 2000, ApJ, 539, 618
- McLaughlin & van der Marel (2005) McLaughlin D. E., van der Marel R. P., 2005, ApJS, 161, 304
- Mutchler et al. (2007) Mutchler M., et al., 2007, PASP, 119, 1
- Peng et al. (2010) Peng C. Y., Ho L. C., Impey C. D., Rix H.-W., 2010, AJ, 139, 2097
- Portegies Zwart et al. (2010) Portegies Zwart S. F., McMillan S. L. W., Gieles M., 2010, ARA&A, 48, 431
- Ryon et al. (2015) Ryon J. E., et al., 2015, MNRAS, 452, 525
- Ryon et al. (2017) Ryon J. E., et al., 2017, ApJ, 841, 92
- Salpeter (1955) Salpeter E. E., 1955, ApJ, 121, 161
- Schechter (1976) Schechter P., 1976, ApJ, 203, 297
- Simanton (2015) Simanton L. A., 2015, in American Astronomical Society Meeting Abstracts #225. p. 213.01
- Smith & Gallagher (2001) Smith L. J., Gallagher J. S., 2001, MNRAS, 326, 1027
- Sofue (1998) Sofue Y., 1998, PASJ, 50, 227
- Spitzer (1987) Spitzer L. S., 1987, Dynamical Evolution of Globular Clusters. Princeton University Press
- Terlevich et al. (2018) Terlevich E., Fernández-Arenas D., Terlevich R., Gieles M., Chávez R., González-Morán A. L., 2018, MNRAS, 481, 268
- Vesperini & Heggie (1997) Vesperini E., Heggie D. C., 1997, MNRAS, 289, 898
- Whitmore & Schweizer (1995) Whitmore B. C., Schweizer F., 1995, AJ, 109, 960
- Wilson (1975) Wilson C. P., 1975, AJ, 80, 175
- Yun (1999) Yun M. S., 1999, in Barnes J. E., Sanders D. B., eds, IAU Symposium Vol. 186, Galaxy Interactions at Low and High Redshift. p. 81
- Zepf et al. (1999) Zepf S. E., Ashman K. M., English J., Freeman K. C., Sharples R. M., 1999, AJ, 118, 752
- Zhang & Fall (1999) Zhang Q., Fall S. M., 1999, ApJ, 527, L81
- de Grijs & Goodwin (2008) de Grijs R., Goodwin S. P., 2008, MNRAS, 383, 1000
- de Grijs & Parmentier (2007) de Grijs R., Parmentier G., 2007, Chinese J. Astron. Astrophys., 7, 155
- de Grijs et al. (2003a) de Grijs R., Anders P., Bastian N., Lynds R., Lamers H. J. G. L. M., O’Neil E. J., 2003a, MNRAS, 343, 1285
- de Grijs et al. (2003b) de Grijs R., Anders P., Bastian N., Lynds R., Lamers H. J. G. L. M., O’Neil E. J., 2003b, MNRAS, 343, 1285
Appendix A Velocity dispersion profile for Moffat-EFF profile
We used the solution obtained by Elson et al. (1987) for a spherical cluster with isotropic velocity distribution in hydrostatic equilibrium (their equation 16) to calculate the velocity dispersion profile for a cluster obeying a power-law density profile such as that for the Moffat-EFF profile. We used a flat rotation curve of v=100 km/s (Greco et al., 2012) to present the tidal field of M82 at the galacto-centric radius . Once (r) is obtained, and thus , we proceed to project it into the plane of the sky following the prescription by Binney & Tremaine (1987)
| (5) |
with the intensity profile, in terms of the semi-major axis , and the three-dimensional luminosity density profile. Moffat-EFF profiles, being power-law in form do not have a cut-off, hence they do not have an implicit tidal radius. However, given the tidal field at the location of the cluster, it is possible to define such a radius as the one where the dispersion velocity reaches zero, without breaking the hydrostatic equilibrium condition (Elson et al., 1987). From the obtained values it is possible to compute the bound mass of the clusters , by integrating in the limits between 0 and . This integration has an analytical solution given by (Elson et al., 1987),
| (6) |
where is the total mass and is the mass-to-light ratio. The , , and are given in columns 6, 7, 10 and 14 of Table 1, respectively.
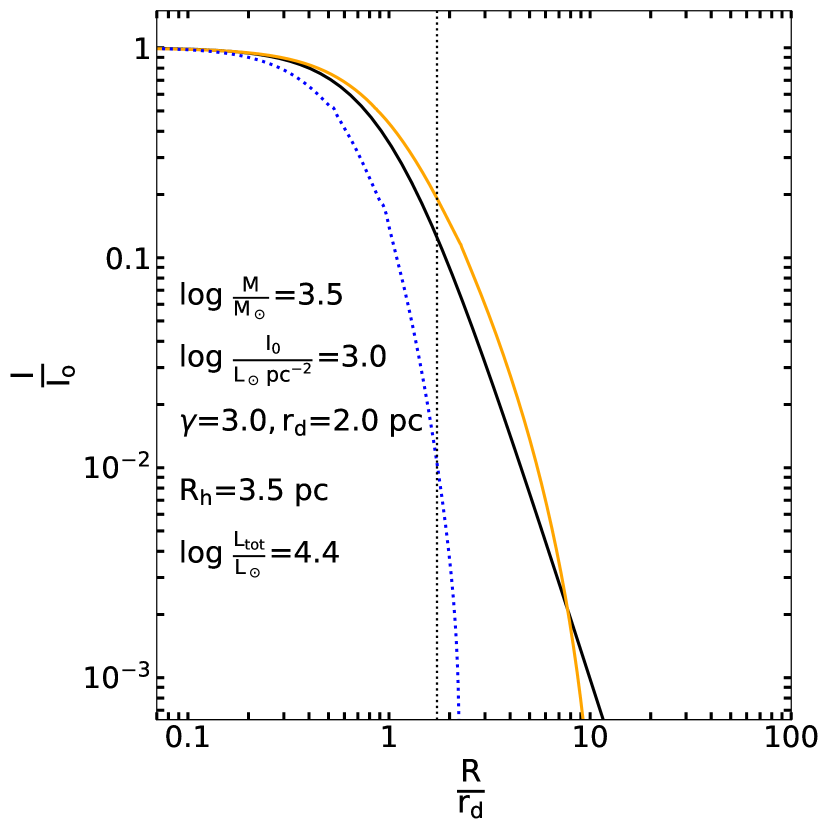
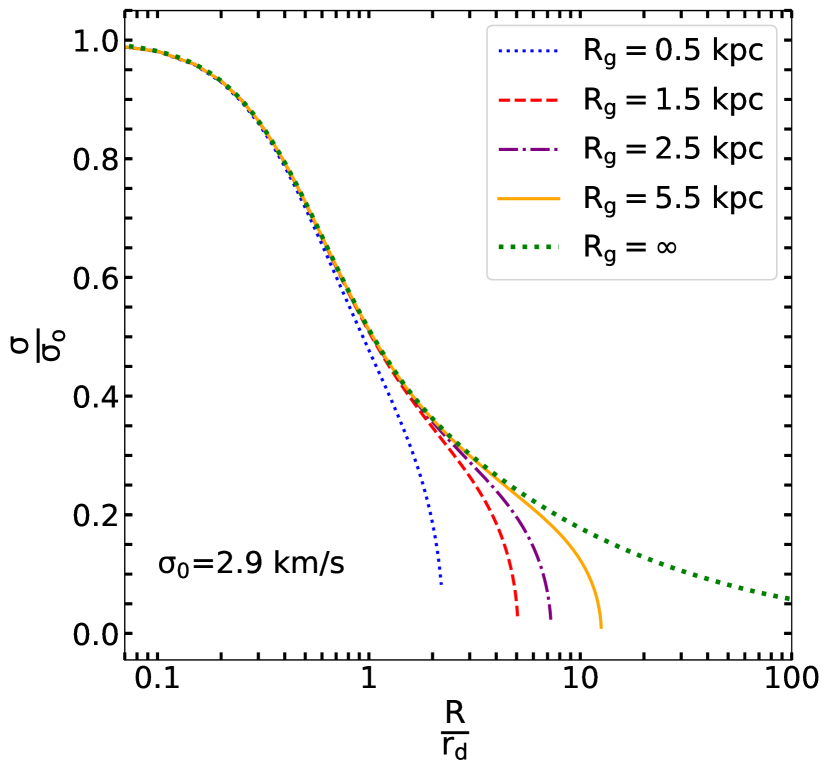
In Fig. 15, we show the distribution of the intensity and (r) profiles for an illustrative cluster resembling the properties of the sample M82 disk SSCs. The cluster has a low mass and a radius as well as a values close to the median radius and Moffat-EFF index values of the sample (3.2 M, =2.0 pc, =3.0). The y-and x-axis of the plots are shown normalized to the central values, and , respectively. The (0) value for the cluster is 2.9 km/s. The (r) profiles are shown under the influence of tidal fields at various values. The profile corresponding to corresponds to an isolated case, where the velocity never reaches zero for a final . It can be seen that the velocity abruptly falls to zero in the presence of a tidal field, with the radius at which it reaches zero (tidal radius), progressively smaller at smaller values of . The (r) profiles for the cluster remains almost constant for , implying the cluster core is unaffected by the tidal fields (Elson et al., 1987).
Appendix B Simulations using EMACSS
We have performed a set of simulations in order to understand the possible evolution of the mass-radius relation with the conditions of M82. We have simulated the evolution of clusters in isolation, following an initial virial mass-radius relation (Gieles et al., 2010) and also under the gravitational potential of M82, which is represented by a flat rotation curve with a circular velocity of 100 km s-1 (Greco et al., 2012) corresponding to a singular isothermal halo. The evolutionary results are saved for the following ages: 0 Myr, 100 Myr, 500 Myr, 1 Gyr, 5 Gyr and 12 Gyr. We have considered 6 different values of galacto-centric radii () from 0.5 to 5 kpc, intended to cover the M82 disk SSCs values. In the main text, we show only the results for isolated clusters and those at =2 kpc at 100 Myr, for preserving the clarity of the figure.