Radio counterparts of gamma-ray sources in the Cygnus region
Abstract
The view of the gamma-ray universe is being continuously expanded by space high energy (HE) and ground based very-high energy (VHE) observatories. Yet, the angular resolution limitation still precludes a straightforward identification of these gamma-ray emitting sources. Radio observations are an effective tool for searching their possible counterparts at lower energies because the same population of relativistic electrons responsible for radio emission can also produce HE/VHE emission via inverse-Compton scattering. The Cygnus region is crowded by many gamma-ray sources, most of them remaining unidentified. In order to find possible counterparts to unidentified gamma-ray sources, we carried out a deep survey of the Cygnus region using the Giant Metrewave Radio Telescope at 610 MHz and 325 MHz. We did a detailed search for counterparts in the error circle of HE/VHE sources. We report 36 radio sources found in the error ellipse of 15 HE sources, and 11 in those of VHE sources. Eight sources have very steep radio spectral index , which are most likely to be pulsars and will be followed up for periodicity search. Such a significant number of pulsar candidates within the error circle of HE/VHE sources prompts fresh look at the energetics and efficacy of pulsars and pulsar wind nebulae in this context.
1 Introduction
From the first all-sky gamma-ray surveys and associated catalogs, a large fraction of the discovered sources lacked identification with sources detected along the rest of the electromagnetic spectrum (e.g., Swanenburg et al., 1981). Since the early days of observations of the gamma-ray sky, emission at these high energies was detected by known and of wide range of sources like blazars, radio galaxies and quasars of the extra-galactic origin and pulsars, supernova remnants and micro-quasars in our Galaxy.
At the GeV energy range, the Energetic Gamma Ray Experiment Telescope aboard the Compton Gamma Ray Observatory, provided a catalog of 271 sources, 170 of which were so-called unidentified gamma-ray sources or UNIDS (Hartman et al., 1999), with a position accuracy close to half of a degree. In the last decade, the Fermi Large Area Telescope relieved the sky with higher sensitivity and angular resolution (0.1 deg). Its fourth Catalog (4FGL, Abdollahi et al., 2020) compiles information of five thousand sources above 4, and 1300 remain with unknown nature. The presence of more than one - sometimes many - lower energy sources inside the position error of the high energy (HE: 0.1 GeV E 100 GeV) sources makes it difficult for the accurate identification of the specific object producing gamma rays.
At very-high energies (VHE: above 100 GeV) a similar percentage of about 22% of unassociated sources is found for VHE sources detected by Cherenkov telescopes. Their distribution is strongly peaked towards the Galactic Plane, thus suggesting an important contribution from Milky Way emitters in this population. Undiscovered pulsars, pulsar wind nebulae or supernova remnants are likely among them. Many studies to find lower energy counterpart’s candidates of selected HE/VHE sources have been undertaken during the last years by several authors. As an example, in the field of the unidentified VHE source HESS J1858+020 were found a supernovae remnant interacting with nearby molecular clouds and a few non-thermal sources (Paredes et al., 2014). In the case of HE unidentified sources, we can mention 3FGL J0133.3+5930, where a galactic and an extragalactic objects were proposed as possible counterpart (Martí et al., 2017).
The most energetic phenomena of the Universe give rise to gamma rays: non thermal sources with relativistic particles that interact with fields, matter and radiation. Likewise, the combined ingredients can generate radiation at low radio frequencies, via the synchrotron mechanism. This radio radiation can be measured using radio interferometers, with arcsecond resolution. This superior resolution in the radio band as compared to the HE/VHE facilities will help to precisely localise possible counterparts. Moreover, multi-band observations provide hints on the radiation mechanisms and then on the kind of object that generate the emission measured. As example, Frail et al. (2018) describe, in particular, a method to identify pulsars that can be physically related with unidentified Fermi sources. In short, though the fraction of the counterparts of gamma-ray sources have improved, there are still significant number of sources in the gamma-ray sky which do not have counterpart at any other branch of the electromagnetic spectrum (Abdollahi et al., 2020).
The purpose of this work was to collect evidence and contribute to the identification of discrete HE/VHE sources, by means of radio images at very high angular resolution and very low noise. We focused on a group of such sources detected by the Fermi LAT instrument, and complement it with other sources at TeV energies. We surveyed a highly populated area of the northern sky nearby the Galactic plane at two bands centred at decimetre wavelengths, using the Giant Metrewave Radio Telescope (GMRT). This work is part of a series of studies of the same celestial area in the Cygnus region, mainly the catalog introduced in Benaglia et al. (2020b). The latter lists radio sources at 610 MHz and 325 MHz bands, for flux densities greater or equal to 7, where is the local rms; see also Ishwara-Chandra et al. (2019); Benaglia et al. (2020a); Isequilla et al. (2020). Here we have studied sources above 3. Section 2 describes the observed region including the high-energy sources detected. Section 3 summarizes the data reduction process. In Section 4 we report the results. Section 5 explains the search for counterparts of the radio sources discovered here. A discussion is presented in Section 6, and we conclude in a last Section.
2 The Cygnus region and the gamma-ray sources
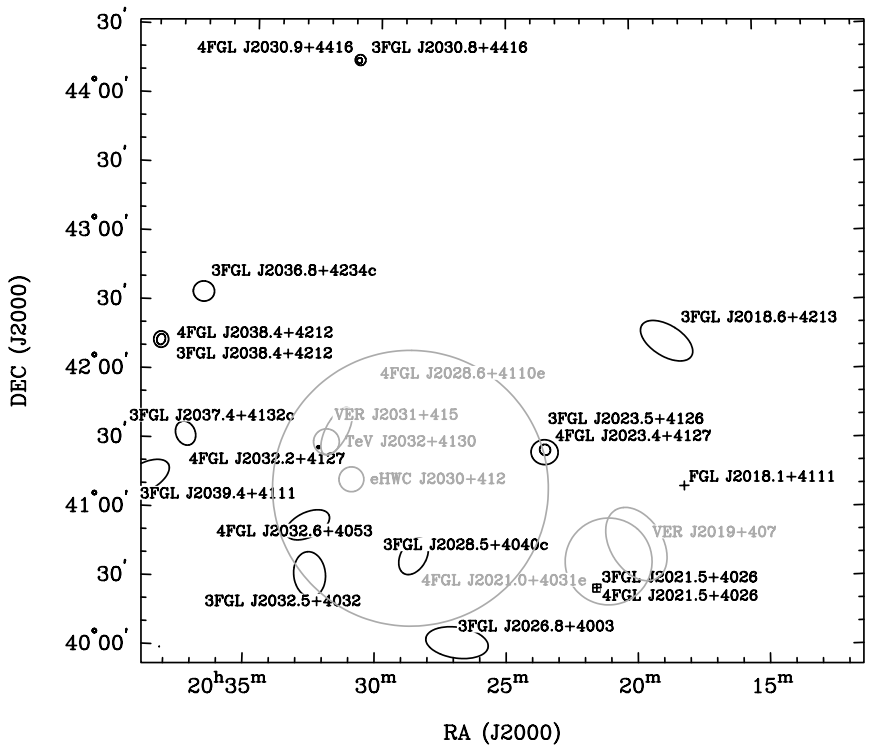
The region under study corresponds to the central part of the Cygnus constellation which is relatively nearby and hosts nine OB associations and various rich clusters (Uyanıker et al., 2001; Mahy et al., 2013), see also Reipurth & Schneider (2008) for a review. The region also has many unindentified VHE sources. The observed area covers 20 sq deg, centred at (J2000) = 20:25:30, 42:00:00. It encompasses the stellar association of Cyg OB2, and part of Cyg OB8 and OB9, extremely rich in OB stars and with traces of recent star formation (see Figure 2 by Benaglia et al., 2020b).
The Fermi LAT collaboration produced four all-purpose all-sky catalogs, namely First, Second, Third and Four Fermi Gamma-ray LAT (1FGL, 2FGL, 3FGL, 4FGL) catalogs, after the analysis of 0.9, 2, 4 and 8 years of data, respectively (see Abdollahi et al., 2020, and references therein). Besides different data collection periods and slightly different energy ranges (enlarged with date), the analysis software package and the model of the underlying diffuse emission to be subtracted were improved over time. The 4FGL paper covered the range of 0.05 GeV to 1 TeV and detected 5064 point sources above 4; the authors reported that for 1336 they did not find plausible counterparts. The 4FGL catalog has a second release, the LAT 10-year Source Catalogue Data Release 2 (4FGL-DR2)111https://fermi.gsfc.nasa.gov/ssc/data/access/lat/10yr_catalog/.
We selected the point sources of the 3FGL and 4FGL catalogs that lie in the Cygnus region observed at radio bands. There is one source only present at the 4FGL catalog, five sources with 4FGL and 3FGL entries, and seven sources with only 3FGL identification. We added a fourteenth source reported by Abeysekara et al. (2018) by their own reprocessing of Fermi-LAT data. Table 1 lists name, central position, extension, identified or likely associated source/counterpart, reference and variability index from 3FGL and 4FGL catalogs, of the GeV discrete sources considered here. We verified that the 4FGL-DR2 contains the same sources as DR1, and used the error ellipses of DR2. Figure 1 shows the observed area and the location and extension of the studied sources.
| Name | , , | Assoc. sourceb | Reference | Var. | ||
|---|---|---|---|---|---|---|
| (hms) | (dms) | (deg, deg, deg) | index | |||
| FGL J2018.14111 | 20:18:07.4 | 41:10:44 | 0.1, 0.1c | — | AB2018 | |
| 3FGL J2018.64213 | 20:18:41.89 | 42:13:49.4 | 0.212, 0.112, 57 | — | AC2015 | 35.95 |
| 4FGL J2021.54026 | 20:21:32.4 | 40:26:40 | 0.01, 0.01, 31.7 | PSR J20214026 | AB2020 | 201.76 |
| 3FGL J2021.54026 | 20:21:32.5 | 40:26:51.68 | 0.008, 0.008, 17 | AC2015 | 157.71 | |
| 4FGL J2023.44127 | 20:23:29.1 | 41:27:03 | 0.03, 0.03, 40.0 | SSTSL2 J202336.19 | AB2020 | 11.03 |
| 3FGL J2023.5+4126 | 20:23:30.19 | 41:26:01.28 | 0.098, 0.09, 85 | 412527.0 | AC2015 | 48.95 |
| 3FGL J2026.84003 | 20:26:51.79 | 40:03:09.28 | 0.228, 0.112, 82 | — | AC2015 | 55.73 |
| 3FGL J2028.54040c | 20:28:32.29 | 40:40:37.19 | 0.143, 0.093, 29 | — | AC2015 | 48.79 |
| 4FGL J2030.94416 | 20:30:54.1 | 44:16:01 | 0.02, 0.01, 86.0 | PSR J20304415 | AB2020 | 3.90 |
| 3FGL J2030.84416 | 20:30:51.70 | 44:16:13.40 | 0.039, 0.038, 22 | AC2015 | 36.43 | |
| 4FGL J2032.24127 | 20:32:15.0 | 41:27:32 | 0.01, 0.01, 59.2 | PSR 20324127 | AB2020 | 10.65 |
| 3FGL J2032.24126 | 20:32:14.29 | 41:26:48.8 | 0.014, 0.014, 17 | AC2015 | 38.32 | |
| 4FGL J2032.64053 | 20:32:36.6 | 40:53:38 | 0.17, 0.09, 63.4 | Cyg X-3 | AB2020 | 67.44 |
| 3FGL J2032.54032 | 20:32:30.0 | 40.32:05.6 | 0.165, 0.115, 7 | — | AC2015 | 141.31 |
| 3FGL J2036.84234c | 20:36:53.2 | 42:34:05.08 | 0.077, 0.073, 84 | — | AC2015 | 42.08 |
| 3FGL J2037.44132c | 20:37:24.89 | 41:32:02.39 | 0.09, 0.07, 25 | — | AC2015 | 40.87 |
| 4FGL J2038.44212 | 20:38:30.0 | 42:12:31 | 0.05, 0.04, 14.3 | — | AB2020 | 5.52 |
| 3FGL J2038.44212 | 20:38:29.89 | 42:12:30.6 | 0.059, 0.054, 14 | — | AC2015 | 45.67 |
| 3FGL J2039.44111 | 20:39:24.96 | 41:11:52.8 | 0.2, 0.1, 59 | — | AC2015 | 45.39 |
Note. — a: , and are the major and minor axis and position angle of the Fermi error ellipse, at 68% for 4FGL sources. b: Identified or likely associated source. c: The authors quote a point source and a PSF of 0.1 deg. AB2018: Abeysekara et al. (2018); AC2015: Acero et al. (2015); AB2020: Abdollahi et al. (2020).
2.1 Other gamma-ray sources
Beside the discrete sources detected by the Fermi LAT telescope, there are other gamma-ray sources that lay in the observed region. This second group includes extended sources reported under the Fermi programs, and sources detected at TeV energies, using other instruments, like the Cherenkov instruments High-Energy-Gamma-Ray Astronomy (HEGRA), High Altitude Water Cherenkov (HAWC), and the Very Energetic Radiation Imaging Telescope Array System (VERITAS). Their names, position and extension are given in Table 2 (see also Figure 1).
| Name | Size | Reference | ||
|---|---|---|---|---|
| (hms) | (dms) | (arcmin) | ||
| VER J2019407 | 20:20:04.8 | 40:45:36 | 17.411.4 | AL2013 |
| 4FGL J2021.04031e | 20:21:04.8 | 40:31:12 | 37.8 | AB2020 |
| 4FGL J2028.64110e | 20:28:40.8 | 41:10:11.9 | 180 | AB2020 |
| eHWC J2030412 | 20:30:57.6 | 41:13:48 | 10.8 | ABE2020 |
| VER J2031415 | 20:31:33.8 | 41:34:38.4 | 9.54 | BA2014 |
| TeV J20324130 | 20:32:07 | 41:30:30 | 11.2 | AH2002 |
3 Data calibration and imaging
The radio observations used for this investigation were carried out with the GMRT at the bands centred at 325 and 610 MHz, during four campaigns between 2013 and 2017, with a total of 172 hours of observing time. The field of views (FoV) of the GMRT are 814′ and 433′ (GMRT Observer’s Manual222www.ncra.tifr.res.in/ncra/gmrt/gmrt-users /observing-help) at 325 MHz and 610 MHz bands respectively. According to the FoVs sizes and the region to cover (see Figure 1), we implemented five pointings at 325 MHz and 47 pointings at 610 MHz (45 plus repeating two additional with originally bad data; again, see Figure 2 of Benaglia et al., 2020b), and taking also into account the requirement to obtain a uniform noise with the minimum amount of pointings. The flux calibrators 3C286 and/or 3C48 were observed at the beginning and at the end of the observing session. A secondary calibrator 2052365 was observed for 5 minutes after every 30 mins scan on the target. To minimise the effect of bandwidth smearing, the signal with 33.33 MHz bandwidth was recorded in spectral line mode with 256 channels.
The data was processed with the Source Peeling and Atmospheric Modeling algorithms (Intema, 2014), that handle both the calibration and the imaging steps. Full description of acquisition, reduction and imaging of the data is presented with all details in Benaglia et al. (2020b). At imaging, we adopted a robust weighting equal to 1. The synthesised beams of the final mosaics were for the 325 MHz band, and at the 610 MHz band. The attained rms values resulted, on average, of up to 0.5 mJy beam-1 and 0.2 mJy beam-1, respectively. The final individual images were mosaicked to get a single image of full region.
Additionally, we also imaged the 325 MHz FoVs, with the Astronomical Imagining Processing System (AIPS) following standard procedures. The data were inspected and flagged manually. The flux density scale for the flux calibrators 3C48 and 3C286 was set using Perley-Butler 2013 scale (Perley & Butler, 2013). After the bandpass calibration, the data were averaged keeping in mind to minimise the effect of bandwidth smearing. Multi-facet imaging options were used to correct for w-term due to large field of view. A few rounds of phase-only self-calibration were carried out to correct for phase variations, which has improved the image quality substantially. The primary beam correction was carried out on the final image. The correction due to excess background emission at low radio frequencies in the galactic plane was also applied on the final images.
4 Results
4.1 Radio emission in discrete Fermi sources
We inspected the images at 325 and 610 MHz to search for radio sources above 3 (rms), that laid in the error ellipses of the GeV sources listed in Table 1. In the process, signals that represented peaks of extended and/or diffuse emission were discarded. For nine discrete Fermi objects, 35 radio sources were found, five of them at only one band.
To derive the radio flux densities, we convolved the 610 MHz image to the synthesised beam of . We fit Gaussian functions, and verified the value of the integrated flux obtained in that way, by measuring the flux density above the 3 contour, being the local rms. The measurements are given in Table 3.
For the 30 radio sources detected at both bands, we derived the spectral index , using the convention . For the rest, a spectral index upper limit is quoted (see Table 3), except for one with observations only at one band (S35). One must take into account here that the observations at the two radio bands were not simultaneous (see Table 2 of Benaglia et al., 2020b), and that by using the mosaic technique adjacent FoVs limiting areas were averaged.
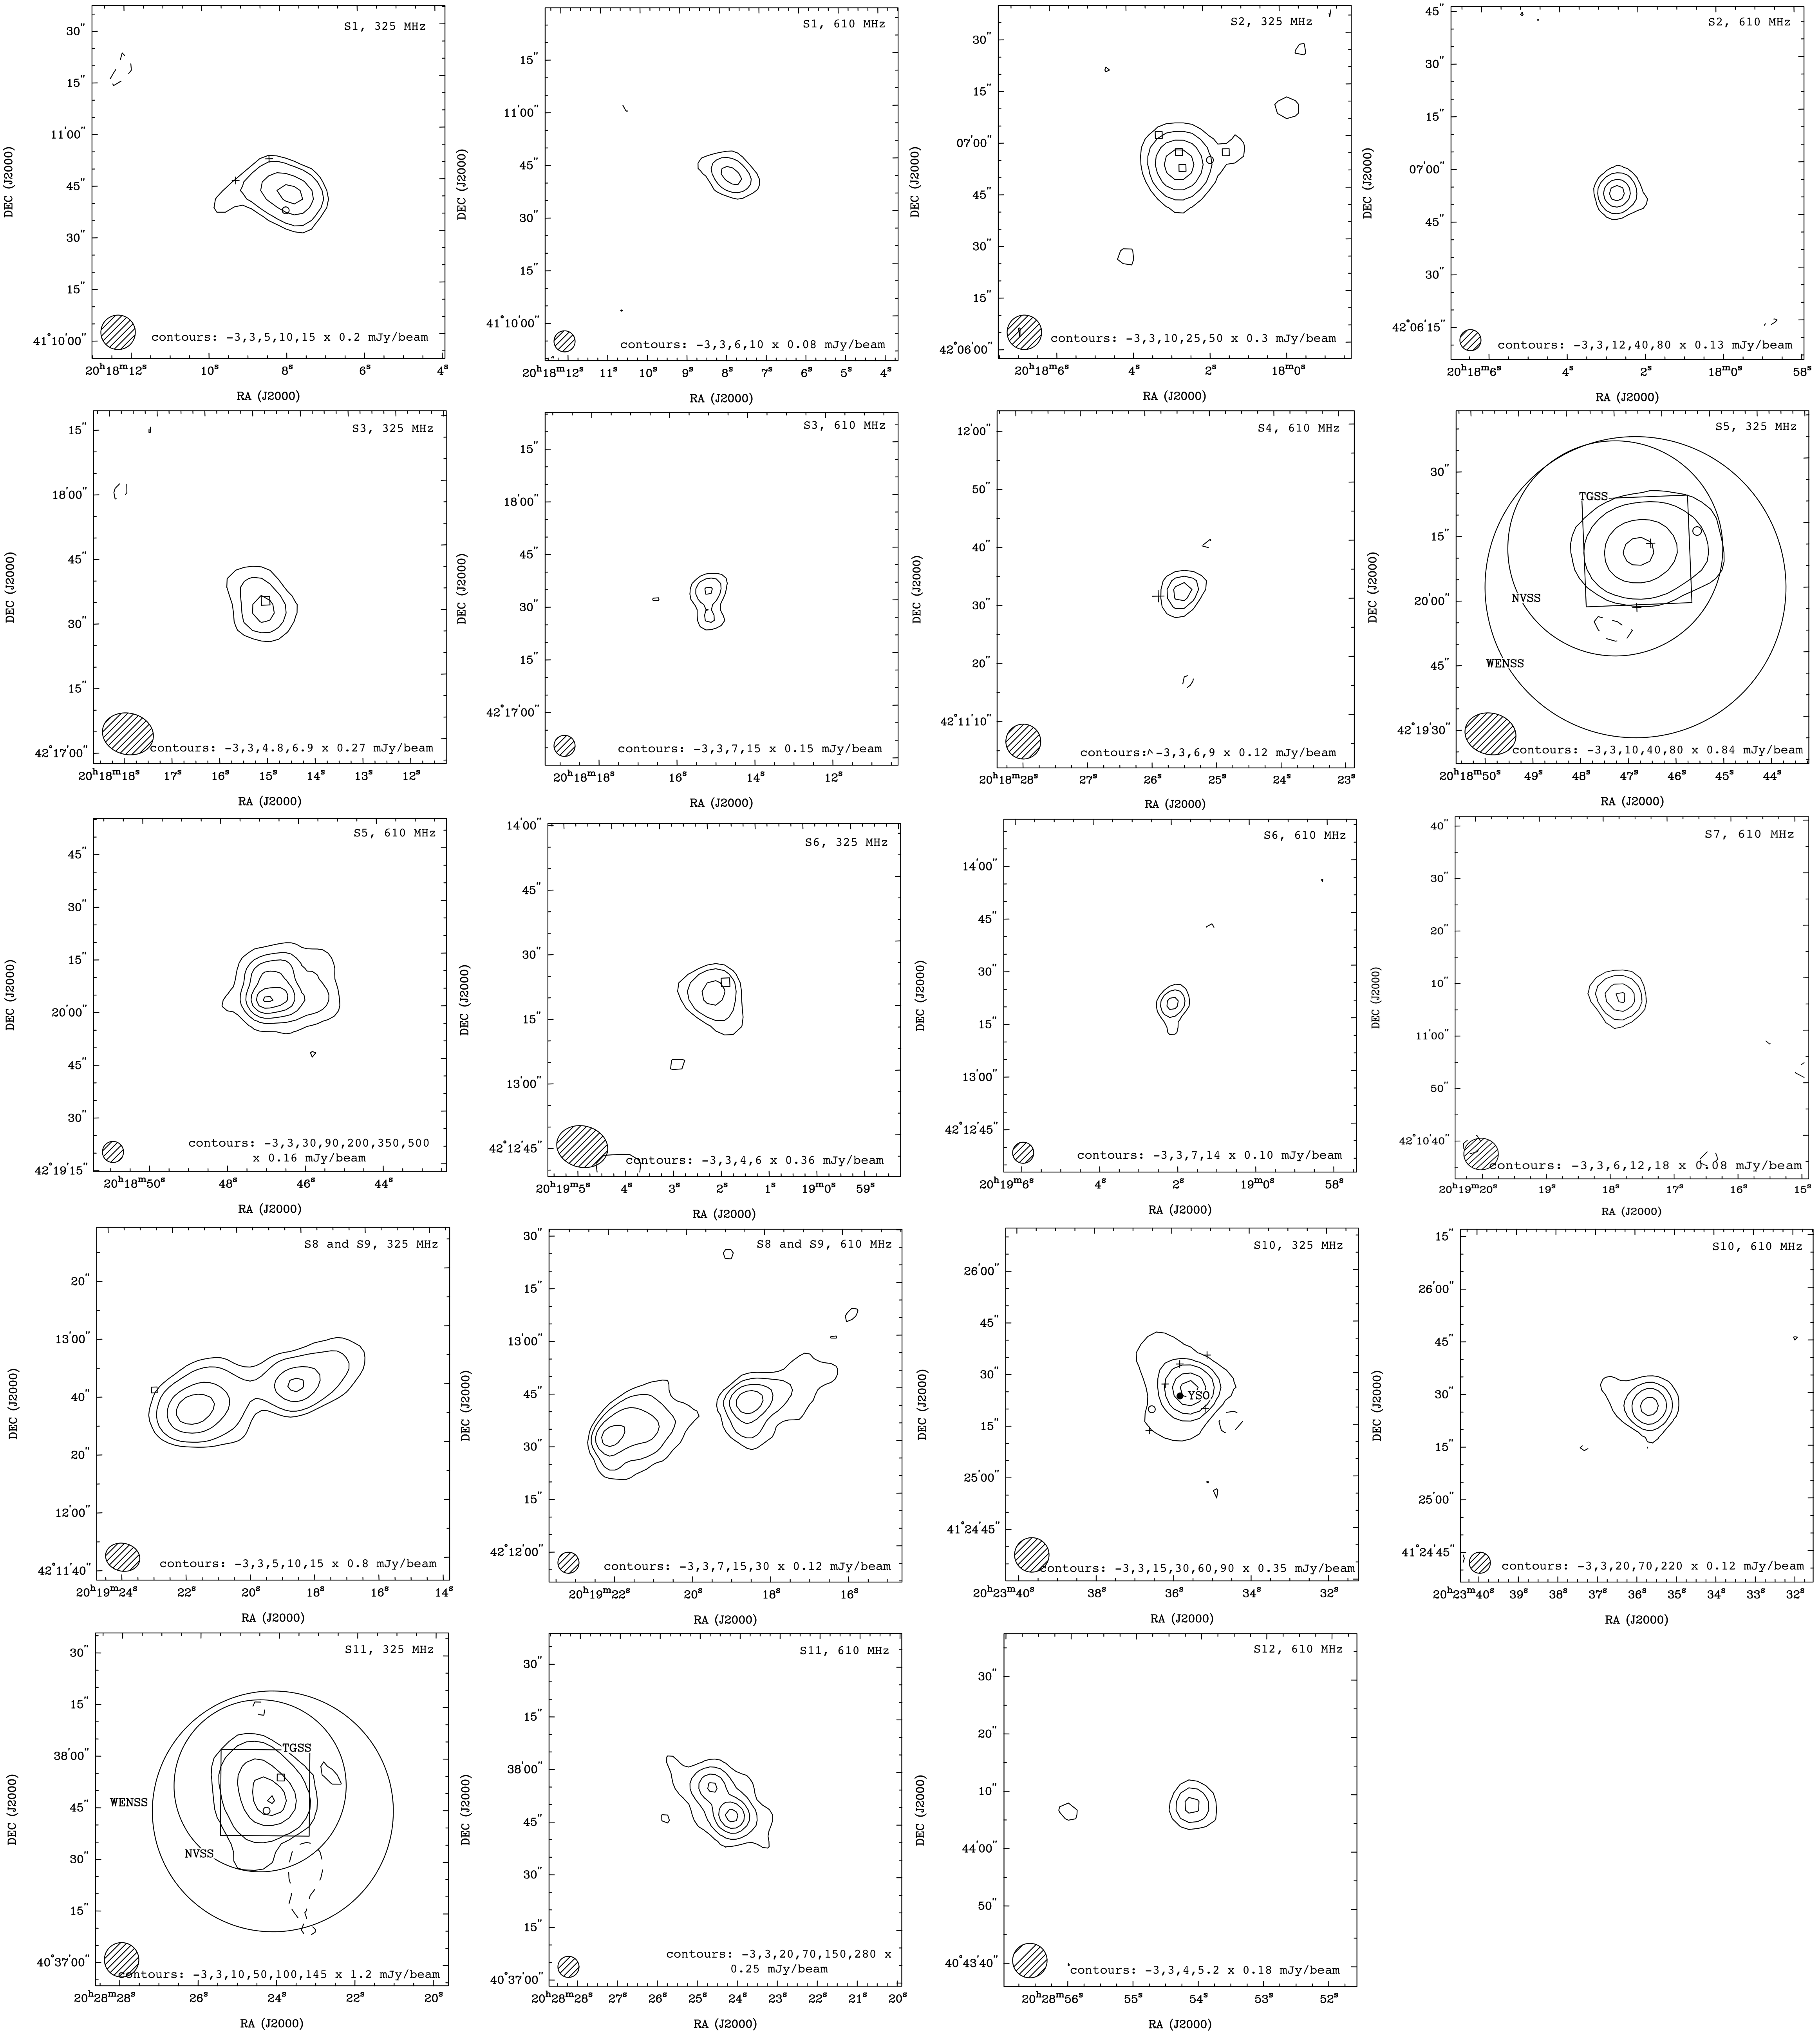
In what follows, we describe the findings related to each gamma-ray source of Table 1. The individual images of the radio sources are presented in the Appendix.
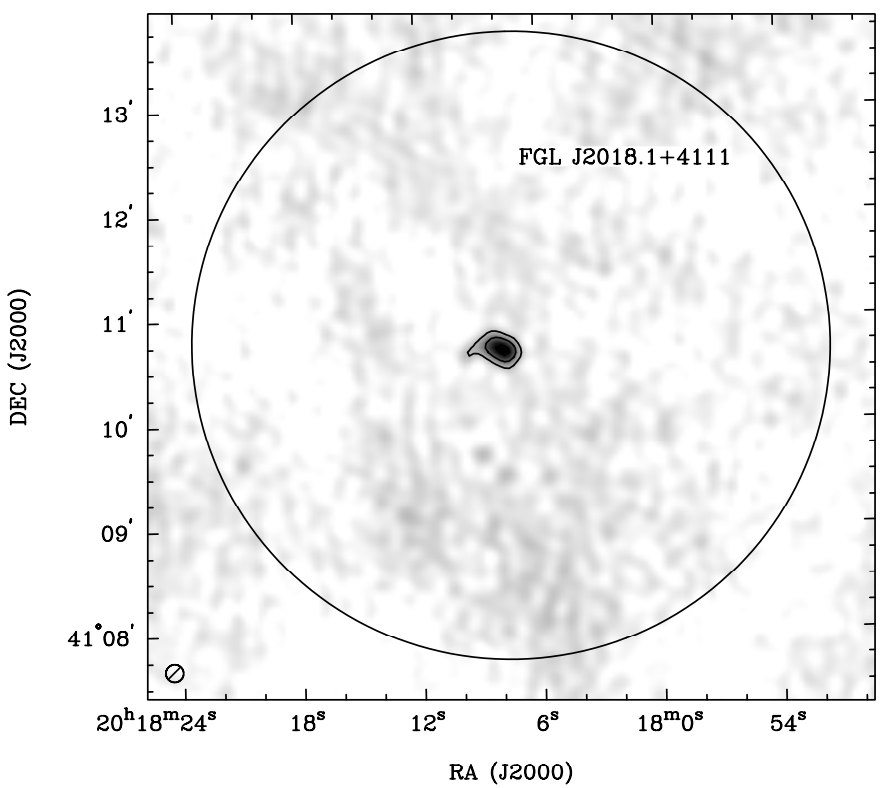
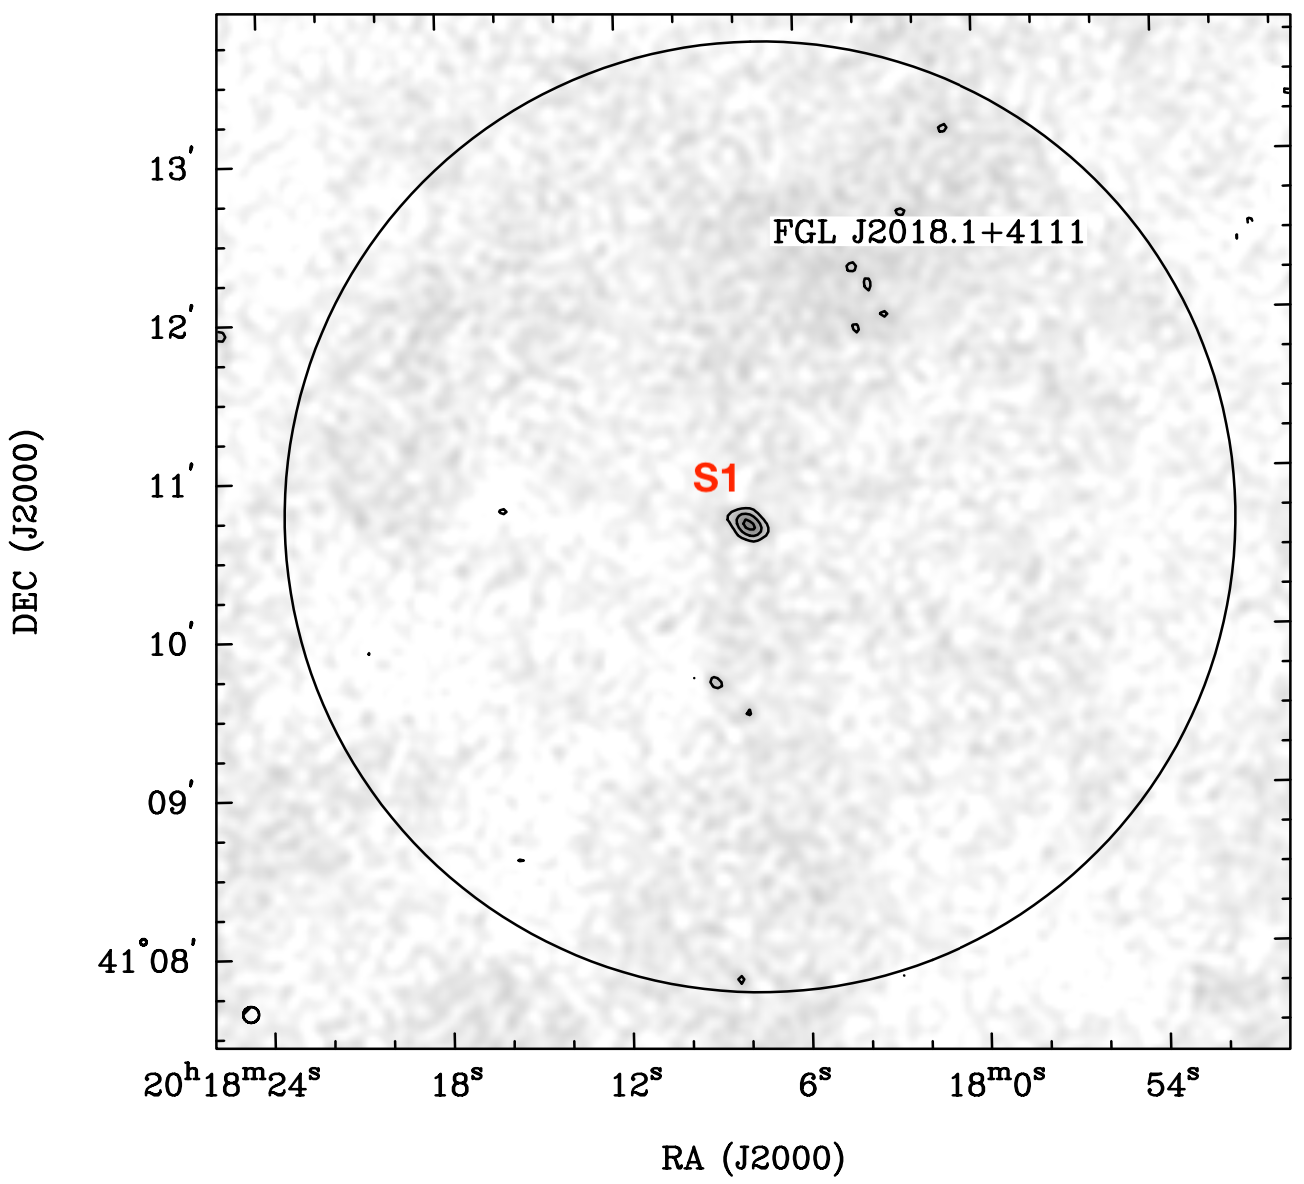
FGL J2018.14111 was discovered by Abeysekara et al. (2018) and reported as a point source of unknown nature, and a PSF at 1 TeV of 0.1 deg. Only one compact radio source at the exact central position of this Fermi source was detected in the radio images at both bands, and named S1; see Figure 2. The spectral index between 325 and 610 MHz resulted in . Such a steep radio spectrum is a strong indicator that this may be a pulsar.
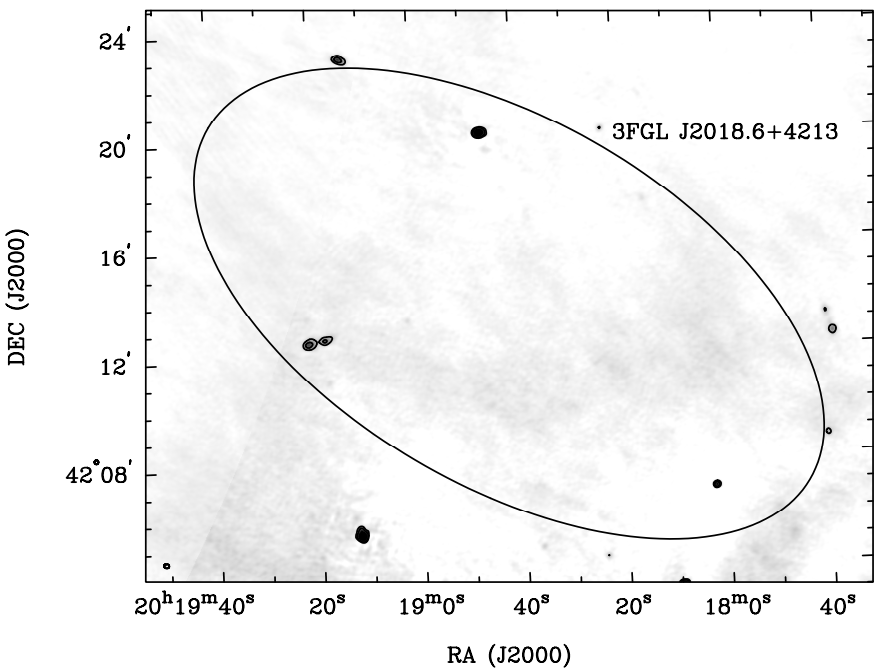
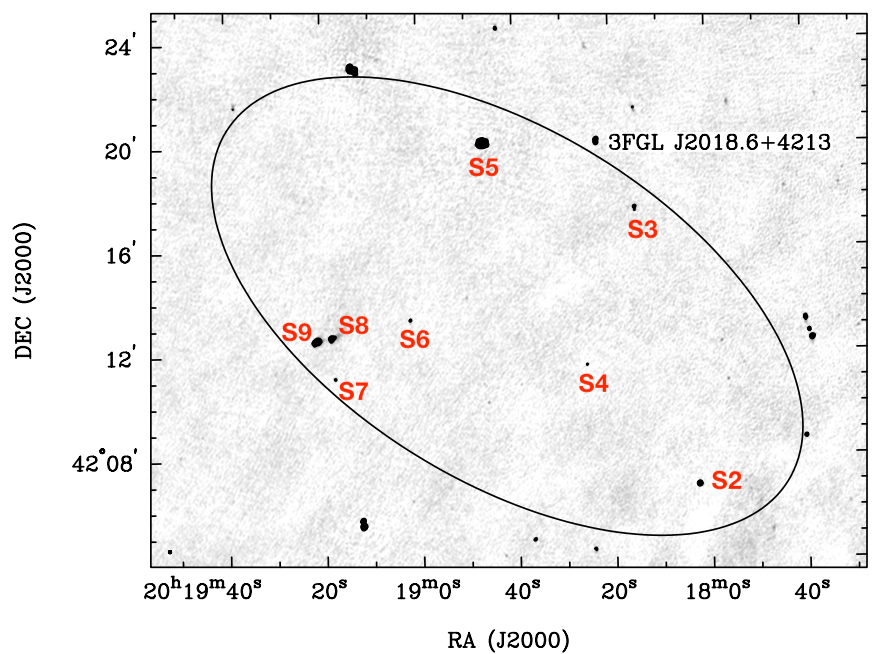
In the error ellipse of 3FGL J2018.64213 we detected eight radio sources at 610 MHz above 3 emission (sources S2 to S9), and six of them also at 325 MHz (see Figure 3 and Table 3), with flux densities from 1 to almost 500 mJy. One of them is double (S3). Most spectral indices of the six detected at both bands are less or equal to , but one source (S6) exhibited a very steep index of . One possible reason for such a steep radio spectral index is the variability, with the flux variations such that to produce steep spectra. Another possibility is that this is a pulsar candidate. It will be useful to further confirm if the source is variable, if so, this may be a micro-quasar; some of them are VHE sources.
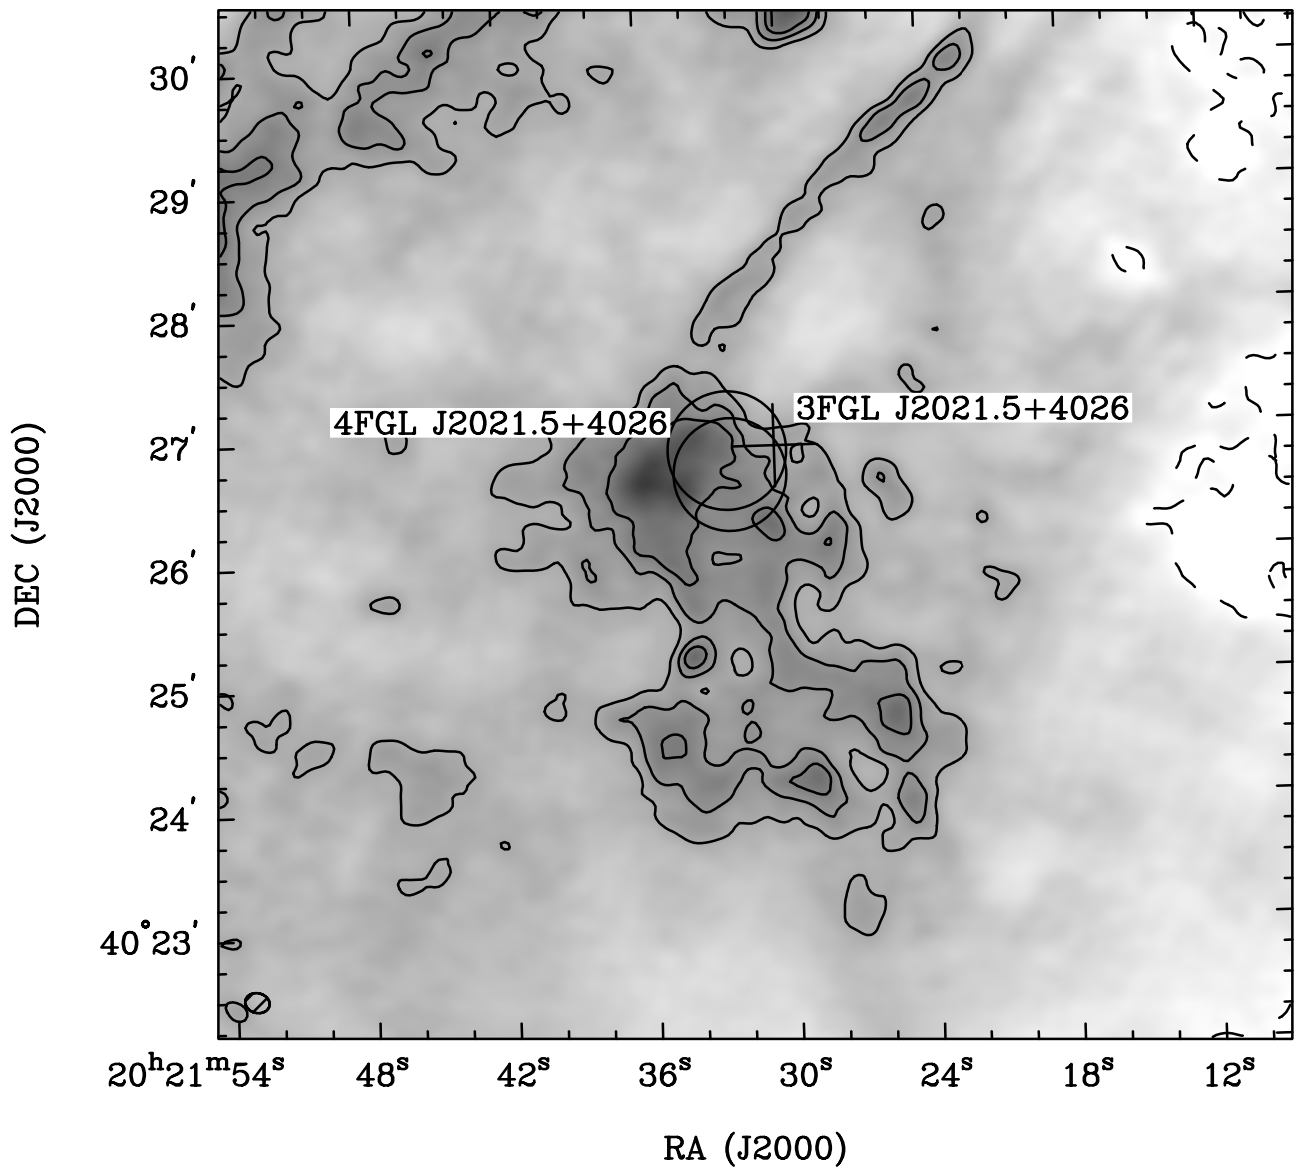
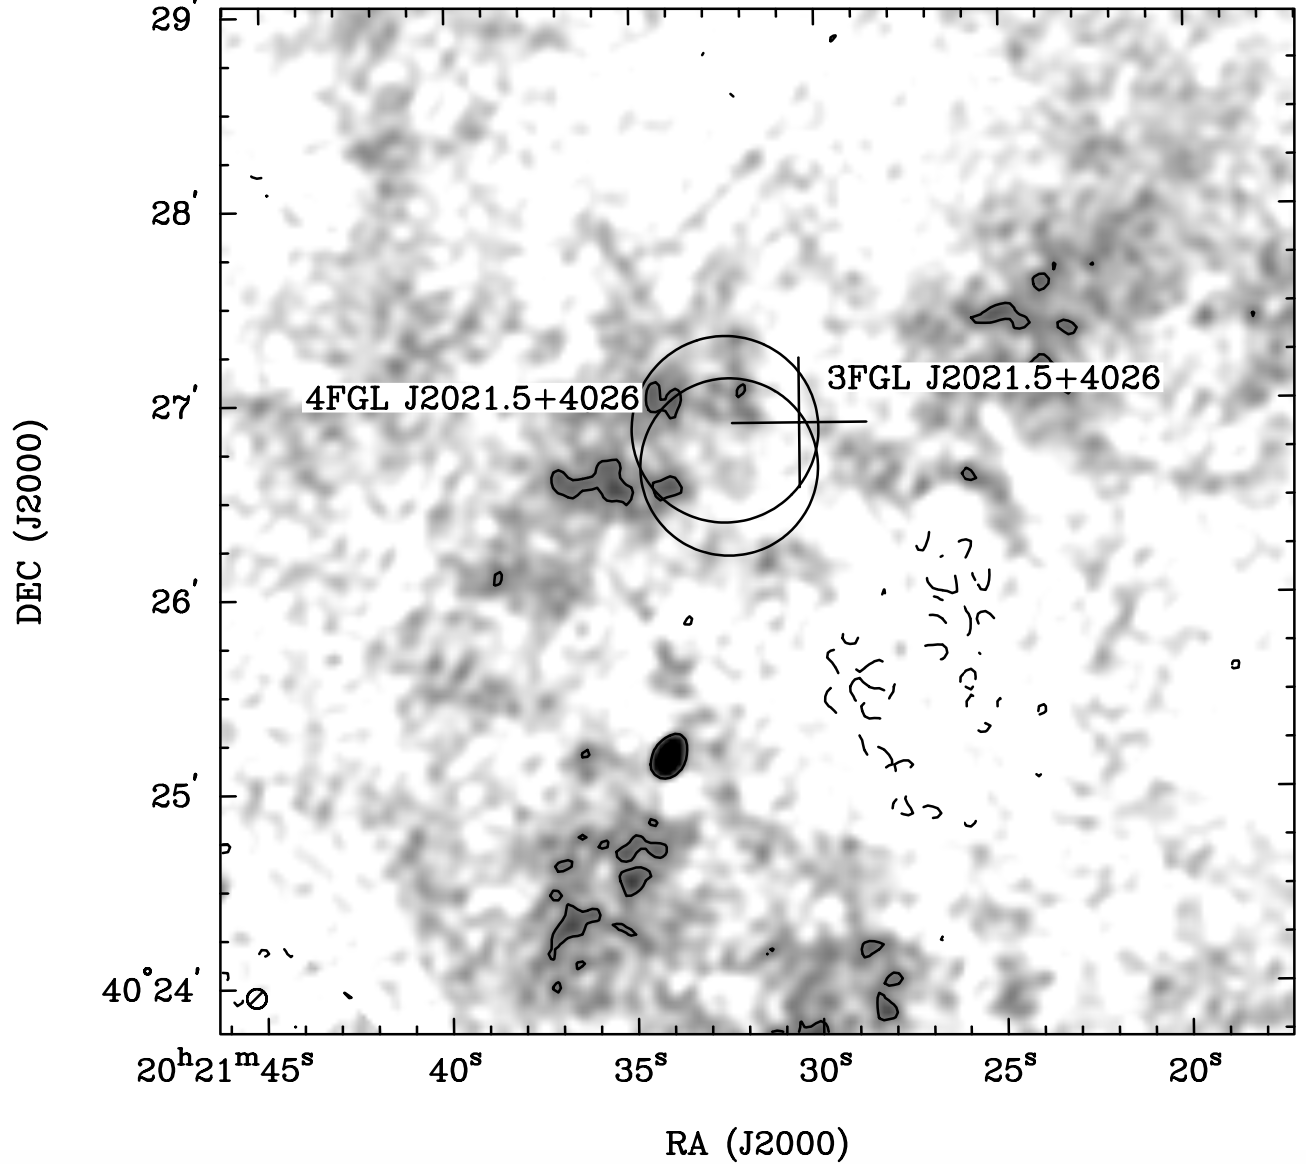
We found no discrete radio sources at the locations of 4FGL J2021.54026, 3FGL J2021.54026 or the pulsar PSR J20214026, but diffuse and rather strong extended emission (see Figure 4). Probably due to that reason, the 610 MHz FoV (out of the 47 pointings) in which the Fermi source is sitting, resulted with higher noise than average.
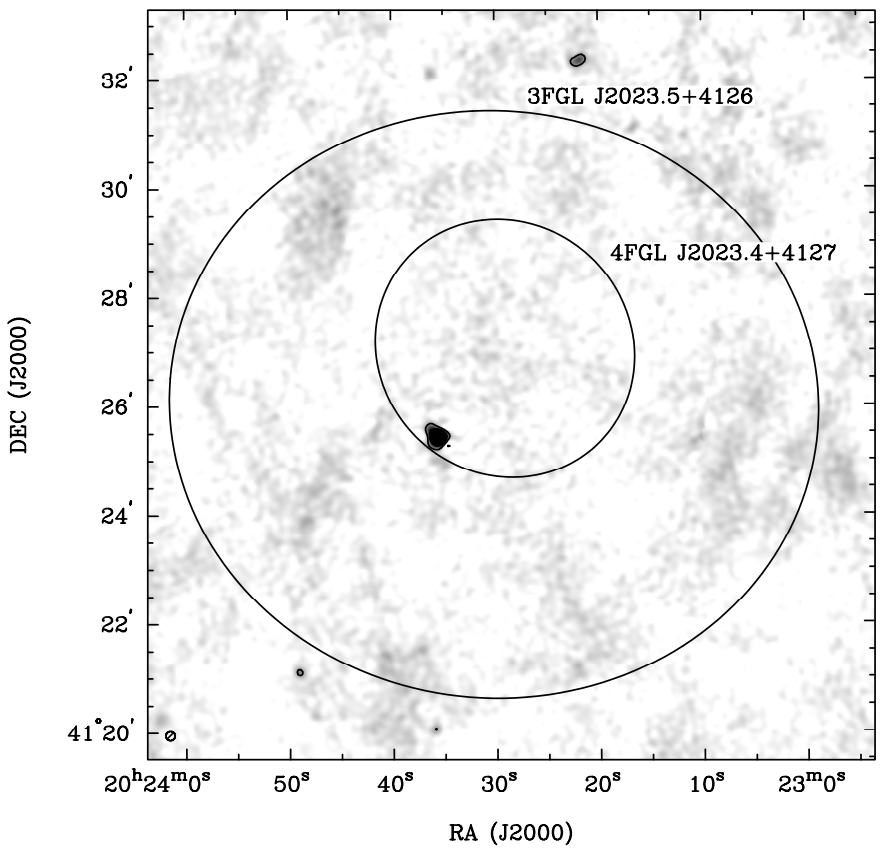
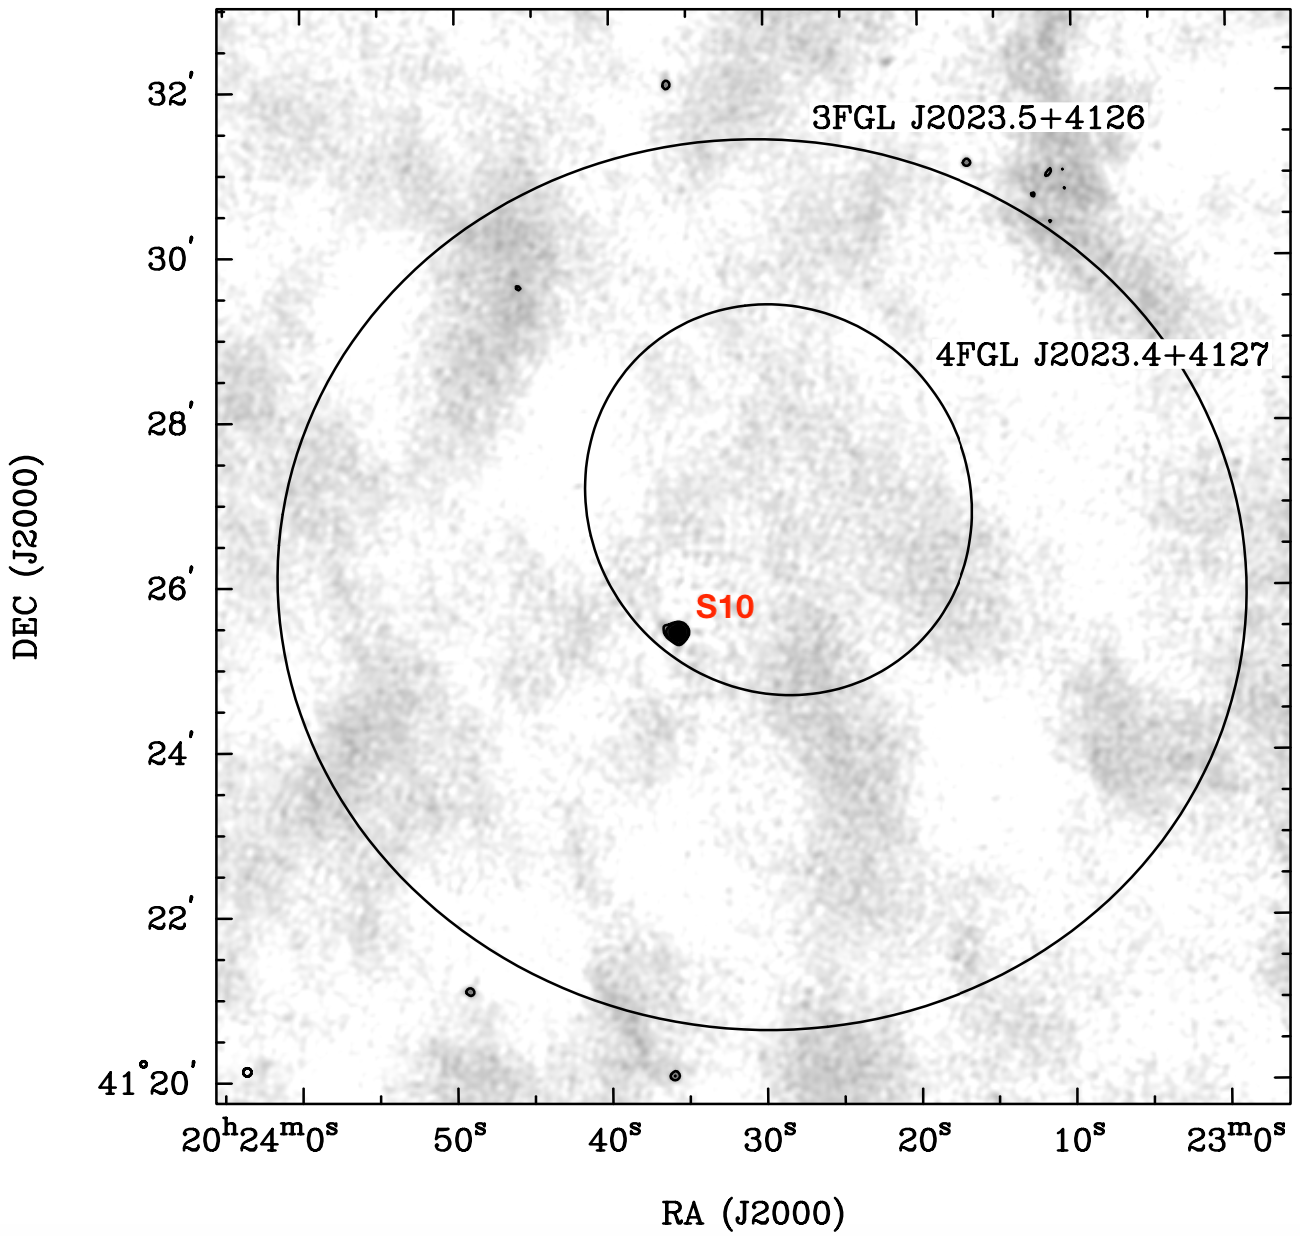
The only radio source at the position of 4FGL J2023.44127 and 3FGL J2023.54126, S10, detected at both radio bands, could be characterized with a spectral index of . We note that S10 is inside the 95% error ellipse for this Fermi source; see Figure 5.
Our images covered the northern half (at 325 MHz) and the western half (at 610 MHz) of 3FGL J2026.84003. No radio sources were found, neither at 325 MHz above 0.6 mJy beam-1, nor at 610 MHz FoVs above 1.0 mJy beam-1 of the observed area due to higher noise in this region.
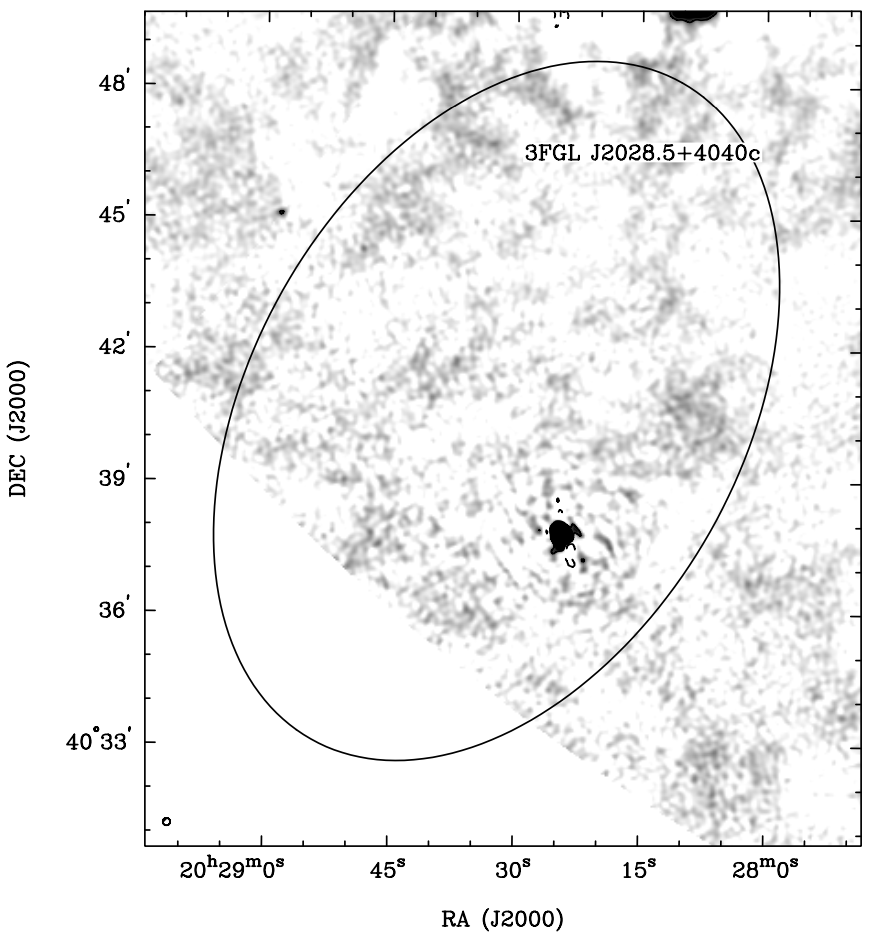
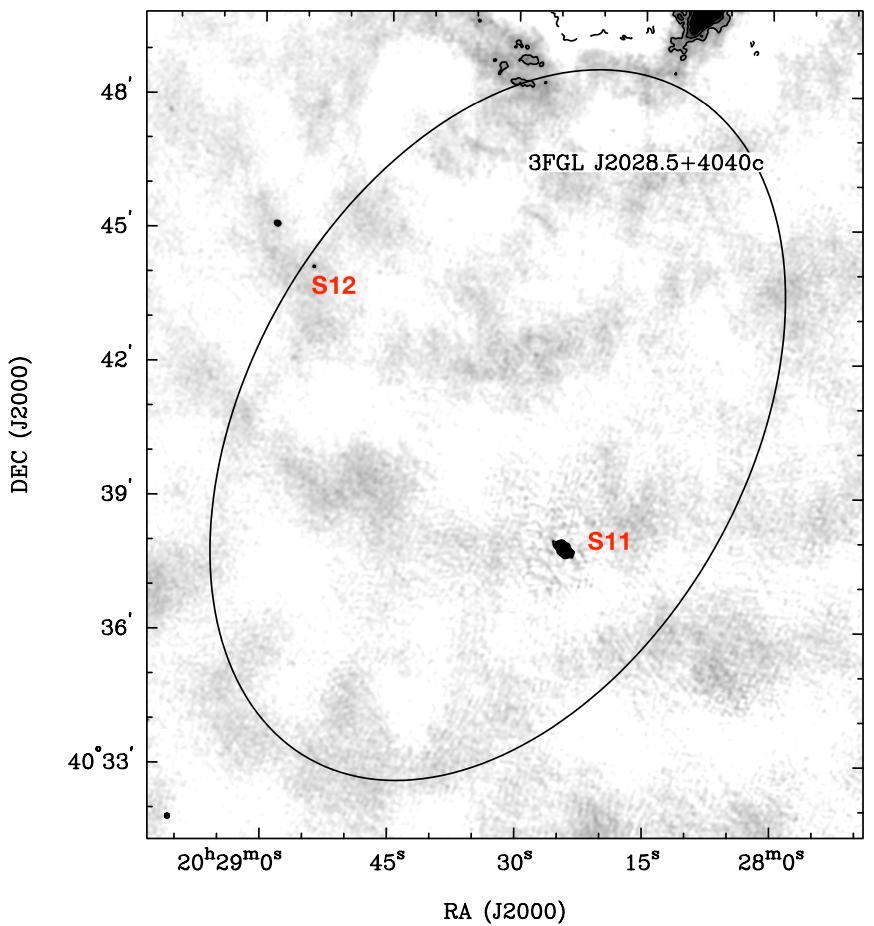
There are two radio sources in the area of 3FGL J2028.54040c. The brighter (), S11, double at 610 MHz, presents a spectral index of . The other was detected solely at 610 MHz (see Figure 6 and Table 3).
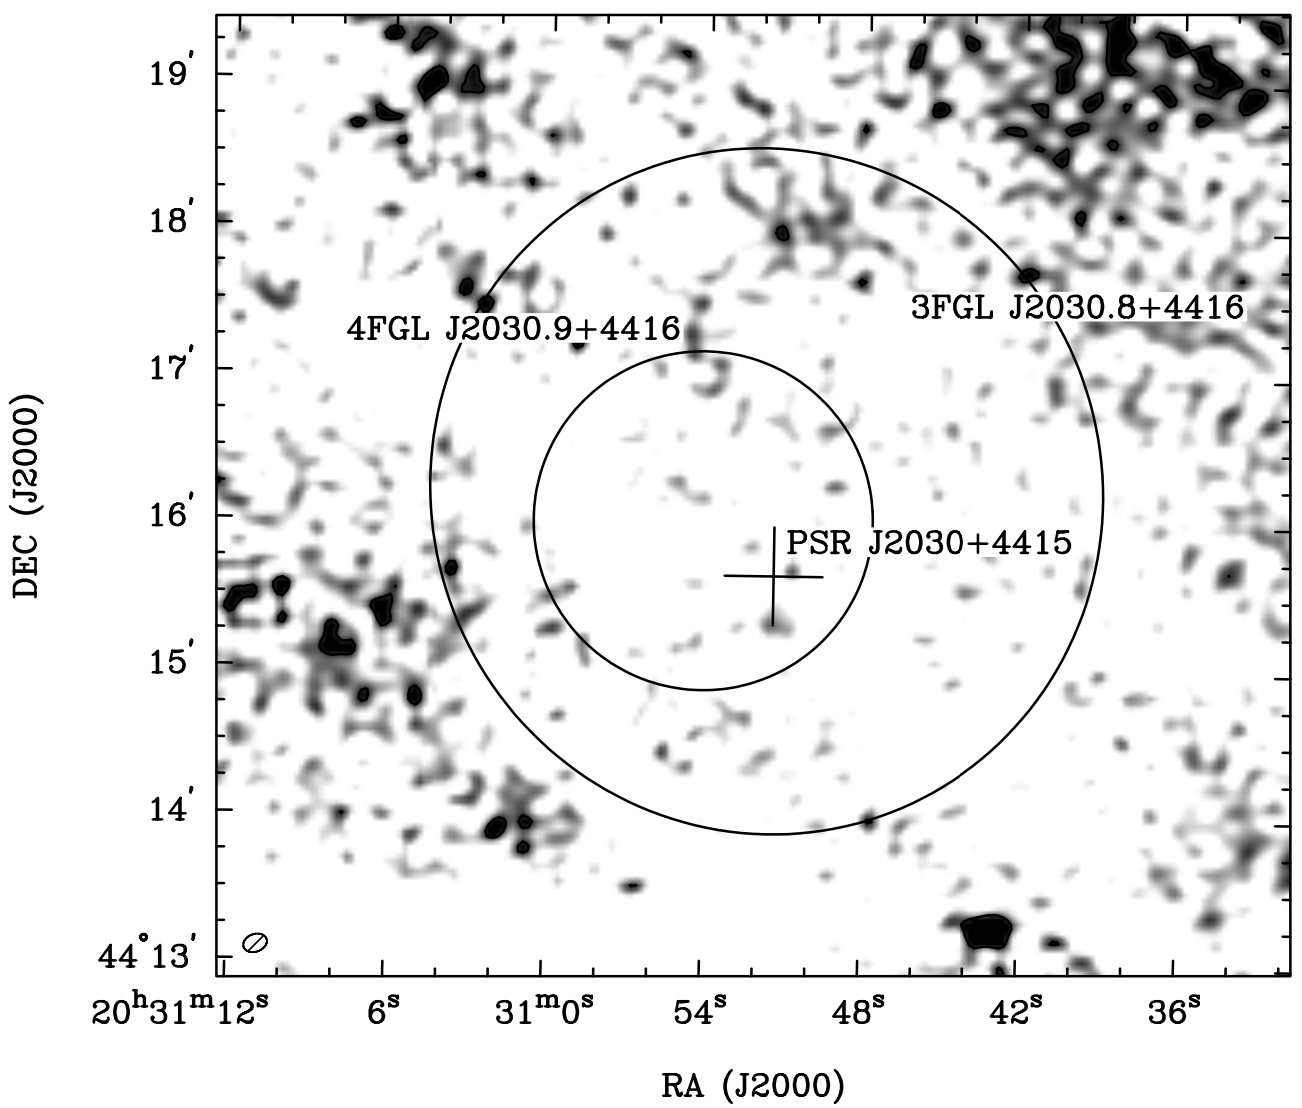
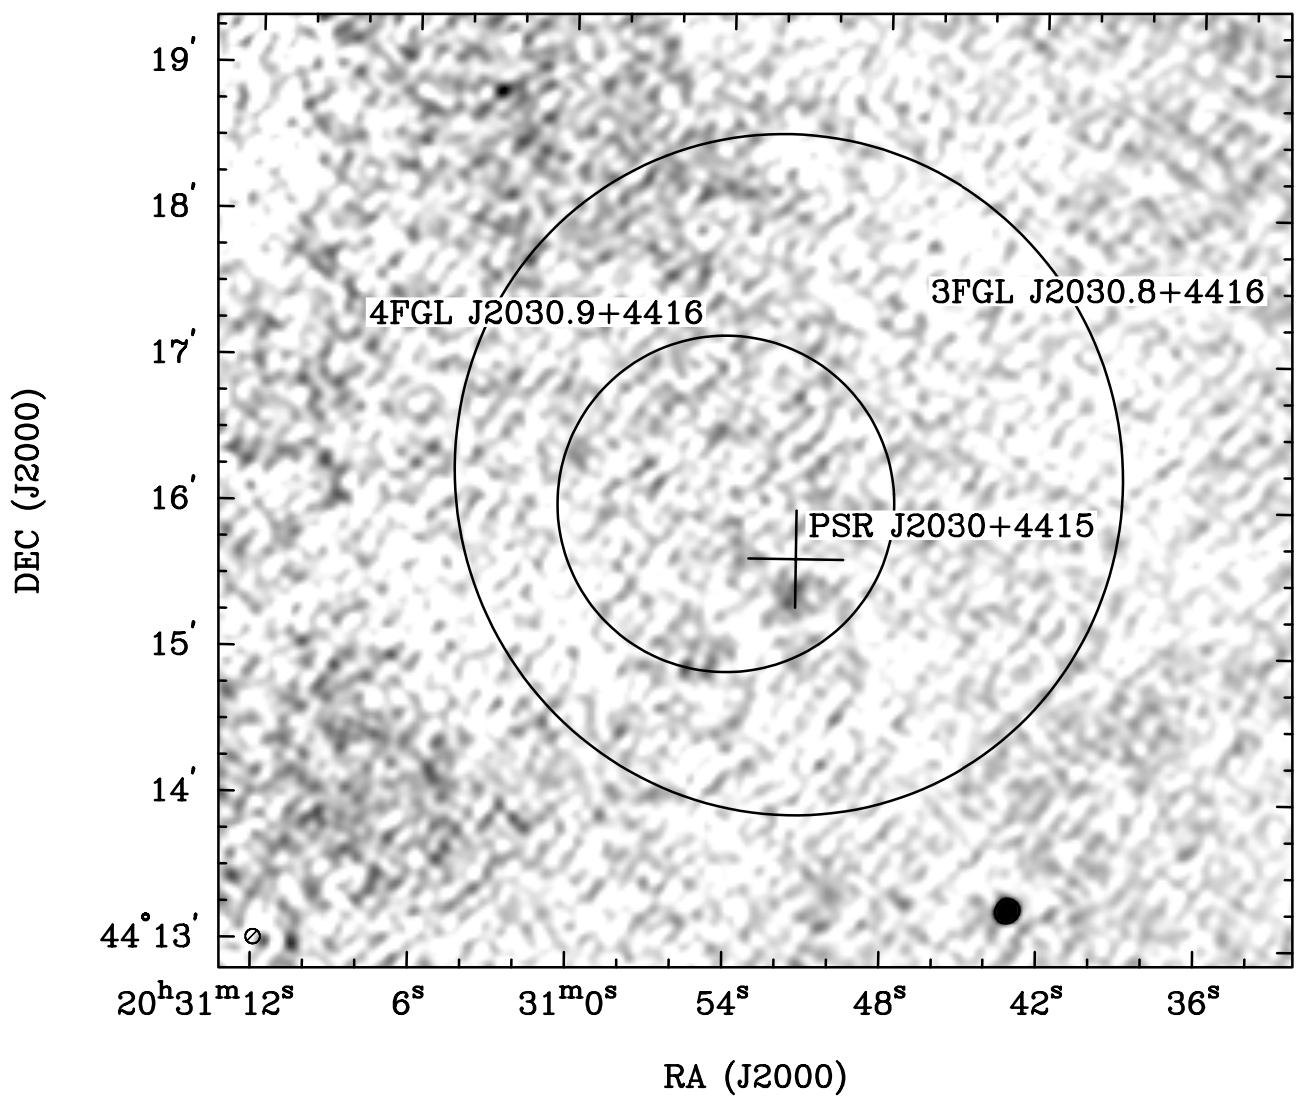


The area of 4FGL 2030.94416 presents weak, diffuse radio emission, probably resolved out due to the weighting scheme adopted in order to outline point sources (see Figure 7). There is an indication that part of that emission could be related to the object PSR J2030+4415 and its wind nebulae (de Vries & Romani, 2020). The pulsar wind nebulae is a potential candidate for source of VHE emission (Bednarek & Bartosik, 2003). Deeper multi-frequency radio observations are required to confirm this as pulsar wind nebulae which might be powering this VHE source.
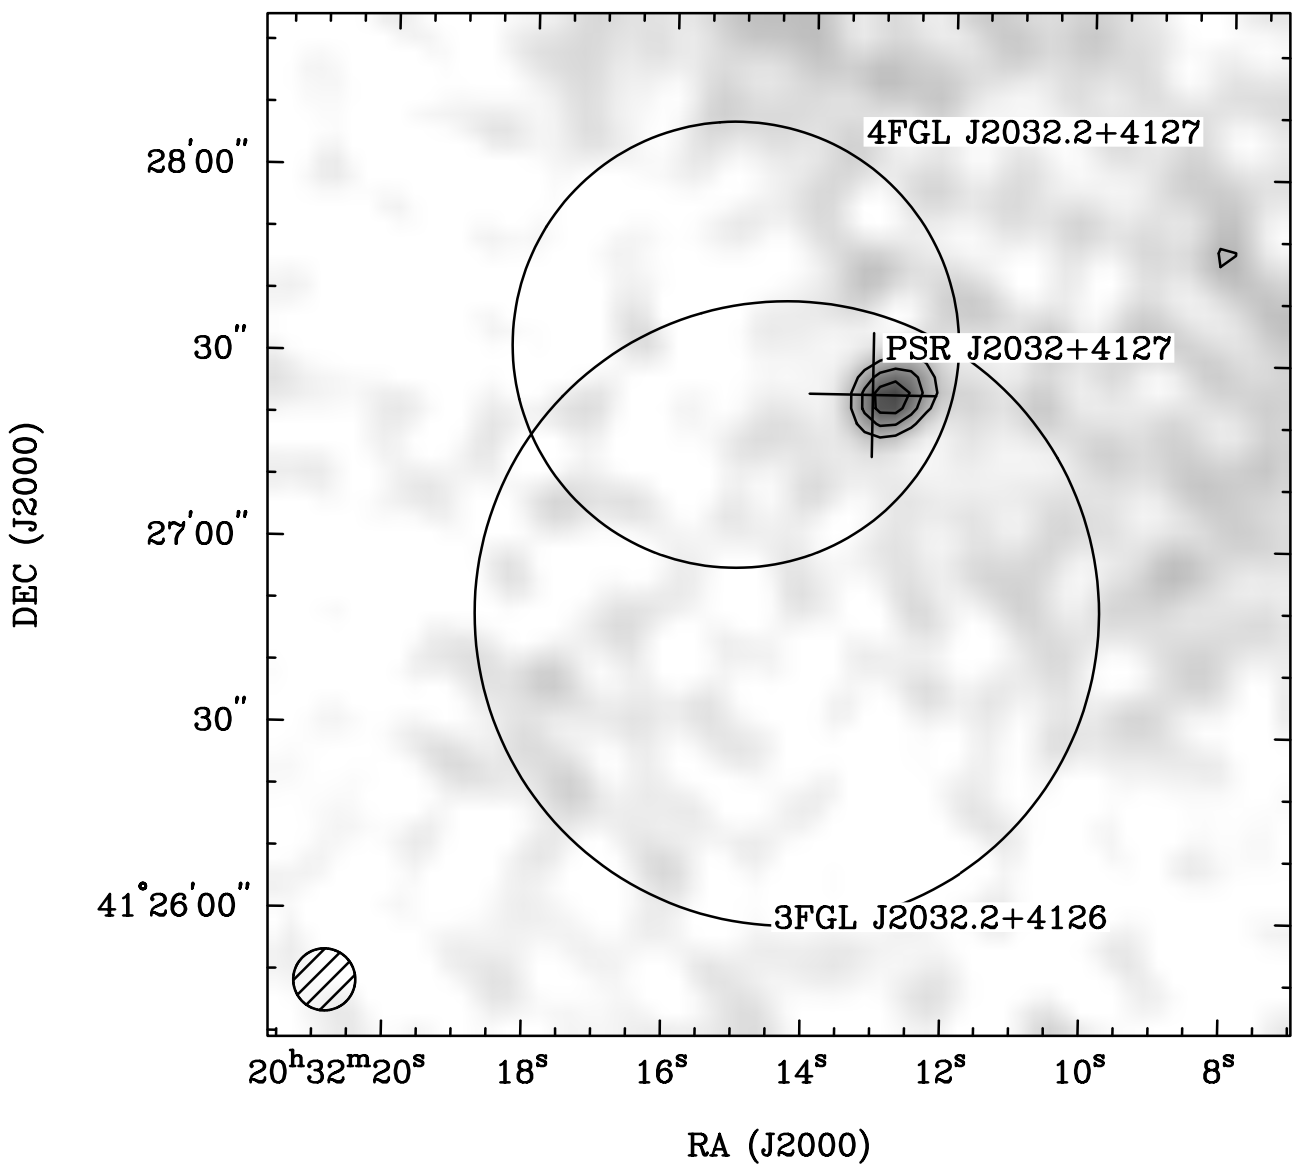
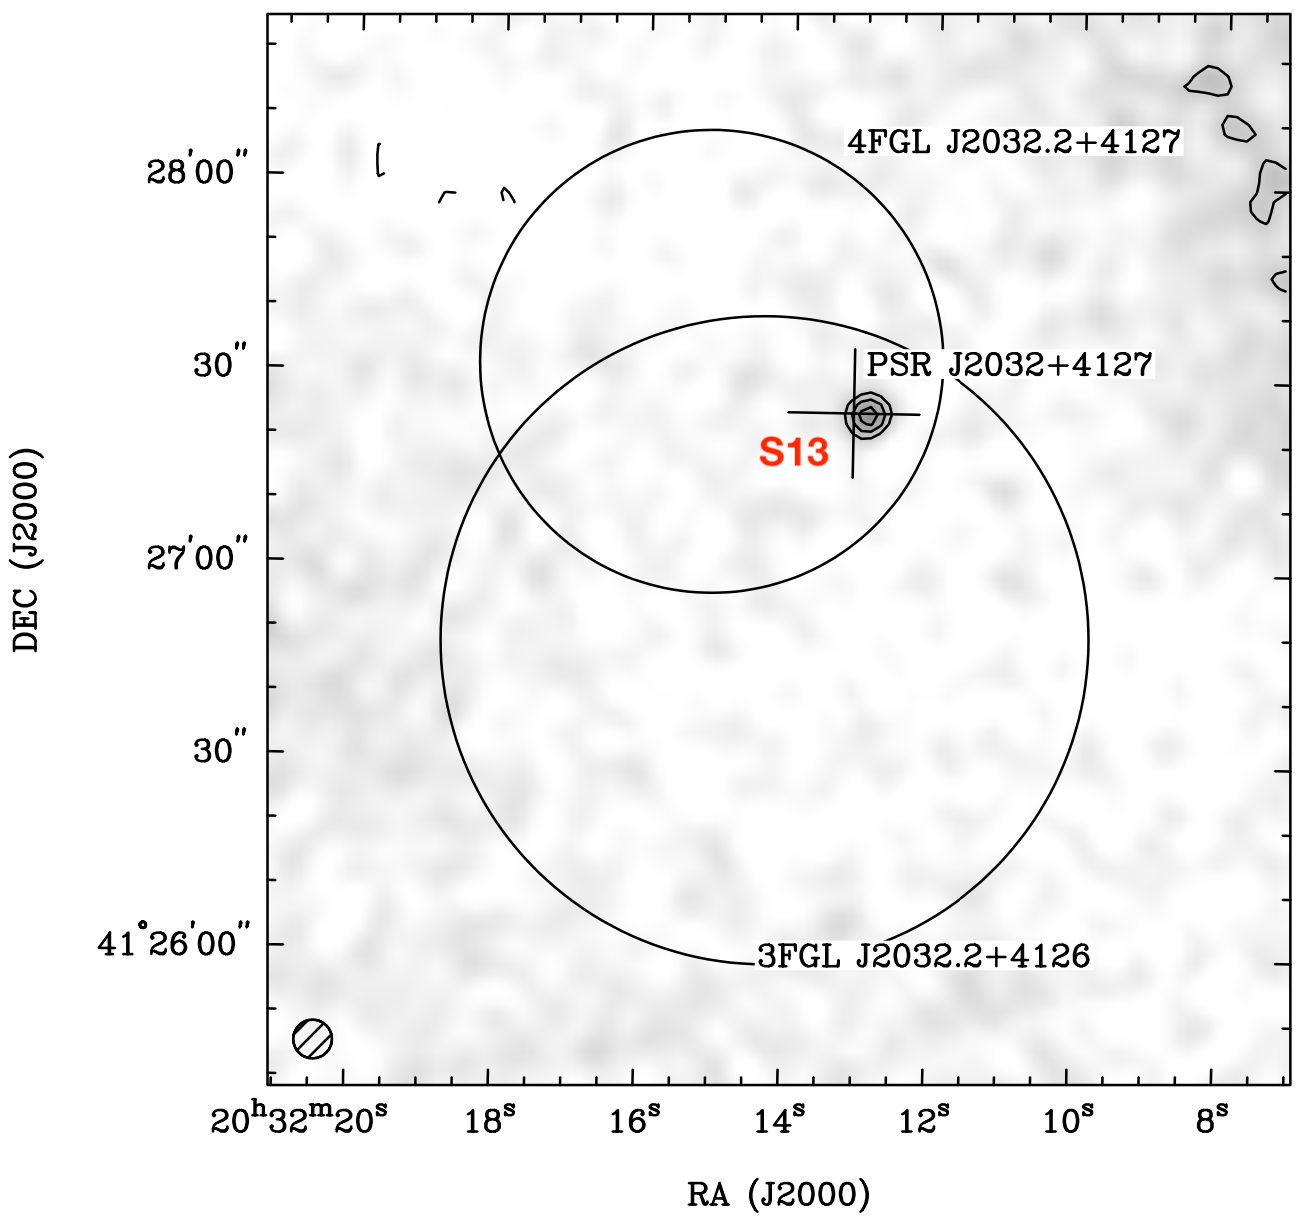
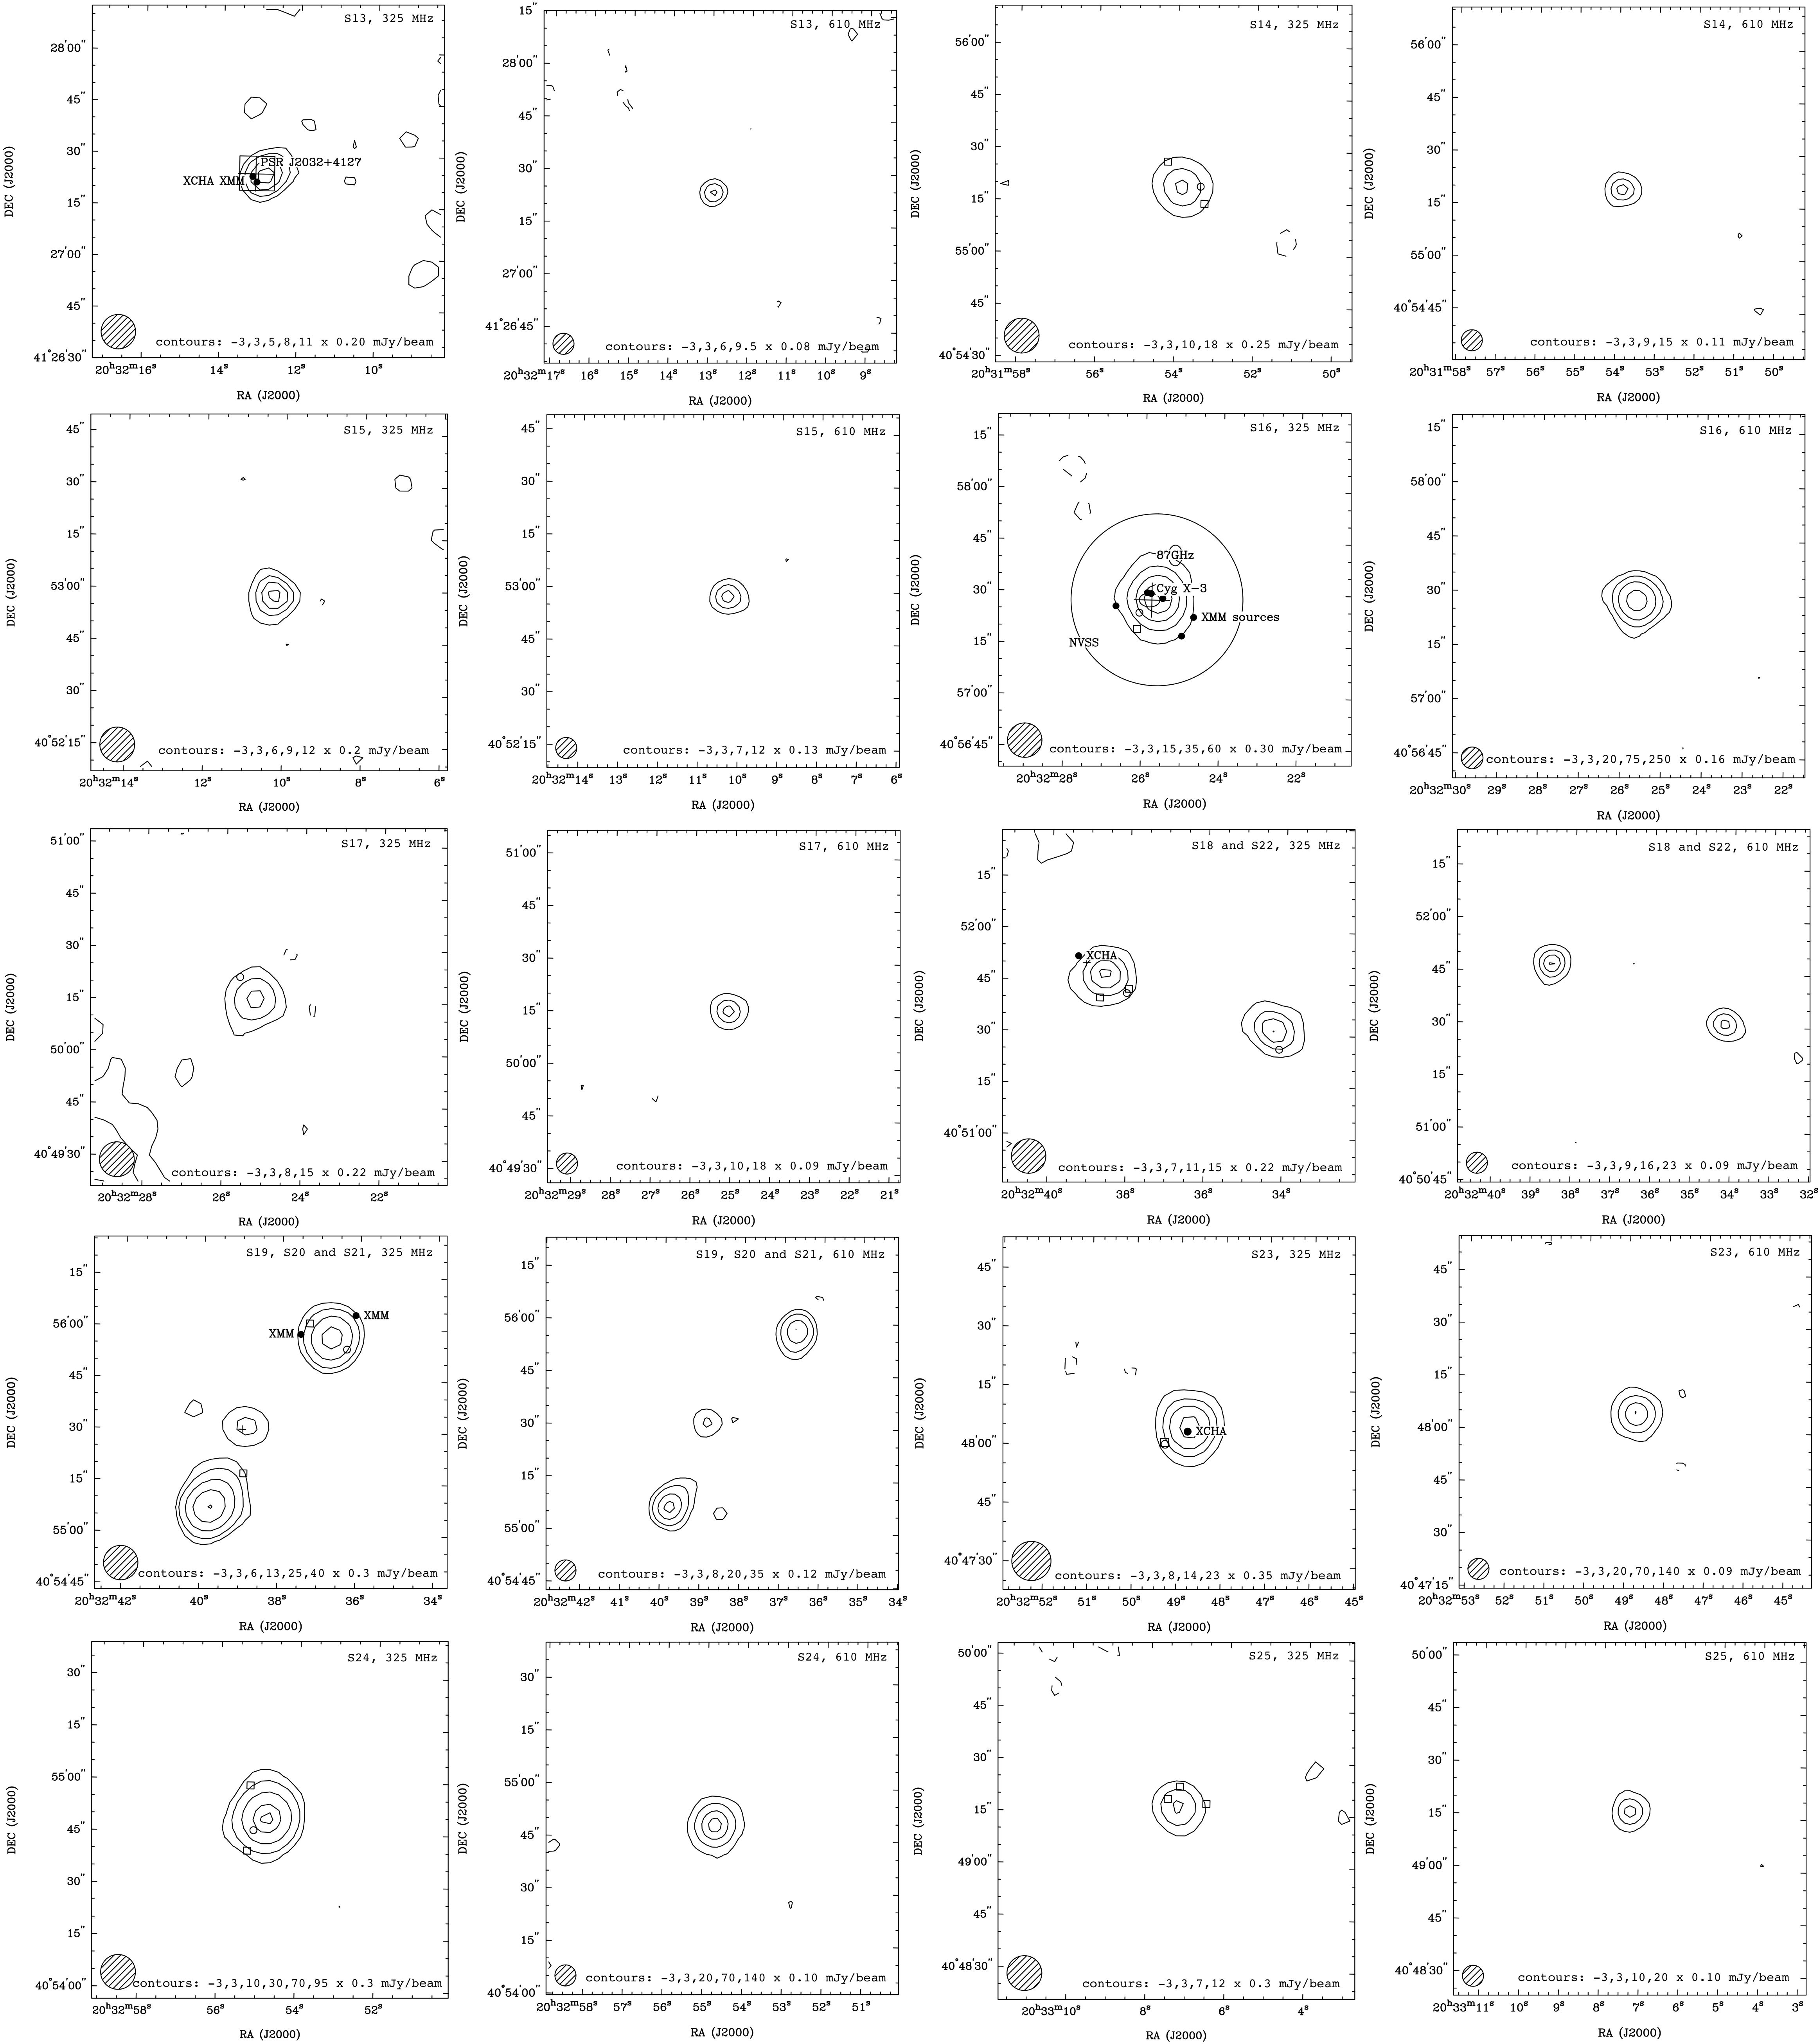
In the case of 4FGL J2032.24127, there is a pulsar, namely PSR J2032+4127, which was detected by Fermi (Abdo et al., 2009) in gamma rays and in radio with the Green Bank Telescope (Camilo et al., 2009). Our results showed a radio source coincident with the position of this pulsar, detected at both bands (see Figure 8 and Table 3), and the spectral index derived was . The steep radio spectral index of this known pulsar further strengthens the possibility that other very steep spectrum source may also be pulsars.
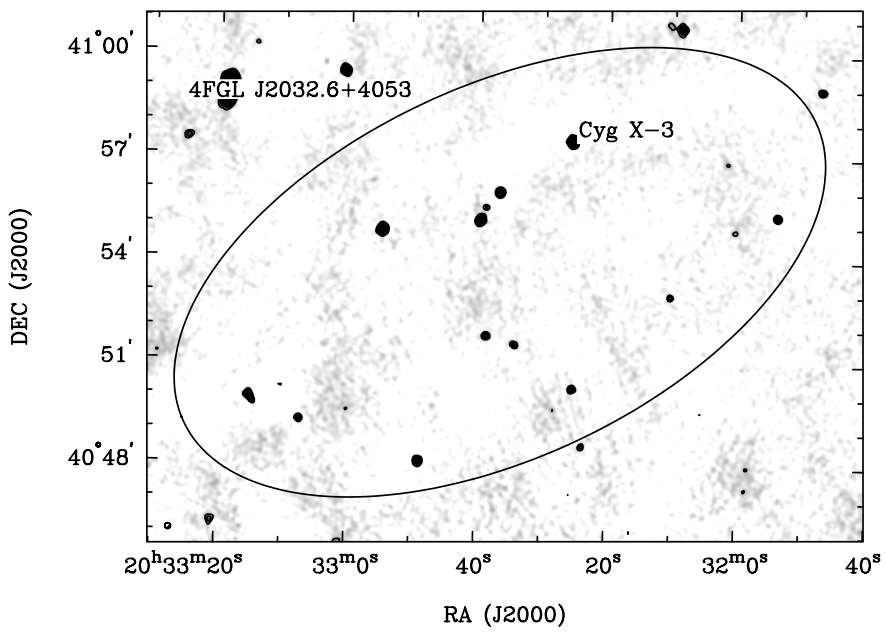
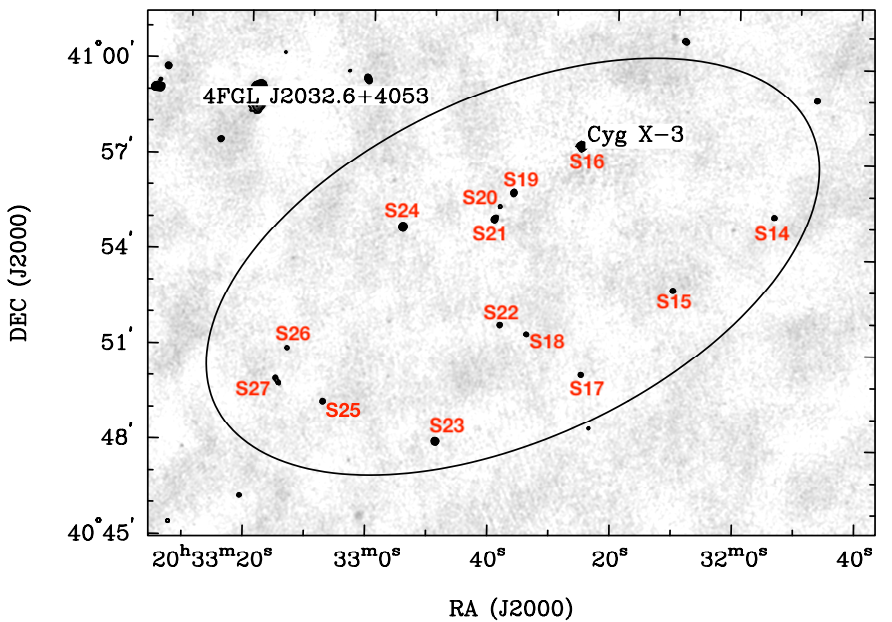
Fourteen radio sources, S14 to S27, were detected inside the ellipse of 4FGL J2032.64053, including one at the position of the micro-quasar Cyg X-3 (S16). Source S26 was only detected at 610 MHz (see Figure 9 and Table 3), and S27 is double. Spectral indices range from to .
The source 3FGL J2032.54032 overlaps six radio sources, detected at both bands with spectral indices between and (see Figure 10 and Table 3). Two of the radio sources, S32 and S33, are double.
The ellipse of 3FGL J2036.84234c was observed at 610 MHz, and contained no radio sources above a 3 value of 0.4 mJy beam-1.
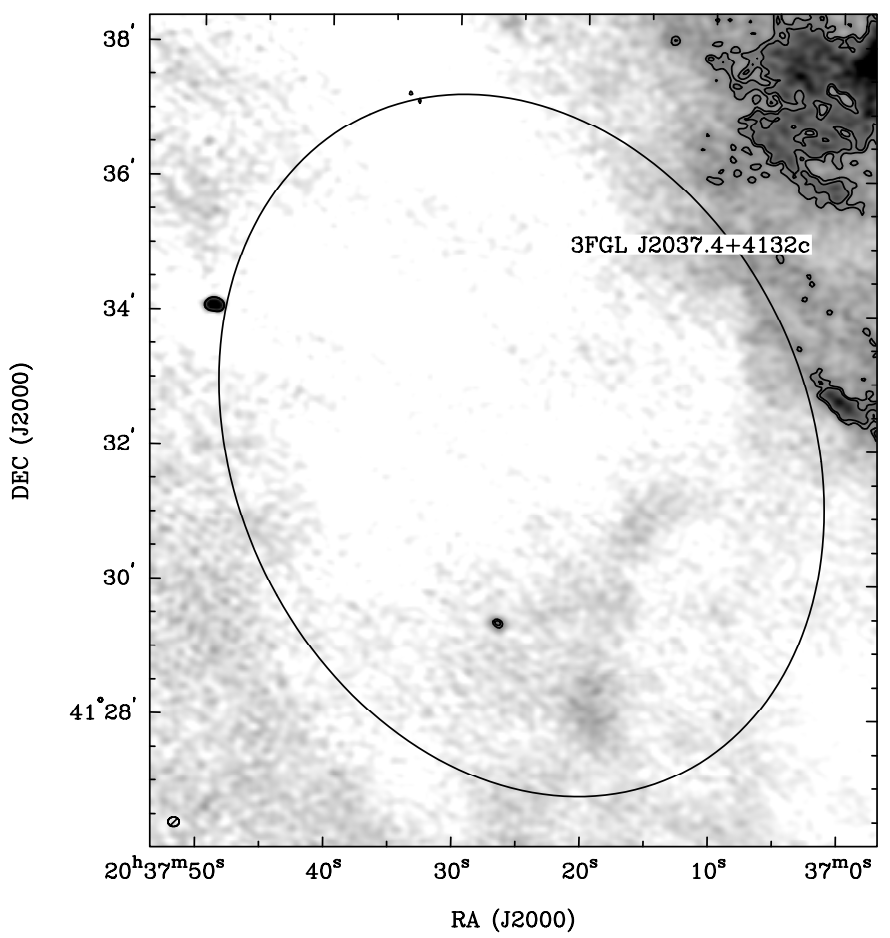
The sky area covered by 3FGL J2037.44132c contains one radio source, S34, barely detected at both bands due to diffuse emission present in the field (see Figure 11 and Table 3).
4FGL J2038.44212: only observed at 610 MHz, no radio sources above a 3 value of 0.6 mJy beam-1.
The observations at the 325 MHz band partly cover the ellipse of 3FGL J2039.44111, where we detected a radio source tagged as S35, and some extended emission towards the north-east (see Figure 12).
| Gamma-ray | Radio source | Spectral Index | Remarks | |||
|---|---|---|---|---|---|---|
| source | ||||||
| ID | (hh:mm:ss dd:mm:ss) | (mJy) | (mJy) | () | ||
| FGL J2018.14111 | S1 | 20:18:07.89 41:10:41.6 | 7.51.0 | 2.70.2 | ||
| 3FGL J2018.64213 | S2 | 20:18:02.70 42:06:52.6 | 28.51.0 | 15.5 0.2 | ||
| S3 * | 20:18:15.17 42:17:32.8 | 5.80.8 | 4.80.3 | double source | ||
| S4 * | 20:18:25.48 42:11:31.7 | 1.20.2 | ||||
| S5 * | 20:18:46.71 42:20:04.6 | 400100 | 2455 | partially extended | ||
| S6 * | 20:19:01.99 42:13:19.3 | 7.02.0 | 1.90.2 | |||
| S7 * | 20:19:17.81 42:11:07.1 | 1.30.2 | ||||
| S8 * | 20:19:18.53 42:12:42.2 | 537 | 19.52.0 | overlapping w/ S9? | ||
| S9 * | 20:19:22.06 42:12:32.4 | 786 | 222 | overlapping w/ S8? | ||
| 4FGL J2021.54026 | — | [0.5] | [0.5] | |||
| 4FGL J2023.44127 | S10 | 20:23:35.71 41:25:26.5 | 423 | 49.00.2 | ||
| 3FGL J2026.84003 | — | [0.6] | [1.0] | |||
| 3FGL J2028.54040c | S11 | 20:28:24.30 40:37:49.3 | 3479 | 1646 | double source | |
| S12 * | 20:28:54.10 40:44:07.8 | 1.10.5 | ||||
| 4FGL J2030.94416 | — | [0.9] | [0.2] | |||
| 4FGL J2032.24127 | S13 | 20:32:12.88 41:27:24.2 | 2.80.2 | 0.80.1 | #5 of Pa2007, PSR | |
| 4FGL J2032.64053 | S14 | 20:31:53.85 40:55:19.1 | 5.50.3 | 2.00.2 | ||
| S15 | 20:32:10.30 40:52:58.2 | 2.70.4 | 2.80.3 | |||
| S16 | 20:32:25.72 40:57:27.9 | 332 | 802 | Cyg X-3 | ||
| S17 | 20:32:25.10 40:50:15.7 | 4.70.4 | 2.00.2 | |||
| S18 | 20:32:34.22 40:51:30.1 | 3.70.3 | 1.80.1 | |||
| S19 | 20:32:36.69 40:55:58.2 | 11.00.4 | 5.10.2 | AGN-a (SS2008) | ||
| S20 * | 20:32:38.89 40:55:30.7 | 2.50.3 | 1.20.3 | AGN-b (SS2008) | ||
| S21 | 20:32:39.77 40:55:06.5 | 161 | 6.50.5 | AGN-c (SS2008) | ||
| S22 | 20:32:38.56 40:51:47.2 | 4.70.4 | 2.40.1 | |||
| S23 | 20:32:48.79 40:48:05.5 | 11.00.6 | 14.00.2 | |||
| S24 | 20:32:54.70 40:54:49.3 | 36.01.5 | 22.50.4 | |||
| S25 | 20:33:07.30 40:49:15.9 | 4.20.4 | 2.90.3 | |||
| S26 * | 20:33:13.31 40:50:56.4 | 1.60.2 | ||||
| S27 | 20:33:14.80 40:49:54.0 | 8.00.5 | 4.20.5 | double source | ||
| 3FGL J2032.54032 | S28 * | 20:32:08.40 40:37:54.5 | 2.80.4 | 1.90.1 | ||
| S29 | 20:32:29.53 40:38:50.2 | 401 | 37.30.5 | |||
| S30 * | 20:32:34.12 40:40:00.2 | 71 | 5.21.0 | partially extended | ||
| S31 | 20:32:45.47 40:39:38.2 | 28.60.5 | 39.70.3 | |||
| S32 | 20:32:52.33 40:28:24.0 | 452 | 201 | double source | ||
| S33 | 20:32:55.32 40:31:31.5 | 2254 | 1273 | double source | ||
| 3FGL J2036.84234c | — | [—] | [0.4] | |||
| 3FGL J2037.44132c | S34 | 20:37:26.61 41:29:24.9 | 8.01.5 | 5.01.5 | ||
| 4FGL J2038.44212 | — | [—] | [0.6] | |||
| 3FGL J2039.44111 | S35 * | 20:38:56.99 41:12:09.9 | 405 | [—] | ||
Note. — The asterisks after the ID indicate radio sources not catalogued in Benaglia et al. (2020b) in at least one band. Numbers in brackets are rms values, and [—] means not observed. Upper limits in flux density correspond to 3 measured locally. AGNa,b,c (SS2008): components of an AGN discovered by Sánchez-Sutil et al. (2008). Pa2007: Paredes et al. (2007). PSR = PSR J20324127 (pulsar).
For the gamma-ray sources within which no radio source was detected, we provide in Table 3 the average rms at each observing band.
4.2 Radio emission related to other gamma-ray sources
| Gamma-ray | Radio source | Spectral Index | Remarks | |||
|---|---|---|---|---|---|---|
| source | ||||||
| ID | (hh:mm:ss dd:mm:ss) | (mJy) | (mJy) | () | ||
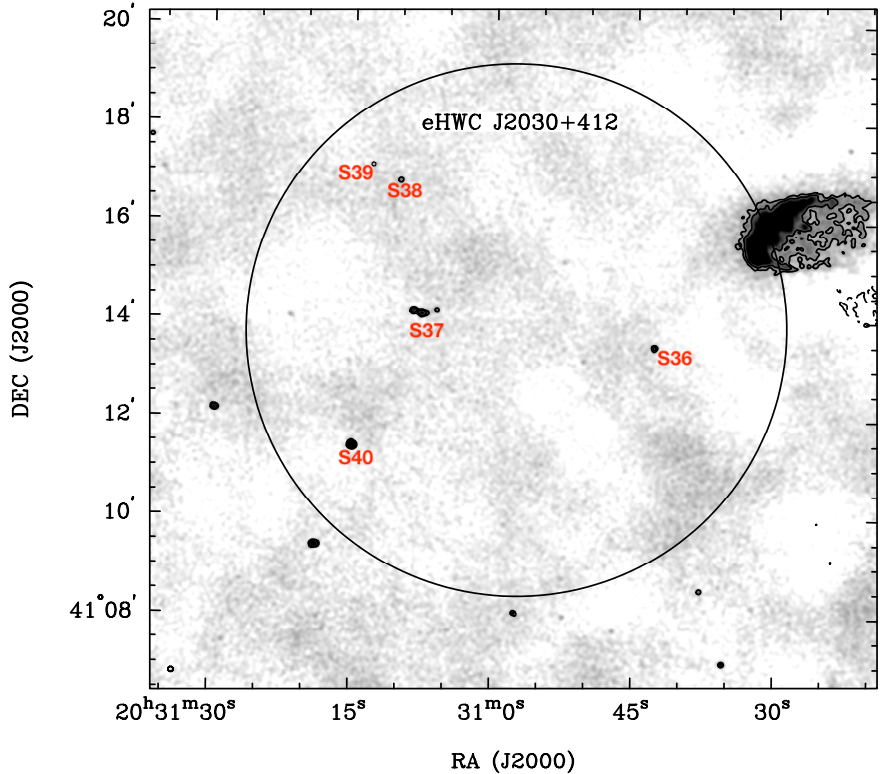
| eHWC J2030+412 | S36 * | 20:30:42.92 41:13:28.1 | 2.50.2 | 1.70.4 | ||
| S37 | 20:31:07.66 41:14:07.3 | 7.00.3 | 5.40.3 | Ma2007, triple source | ||
| S38 * | 20:31:10.16 41:16:48.9 | 1.50.1 | 1.10.1 | |||
| S39 * | 20:31:12.93 41:17:07.3 | 1.40.2 | 0.50.1 | Ma2007 | ||
| S40 | 20:31:14.93 41:11:25.7 | 5.10.5 | 6.40.2 | Ma2007 | ||
| 4FGL J2028.64110e | S41 * | 20:31:09.70 42:30:24.6 | 5.91.0 | 1.90.2 | ||
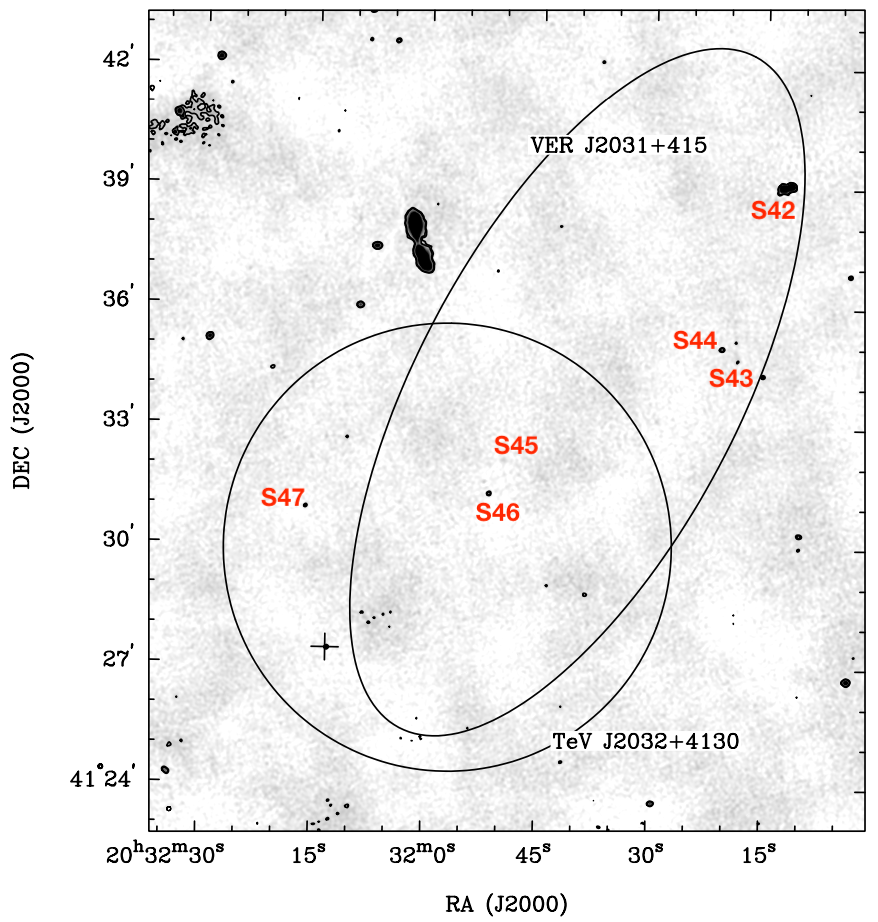
| VER J2031415 | S42 | 20:31:12.37 41:39:03.9 | 84.72.0 | 40.02.0 | Ma2007, double source | |
| S43 * | 20:31:18.83 41:34:43.9 | 1.90.3 | 0.60.2 | Ma2007 | ||
| S44 * | 20:31:20.71 41:34:59.3 | 1.00.2 | 1.00.2 | Ma2007 | ||
| TeV J2032+4130 | S45 * | 20:31:49.69 41:32:08.9 | 1.40.4 | 0.40.1 | #2 of Pa2007 | |
| S46 * | 20:31:51.59 41:31:18.6 | 2.10.2 | 0.80.1 | #3 of Pa2007 | ||
| S47 * | 20:32:16.06 41:30:56.0 | 0.80.2 | 0.60.1 | #6 of Pa2007 | ||
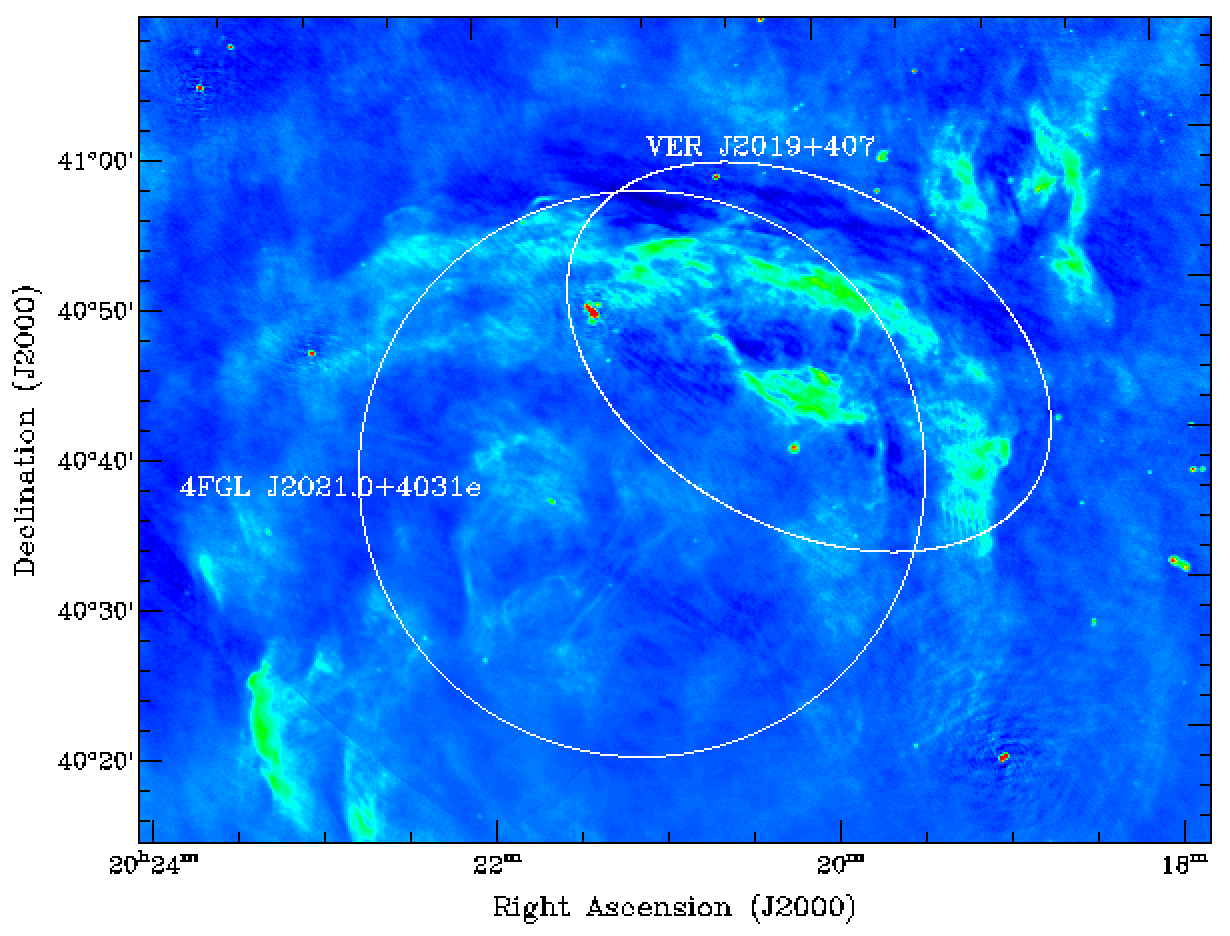
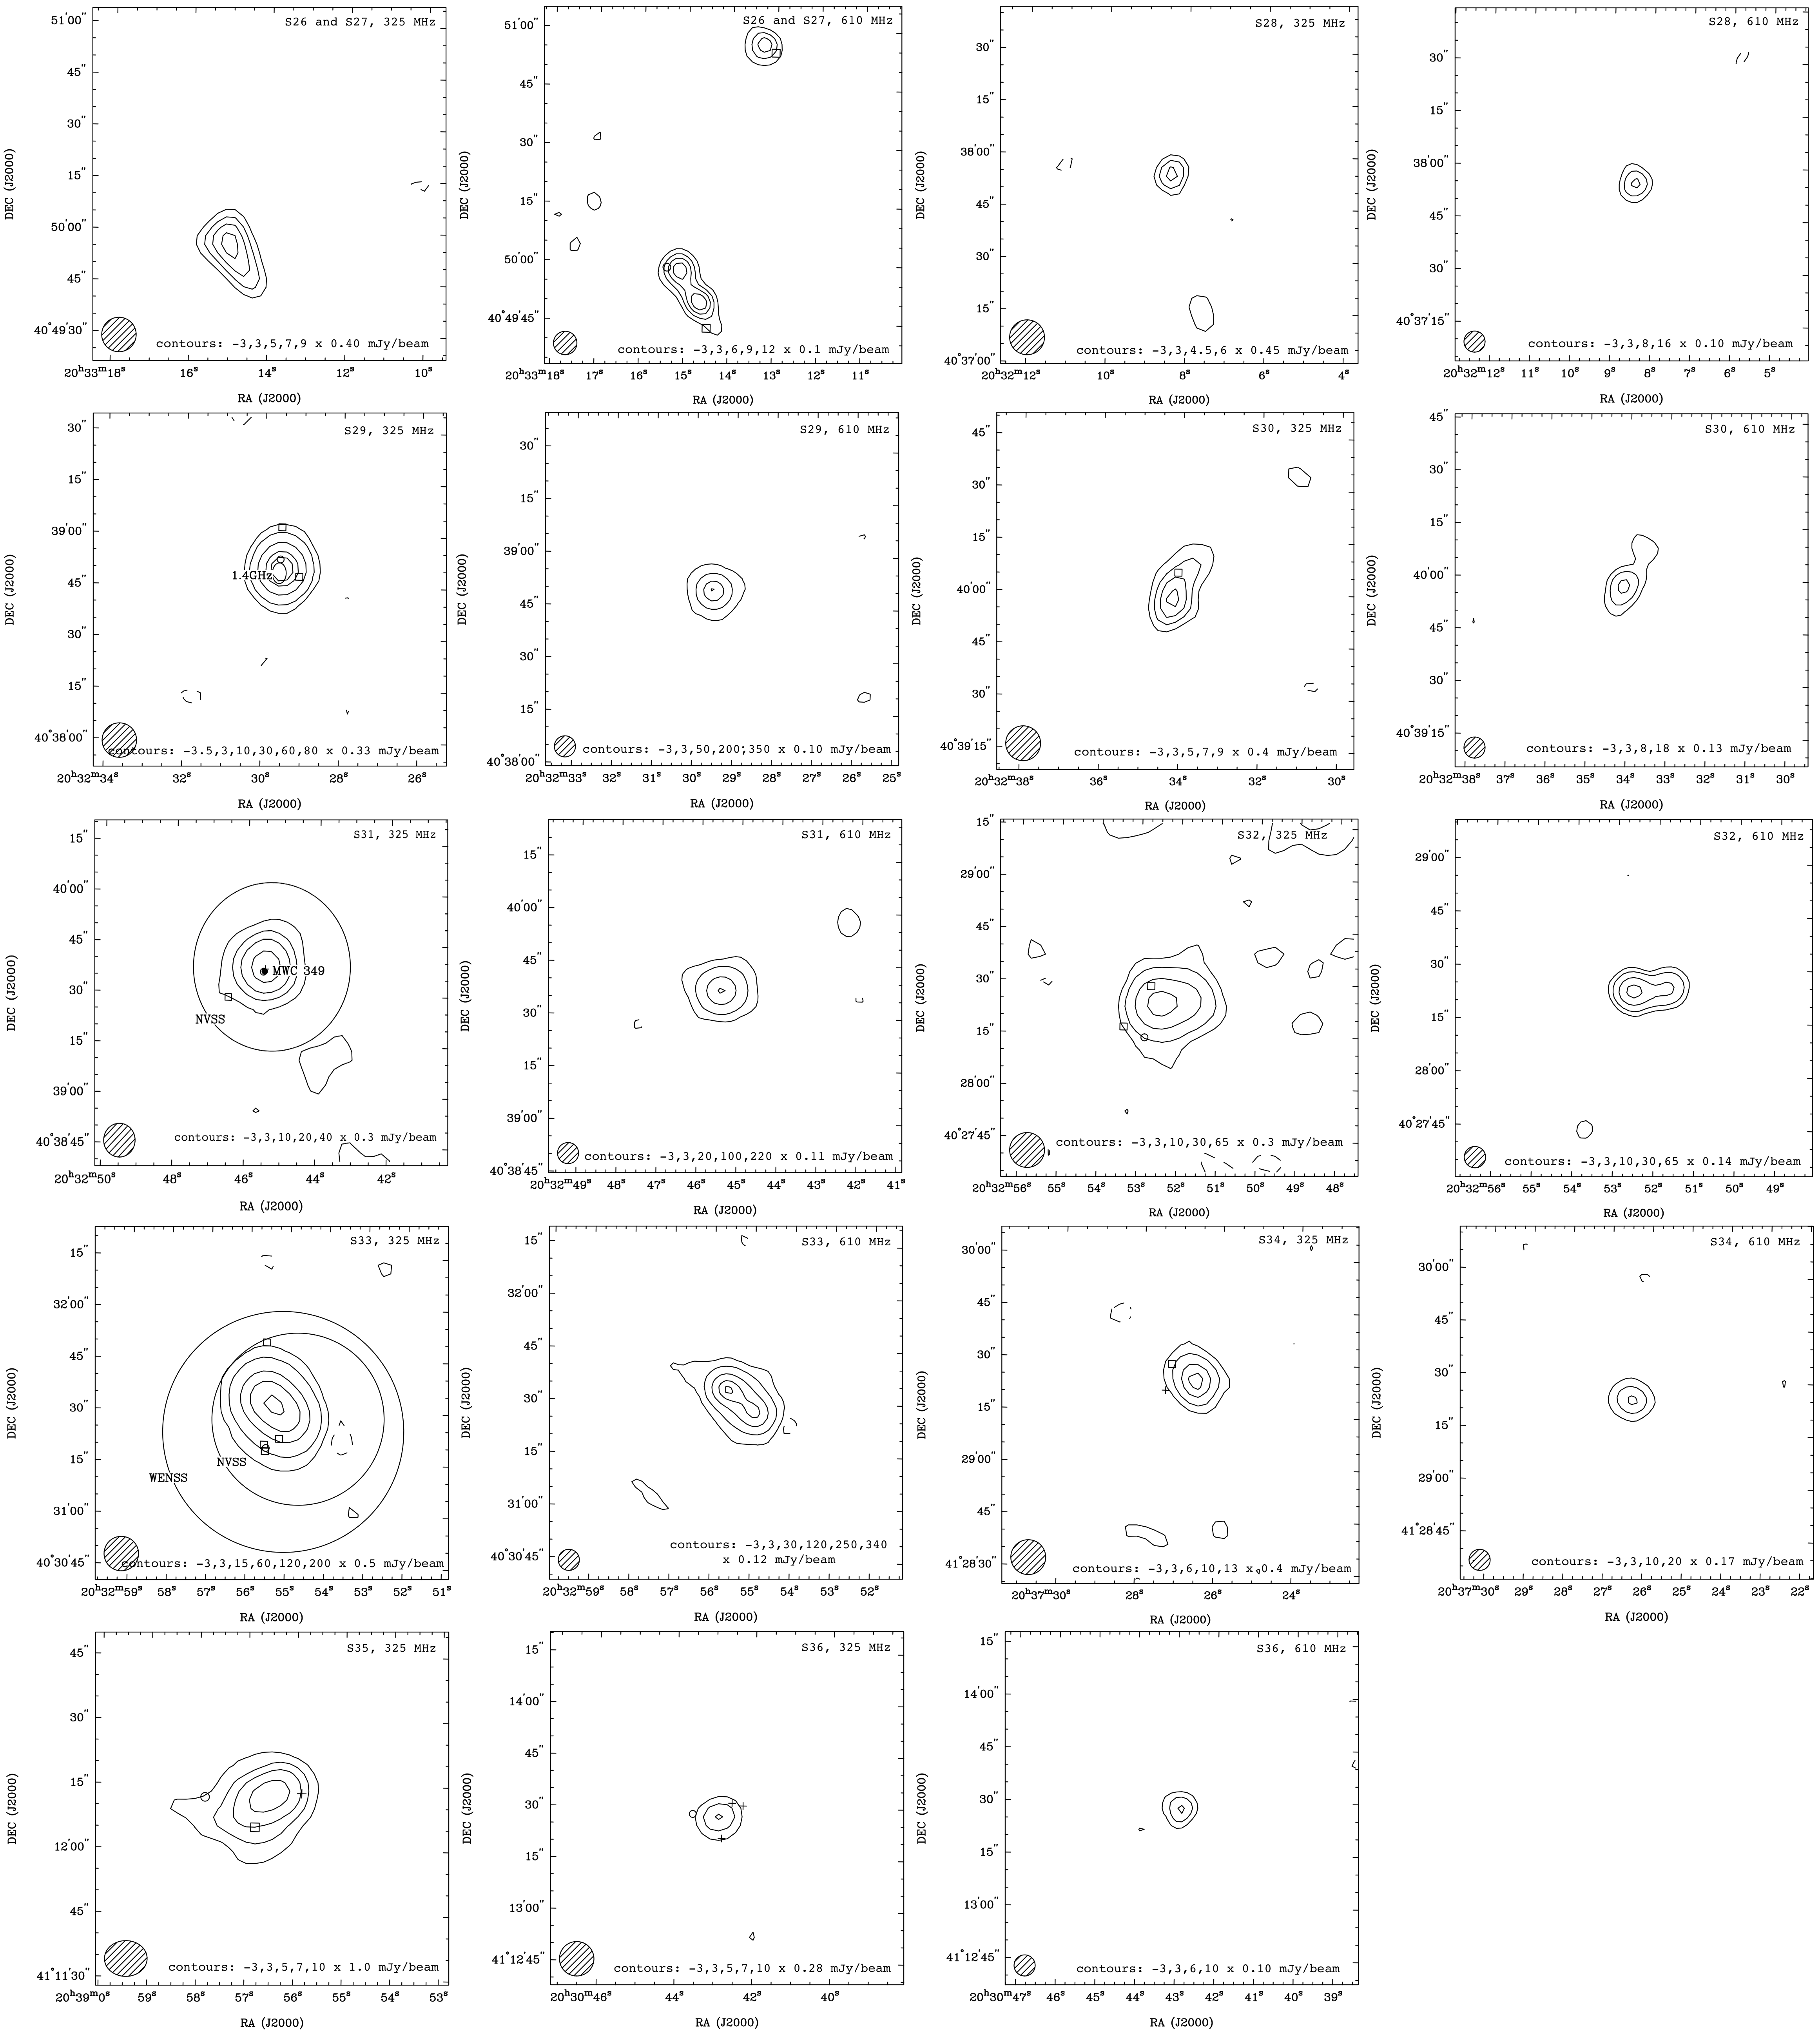
4FGL J2021.04031e is an extended source associated with the supernova remnant Gamma-Cygni (SNR G78.22.1). Very recently, the MAGIC Collaboration et al. (2020) studied its energy spectrum and morphology by means of dedicated TeV observations with the MAGIC Imaging Atmospheric Cherenkov telescopes. VERITAS reported the discovery of an extended, unidentified source of VHE gamma rays, VER J2019407, lying along the northwestern shell of SNR G78.22.1 (Aliu et al., 2013). Enhanced radio emission in this part of the SNR has also been observed at different frequencies, resolutions and sensitivities (Ladouceur & Pineault, 2008, and references therein). Our results at 325 MHz also show clearly this enhanced emission but with a good sensitivity and resolution (Fig. 13), despite for 4FGL J2021.04031e we found no discrete radio sources in a central region of 0.1 deg in size. A detailed study of the SNR G78.22.1 is foreseen and deserves its publication in a future paper, together with the radio sources in this extended field.
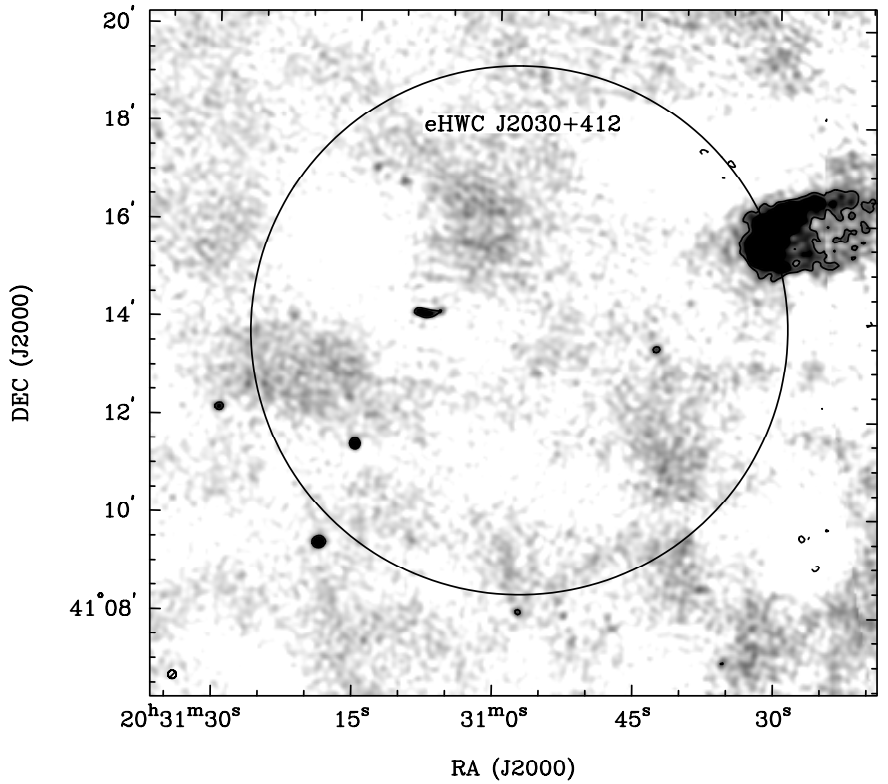
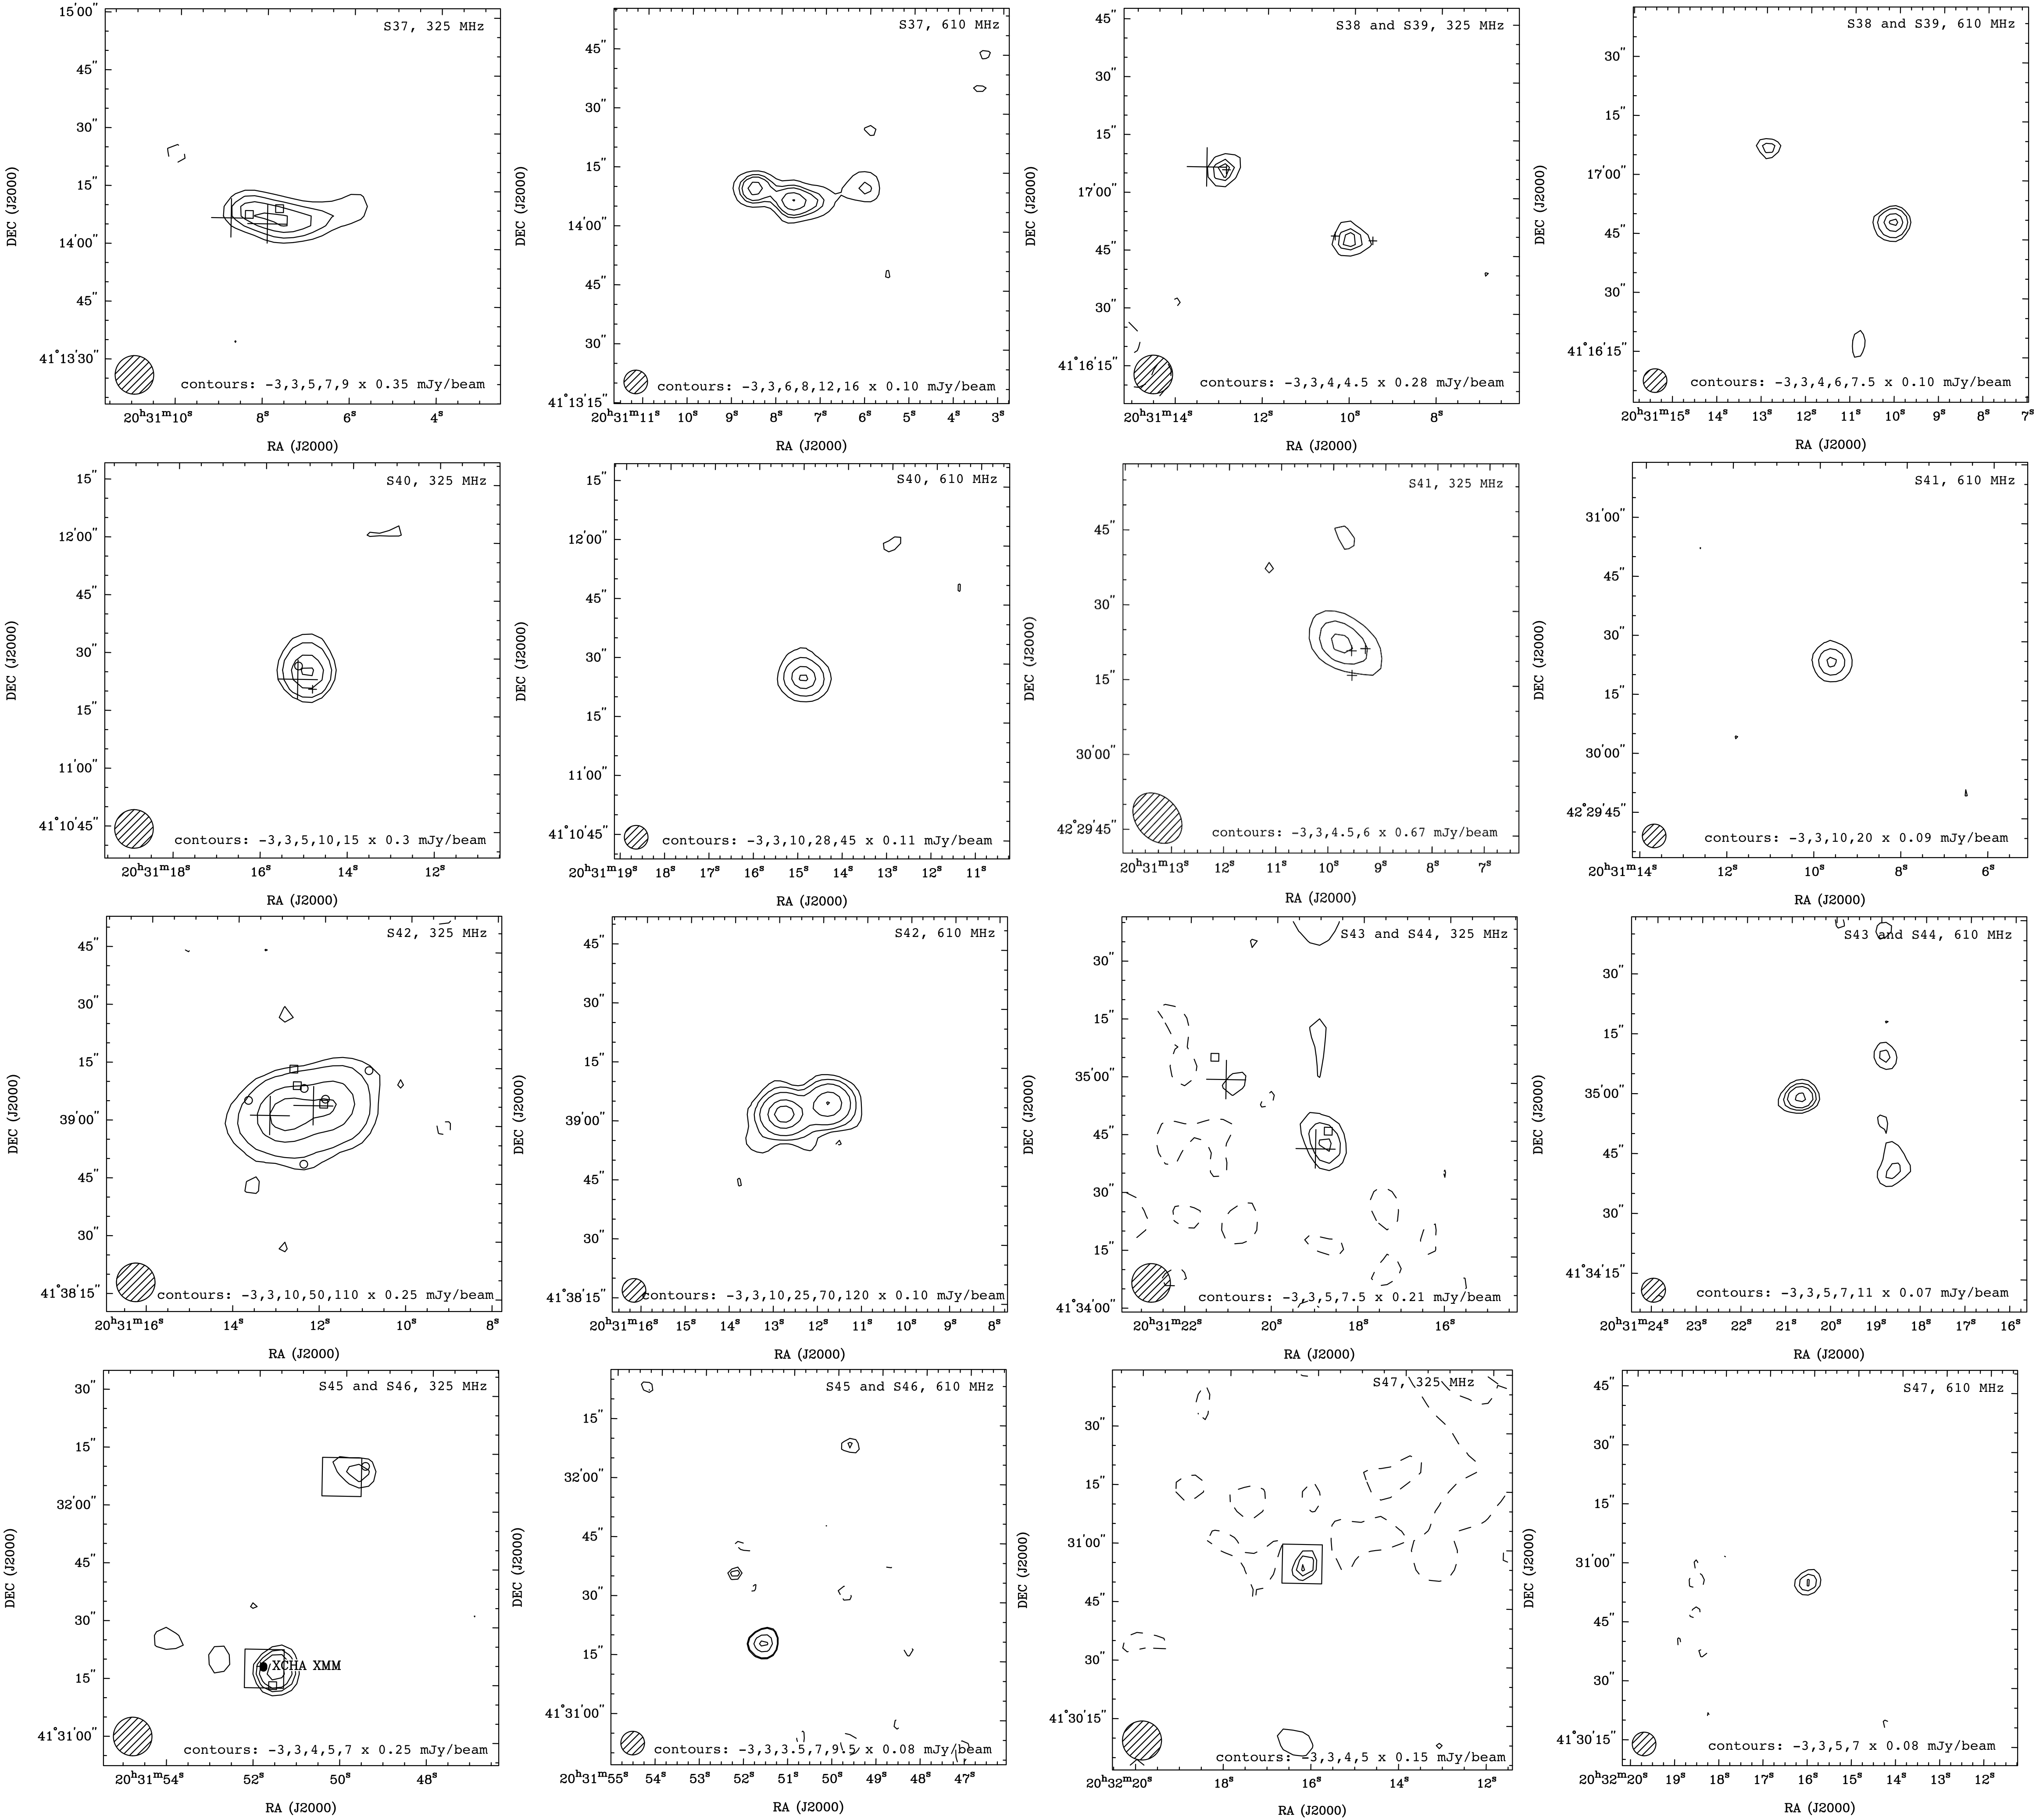
We report five radio sources at both observing bands inside the circle that represents eHWC J2030+412. One of them, S37, is resolved at 610 MHz. We derive the flux density values at both observing bands by measuring the emission above the 3 contour (see Table 4 and Fig. 14).
4FGL J2028.6+4110e is a very extended gamma-ray source associated with the Cygnus Cocoon, MGRO J2031+41 and TeV J2032+4130. Due to its extension, we have not done a detailed study of the many sources in the area. A list of the sources detected at radio with more than 7 can be found in the catalog of Benaglia et al. (2020b). Here we only show a radio source at the very center of the Fermi source, S41, with very steep radio spectra (see Table 4), that turns it a strong candidate for pulsar.
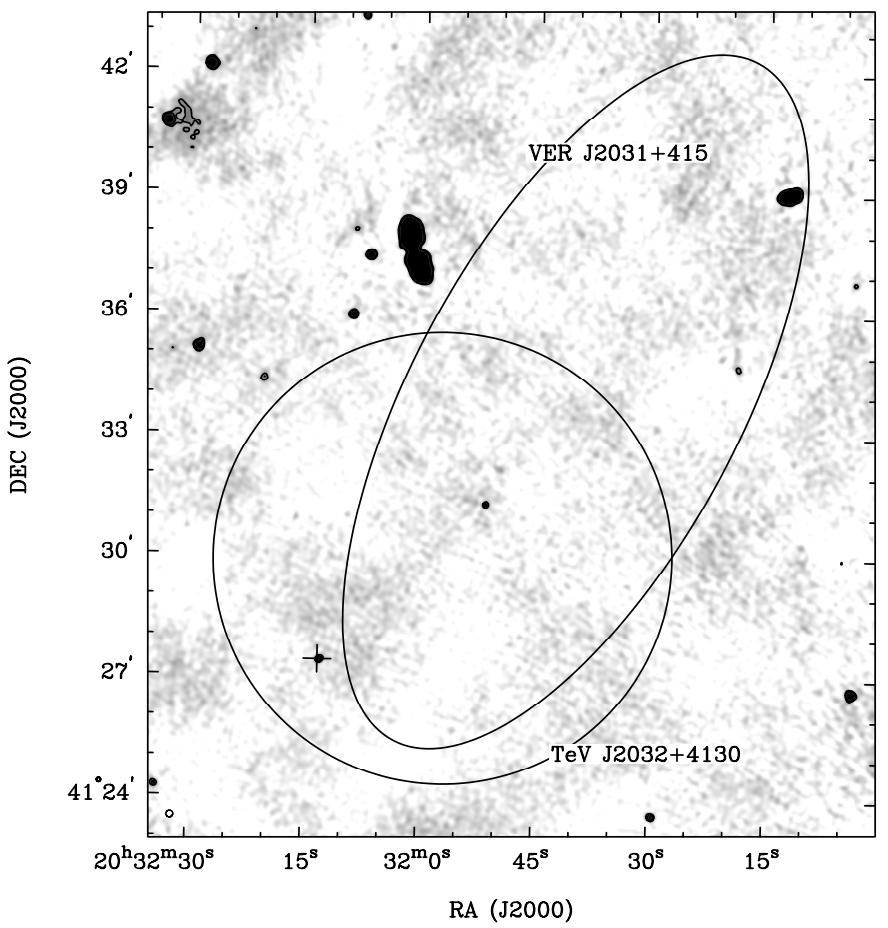
TeV J20324130 was detected by HEGRA (Aharonian et al., 2002, 2005), and that was the first source discovered of a population of extended TeV sources without low-frequency counterparts. The discovery was later confirmed by MAGIC (Albert et al., 2008) and VERITAS (Aliu et al., 2014), as source VER J2031+415. The pulsar PSR J20324127, detected by Fermi (4FGL J2032.2+4127), and S13 here, is within the field of TeV J20324130. The area had been observed with the GMRT at 610 MHz by Paredes et al. (2007). Apart from the detection of PSR J20324127 at 325 and 610 MHz, we have detected other sources (see Table 4 and Fig. 15) in the areas limited by the HEGRA, MAGIC and VERITAS; one is double (S42). Maybe one of them could contribute additionally to the emission of this extended gamma-ray source because it is not clear if the pulsar alone can be responsible of the full emission.
5 Counterparts at other spectral ranges
In order to obtain additional information from the radio sources, we searched several large catalogs in the literature. These are listed in Table 5 and offer results collected with instruments working from radio to X-ray bands. Regarding the search of radio counterparts on catalogs of massive, early-type stars, involving the same observations and images used here, see Benaglia et al. (2020a).
In the case of the 2MASS, WISE and Spitzer-SSCSL lists (Cutri et al., 2003; Cutri & al., 2012; Capak et al., 2013), we found that a wealth of objects permeate the fields of the radio sources S1 to S47, and in the vast majority of the cases, their nature is not determined. Since the objects bright at infrared are usually thermal emitters, and we are interested here on non-thermal sources, we considered the 2MASS, WISE and SSCSL sources that overlap the radio sources only in the cases for which the nature of the IR source was known.
| ID | Name | Reference | Associated symbola |
|---|---|---|---|
| C1 | TGSS Alternative Data Release | Intema et al. (2017) | -side square |
| C2 | The Westerbork Northern Sky Survey | Rengelink et al. (1997) | -radius circle |
| C3 | Small-diameter radio sources catalogue | Zoonematkermani et al. (1990) | ellipse |
| C4 | NRAO VLA Sky Survey | Condon et al. (1998) | -radius circle |
| C5 | The MIT-Green Bank 5GHz Survey | Bennett et al. (1986) | |
| C6 | 87GB Catalog of radio sources | Gregory & Condon (1991) | ellipse |
| C7 | 2MASS All-Sky Catalog of Point Sources | Cutri et al. (2003) | small square |
| C8 | Spitzer Science Center Source List | Capak et al. (2013) | small cross |
| C9 | WISE All-Sky Data Release | Cutri & al. (2012) | small circle |
| C10 | 3XMM-Newton Serendipitous Source Catalogue-DR6 | XMM-SSC, 2016 | small filled circle |
| C11 | CHANDRA ACIS Survey of X-Ray Point Sources | Wang et al. (2016) | small filled circle |
| C12 | ATNF Pulsar Catalog | Manchester et al. (2005) |
| Source | Object name | Cataloga | Type | Other reference |
|---|---|---|---|---|
| S5 | NVSS J201847+422010 | C1,C2,C4 | radio source | |
| S10 | WISEA J202335.82+412523.5 | C9 | YSO | Kryukova et al. (2014) |
| S11 | NVSS J202824+403751 | C1,C2,C4 | radio source | Wendker et al. (1991) |
| S13 | PSR J20324127 | C10,C11,C12 | pulsar | Abdo et al. (2009) |
| S16 | Cyg X-3 | C3,C4,C6,C10,C11 | HMXB | Sánchez-Sutil et al. (2008) |
| S19 | 2XMM J203237.5+405557 | C10 | X-ray source | |
| S23 | CXOGSG J203248.8+404804 | C11 | X-ray source | |
| S27 | 2MASS J203314894049096 | C7 | star | |
| S29 | G079.602+0.506 | C3 | radio source | Wendker et al. (1991) |
| S31 | MWC 349 | C3,C4 | OB star(s) | Cohen et al. (1985) |
| S33 | NVSS J203254+403128 | C2,C4 | radio source | Wendker et al. (1991) |
| S46 | XMM J203151.8413118 | C10,C11 | X-ray source |
Note. — a: We included sources of C7, C8 and C9 only if their nature is known.
Table 6 summarizes the results of the search for counterparts in the mentioned catalogs, to the radio sources S1 to S47.
The individual figures of the radio sources S1 to S47 (Sect. Appendix) show the positions of the counterparts found as well. The membership of the counterparts to a given catalog are shown with labels: C1 with “TGSS”, C2 with “WENSS”, C3 with “1.4GHz”, C4 with “NVSS”, C6 with “87GHz”, C10 with “XMM”, and C11 with “XCHA”. C7 sources are represented with small boxes, C8 sources with small crosses and C9 sources with small circles.
We also compared the radio sources detected here with those listed in Benaglia et al. (2020b), a catalog of 3800 sources at the same Cygnus region carried out with the Giant Metrewave Radio Telescope at 325 and 610 MHz. The article provides the list of sources detected in the SPAM-generated mosaics (see Section 3), with integrated flux densities above 7 (local rms). Radio sources with an asterisk in Table 3 are presented, at least at one band, here for the first time.
6 Discussion
6.1 On the catalogs search results
At the position of S5 lies the known sources NVSS J201847422010, WENSS B2017.04210 and TGSS J201846.6422010. Their integrated flux densities, at 1400, 325, and 150 MHz, are , and mJy (see Fig. 17 and corresponding symbols according to Table 5). The Gaussian fit to S5 with our GMRT data resulted in a discrete source, among errors. Regardless the different angular resolutions used in the various measurements collected, S5 clearly stands as a non-thermal source with a spectral index close to , if the flux values at 325 MHz are averaged.
Kryukova et al. (2014) reported a Young Stellar Object (J202335.81412523.53) at the location of S10. It showed a spectral index of . Although there are studies of such objects and related types that predict, under certain conditions, gamma-ray emission from them, this is expected for those characterized by non-thermal spectral indices (see, for instance, Bosch-Ramon et al., 2010). Thus, we do not expect high-energy contribution from this source (Fig. 17).
S11 is another source with radio counterparts, as NVSS J202824+403751, WENSS B2026.6+4027 and TGSS J202824.3+403749; the integrated flux densities are , and mJy, respectively (see Fig. 17). Wendker et al. (1991) reported at the same position the source 19P06, with a flux at 1400 MHz of mJy, and Taylor et al. (1996), at 327 MHz, WSRT 20264027 with mJy. A mean spectral index of is obtained considering all measurements.
S13 is associated with the gamma-ray pulsar PSR J20324127. This source was first detected, with a flux density of 0.70.2 mJy, in a search of radio sources carried out by GMRT at 610 MHz in the field of the unidentified gamma-ray source TeV J2032+4130 (Paredes et al., 2007), measurement in full agreement with the flux reported here. XMM J203213.2412723 (C10) and CHA J203213.1412722 (C11) are other overlapping sources (see Fig. 18). The object, a binary system composed by a pulsar and a Be star, has been widely studied (see for instance Chernyakova et al., 2019, and references therein), and is listed in the 4FGL catalog as the counterpart to Fermi source 4FGL J2032.24127. S13 is the only radio source detected by us in the Fermi ellipse. The spectral index derived here fits well for what is expected for pulsars.
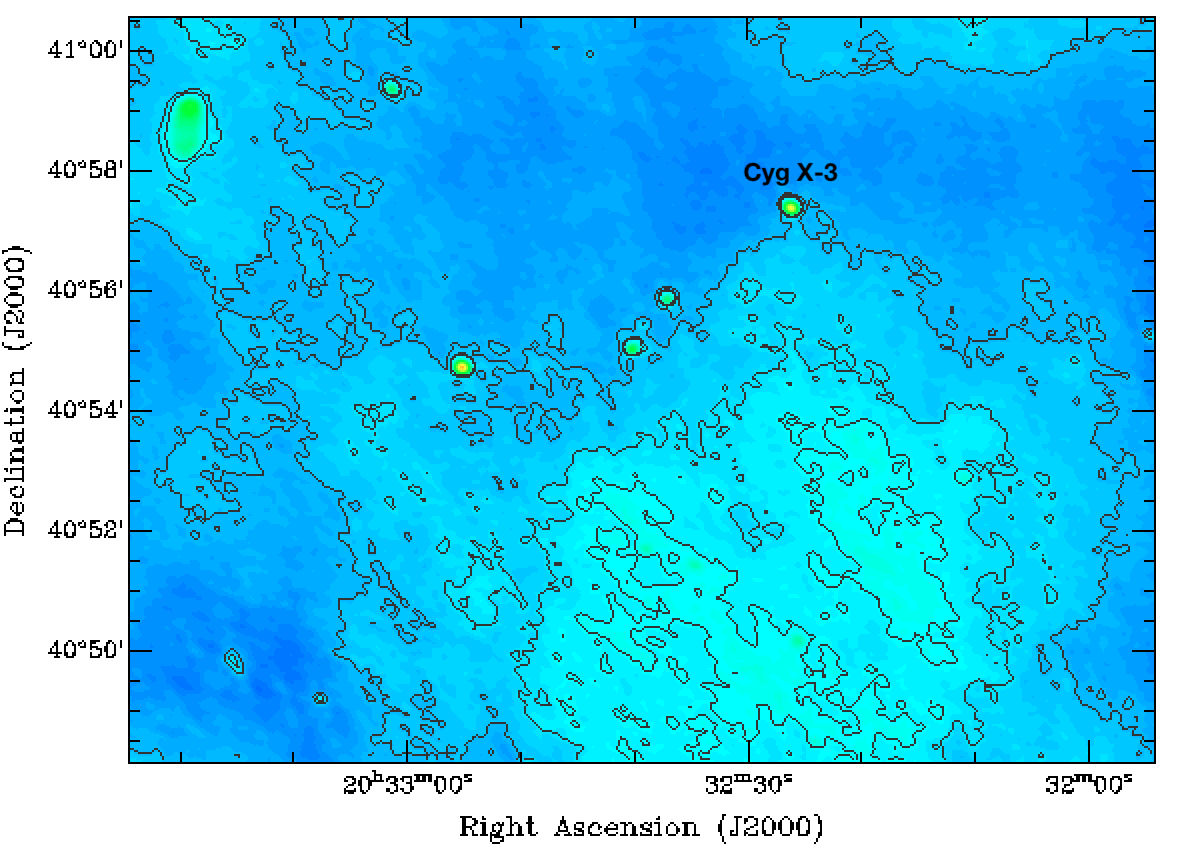
The source S16 agrees with the coordinates of the micro-quasar/High Mass X-ray Binary Cyg X-3, also a well known system, and associated with the source 4FGL J2032.64053. But contrary to the previous case, S16 is just one of the fourteen radio sources detected in the area of the Fermi source (see Fig. 18). Sánchez-Sutil et al. (2008) studied radio emission around this object at 2 and 6 cm, finding and extended diffuse radio structure south to Cyg X-3, and suggesting non-thermal emission. Our image at 325 MHz of the same area, built with a robust weighting of 0.0, showed such feature (see Fig. 16). At the position of S16, the catalog search yielded radio sources at 1.4 GHz (NVSS J203225405728 of C4; G079.8460.700 of C3), and at 87 GHz (J203037.0404726, C6), five C10 sources and one C11 source (symbols as per Table 5).
Two X-ray sources are positionally coincident with S19 (XMM J203236.1405603 and XMM J203237.5405558). Sources S19, 20 and 21 have been identified by Sánchez-Sutil et al. (2008) as parts of an AGN. The spectral indices derived here confirm that result.
S23 is another radio source with an X-ray counterpart, CXOGSG J203248.8404804, detected by means of CHANDRA observations.
A star identified as 2MASS J20331489404804 is reported at the location of S27.
The radio source S29 shows a counterpart detected with the VLA at 1.4 GHz, G079.6020.506 (C3), and also overlaps the source 19P18 (Wendker et al., 1991).
S31 is identified with the source MWC 349, proposed to be an OB+OB system. It is also listed as a C4 source (NVSS J203245403938). The radio spectrum of this stellar system is analyzed in Benaglia et al. (2020a) (see references therein).
At the position of S33 there are NVSS J203254+403128 (flux density of mJy), and WENSS B2031.1+4021 (integrated flux of 102 mJy) sources, and Wendker et al. (1991) reported the source 19P22. The global spectral index remains negative.
In the case of S37, we found a source at 610 MHz resolved in three components. Previous work on this area was carried out by Martí et al. (2007) (see Fig. 20 of the Appendix). The authors discovered, with the GMRT at the same frequency band, two sources at the position of S37, with coordinates in agreement between error bars with the two brighter maxima of S37. They reported flux densities of mJy, and mJy. We measure a slightly larger flux above the 3 contour corresponding to the position of the 2007 sources: 4.30.1 mJy, although two of the S27 maxima correspond to the detection by Martí et al. (2007).
S39, S40, S42, S43 and S44 were discovered by Martí et al. (2007) at 610 MHz, with flux densities of 0.530.11, 3.560.11, (12.0615.51)0.11, 0.570.11 mJy and 0.970.11, respectively. Except in the case of S40, their values for the point sources agree very well with those reported here.
The source S42 was also detected by Taylor et al. (1996) as J20294129, with a flux density of 513 mJy (Fig. 20).
S46 was detected at X-rays (XMM J203151.8+413118 of C10, and CHA J203151.8+413119 of C11, Fig. 20).
Paredes et al. (2007) reported the detection at 610 MHz of S45, S46 and S47, with flux densities of 0.500.16, 1.750.19 mJy and 0.770.18 mJy. The values for S45 and S47 are coincident with ours. For S46, the flux seems to have drop to a half in the decade between the two observations (2006–2016) and the spectral index is now more steeper () than before (), although in both cases is non-thermal. The difference between the flux densities of S40 and S46 can be ascribed to some kind of variability, a common phenomenon in this type of MHz sources, and could explain the different spectral indices found.
6.2 Radio sources with steep spectral indices
Among the 47 radio sources, there is a group that shows very negative values. Such steep spectral indices are usually associated with pulsars. Bates et al. (2013) performed a detailed study on the spectral distribution of this type of sources. They analyzed the spectral indices of 1300 pulsars at the radio range, and combined techniques of population synthesis and likelihood analyses to find the spectral index distribution. They modeled the survey results with a Gaussian function in spectral index distribution with the mean at .
Later on, Frail et al. (2016, 2018) devised a method to pinpoint pulsar candidates, taking into account the spectral index and the compactness of radio sources at low radio frequencies. The authors defined as the flux density over the peak brightness of the radio source. They studied TGSS-ADR1 together with NVSS sources, and showed that in the plane, the distribution for typical radio sources differed significantly from that of pulsars (see their Figure 1). The mean spectral index resulted in for the first group, and in the case of pulsars (see also Intema et al., 2017). Pulsar (candidates) share the extreme index values with luminous high-redshift galaxies (Frail et al., 2016), although it is not expected to receive VHE gamma-rays from the latter because absorption (Biteau & Williams, 2015). Frail et al. (2018) characterized promising pulsar candidates as having both and . The method was applied to TGSS-ADR1 and NVSS sources in the error ellipses of Fermi LAT UNIDs of 3FGL. Out of sixteen pulsar candidates identified, with follow-up continuum observations and timing, they found six ms pulsars and one normal pulsar. They considered that propagation effects through the ISM for instance, could prevent the pulsars to pop up during periodicity searches. The pulsed radio beams can even point off the line of sight (Camilo et al., 2012).
Table 7 contains eleven sources with , being one of them S13, the known pulsar PSR 20324127 that is associated to 4FGL J2032.2+4127. Regarding their compact factor, in nine out of the eleven cases it remains lower or close to 1.5, another feature in common with known pulsars. And two radio sources, S8 and S9, have very steep spectral indices with larger compact factors, and the overall morphology resembles an AGN-like double source; all points to an extragalactic origin.
Leaving aside the resolved sources S8 and S9, the radio sources of Table 7 overlap infrared sources, that need to be studied as possible stars related to a pulsar. Their radio fluxes measured in this work are of the same order as those reported by Frail et al. (2016). None of them presented a 1.4 GHz counterpart (catalog C3).
According to Acero et al. (2015), a Fermi source with variability index greater than 73 is considered as probably variable. The last column of Table 1 shows that the variability indices of the Fermi sources for which the steepest spectral indices were measured, are below the value mentioned above. On the contrary, for the two Fermi sources showing values larger than 73, either we did not detect radio counterparts (4FGL J2021.54026) or the detected ones showed spectral indices (3FGL J2032.54032), thus no pulsar candidates.
Finally, it is worth noticing that there are seven sources in Tables 3 and 4 showing spectral indices between and . Three correspond to a previously proposed AGN (S19, S20, S21, Sánchez-Sutil et al., 2008). Another three show flux densities between 20 and 350 mJy: S11, S32 and S42. Taking into account the spectral index errors involved, the remaining, S17, might be also included in the pulsar candidates group.
| HE/VHE source | ID | -factora | |
|---|---|---|---|
| FGL J2018.14111 | S1 | 1.7 | |
| 3FGL J2018.64213 | S6 | 1.1 | |
| S8 | 3.4 | ||
| S9 | 4.9 | ||
| 4FGL J2032.24127 | S13 | 1.0 | |
| 4FGL J2032.64053 | S14 | 1.2 | |
| eHWC J2030412 | S39 | 1.1 | |
| 4FGL J2028.64110e | S41 | 1.0 | |
| VER J2031415 | S43 | 1.1 | |
| TeV J20324130 | S45 | 1.5 | |
| S46 | 1.1 |
Note. — a: At the observed band at which is lower. The C factor of S8 and S9 is not lower than 1.5, which is a requirement for pulsar candidate (Frail et al., 2016).
7 Conclusions
We have performed wide area two frequency radio observations of the rich Cygnus region with the GMRT. There are several HE/VHE sources with counterparts not known in this region and we searched for radio sources in the error ellipses of them to look for counterparts. We found several interesting radio sources within the error circle of the HE/VHE sources. The main conclusions are the following:
-
•
In the error ellipses of 8 HE/VHE sources we detected 11 radio sources with very steep spectral index (). Nine of them have a C-factor , indicating that are pulsar candidates.
-
•
Two sources, S40 and S46, show variability when compared to previous GMRT data at 610 MHz. Other sources (8), of which previous arcsec-resolution data were available, are steady whereas in 37 cases there is no previous data to compare.
-
•
We have obtained a 325 MHz image of the supernova remnant Gamma-Cygni (G78.2+2.1) which contain 4FGL J2021.0+4031e and VER J2019+407. In a central region of 0.1 deg in size of 4FGLJ2021.0+4031e we found no discrete radio sources.
-
•
No radio sources were detected above 2 mJy level for 4FGL J2021.54026, 3FGL J2026.84003, 4FGL J2030.94416, 3FGL J2036.84234c and 4FGL J2038.4+4212. A radio source at 325 MHz was detected in the error ellipse of 3FGL J2039.44111.
The detection of radio sources with characteristics of pulsar candidates prompts for further investigation to confirm their nature, and from then on, to describe the extent to which they can contribute to the (very) high-energy sources. A follow-up study on timing of such sources with the Very Large Array, GMRT or VLBI facilities is needed to verify its nature. As quote Frail et al. (2016), such very high angular resolution is needed to discriminate resolved luminous high-redshift galaxies from unresolved pulsars.
Figures of the radio sources S1 to S47
The ID of the radio source, the imaged band, and the contour levels with its unit are shown in each sub-figure.
References
- Abdo et al. (2009) Abdo, A. A., Allen, B. T., Aune, T., et al. 2009, ApJ, 700, L127, doi: 10.1088/0004-637X/700/2/L127
- Abdollahi et al. (2020) Abdollahi, S., Acero, F., Ackermann, M., et al. 2020, ApJS, 247, 33, doi: 10.3847/1538-4365/ab6bcb
- Abeysekara et al. (2018) Abeysekara, A. U., Archer, A., Aune, T., et al. 2018, ApJ, 861, 134, doi: 10.3847/1538-4357/aac4a2
- Abeysekara et al. (2020) Abeysekara, A. U., Albert, A., Alfaro, R., et al. 2020, Phys. Rev. Lett., 124, 021102, doi: 10.1103/PhysRevLett.124.021102
- Acero et al. (2015) Acero, F., Ackermann, M., Ajello, M., et al. 2015, ApJS, 218, 23, doi: 10.1088/0067-0049/218/2/23
- Aharonian et al. (2002) Aharonian, F., Akhperjanian, A., Beilicke, M., et al. 2002, A&A, 393, L37, doi: 10.1051/0004-6361:20021171
- Aharonian et al. (2005) —. 2005, A&A, 431, 197, doi: 10.1051/0004-6361:20041552
- Albert et al. (2008) Albert, J., Aliu, E., Anderhub, H., et al. 2008, ApJ, 675, L25, doi: 10.1086/529520
- Aliu et al. (2013) Aliu, E., Archambault, S., Arlen, T., et al. 2013, ApJ, 770, 93, doi: 10.1088/0004-637X/770/2/93
- Aliu et al. (2014) Aliu, E., Aune, T., Behera, B., et al. 2014, ApJ, 783, 16, doi: 10.1088/0004-637X/783/1/16
- Bartoli et al. (2014) Bartoli, B., Bernardini, P., Bi, X. J., et al. 2014, ApJ, 790, 152, doi: 10.1088/0004-637X/790/2/152
- Bates et al. (2013) Bates, S. D., Lorimer, D. R., & Verbiest, J. P. W. 2013, MNRAS, 431, 1352, doi: 10.1093/mnras/stt257
- Bednarek & Bartosik (2003) Bednarek, W., & Bartosik, M. 2003, A&A, 405, 689, doi: 10.1051/0004-6361:20030593
- Benaglia et al. (2020a) Benaglia, P., De Becker, M., Ishwara-Chandra, C. H., Intema, H. T., & Isequilla, N. L. 2020a, PASA, 37, e030, doi: 10.1017/pasa.2020.21
- Benaglia et al. (2020b) Benaglia, P., Ishwara-Chandra, C. H., Intema, H., Colazo, M. E., & Gaikwad, M. 2020b, A&A, 642, A136, doi: 10.1051/0004-6361/202037916
- Bennett et al. (1986) Bennett, C. L., Lawrence, C. R., Burke, B. F., Hewitt, J. N., & Mahoney, J. 1986, ApJS, 61, 1, doi: 10.1086/191108
- Biteau & Williams (2015) Biteau, J., & Williams, D. A. 2015, ApJ, 812, 60, doi: 10.1088/0004-637X/812/1/60
- Bosch-Ramon et al. (2010) Bosch-Ramon, V., Romero, G. E., Araudo, A. T., & Paredes, J. M. 2010, A&A, 511, A8, doi: 10.1051/0004-6361/200913488
- Camilo et al. (2009) Camilo, F., Ray, P. S., Ransom, S. M., et al. 2009, ApJ, 705, 1, doi: 10.1088/0004-637X/705/1/1
- Camilo et al. (2012) Camilo, F., Kerr, M., Ray, P. S., et al. 2012, ApJ, 746, 39, doi: 10.1088/0004-637X/746/1/39
- Capak et al. (2013) Capak, P. L., Teplitz, H. I., Brooke, T. Y., Laher, R., & Science Center, S. 2013, in American Astronomical Society Meeting Abstracts, Vol. 221, American Astronomical Society Meeting Abstracts #221, 340.06
- Chernyakova et al. (2019) Chernyakova, M., Malyshev, D., Paizis, A., et al. 2019, A&A, 631, A177, doi: 10.1051/0004-6361/201936501
- Cohen et al. (1985) Cohen, M., Bieging, J. H., Dreher, J. W., & Welch, W. J. 1985, ApJ, 292, 249, doi: 10.1086/163154
- Condon et al. (1998) Condon, J. J., Cotton, W. D., Greisen, E. W., et al. 1998, AJ, 115, 1693, doi: 10.1086/300337
- Cutri & al. (2012) Cutri, R. M., & al. 2012, VizieR Online Data Catalog, II/311
- Cutri et al. (2003) Cutri, R. M., Skrutskie, M. F., van Dyk, S., et al. 2003, VizieR Online Data Catalog, II/246
- de Vries & Romani (2020) de Vries, M., & Romani, R. W. 2020, ApJ, 896, L7, doi: 10.3847/2041-8213/ab9640
- Frail et al. (2016) Frail, D. A., Jagannathan, P., Mooley, K. P., & Intema, H. T. 2016, ApJ, 829, 119, doi: 10.3847/0004-637X/829/2/119
- Frail et al. (2018) Frail, D. A., Ray, P. S., Mooley, K. P., et al. 2018, MNRAS, 475, 942, doi: 10.1093/mnras/stx3281
- Gregory & Condon (1991) Gregory, P. C., & Condon, J. J. 1991, ApJS, 75, 1011, doi: 10.1086/191559
- Hartman et al. (1999) Hartman, R. C., Bertsch, D. L., Bloom, S. D., et al. 1999, ApJS, 123, 79, doi: 10.1086/313231
- Intema (2014) Intema, H. T. 2014, SPAM: Source Peeling and Atmospheric Modeling. http://ascl.net/1408.006
- Intema et al. (2017) Intema, H. T., Jagannathan, P., Mooley, K. P., & Frail, D. A. 2017, A&A, 598, A78, doi: 10.1051/0004-6361/201628536
- Isequilla et al. (2020) Isequilla, N. L., Benaglia, P., Ishwara-Chandra, C. H., & Intema, H. 2020, Boletin de la Asociacion Argentina de Astronomia La Plata Argentina, 61B, 124
- Ishwara-Chandra et al. (2019) Ishwara-Chandra, C. H., Benaglia, P., De Becker, M., & Tej, A. 2019, Bulletin de la Societe Royale des Sciences de Liege, 88, 166
- Kryukova et al. (2014) Kryukova, E., Megeath, S. T., Hora, J. L., et al. 2014, AJ, 148, 11, doi: 10.1088/0004-6256/148/1/11
- Ladouceur & Pineault (2008) Ladouceur, Y., & Pineault, S. 2008, A&A, 490, 197, doi: 10.1051/0004-6361:200810599
- MAGIC Collaboration et al. (2020) MAGIC Collaboration, Acciari, V. A., Ansoldi, S., et al. 2020, arXiv e-prints, arXiv:2010.15854. https://arxiv.org/abs/2010.15854
- Mahy et al. (2013) Mahy, L., Rauw, G., De Becker, M., Eenens, P., & Flores, C. A. 2013, A&A, 550, A27, doi: 10.1051/0004-6361/201219425
- Manchester et al. (2005) Manchester, R. N., Hobbs, G. B., Teoh, A., & Hobbs, M. 2005, AJ, 129, 1993, doi: 10.1086/428488
- Martí et al. (2017) Martí, J., Luque-Escamilla, P. L., Paredes, J. M., et al. 2017, A&A, 598, A81, doi: 10.1051/0004-6361/201628863
- Martí et al. (2007) Martí, J., Paredes, J. M., Ishwara Chandra, C. H., & Bosch-Ramon, V. 2007, A&A, 472, 557, doi: 10.1051/0004-6361:20077712
- Paredes et al. (2014) Paredes, J. M., Ishwara-Chandra, C. H., Bosch-Ramon, V., et al. 2014, A&A, 561, A56, doi: 10.1051/0004-6361/201322306
- Paredes et al. (2007) Paredes, J. M., Martí, J., Ishwara Chand ra, C. H., & Bosch-Ramon, V. 2007, ApJ, 654, L135, doi: 10.1086/511178
- Perley & Butler (2013) Perley, R. A., & Butler, B. J. 2013, ApJS, 204, 19, doi: 10.1088/0067-0049/204/2/19
- Reipurth & Schneider (2008) Reipurth, B., & Schneider, N. 2008, Star Formation and Young Clusters in Cygnus (ASP), 36
- Rengelink et al. (1997) Rengelink, R. B., Tang, Y., de Bruyn, A. G., et al. 1997, A&AS, 124, 259, doi: 10.1051/aas:1997358
- Sánchez-Sutil et al. (2008) Sánchez-Sutil, J. R., Martí, J., Combi, J. A., et al. 2008, A&A, 479, 523, doi: 10.1051/0004-6361:20078498
- Swanenburg et al. (1981) Swanenburg, B. N., Bennett, K., Bignami, G. F., et al. 1981, ApJ, 243, L69, doi: 10.1086/183445
- Taylor et al. (1996) Taylor, A. R., Goss, W. M., Coleman, P. H., van Leeuwen, J., & Wallace, B. J. 1996, ApJS, 107, 239, doi: 10.1086/192363
- Uyanıker et al. (2001) Uyanıker, B., Fürst, E., Reich, W., Aschenbach, B., & Wielebinski, R. 2001, A&A, 371, 675, doi: 10.1051/0004-6361:20010387
- Wang et al. (2016) Wang, S., Liu, J., Qiu, Y., et al. 2016, VizieR Online Data Catalog, J/ApJS/224/40
- Wendker et al. (1991) Wendker, H. J., Higgs, L. A., & Landecker, T. L. 1991, A&A, 241, 551
- Zoonematkermani et al. (1990) Zoonematkermani, S., Helfand, D. J., Becker, R. H., White, R. L., & Perley, R. A. 1990, ApJS, 74, 181, doi: 10.1086/191496