Extreme ultra-soft X-ray variability in an eROSITA observation of the narrow-line Seyfert 1 galaxy 1H 0707495
The ultra-soft narrow-line Seyfert 1 galaxy 1H 0707495 is a well-known and highly variable active galactic nucleus (AGN), with a complex, steep X-ray spectrum, and has been studied extensively with XMM-Newton. 1H 0707495 was observed with the extended ROentgen Survey with an Imaging Telescope Array (eROSITA) aboard the Spectrum-Roentgen-Gamma (SRG) mission on October 11, 2019, for about 60,000 seconds as one of the first calibration and pointed verification phase (CalPV) observations. The eROSITA light curves show significant variability in the form of a flux decrease by a factor of 58 with a 1 error confidence interval between 31 and 235. This variability is primarily in the soft band, and is much less extreme in the hard band. No strong ultraviolet variability has been detected in simultaneous XMM-Newton Optical Monitor observations. The UV emission is , close to the Eddington limit. 1H 0707495 entered the lowest hard flux state seen in 20 years of XMM-Newton observations. In the eROSITA All-Sky Survey (eRASS) observations taken in April 2020, the X-ray light curve is still more variable in the ultra-soft band, but with increased soft and hard band count rates more similar to previously observed flux states. A model including relativistic reflection and a variable partial covering absorber is able to fit the spectra and provides a possible explanation for the extreme light-curve behaviour. The absorber is probably ionised and therefore more transparent to soft X-rays. This leaks soft X-rays in varying amounts, leading to large-amplitude soft-X-ray variability.
Key Words.:
accretion accretion, discs – galaxies: Seyfert – X-rays: general1 Introduction
All previous and present X-ray missions show that many narrow-line Seyfert 1 galaxies (NLS1; see Osterbrock & Pogge (1985) and Goodrich (1989)) have remarkable X-ray properties compared to Seyfert 1 galaxies with broader Balmer lines. Narrow-line Seyfert 1 galaxies are generally characterised by steep soft-X-ray spectra with photon indices of up to about 5 from simple power-law fits. Detailed spectral modelling shows that NLS1s often have very strong soft-X-ray excess components compared to their hard X-ray tails. A clear anti-correlation is found between the ROSAT spectral softness and the H full-width at half-maximum intensity (FWHM) in type 1 Seyfert galaxies (Boller et al., 1996) and quasars (Laor et al., 1997). This is remarkable as the X-ray emission from most type 1 Seyfert galaxies originates predominantly from within a few to a few tens of Schwarzschild radii of their black holes, while Seyfert optical permitted lines are formed in a separate and significantly larger region. It appears that the anti-correlation between H FWHM and ROSAT spectral softness is part of a more general set of relations which involve the Boroson & Green (1992) primary eigenvector, and it has been suggested that NLS1s may be a subset of type 1 Seyfert galaxies that are accreting at relatively high fractions of the Eddington rate (Tanaka et al., 2005). Furthermore, NLS1s often show sharp spectral cut-offs in the high-energy spectrum, an observation that is still a point of controversy (see Miller & Turner 2013 and Risaliti 2013). These objects also show remarkably rapid, large-amplitude X-ray variability. One spectacular object, the radio-quiet, ultra-soft NLS1, IRAS 132243809, shows persistent giant-amplitude variability events by factors of 35–60 on timescales of just a few days, most likely due to strong relativistic effects (Boller et al., 1997). The ROSAT HRI light curve of IRAS 132243809 is non-linear in character, suggesting that the X-ray emission regions on the accretion disc interact non-linearly or are affected by non-linear flux amplification. Dramatic flux and spectral variability has also been seen in many other NLS1s —as described by some of the early ROSAT and ASCA publications— such as for example Zwicky 159.034 (Brandt et al., 1995), WPVS007 (Grupe et al., 1995), 1H 0707–495 (Hayashida, 1997), RE J1237+264 (Brandt et al., 1995), PHL 1092 (Forster & Halpern, 1996), Mrk 766 (Leighly et al., 1996), and Ark 564 (Brandt et al., 1994).
1H 0707495 has been observed with XMM-Newton for over 20 years. In this paper we report the eROSITA discovery of an extreme ultra-soft X-ray spectral state. The light curve is dominated by changes in the ultra-soft band, with much less pronounced variability in the hard X-ray band and no significant ultraviolet variability. We describe our data analysis in Sect. 2, discuss the light curve of the source in Sect. 3, and then perform flux-resolved spectroscopy in Sect. 4, where we show that the variability can be explained by a temporally variable, ionised absorber (Sect. 5).
2 Data extraction
| eROSITA | ||||
| Starta | Endb | expoc | rated,e | |
| TM1 | 19:00:00 | 22:59:12 | 14.2 | 1.43 |
| TM2 | 20:06:50 | 22:59:12 | 10.3 | 1.20 |
| TM5 | 09:00:48 | 22:59:12 | 49.4 | 2.68 |
| TM6 | 09:00:48 | 22:59:12 | 50.3 | 2.91 |
| TM7 | 09:00:48 | 22:59:12 | 49.8 | 2.89 |
| XMM-Newton | ||||
| EPIC-pn | 09:38:14 | 01:21:40b | 52.0 | 14.70 |
| EPIC-MOS2 | 09:06:53 | 01:14:49b | 57.3 | 3.49 |
| OM | 09:14:54 | 11:46:42 | ||
| 14:58:42 | 01:21:10b | 44.0 | 12.56 |
Notes:
a For eROSITA the start and end date is October 11, 2019 (times in UTC).
b For XMM-Newton the start date is October 11, 2019 and the end date is October 12, 2019 (times in UTC). Note the gap in OM exposure.
c Net exposure time is given in ks.
d For eROSITA and XMM-Newton the 0.5-0.8 keV net count rates are given in units of
after background subtraction. Note the different time ranges for the cameras.
e The OM count rates are not re-scaled.
2.1 eROSITA
eROSITA (Predehl, 2012; Merloni et al., 2012; Predehl et al., 2020) is the primary instrument on the Russian SRG mission (Sunyaev et al. 2020, in prep). Following a CalPV phase eROSITA is presently performing 4 years in scanning mode to create all-sky survey maps, superseding the ROSAT all-sky survey (Trümper, 1984; Voges et al., 1999; Boller et al., 2016). Pointed observations are planned for after the survey phase.
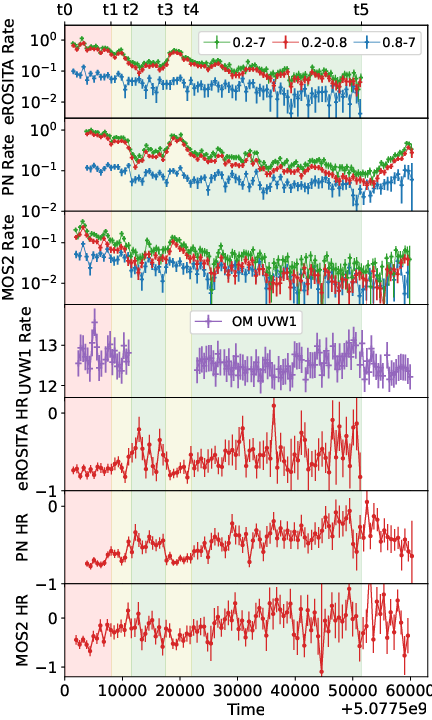
1H 0707495 was observed in a joint XMM-Newton and SRG observation during the Performance Verification (PV) phase of the SRG mission on October 11, 2019. As shown in Fig. 1 and Table 1, eROSITA started the observation slightly before XMM-Newton and also finished before. Telescope modules (TM) 5, 6, and 7 were active during the entire observation, whereas TM 1 and TM 2 were only activated for the last 16 ks and 10 ks of the observation, respectively, when the source was essentially static. 1H 0707495 was also observed during the first eROSITA all-sky survey (eRASS1) between April 26 and 29, 2020, for a total exposure of 407 s. All cameras were active and the total number of counts is .
Prepared event data were retrieved from the C945 version of the standard processing for eROSITA products. srctool version 1.49 from the eROSITA Science Analysis Software System (eSASS) was used to extract light curves, spectra, and the necessary auxiliary files for data analysis (Brunner et al., 2018; Brunner, H. et al, 2020). For the PV observation, data products were extracted with a source extraction circle of in radius and a background extraction annulus with inner and outer radii of and , respectively, excluding nearby contaminating sources. For eRASS1 data, the background annulus radii were extended to and to increase the count statistics, albeit still excluding contaminating sources.
As shown in Fig. 1, for further characterisation we divide the PV observations into five count-rate-selected time intervals using six time points . The [] section is selected as the high-count-rate state, the [] and [] sections are referred to as medium-count-rate states, the [] and [] sections are low-count-rate states, where . Flux-resolved spectral analysis is commonly used for highly variable objects, as applied for example by Kammoun et al. (2019) for NGC 4395. The time sequence applied for 1H 0707495 in this paper is high-medium-low-medium-low.
2.2 XMM-Newton
The observation of 1H 0707495 by XMM-Newton (Jansen et al., 2001) started on October 11, 2019, and lasted for 60700 seconds until October 12, 2019 (ObsID 0853000101). Extraction of the data was performed using the XMM Science Analysis System (SAS) version 18.0.0. For EPIC-pn (Strüder et al., 2001), the source and background photons were taken from circular regions with radii of and , respectively. The background area was chosen on the same CCD chip as the source, and was chosen to be empty of other sources and exclude gaps in the CCD. The same applies for data taken from MOS2 (Turner et al., 2001), where source and background regions of and in radius were used. MOS1 did not deliver any science products during the observation. The source signal is too weak for an extraction from the Reflection Grating Spectrometer (RGS; den Herder et al. 2001).
The XMM-Newton Optical Monitor (OM; Mason et al., 2001) covered the entire joint observation with 11 UVW1 exposures in Image mode, 10 of which were also taken in Fast mode. We processed the OM data using the tasks omichain and omfchain of SAS version 18.0.0. The standard and recommended procedure was adopted and the output products were checked following the list of known caveats and visual tests advised in the guides111https://www.cosmos.esa.int/web/xmm-newton/sas-threads. We compared the surface brightness of 1H 0707495 with two sources with high proper motion in the field, taken with the same aperture and with a similar count rate. The radial emission profiles were found to be very similar, and therefore the source can be considered close to point-like and with minor host contamination (see also Leighly & Moore, 2004), also validating the automated coincidence loss correction in omichain.
2.3 Analysis methods
The Interactive Spectral Interpretation System (ISIS) in combination with HEAsoft version 6.27.2 was used for the analysis of spectra and light curves. Cash (1979) statistics have been used for spectral fitting, as the signal to noise ratio (S/N) is insufficient for statistics.
3 Light-curve analysis
In the following we describe the unique X-ray properties detected in the eROSITA observations. The results obtained from the simultaneous XMM-Newton observations are also discussed. We also report the first eROSITA all-sky survey observations performed in April 2020.
3.1 Detection of large-amplitude flux changes
During the eROSITA observations, 1H 0707495 showed a dramatic flux drop in about one day (see Fig. 1). The source is brightest at the beginning of the observations, with rapid fluctuations in count rate, followed by a subsequent decline in count rate going down close to the background level. The highest count rate detected in the eROSITA (0.2–7.0) keV light curve is . The corresponding lowest count rate is . The resulting mean amplitude variability is a factor of 58, with a 1 error confidence interval with factors between 31 and 235. Similar large-amplitude count-rate changes are deduced from the EPIC-pn and XMM-MOS2 light curves, where the lowest count rate values are consistent with the corresponding background values.
3.2 Energy dependence of the variability
Figure 1 presents the eROSITA and XMM-Newton light curves in the total (0.2-7.0 keV), soft (0.2–0.8 keV), and hard (0.8–7.0 keV) energy bands (c.f. Fig. 3 for motivation for these energy band selections). The soft variability appears similar to the total band variability, with count-rate changes of a factor greater than 50. In the hard band, the variability amplitude is about a factor of 10, obtained from the XMM MOS2 light curve. The normalised excess variance (NEV) is a powerful and commonly used method to test whether a time series is significantly variable above a certain threshold (e.g. Nandra et al., 1997; Vaughan et al., 2003; Ponti et al., 2004). The NEV values have been calculated for the total, soft, and hard band eROSITA light curves based on Eqs. 1 and 2 of Boller et al. (2016). Both the total and soft band eROSITA light curves are highly variable with NEV values of 34.8 and 44.6 , respectively. The NEV value for the hard eROSITA light curve is , quantifying the higher amplitude variability in the soft and total bands compared to the hard energy band.
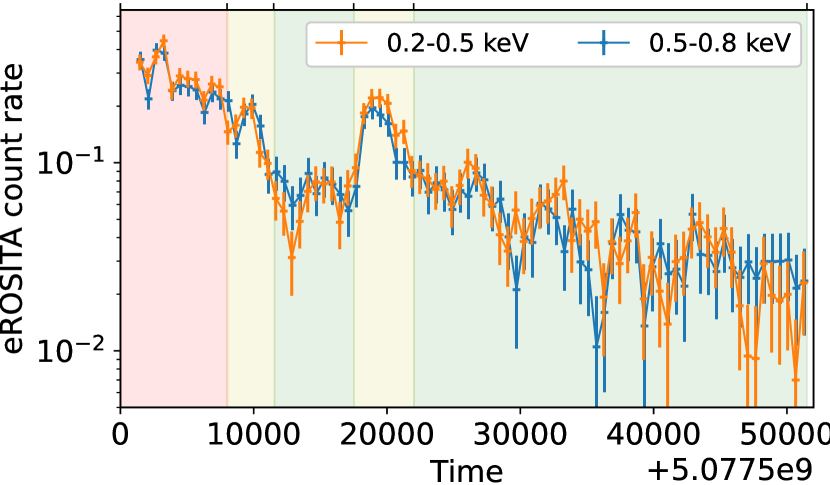
We further analysed the soft X-ray light curve in the energy bands (0.2–0.5) keV and (0.5–0.8) keV (see Fig. 2, top panel, for the eROSITA light curves). Interestingly, the light curve appears almost identical in both bands. Both are significantly variable with NEV values of 31.3 and 21.8 for the (0.2–0.5) keV and (0.5–0.8) keV, respectively. Above 0.8 keV, the variability abruptly declines up to the highest energies probed (c.f. Fig. 12).
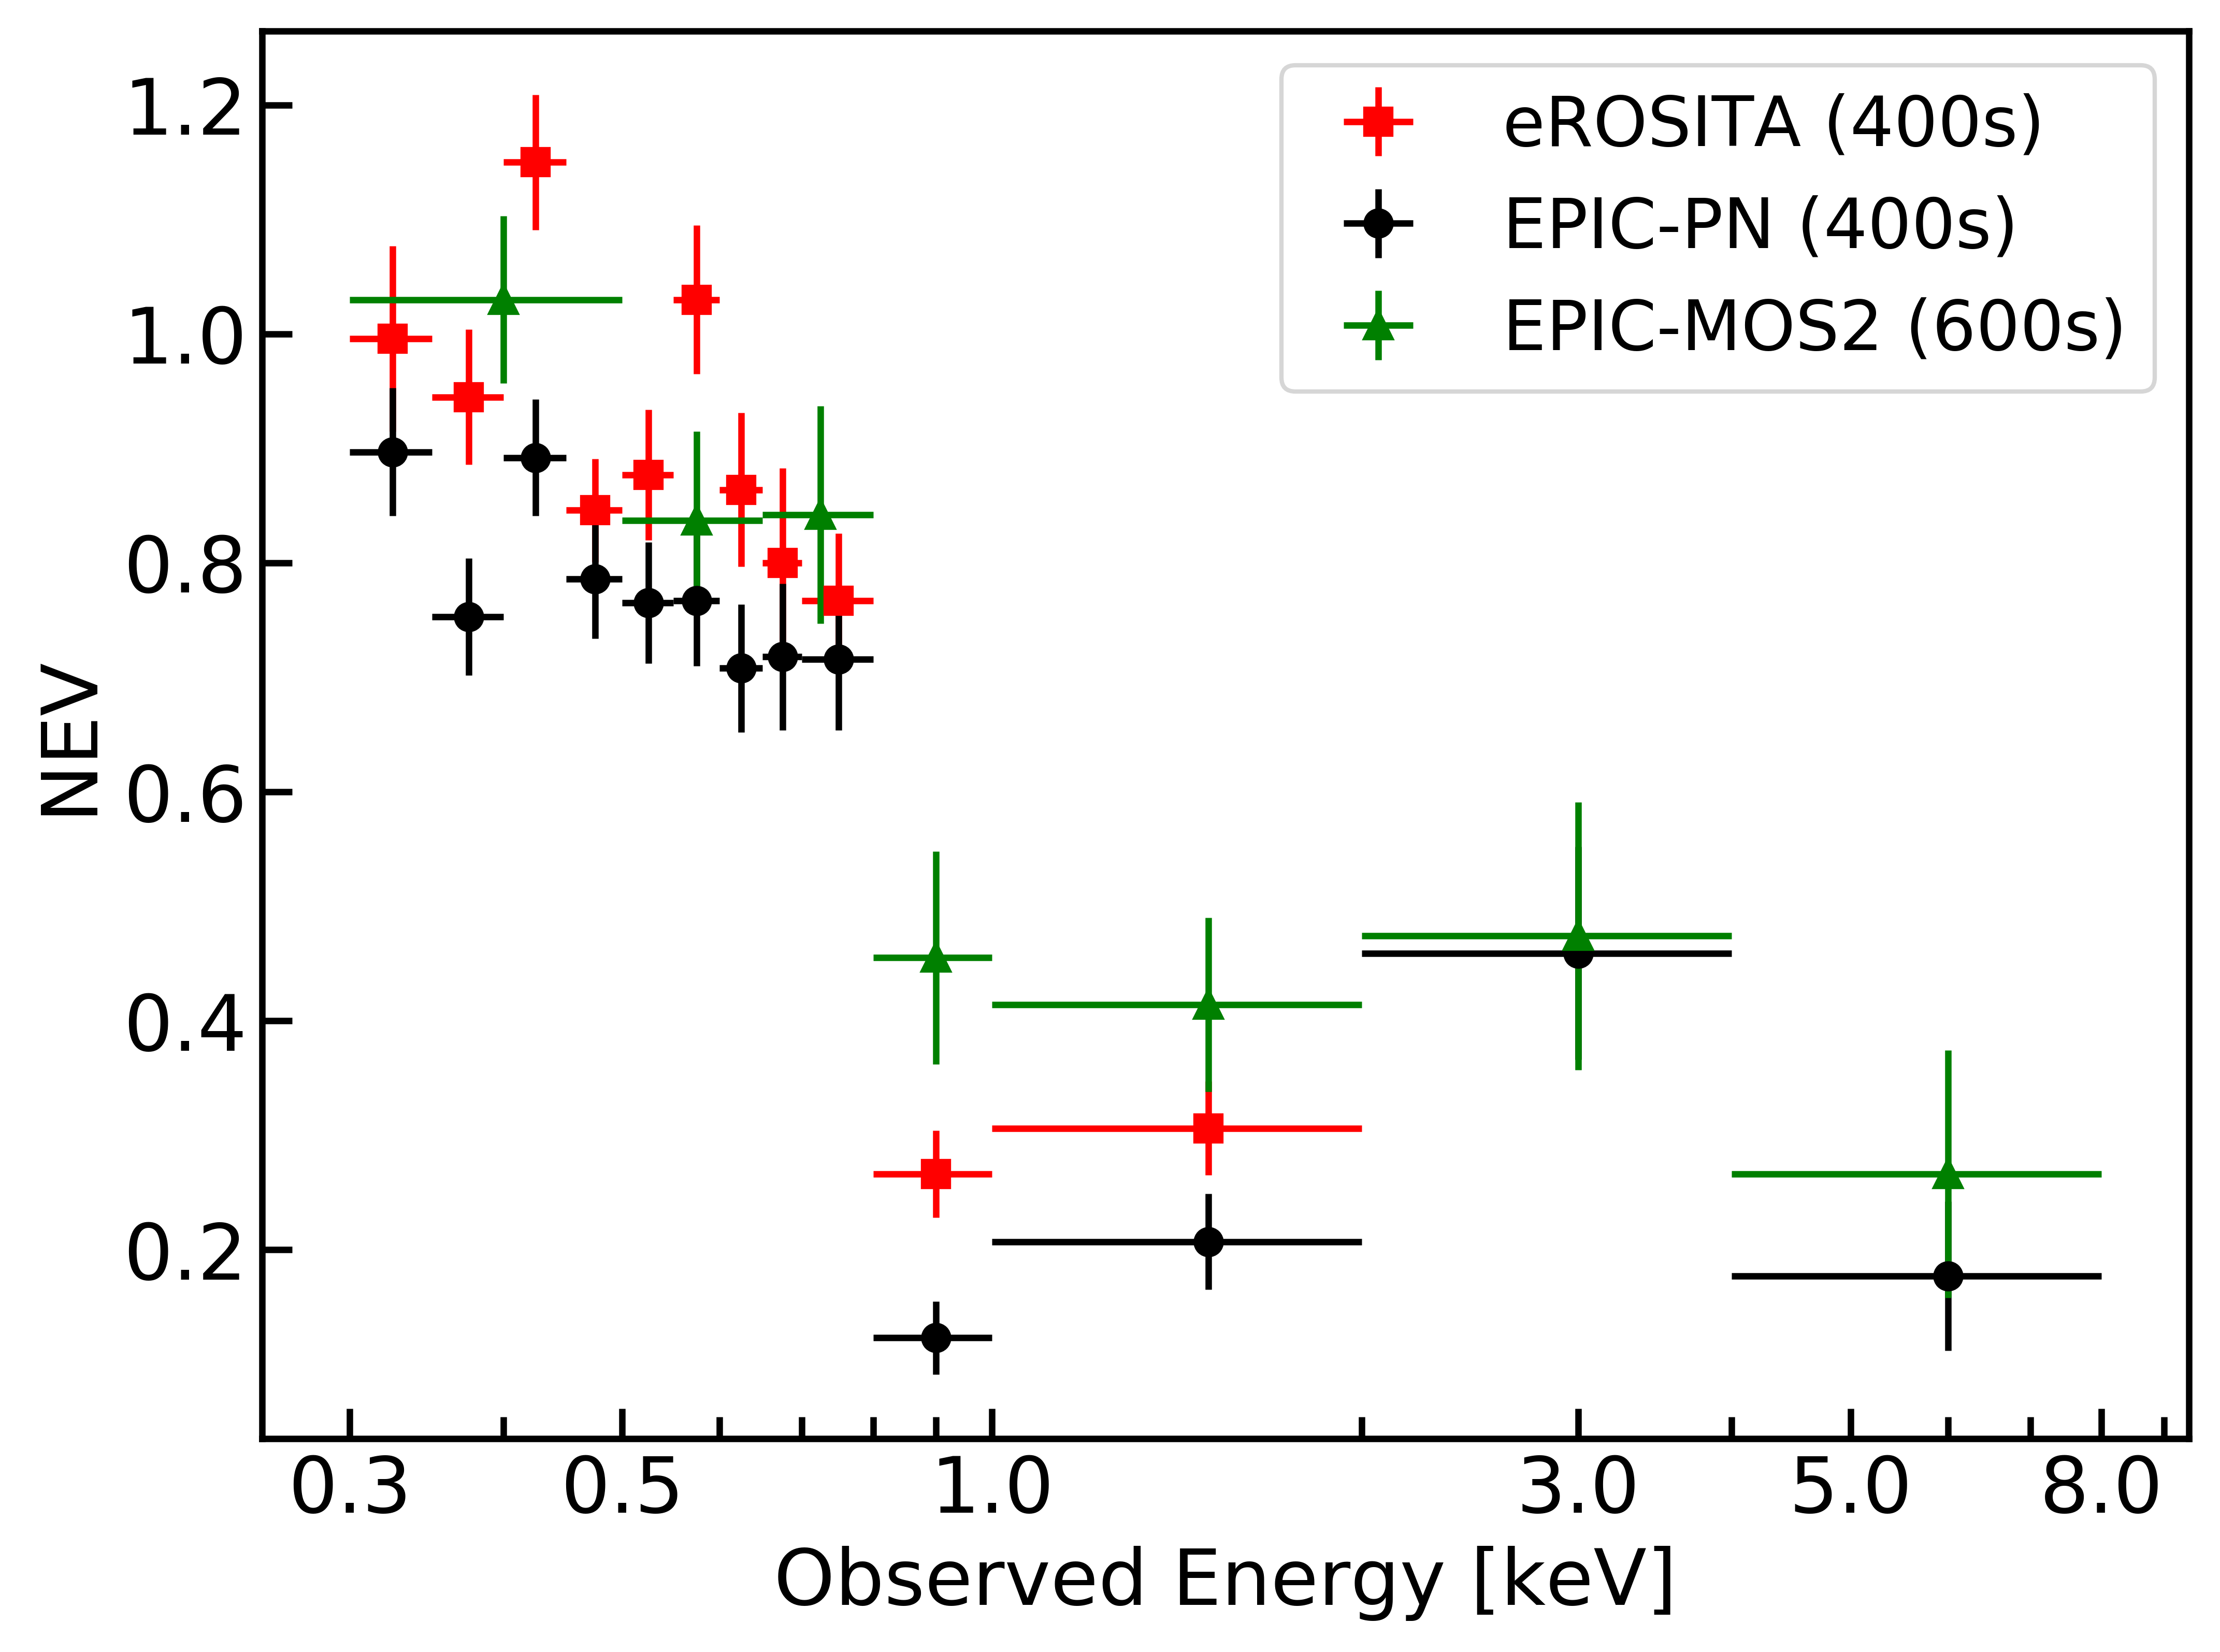
The NEV values are then computed in energy-resolved bins to create NEV spectra for each detector. The results are shown in Fig. 3. Larger time and energy bins are required for MOS2 given the lower number of counts. Normalised excess variance values may differ slightly between instruments due to varying observation exposures, and bin sizes. However, all NEV spectra reveal dramatic variability below 0.8 keV, with a striking drop off between 0.8 and 2.0 keV. Any NEV values above 2.0 keV could not be computed with eROSITA due to high background and very low variability, but for EPIC-PN and EPIC-MOS2, the variability increases slightly from 2 to 4 keV before dropping again from 4 to 8 keV.
The strong soft X-ray variability is extreme in relation to the weak hard X-ray variability and the lack of ultraviolet variability (see following section). Such extreme ultra-soft and large-amplitude flux variability in active galactic nuclei has not been detected with other X-ray observations so far. Extremely large-amplitude variability has been observed in the past in objects such as IRAS 132243809 (Boller et al., 1997), GSN 069 (Miniutti et al., 2019) and RX J1301.9+2747 (Giustini et al., 2020). What distinguishes the discovery here is the presence of such variability in the soft X-ray band, with simultaneous observations that show the absence of such variations in the hard X-rays (above 0.8 keV).
3.3 Absence of strong UV variability in XMM-Newton OM observations
The source remained quite constant in the UV based at an NEV value of . This is indicated by both photometry from imaging and count rates from the timing light curve. The omichain photometry indicates a count rate level of cts s-1 and an AB magnitude of . No reddening correction was applied and the OM UWW1 data indicate the observed count rate. The omfchain light curve is shown in Fig. 1 with a bin time of 400 seconds. The light curve does not show significant variability during the ks observation, in contrast to the highly variable soft-X-ray light curve. There is an indication of one low-amplitude count rate increase in the first OM exposure, but not of the order seen in soft X-rays. It is well known that in NLS1s, the optical-UV emission varies less than that in X-rays (e.g. Ai et al., 2013), a phenomenon also seen in 1H 0707495 with the two very deep 500ks XMM-Newton observations from 2008 and 2010 (Robertson et al., 2015; Done & Jin, 2016). The OM data for these deep observations are remarkably constant. The largest difference is 10% in the UVW1. In particular, the OM rates were observed at and cts s-1 in those two epochs, respectively (Robertson et al., 2015), similarly to our 2019 observations. Moreover, Robertson et al. (2015) found no evidence of strong correlations between UV and X-rays on timescales of less than a week (but see Pawar et al., 2017).
The flux at the effective wavelength of the UVW1 filter (i.e. 2910 Angstrom) was computed from the omichain count rates using the correction factors listed in the OM_COLORTRANS_0010.CCF calibration file. The average UVW1 flux throughout the whole observation is ; it is marginally higher with in the high-flux state. For the low-flux state, the UVW1 flux is consistent with the average flux with .
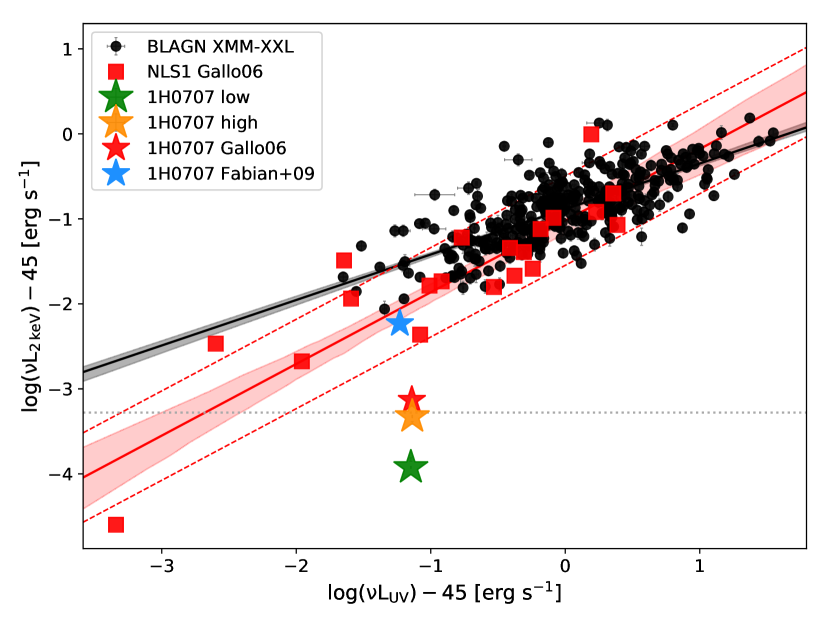
In Fig. 4 we show the OM-UVW1 and (EPIC-pn) 2 keV luminosity for the high and low count rate state of 1H 0707495 compared to other NLS1s (e.g. Gallo, 2006) and to broad-line AGNs (e.g. Liu et al., 2016) in the plane (e.g. Lusso & Risaliti, 2016; Arcodia et al., 2019, and references therein).
From this comparison, it is clear that even the brighter state observed in our joint eROSITA/XMM-Newton observation is under-luminous in X-rays with respect to typical NLS1s and to past 1H 0707495 observations as well (Gallo, 2006; Fabian et al., 2009). This indicates that we indeed observe an unusually X-ray-weak state of 1H 0707495, especially when compared to other NLS1s given their UV emission. Remarkably, the UV level of 1H 0707495 has remained within comparable values for the last years (e.g. Robertson et al., 2015; Done & Jin, 2016, and references therein).
3.4 Comparison with 20 years of XMM-Newton observations and eROSITA all-sky survey observations
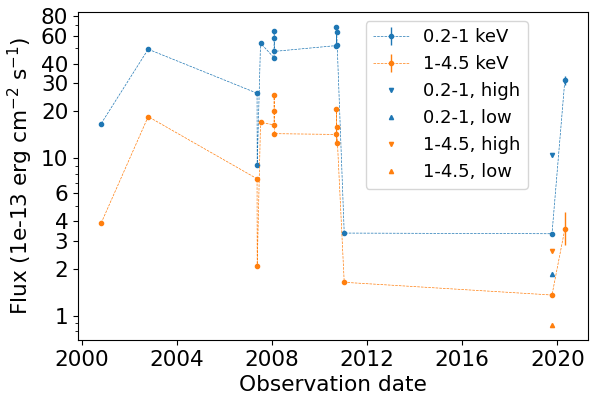
The analysis and comparison with 20 years of XMM-Newton observations from 2000 (Boller et al., 2002) and 2019 (this paper) reveals that 1H 0707495 entered a historical low in hard flux band emission, first detected in simultaneous eROSITA XMM-Newton observations (see Fig. 5). The lowest hard-band flux measured during the 2019 XMM-Newton observations is about (this paper), about a factor of 15 lower than the highest hard flux value recorded, which was about (Dauser et al., 2012). The soft band flux detected in the 2019 observations is , consistent with the observations from 2010 (Dauser et al., 2012), but still also a factor of about 20 lower compared to the highest soft-band flux states of about .
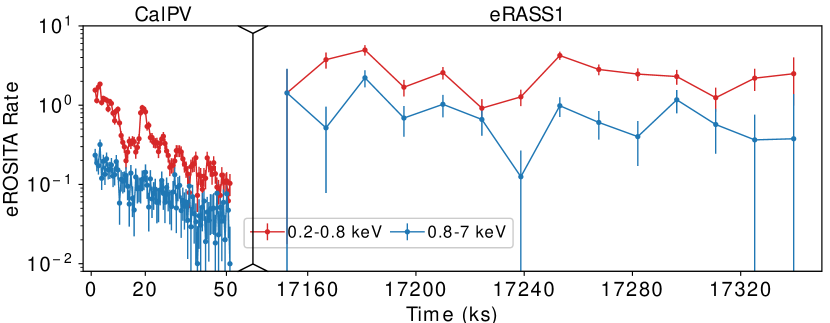
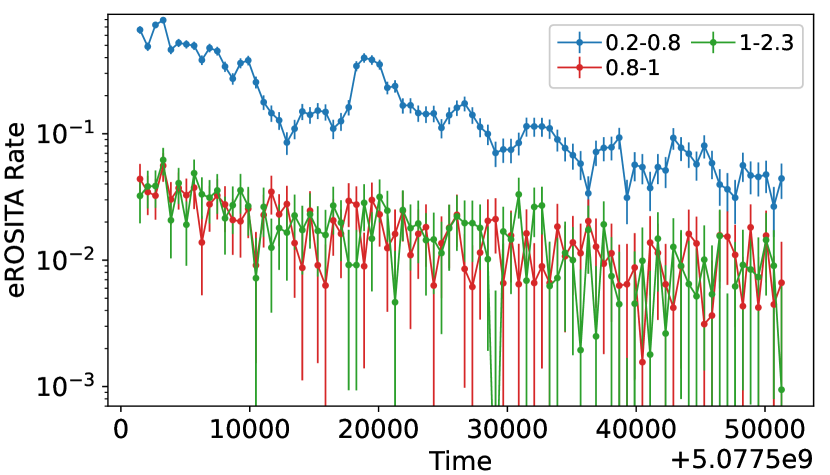
1H 0707495 was also observed during the first eROSITA all-sky survey scan (eRASS1) between April 26 and 29 in 2020. In each eRASS, every point in the sky is observed a few times (depending on the location of the source in the sky, the number increasing towards high ecliptic latitudes) for s every hours. For 1H 0707495, the net exposure is s with 392 counts observed in total in the keV band. To convert counts to rates, we applied point spreak function (PSF)-loss and vignetting corrections because the source enters the field of view (FoV) in each passage at different offset angles. We extracted the light curves in the soft and hard energy bands from the survey data. Figure 6 shows the comparison between the eROSITA PV and eROSITA eRASS1 observations for the soft (0.2–0.8 keV) and hard (0.8–7.0 keV) energy bands on a logarithmic scale. The soft light-curve count rate increased again during the eRASS1 observations, with less amplitude variability than seen in the PV observations, and the hard band count rate also increased. We also report the related soft and hard band fluxes in Fig. 5.
4 Spectral analysis
In the previous section we show that the soft-band light curve displays extreme and significant X-ray variability while the hard-band light curve is less variable. Figure 7 shows the full eROSITA and XMM-Newton EPIC pn spectrum of the 2019 observation. For comparison, previously observed spectra of the highest and lowest flux states from 2008 (327 ks, Fabian et al., 2009) and 2011 (80 ks, Fabian et al., 2012), respectively, are shown. As seen in the overall flux evolution of 1H 0707495 (Fig. 5), the source in 2019 was caught in a very low flux state, with a flux even lower than that observed in 2011 (Fabian et al., 2012).
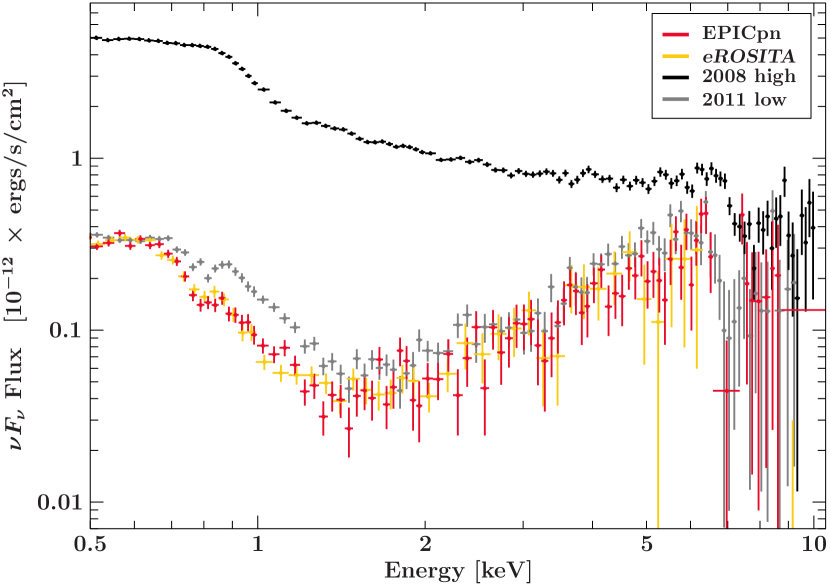
The spectral shape of 1H0707495 is characterised by a strong soft component, followed by an almost flat part, and then a strong drop at around 7 keV first reported by Boller et al. (2002). A number of alternative models have been discussed to explain this shape; see Fabian et al. (2012) for a discussion. These models generally explain the spectrum as a combination of relativistic reflection (e.g. Hagino et al., 2016) together with a strong soft excess, as well as superimposed absorption features caused by a strong wind (Dauser et al., 2012). In the following we use these earlier studies to guide our spectral analysis, concentrating on the cause of the spectral variability seen here. We note that other models based on inhomogeneous accretion flows (e.g. (Merloni et al., 2006) have also been proposed to explain the complex spectral and timing properties of NLS1s with near-Eddington accretion flows.
4.1 Relativistic reflection model
Due to the spectral similarity to the 2011 observation (see Fig. 7), guided by Fabian et al. (2012) and in agreement with analyses of the higher flux states (e.g. Fabian et al., 2009; Zoghbi et al., 2010; Dauser et al., 2012) we describe the combined 0.5–10 keV data with a relativistic reflection model. For this analysis all spectra were optimally binned according to Kaastra & Bleeker (2016) and modelled using the Cash (1979) statistic.
Foreground absorption is accounted for using tbnew (Wilms et al., 2000) with abundances from Wilms et al. (2000), fixing the equivalent hydrogen column density to the Galactic 21 cm equivalent width of (HI4PI Collaboration et al., 2016). The redshift to the source is set to (Jones et al., 2009). In order to account for potential differences in gain of the data due to cross-calibration between instruments, multiplicative constants (detector constants) for eROSITA () and MOS2 () with respect to pn were introduced into the models. The relativistic reflection is described with the relxill model (Dauser et al., 2010, 2013; García et al., 2014), which calculates the relativistically smeared spectrum reflected from the innermost regions of an ionised accretion disc. relxill is based on the xillver model (García et al., 2013) for non-relativistic reflection. Based on previous results, which suggest a very compact primary source of radiation (Dauser et al., 2012; Fabian et al., 2012) we use the relxill lamp-post flavor, relxilllp, which assumes that the primary source of the X-ray radiation is compact and located above the black hole on its rotational axis. The incident radiation from this source, the so-called ‘corona’, takes the form of a power law with an exponential cutoff fixed at keV. The strength of the reflection component is parameterised by the source intrinsic reflection fraction, . It is defined in the frame of the primary source as the fraction of photons emitted towards the disc compared to the fraction emitted towards the observer (see, Dauser et al., 2016, for a detailed definition). As detailed in Dauser et al. (2014a), in the case of a low source height the strong light-bending effects would lead to most photons being focused on the disc and therefore easily to a reflection fraction of ten and larger.
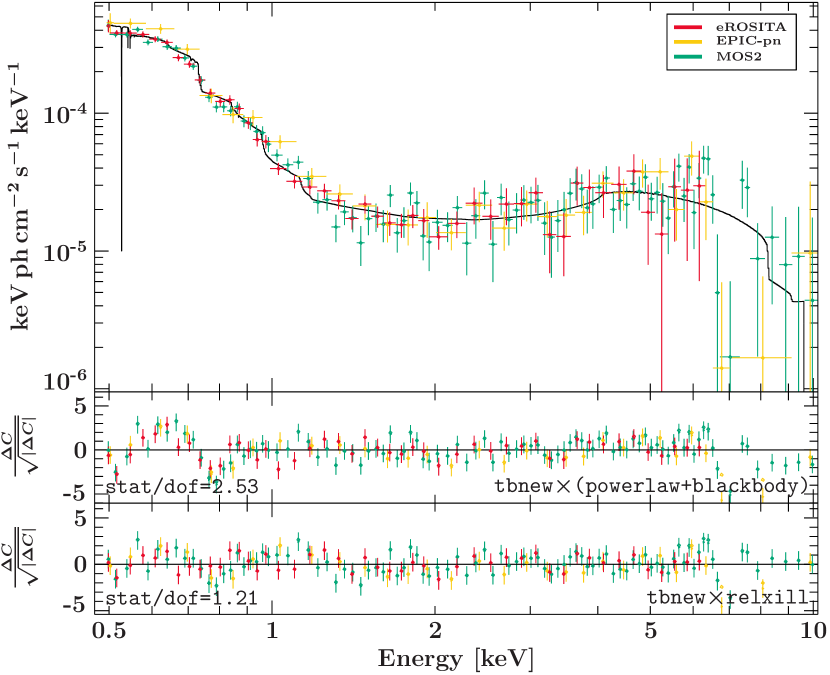
Applying this relativistic reflection model to the eROSITA, EPIC-pn, and EPIC-MOS spectra provides a good description of the data (with statistic/dof = 1.21). The spectra and the corresponding model are shown in Fig. 8 and the best-fit parameters are listed in Table 2. We emphasise that no additional empirical black-body component is necessary to achieve a good fit when applying this relativistic reflection model to the data. Adding an additional low temperature () black-body component does not improve the fit statistics. For completeness, the comparison to a simple power law plus black body model is also shown in Fig. 8.
The best-fit parameters of this model are in good agreement with previous results on relativistic reflection modelling of 1H 0707495. Similarly to previous studies (Fabian et al., 2012, 2009, 2004; Kara et al., 2015), iron is highly overabundant, with an abundance of which is consistent with the upper limit allowed by the reflection model. With , the recovered photon index of the incident power law is also in agreement with these earlier studies. The spin parameter is well constrained, with a value of , which is close to maximal spin, while the height of the primary source, , implies a very compact X-ray source that is extremely close to the black hole. These values are also consistent with earlier studies employing the lamp-post geometry (Fabian et al., 2012; Dauser et al., 2012; Kara et al., 2015). While these parameters tend to be consistent between the different earlier observations, the inclination of the accretion disc was found to vary widely, ranging from (Fabian et al., 2002) up to (Dauser et al., 2012). The value found in the present analysis, , is at the upper end of this range. However, we emphasise that the self-similarity of reflection spectra in the lamp-post geometry results in a degeneracy between inclination and lamp-post height (Dauser et al., 2012), which might be the reason for the large spread of observed inclinations. Recently, Szanecki et al. (2020) applied their newly developed relativistic reflection model to an extended lamp-post source and confirm the compact nature of the corona in agreement with the interpretation presented in the present study.
Interestingly, with , the ionisation parameter of the accretion disc is low compared to previous analyses (Fabian et al., 2002, 2004, 2012; Hagino et al., 2016; Kosec et al., 2018). Only Kara et al. (2015) report a lower value of when also using the relxilllp model on NuSTAR data from 2014.
The reflection fraction is determined to be very high with , implying that most of the radiation emitted from the primary source is reflected on the disc and only a minor fraction is directly observed. This result is in agreement with previous observations starting with Fabian et al. (2002), all consistently finding that 1H 0707495 is extremely reflection dominated222in case a relativistic reflection model is used to describe the data; see above for alternative explanations. (see, e.g. Kara et al., 2015). Calculating the expected reflection fraction for such a point-like lamp-post source close to a very rapidly rotating black hole leads to values of 12-20 (see Dauser et al., 2014a). This is in rough agreement with the high values we find, but still suggests a certain difference between the primary source in 1H 0707495 and the standard lamp-post source.
Inspecting the residuals of the relativistic model in Fig. 8 in more detail reveals that the drop in flux around 6 to 7 keV is not entirely correctly modelled. However, we note that a fast absorption by an ionised outflow as discovered by Done et al. (2007); Dauser et al. (2012) might explain why the model over-predicts the flux around 7 keV. Tailoring a disc wind model to the parameters of the 1H 0707495 system, Hagino et al. (2016) were able to partly explain this drop as ionised absorption seen under different velocities because of a wind cone emitted between and which is intercepting the line of sight. A detailed analysis of all available data by Kosec et al. (2018) appears to be in support of the existence of an ultra-fast stratified outflow in 1H 0707495.
| Parameter | Value and Confidence |
|---|---|
| spina | |
| [∘] | |
| [] | |
| -statistic/ |
Notes:
a dimensionless spin parameter where is the black hole mass and is the angular momentum
b see Dauser et al. (2016)
c reflection fraction, see Dauser et al. (2014a)
d iron abundance with respect to solar values (Grevesse et al., 1996)
e ionisation parameter, defined as where
is the incident flux and where is the particle density
4.2 Spectra at high, medium, and low count rates
In order to investigate the effect of the strong flux variability during the observation, we created three flux-resolved spectra, selected based on count-rate segments highlighted in Fig. 1. The specific times of the selection are given in Sect. 2. As already seen by the detailed analysis of the light curves in different bands (see Sect. 3), the majority of the flux variability is detected below 1 keV.
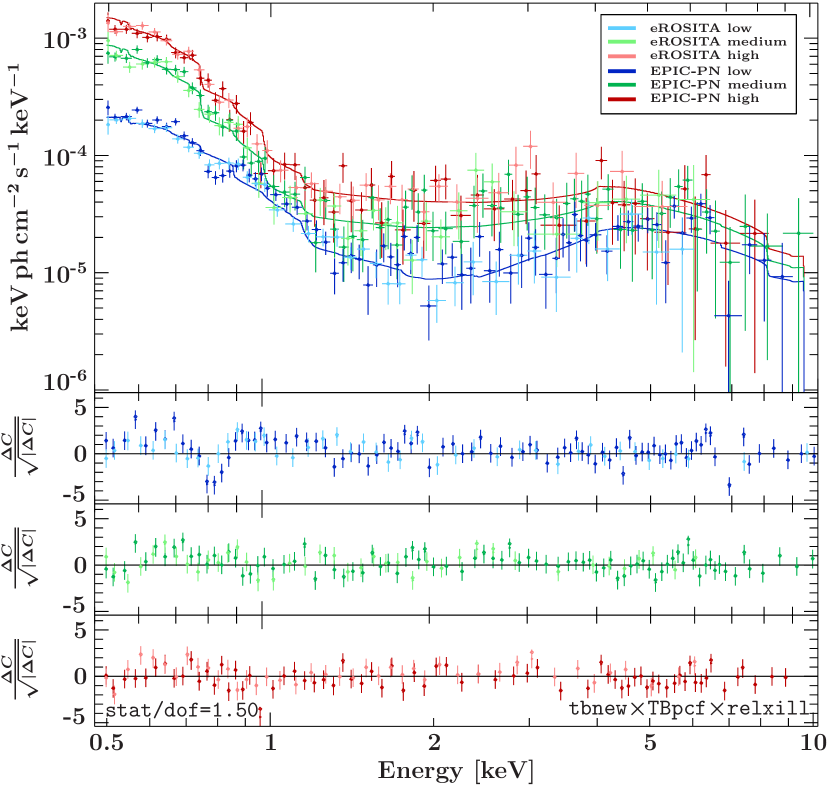
Figure 9 compares the eROSITA and EPIC-pn spectra in the three selected count-rate intervals. In the following sections, we explore the time evolution of the spectra with a partial covering model with relativistic reflection.
| Parameter | Low (1) | Medium (2) | High (3) |
|---|---|---|---|
| Time-dependent parameters | |||
| normrelxilllp | |||
| Time-independent parameters | |||
| [deg] | |||
| spin | |||
| [] | |||
| stat/dof | |||
4.3 A changing partial coverer
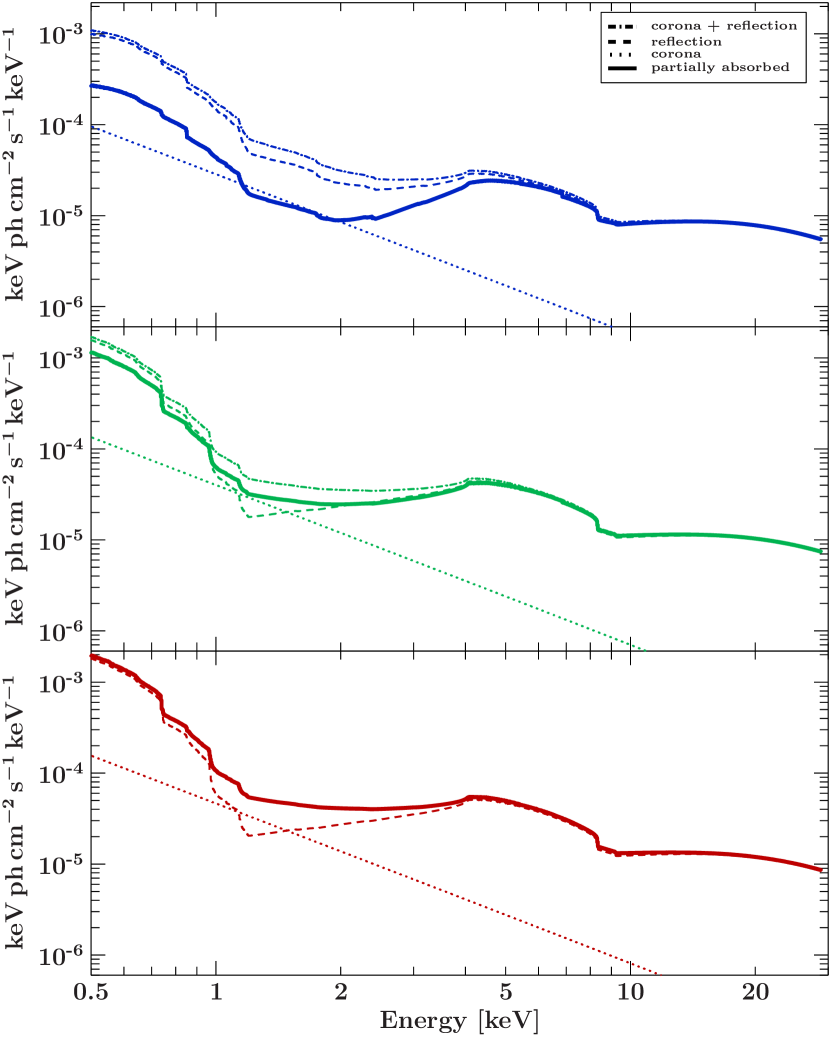
Considering that X-ray absorption has a greater effect on the soft energies, we now check whether varying absorption can explain the large changes observed in the soft flux of 1H 0707495. To test this hypothesis we employed the partial covering model TBpcf (Wilms et al., 2000) to act as a changing absorption component in the line of sight towards the emission region. In order to test this scenario, we fitted the spectra of all count-rate states simultaneously, keeping all parameters of the continuum the same, including the column density of the partial coverer, . The only parameters that were allowed to vary between the two observations are the ionisation parameter of the reflection model and the covering fraction, , of the partial coverer. All parameters as determined from the best fit are listed in Table 3. A decomposition of the relativistic model for each flux state is shown in Fig. 10.
The best fit in this configuration yields , which means that the overall very strong variability can be explained solely by a variation of the covering fraction of the absorber and by a variation of the ionisation of the reflector. Over the course of the observation, the covering fraction for the highest flux states and then increases to in the medium-flux spectrum and in the low-flux spectrum. We note that the time sequence of flux states is high-medium-low-medium-low. Because of low number statistics, we had to merge the two medium and the two low states in order to derive constrained covering fractions. Care is therefore needed when interpreting the covering fraction evolution.
For the parameters tied between the flux-selected spectra, a comparison with the best fit to the combined spectrum (see Table 2) shows that the photon index , the reflection fraction , the inclination , the lamp-post height , and the spin are consistent with the results from the combined spectra. Only the iron abundance is now reduced to a more reasonable value of , possibly implying that the very high abundances found also in the earlier observations might be due to soft variability which was ignored in the analysis.
Initial fits where we kept the ionisation parameter of the reflector linked between flux-selected spectra did not yield a satisfactory description of the data, with significant residuals remaining in the 1 keV band, which we attribute to emission in the Fe L band. We therefore allowed the ionisation parameter to vary between the three count-rate-selected spectra, which led to a good fit to the data. We note that we would not expect most other parameters such as the spin or the inclination to vary during the observation. The only parameter that has been suggested to change (see, e.g. Kara et al., 2015) is the height of the primary source. In our case a constant height satisfactorily describes the data and a potential additional change of the height cannot be detected. This can also partly be attributed to the lower S/N in these spectra.
The ionisation parameter changes from a consistent and fairly low ionisation for the high- and medium-flux-selected spectra ( and , respectively) to a larger value of in the low-flux spectrum.
As we discuss below, this change is likely not a physical change of the reflection component but the fit compensating for non-modelled ionisation in the absorber. In order to test a possible ionised partial coverer we used the model zxipcf (Reeves et al., 2008). Unfortunately, because of the brevity of the observations, the data are insufficient for a signficant constraint to be put on the ionisation of the absorber. Even when freezing all relxill parameters and only allowing the normalisation, reflection fraction, and partial coverer fractions to vary freely, the ionisation in the medium flux state is completely unconstrained. In the low-flux state, the ionisation parameter is weakly constrained to , but because of the low S/N, this value should be treated with care. Longer observations would be required to analyse the ionisation of the partial coverer. The low count-rate statistics do not allow us to constrain the ionisation of the absorber directly from the observations.
5 Physical Interpretations
5.1 The extreme and varying UV-to-X-ray flux ratio
One important new observational result is that within less than one day the ratio of UV to X-ray emission shows large variations. The UV emission is rather constant with , similar to the values reported by (Done & Jin, 2016), before applying bolometric corrections, which is close to the Eddington limit. On the other hand, the X-rays emission drops in amplitude by more than a factor of 50 (c.f. Fig. 1). A strongly varying X-ray flux during a constant UV flux was detected over timescales shorter than one day. Buisson et al. (2017) analysed a sample of 21 AGNs using data from the Swift satellite to study the variability properties of the population in the X-ray, UV, and optical bands. For 9 out of their 21 sources, the UV is lagging the X-rays. For 1H 0707495, the authors did not find strong correlations between the X-ray and the UV, similar to the results reported in this paper. Buisson et al. (2017) found 1H 0707495 in a low-flux state during their Swift observations and argue that in such cases the source height of the illuminating corona is low, similar to the values reported in Table 2 in this paper, which makes it difficult to detect UV–X-ray time lags. In the previous section, we infer that the X-ray variations are primarily due to varying covering fraction of a partial absorber. This does not seem to affect the UV, which implies that these are caused by independent physical processes. During the eROSITA CalPV observations, 1H0707495 is extremely under-luminous in the X-ray compared to other NLS1s and BLS1s (c.f. Fig. 4) as well as to the 1H 0707495 high-flux-state observations from Fabian et al. (2009). This supports the interpretation that the X-rays are suppressed in this observation, and thus possibly absorbed, and therefore absorption-related changes could explain the variability.
5.2 Changing partial covering fractions causing large-amplitude and ultra-soft count-rate variations
The most important result of the analysis presented here is that the major source of variability observed in the spectrum can be explained by variation of the covering fraction of the absorber. Our spectral analysis shows that the variation of the X-ray spectrum is consistent with changes induced by a partial absorber of varying covering factor and constant column density in front of the X-ray-emitting corona and accretion disc. As expected, the covering fraction is increasing significantly with decreasing flux of the source. With , the equivalent hydrogen column density of the partial coverer is consistent with that seen in typical AGN absorption events. Markowitz et al. (2014) find peak column densities of 4–26 in the largest sample of cloud obscuration events. Studying the long-term X-ray spectral variability of a sample of 20 Compton-thin type II galaxies, Laha et al. (2020) find 11 sources that require a partial-covering obscuring component in all or some of the observations. Not only are the ranges quoted in both studies fully consistent with our derived value, but also the presence of a varying partial cover seems to be present in a significant fraction of AGNs.
We note that there has been controversial discussion of whether a partial coverer in 1H0707495 can explain the strong 7 keV edge (e.g. Fabian et al., 2004; Gallo et al., 2004; Done et al., 2007). In our model, the partial coverer does not explain the 7 keV edge. While this edge is mainly modelled by relativistically smeared reflection from the accretion disc, our partial covering model describes the varying absorption in the soft X-rays. In this paper we combine relativistic reflection very close to the black hole, that is, at a few with partial covering occurring at larger distances up to a few hundred . From analyses of much longer observations (Dauser et al., 2012; Kosec et al., 2018), it is known that a strongly ionised wind is present in 1H0707495. The absorption feature around 0.8 keV is evidence that this outflow is also present in the low flux state of our observation (c.f. Fig. 9). The wind is not detected in the higher flux states, as the outflowing winds are strongly flux dependent as shown for example by Parker et al. (2017) and Reeves et al. (2018). As the existence of such an ultra-fast outflow (UFO) has been shown to be connected with the observed partial covering in other sources (e.g. PDS 456, Reeves et al., 2018), it is possible that the observed partial covering in the soft X-rays is connected to these previously detected UFOs. This absorption is likely connected to or even directly caused by the UFO detected previously. The UFO will also affect the Fe-K region around 7 keV (Kosec et al., 2018), but was not detected in our observations because of the lower S/N.
The change in partial covering fractions combined with UFO features may also explain the observed shape of the NEV spectra. On short timescales, the absorber is likely driving the variability, which is probably because of the small variations in ionisation and covering fraction as the material passes along the line of sight. As seen in Fig. 10, the absorber seems to affect the spectral shape between 0.3 and 4 keV, which explains why these energy bins have higher NEV values. In particular, most of the variability is seen below 0.8keV, in agreement with what is seen in the light curve.
The NEV spectra also reveal very little variability in the 0.8-2.0 keV and 4-8 keV bands. This may be explained by the presence of UFO features in these energy bands. The outflow may be more stable on shorter timescales, instead varying on longer timescales. This behaviour would suppress the variability on short timescales in these energy ranges, explaining the drops in the NEV (c.f. Sect. 5.3 for a more detailed discussion on the connection between outflowing winds and partial covering).
However, at the same time, we also measure a change in the ionisation parameter of the relativistic reflection component. We consider it unlikely that this change of ionisation is indicative of changes in the accretion disc, and is probably rather caused by the simplified (neutral) absorber model. As discussed in Sect. 5.1, the data do not allow us to constrain the ionisation of the absorber.
Due to lack of additional information, such as the ionisation of the absorber, it is not easy to estimate the distance and size of the obscuring cloud. Given the short timescale of the putative absorption event and the strong change of the covering fraction within 20-40 ks, the absorber will probably be much closer to the X-ray source than the BLR (see Sect. 5.3). This short distance makes it very likely that it will be partly ionised. However, ionised absorbers are more transparent in the soft X-rays than neutral absorbers and therefore show leakage effects in the soft X-rays. The change in of the reflector seen here mainly affects the soft X-rays, and thus might mimic this effect of ionised absorption. We note that longer observations of such a partly obscured state would be necessary to constrain more detailed ionised absorption models for the partial coverer 333We note that, e.g., Kosec et al. (2018) combined ks of data to detect the ionised outflow..
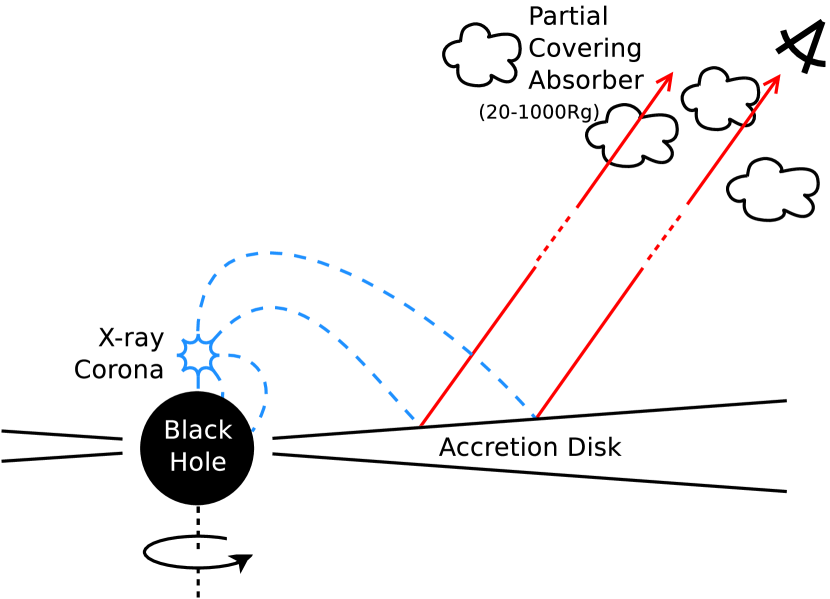
An illustration of the changing partial coverer scenario with relativistic reflection is shown in Fig. 11. Because of gravitational light bending, the majority of the photons emitted from the corona are bent towards the black hole and onto the accretion disc in approximately equal parts (c.f. Fig. 1 and 2 of Dauser et al., 2014b)). While in the high-flux state we have an unobscured view onto the inner parts of the accretion disc, partially covering clouds absorb the reflected spectrum in the lower flux states with increasing covering fraction for a decreasing observed soft X-ray flux.
5.3 Partially covering absorbers and ultra-fast outflows
Outflowing winds launched from the accretion disc by radiation pressure or magnetic fields are considered as an important AGN feedback process. For radiation-pressure-dominated winds, outflows can reach velocities up to about 0.3 c and can drive substantial amounts of material into the interstellar medium. These winds have been discovered mainly based on XMM-Newton observations (e.g. Pounds et al. 2003a, b, c; King & Pounds 2003; Reeves et al. 2003). Outflowing winds with such high velocities have been named as UFOs by Tombesi et al. (2010) in a systematic study of bright XMM-Newton AGNs.
Multiple outflow absorption lines have been detected in one of the most variable AGNs, IRAS 132243809, by (Parker et al., 2017). These latter authors argue that the X-ray emission from within a few gravitational radii of the black hole is ionising the disc winds up to hundreds of . It was also shown that the outflow absorption lines are strongly flux dependent, with strongest being found in the low-flux state and weakest in the high-flux state, which is due to increasing ionisation towards higher flux values. When the ionisation becomes sufficiently high, the outflow may become ‘over-ionised’ and may no longer be visible. Such a scenario was also discussed by Gallo et al. (2019), where absorption features were detected in the beginning of a flare in the NLS1 Mrk 335 but not in the brightest prolonged flare states.
Ionised outflowing winds have been connected to absorbing partial covering by for example Reeves et al. (2018) and references therein. These latter authors argue that the outflowing wind is inhomogeneous and more complex than a simple homogeneous outflow, which is capable of partially covering the X-ray source. In this scenario, the X-ray absorption depends on the ionisation state, the distance of the absorber, and the covering fraction.
The two XMM-Newton observations of PDS 456 reported by Reeves et al. (2018) were made over two consecutive satellite orbits. These latter authors argue that much of the spectral variability between the observations appears to be reproduced by the variability of the low-ionisation partial covering absorber, which is primarily driven by a change of the covering fraction. This appears consistent with the low-flux states and the varying covering fractions reported for PDS 456 and now for 1H 0707 in this paper.
Partial covering absorbers have been put into context with UFOs and winds in several other papers. Reeves et al. (2020) provide a further exploration for the spectral shape and variability of PDS 456, noting in particular the significant differences in the soft-band fit when using neutral and ionised partial-covering components. There are many other works that analyse the soft- and hard-band emission and absorption features in PDS 456, concluding that an outflowing absorber can explain these features as well as the observed variability (e.g. Matzeu et al. 2016b, a; Parker et al. 2018).
A larger sample of Seyfert galaxies analysed in Tombesi et al. (2013) also reveals that many AGNs that display UFO signatures also show evidence for warm absorption, and based on their observed properties, these latter authors propose that these may actually be part of a single large-scale outflow. Simultaneous observations of absorption and outflowing components are also presented for individual sources, including Mrk 335 (Longinotti et al. 2019, but see also Gallo et al. 2019) and PG 1211+143 (Pounds et al. 2016). This lends further support to the idea that such components may be physically linked and appear simultaneously, as in the observations presented in this work.
5.4 Speculations on the partial coverer size and location
Because the absorption is only partial, we can place limits on the projected size of the absorber. For such an extreme configuration of compact corona and large black hole spin, most of the observed flux is due to reflection from within a radius of 5-10 around the black hole (Dauser et al., 2013), suggesting that the absorbing structure is smaller than this scale.
From Fig. 1 we estimate that a first obscuration event is seen between times and for about 20000 seconds where the count rate decreases from the highest count-rate state to the lowest count-rate state. Between and , the count rate increases again but probably with the covering fraction found in the medium-flux state. A third obscuration event might be detected from until the end of the eROSITA observations, where the source is found in the lowest count-rate state with the highest covering fraction.
To estimate the distance of the absorbing cloud we adopt Eq. 2 of Beuchert et al. (2017). Considering cloud number densities from to yields distances from to for the first obscuration event, which assumes Keplerian orbits, corresponding to an orbital velocity of 0.2 c to 0.02 c. To change the covering fraction from the to from less than 0.1 to 0.73 within about 20000 seconds, the projected length of the absorber is in the range of cm to cm, or 0.03 to 0.3 light days. This seems reasonable but we avoid further speculation on distances and sizes of the absorber in order not to over-interpret the available data.
6 Summary
We detected large-amplitude variability with changes of more than a factor of 50 in the eROSITA light curves. The soft band (0.2–0.8 keV) dominates the variability, while in the hard band (0.8–7.0 keV) the variability is much less extreme. We further analysed the soft X-ray light curve, dividing the soft-band light curve into two very soft X-ray light curves in the energy bands (0.2–0.5) keV and (0.5–0.8) keV. Both ultra-soft X-ray light curves are close to identical in their count-rate distributions as a function of time. Above 0.8 keV, the variability abruptly declines up to the highest energies. This behaviour is further confirmed by analysing the normalised excess variance spectra (see Fig. 3), where all instruments detect significant variability up to 0.8 keV, followed by a sharp drop off. This is the first time that such large-amplitude ultra-soft variability has been detected with eROSITA observations in AGNs. There are two sources with similar but less extreme ultra-soft variability behaviour, GSN 069 (Miniutti et al., 2019) and RX J1301.9+2747 (Giustini et al., 2020).
No significant variability was detected in the UV in the XMM-Newton OM observations. The UV emission is relatively constant with , similar to the values reported by Done & Jin (2016) which is close to the Eddington limit. In the combined eROSITA and XMM-Newton observation, 1H 0707495 was caught in a historically low hard-flux state, similar to the low flux state reported by Fabian et al. (2012).
We use the relativistic reflection model relxill (Dauser et al., 2010, 2013; García et al., 2014) to fit the data, and find parameters in good agreement with these latter publications. Spectral changes were investigated by constructing three count-rate-selected spectra, to which the partial covering model TBpcf (Wilms et al., 2000) in combination with the relxill model was applied. The majority of the change in spectral shape during this observation can be fully explained by a varying covering fraction, rather than varying column density or ionisation. We conclude that the large variability of the soft flux detected in the light curve is fully consistent with the varying covering fraction interpretation. These findings strongly suggest that the variability and the large change in soft flux during the observation is caused by an AGN obscuration event. Further evidence in support of this scenario is added by the fact that when 1H 0707495 was observed 6 months later during the eRASS1 survey, its flux returned to the flux level above our unobscured model. eROSITA will observe 1H 0707495 another seven times every 6 months until completing its all-sky scanning mission.
Acknowledgements.
We are grateful to M. Page for his help in the XMM-Newton OM data analysis. We thank the XMM-Newton PS N. Schartel for accepting the simultaneous XMM-Newton observations. MK acknowledges support by DFG grant KR 3338/4-1. We thank the anonymous referee for their careful reading of the submitted manuscript, and for their very helpful comments and suggestions. This work is based on data from eROSITA, the primary instrument aboard SRG, a joint Russian-German science mission supported by the Russian Space Agency (Roskosmos), in the interests of the Russian Academy of Sciences represented by its Space Research Institute (IKI), and the Deutsches Zentrum für Luft- und Raumfahrt (DLR). The SRG spacecraft was built by Lavochkin Association (NPOL) and its subcontractors, and is operated by NPOL with support from the Max-Planck Institute for Extraterrestrial Physics (MPE). The development and construction of the eROSITA X-ray instrument was led by MPE, with contributions from the Dr. Karl Remeis Observatory Bamberg, the University of Hamburg Observatory, the Leibniz Institute for Astrophysics Potsdam (AIP), and the Institute for Astronomy and Astrophysics of the University of Tübingen, with the support of DLR and the Max Planck Society. The Argelander Institute for Astronomy of the University of Bonn and the Ludwig Maximilians Universität Munich also participated in the science preparation for eROSITA. The eROSITA data shown here were processed using the eSASS/NRTA software system developed by the German eROSITA consortium.References
- Ai et al. (2013) Ai, Y. L., Yuan, W., Zhou, H., et al. 2013, AJ, 145, 90
- Arcodia et al. (2019) Arcodia, R., Merloni, A., Nandra, K., & Ponti, G. 2019, A&A, 628, A135
- Beuchert et al. (2017) Beuchert, T., Markowitz, A. G., Dauser, T., et al. 2017, A&A, 603, A50
- Boller et al. (1997) Boller, T., Brandt, W. N., Fabian, A. C., & Fink, H. H. 1997, MNRAS, 289, 393
- Boller et al. (1996) Boller, T., Brandt, W. N., & Fink, H. 1996, A&A, 305, 53
- Boller et al. (2002) Boller, T., Fabian, A. C., Sunyaev, R., et al. 2002, MNRAS, 329, L1
- Boller et al. (2016) Boller, T., Freyberg, M. J., Trümper, J., et al. 2016, A&A, 588, A103
- Boroson & Green (1992) Boroson, T. A. & Green, R. F. 1992, in American Institute of Physics Conference Series, Vol. 254, American Institute of Physics Conference Series, ed. S. S. Holt, S. G. Neff, & C. M. Urry, 584–587
- Brandt et al. (1994) Brandt, W. N., Fabian, A. C., Nandra, K., Reynolds, C. S., & Brinkmann, W. 1994, MNRAS, 271, 958
- Brandt et al. (1995) Brandt, W. N., Pounds, K. A., & Fink, H. 1995, MNRAS, 273, L47
- Brunner et al. (2018) Brunner, H., Boller, T., Coutinho, D., et al. 2018, in Society of Photo-Optical Instrumentation Engineers (SPIE) Conference Series, Vol. 10699, Space Telescopes and Instrumentation 2018: Ultraviolet to Gamma Ray, 106995G
- Brunner, H. et al (2020) Brunner, H. et al. 2020, A&A, to be submitted
- Buisson et al. (2017) Buisson, D. J. K., Lohfink, A. M., Alston, W. N., & Fabian, A. C. 2017, MNRAS, 464, 3194
- Cash (1979) Cash, W. 1979, ApJ, 228, 939
- Dauser et al. (2014a) Dauser, T., Garcia, J., Parker, M. L., Fabian, A. C., & Wilms, J. 2014a, MNRAS, 444, L100
- Dauser et al. (2014b) Dauser, T., Garcia, J., Parker, M. L., Fabian, A. C., & Wilms, J. 2014b, MNRAS, 444, L100
- Dauser et al. (2016) Dauser, T., García, J., Walton, D. J., et al. 2016, A&A, 590, A76
- Dauser et al. (2013) Dauser, T., Garcia, J., Wilms, J., et al. 2013, MNRAS, 430, 1694
- Dauser et al. (2012) Dauser, T., Svoboda, J., Schartel, N., et al. 2012, MNRAS, 422, 1914
- Dauser et al. (2010) Dauser, T., Wilms, J., Reynolds, C. S., & Brenneman, L. W. 2010, MNRAS, 409, 1534
- den Herder et al. (2001) den Herder, J. W., Brinkman, A. C., Kahn, S. M., et al. 2001, A&A, 365, L7
- Done & Jin (2016) Done, C. & Jin, C. 2016, MNRAS, 460, 1716
- Done et al. (2007) Done, C., Sobolewska, M. A., Gierliński, M., & Schurch, N. J. 2007, MNRAS, 374, L15
- Fabian et al. (2002) Fabian, A. C., Ballantyne, D. R., Merloni, A., et al. 2002, MNRAS, 331, L35
- Fabian et al. (2004) Fabian, A. C., Miniutti, G., Gallo, L., et al. 2004, MNRAS, 353, 1071
- Fabian et al. (2009) Fabian, A. C., Zoghbi, A., Ross, R. R., et al. 2009, Nature, 459, 540
- Fabian et al. (2012) Fabian, A. C., Zoghbi, A., Wilkins, D., et al. 2012, MNRAS, 419, 116
- Foreman-Mackey et al. (2013) Foreman-Mackey, D., Hogg, D. W., Lang, D., & Goodman, J. 2013, PASP, 125, 306
- Forster & Halpern (1996) Forster, K. & Halpern, J. P. 1996, ApJ, 468, 565
- Gallo (2006) Gallo, L. C. 2006, MNRAS, 368, 479
- Gallo et al. (2019) Gallo, L. C., Gonzalez, A. G., Waddell, S. G. H., et al. 2019, MNRAS, 484, 4287
- Gallo et al. (2004) Gallo, L. C., Tanaka, Y., Boller, T., et al. 2004, MNRAS, 353, 1064
- García et al. (2014) García, J., Dauser, T., Lohfink, A., et al. 2014, ApJ, 782, 76
- García et al. (2013) García, J., Dauser, T., Reynolds, C. S., et al. 2013, ApJ, 768, 146
- Giustini et al. (2020) Giustini, M., Miniutti, G., & Saxton, R. D. 2020, A&A, 636, L2
- Goodrich (1989) Goodrich, R. W. 1989, ApJ, 342, 224
- Grevesse et al. (1996) Grevesse, N., Noels, A., & Sauval, A. J. 1996, in Astronomical Society of the Pacific Conference Series, Vol. 99, Cosmic Abundances, ed. S. S. Holt & G. Sonneborn, 117
- Grupe et al. (1995) Grupe, D., Beuerman, K., Mannheim, K., et al. 1995, A&A, 300, L21
- Hagino et al. (2016) Hagino, K., Odaka, H., Done, C., et al. 2016, MNRAS, 461, 3954
- Hayashida (1997) Hayashida, K. 1997, in Astronomical Society of the Pacific Conference Series, Vol. 113, IAU Colloq. 159: Emission Lines in Active Galaxies: New Methods and Techniques, ed. B. M. Peterson, F.-Z. Cheng, & A. S. Wilson, 40
- HI4PI Collaboration et al. (2016) HI4PI Collaboration, Ben Bekhti, N., Flöer, L., et al. 2016, A&A, 594, A116
- Jansen et al. (2001) Jansen, F., Lumb, D., Altieri, B., et al. 2001, A&A, 365, L1
- Jones et al. (2009) Jones, D. H., Read, M. A., Saunders, W., et al. 2009, MNRAS, 399, 683
- Kaastra & Bleeker (2016) Kaastra, J. S. & Bleeker, J. A. M. 2016, A&A, 587, A151
- Kammoun et al. (2019) Kammoun, E. S., Nardini, E., Zoghbi, A., et al. 2019, ApJ, 886, 145
- Kara et al. (2015) Kara, E., Fabian, A. C., Lohfink, A. M., et al. 2015, MNRAS, 449, 234
- Katayama et al. (2001) Katayama, H., Hayashida, K., & Hashimotodani, K. 2001, PASJ, 53, 1133
- King & Pounds (2003) King, A. R. & Pounds, K. A. 2003, MNRAS, 345, 657
- Kosec et al. (2018) Kosec, P., Buisson, D. J. K., Parker, M. L., et al. 2018, MNRAS, 481, 947
- Laha et al. (2020) Laha, S., Markowitz, A. G., Krumpe, M., et al. 2020, ApJ, 897, 66
- Laor et al. (1997) Laor, A., Fiore, F., Elvis, M., Wilkes, B. J., & McDowell, J. C. 1997, ApJ, 477, 93
- Leighly & Moore (2004) Leighly, K. M. & Moore, J. R. 2004, ApJ, 611, 107
- Leighly et al. (1996) Leighly, K. M., Mushotzky, R. F., Yaqoob, T., Kunieda, H., & Edelson, R. 1996, ApJ, 469, 147
- Liu et al. (2016) Liu, Z., Merloni, A., Georgakakis, A., et al. 2016, MNRAS, 459, 1602
- Longinotti et al. (2019) Longinotti, A. L., Kriss, G., Krongold, Y., et al. 2019, ApJ, 875, 150
- Lusso & Risaliti (2016) Lusso, E. & Risaliti, G. 2016, ApJ, 819, 154
- Markowitz et al. (2014) Markowitz, A. G., Krumpe, M., & Nikutta, R. 2014, MNRAS, 439, 1403
- Mason et al. (2001) Mason, K. O., Breeveld, A., Much, R., et al. 2001, A&A, 365, L36
- Matzeu et al. (2016a) Matzeu, G. A., Reeves, J. N., Nardini, E., et al. 2016a, Astronomische Nachrichten, 337, 495
- Matzeu et al. (2016b) Matzeu, G. A., Reeves, J. N., Nardini, E., et al. 2016b, MNRAS, 458, 1311
- Merloni et al. (2006) Merloni, A., Malzac, J., Fabian, A. C., & Ross, R. R. 2006, MNRAS, 370, 1699
- Merloni et al. (2012) Merloni, A., Predehl, P., Becker, W., et al. 2012, arXiv e-prints, arXiv:1209.3114
- Miller & Turner (2013) Miller, L. & Turner, T. J. 2013, ApJ, 773, L5
- Miniutti et al. (2019) Miniutti, G., Saxton, R. D., Giustini, M., et al. 2019, Nature, 573, 381
- Nandra et al. (1997) Nandra, K., George, I. M., Mushotzky, R. F., Turner, T. J., & Yaqoob, T. 1997, ApJ, 476, 70
- Osterbrock & Pogge (1985) Osterbrock, D. E. & Pogge, R. W. 1985, ApJ, 297, 166
- Page et al. (2012) Page, M. J., Brindle, C., Talavera, A., et al. 2012, MNRAS, 426, 903
- Parker et al. (2017) Parker, M. L., Pinto, C., Fabian, A. C., et al. 2017, Nature, 543, 83
- Parker et al. (2018) Parker, M. L., Reeves, J. N., Matzeu, G. A., Buisson, D. J. K., & Fabian, A. C. 2018, MNRAS, 474, 108
- Pawar et al. (2017) Pawar, P. K., Dewangan, G. C., Papadakis, I. E., et al. 2017, MNRAS, 472, 2823
- Ponti et al. (2004) Ponti, G., Cappi, M., Dadina, M., & Malaguti, G. 2004, A&A, 417, 451
- Pounds et al. (2003a) Pounds, K. A., King, A. R., Page, K. L., & O’Brien, P. T. 2003a, MNRAS, 346, 1025
- Pounds et al. (2016) Pounds, K. A., Lobban, A., Reeves, J. N., Vaughan, S., & Costa, M. 2016, MNRAS, 459, 4389
- Pounds et al. (2003b) Pounds, K. A., Reeves, J. N., King, A. R., et al. 2003b, MNRAS, 345, 705
- Pounds et al. (2003c) Pounds, K. A., Reeves, J. N., Page, K. L., Wynn, G. A., & O’Brien, P. T. 2003c, MNRAS, 342, 1147
- Predehl (2012) Predehl, P. 2012, in Society of Photo-Optical Instrumentation Engineers (SPIE) Conference Series, Vol. 8443, Proc. SPIE, 84431R
- Predehl et al. (2020) Predehl, P., Andritschke, R., Arefiev, V., et al. 2020, A&A, in press
- Reeves et al. (2008) Reeves, J., Done, C., Pounds, K., et al. 2008, MNRAS, 385, L108
- Reeves et al. (2020) Reeves, J. N., Braito, V., Chartas, G., et al. 2020, ApJ, 895, 37
- Reeves et al. (2018) Reeves, J. N., Braito, V., Nardini, E., et al. 2018, ApJ, 867, 38
- Reeves et al. (2003) Reeves, J. N., O’Brien, P. T., & Ward, M. J. 2003, ApJ, 593, L65
- Risaliti (2013) Risaliti, G. 2013, in From the Dolomites to the Event Horizon: Sledging Down the Black Hole Potential Well, 29
- Robertson et al. (2015) Robertson, D. R. S., Gallo, L. C., Zoghbi, A., & Fabian, A. C. 2015, MNRAS, 453, 3455
- Strüder et al. (2001) Strüder, L., Briel, U., Dennerl, K., et al. 2001, A&A, 365, L18
- Szanecki et al. (2020) Szanecki, M., Niedzwiecki, A., Done, C., et al. 2020, arXiv e-prints, arXiv:2006.15016, submitted to A&A
- Tanaka et al. (2005) Tanaka, Y., Boller, T., & Gallo, L. 2005, in Growing Black Holes: Accretion in a Cosmological Context, ed. A. Merloni, S. Nayakshin, & R. A. Sunyaev, 290–295
- Tombesi et al. (2013) Tombesi, F., Cappi, M., Reeves, J. N., et al. 2013, MNRAS, 430, 1102
- Tombesi et al. (2010) Tombesi, F., Cappi, M., Reeves, J. N., et al. 2010, A&A, 521, A57
- Trümper (1984) Trümper, J. 1984, in X-ray and UV Emission from Active Galactic Nuclei, ed. W. Brinkmann & J. Truemper, 254–260
- Turner et al. (2001) Turner, M. J. L., Abbey, A., Arnaud, M., et al. 2001, A&A, 365, L27
- Vaughan et al. (2003) Vaughan, S., Edelson, R., Warwick, R. S., & Uttley, P. 2003, MNRAS, 345, 1271
- Voges et al. (1999) Voges, W., Aschenbach, B., Boller, T., et al. 1999, A&A, 349, 389
- Wilms et al. (2000) Wilms, J., Allen, A., & McCray, R. 2000, ApJ, 542, 914
- Zoghbi et al. (2010) Zoghbi, A., Fabian, A. C., Uttley, P., et al. 2010, MNRAS, 401, 2419
Appendix A Amplitude variability as a function of energy
We analysed the amplitude variability in each of the energy bands. In Fig. 12 we show the eROSITA light curves in three individual energy bands. The variability is dominant in the energy band up to 0.8 keV, with a sudden drop in variability above 0.8 keV.
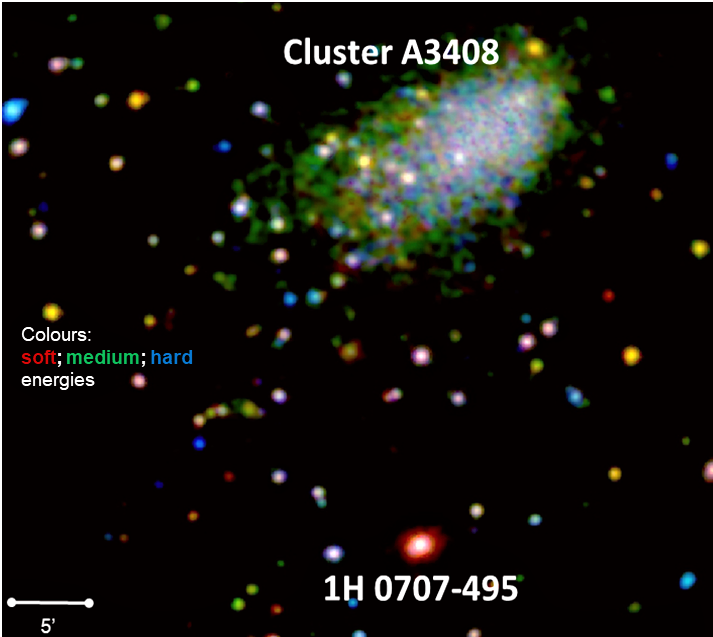
Appendix B eROSITA PV observation RGB image
In Fig. 13 we show the eROSITA image obtained during the PV phase observations. The objects are colour coded. Thanks to the large field of view of eROSITA , the galaxy cluster A3408 was also serendipitously covered in addition to the super-soft source 1H 0707495. This resulted in the best imaging information for this cluster to date compared to ASCA observations (Katayama et al. 2001), revealing a very elongated morphology. The cluster is being studied in detail for a separate publication (Iljenkarevic et al., in prep.).