Kinematic complexity around NGC 419: resolving the proper motion of the cluster, the Small Magellanic Cloud and the Magellanic Bridge
Abstract
We present Hubble Space Telescope proper motions in the direction of the star cluster NGC 419 in the Small Magellanic Cloud. Because of the high precision of our measurements, for the first time it is possible to resolve the complex kinematics of the stellar populations located in the field, even along the tangential direction. In fact, the proper motions we measured allow us to separate cluster stars, which move on average with () = (, ) mas yr-1, from those of the Small Magellanic Cloud and those belonging to a third kinematic feature that we recognise as part of the Magellanic Bridge. Resolving such a kinematic complexity enables the construction of decontaminated colour-magnitude diagrams, as well as the measurement of the absolute proper motion of the three separate components. Our study therefore sets the first steps towards the possibility of dynamically investigating the Magellanic system by exploiting the resolved kinematics of its stellar clusters.
keywords:
galaxies: individual: Magellanic Clouds - proper motions - techniques: photometric - galaxies: kinematics and dynamics1 Introduction
Star clusters are powerful tracers to investigate the formation and the evolutionary history of their host galaxies; in this respect, the study of their kinematics provides a wealth of information. The most immediate example is provided by the globular clusters (GCs) system of the Milky Way. Thanks to the recent combined availability of proper motion and spectroscopic radial velocity measurements, the orbits around the Milky Way for almost all of the known GC have been determined with great accuracy (Gaia Collaboration, et al. 2018; Vasiliev 2019; Baumgardt, et al. 2019). By building up on these measurements, Massari, Koppelman & Helmi (2019) computed the GCs integrals of motion and were thus able to associate them to known (Ibata, Gilmore, & Irwin 1994; Helmi et al. 2018; Koppelman et al. 2019; Myeong et al. 2019) and yet-to-be-discovered merger events that shaped the evolution of the Milky Way to its current structure (Kruijssen, et al. 2020).
However, this kind of analysis is currently only feasible for the GC system of our Galaxy. The reason is that other extra-Galactic GC systems are too far away to be able to discern their proper motions from that of the hosting galaxy. In fact, the typical velocity difference between a globular cluster and the stars of the surrounding environment is of the order of several tens of km s-1, so that the required proper motion precision to resolve such a difference is of few tens of as yr-1 and increases linearly with the distance. In the case of clusters embedded within the bulge of the hosting galaxy the situation is even worse, as the required velocity resolution drops to 5–10 km s-1. Yet, even with the limited information provided by radial velocity alone, Mackey, et al. (2019) were able to exploit the kinematics of the GC system of M31 to conclude that the galaxy likely experienced two significant merger events. Adding the full three-dimensional kinematic information would therefore enable a much more detailed reconstruction of the evolutionary history of the galaxy.
One of the closest among other star cluster systems in the Local Group is that of the Magellanic Clouds (MCs). Despite being small satellites of the Milky Way (van der Marel, et al. 2002; van der Marel & Kallivayalil 2014), according to CDM cosmology they should still have experienced a complex history of merging events (e.g., Sales, et al. 2013), and such a prediction has been recently supported by the dynamical confirmation that some of the ultra-faint dwarf galaxies orbiting the Milky Way are actually satellites of the Large Magellanic Cloud (LMC, Kallivayalil, et al. 2018; Erkal & Belokurov 2020; Patel, et al. 2020). Moreover, the existence of the Magellanic Bridge connecting the Large and the Small MCs (SMC) is a further evidence of interactions between the two (Zivick, et al. 2019). Investigating the kinematics of the MCs star clusters system could therefore help reconstructing the MCs past history, yet resolving the clusters motion from that of the MC stellar populations has so far proved to be beyond the capabilities of current instrumentation like the Gaia mission.
One of the most effective ways to push the limits of astrometric measurements beyond the current boundaries is to increase, whenever possible, the temporal separation between different epochs of observations of the same object. In this respect, the Hubble Space Telescope (HST) is often superior to Gaia, as the latter is bound to scan the sky only for five years during the nominal duration of the mission. This is why the most precise stellar proper motions have been measured either by HST (Bellini, et al. 2018; Libralato, et al. 2018, 2019) or by a combination of the two space-based telescopes (Massari, et al. 2018, 2020). In this paper, we combine a set of long temporal baseline HST observations of the SMC cluster NGC 419 with the aim of resolving its motion from that of the surrounding stars. The success in achieving this objective could pave the road for the systematic investigation of the resolved 3D kinematics of the star clusters system of the MCs.
2 Data analysis
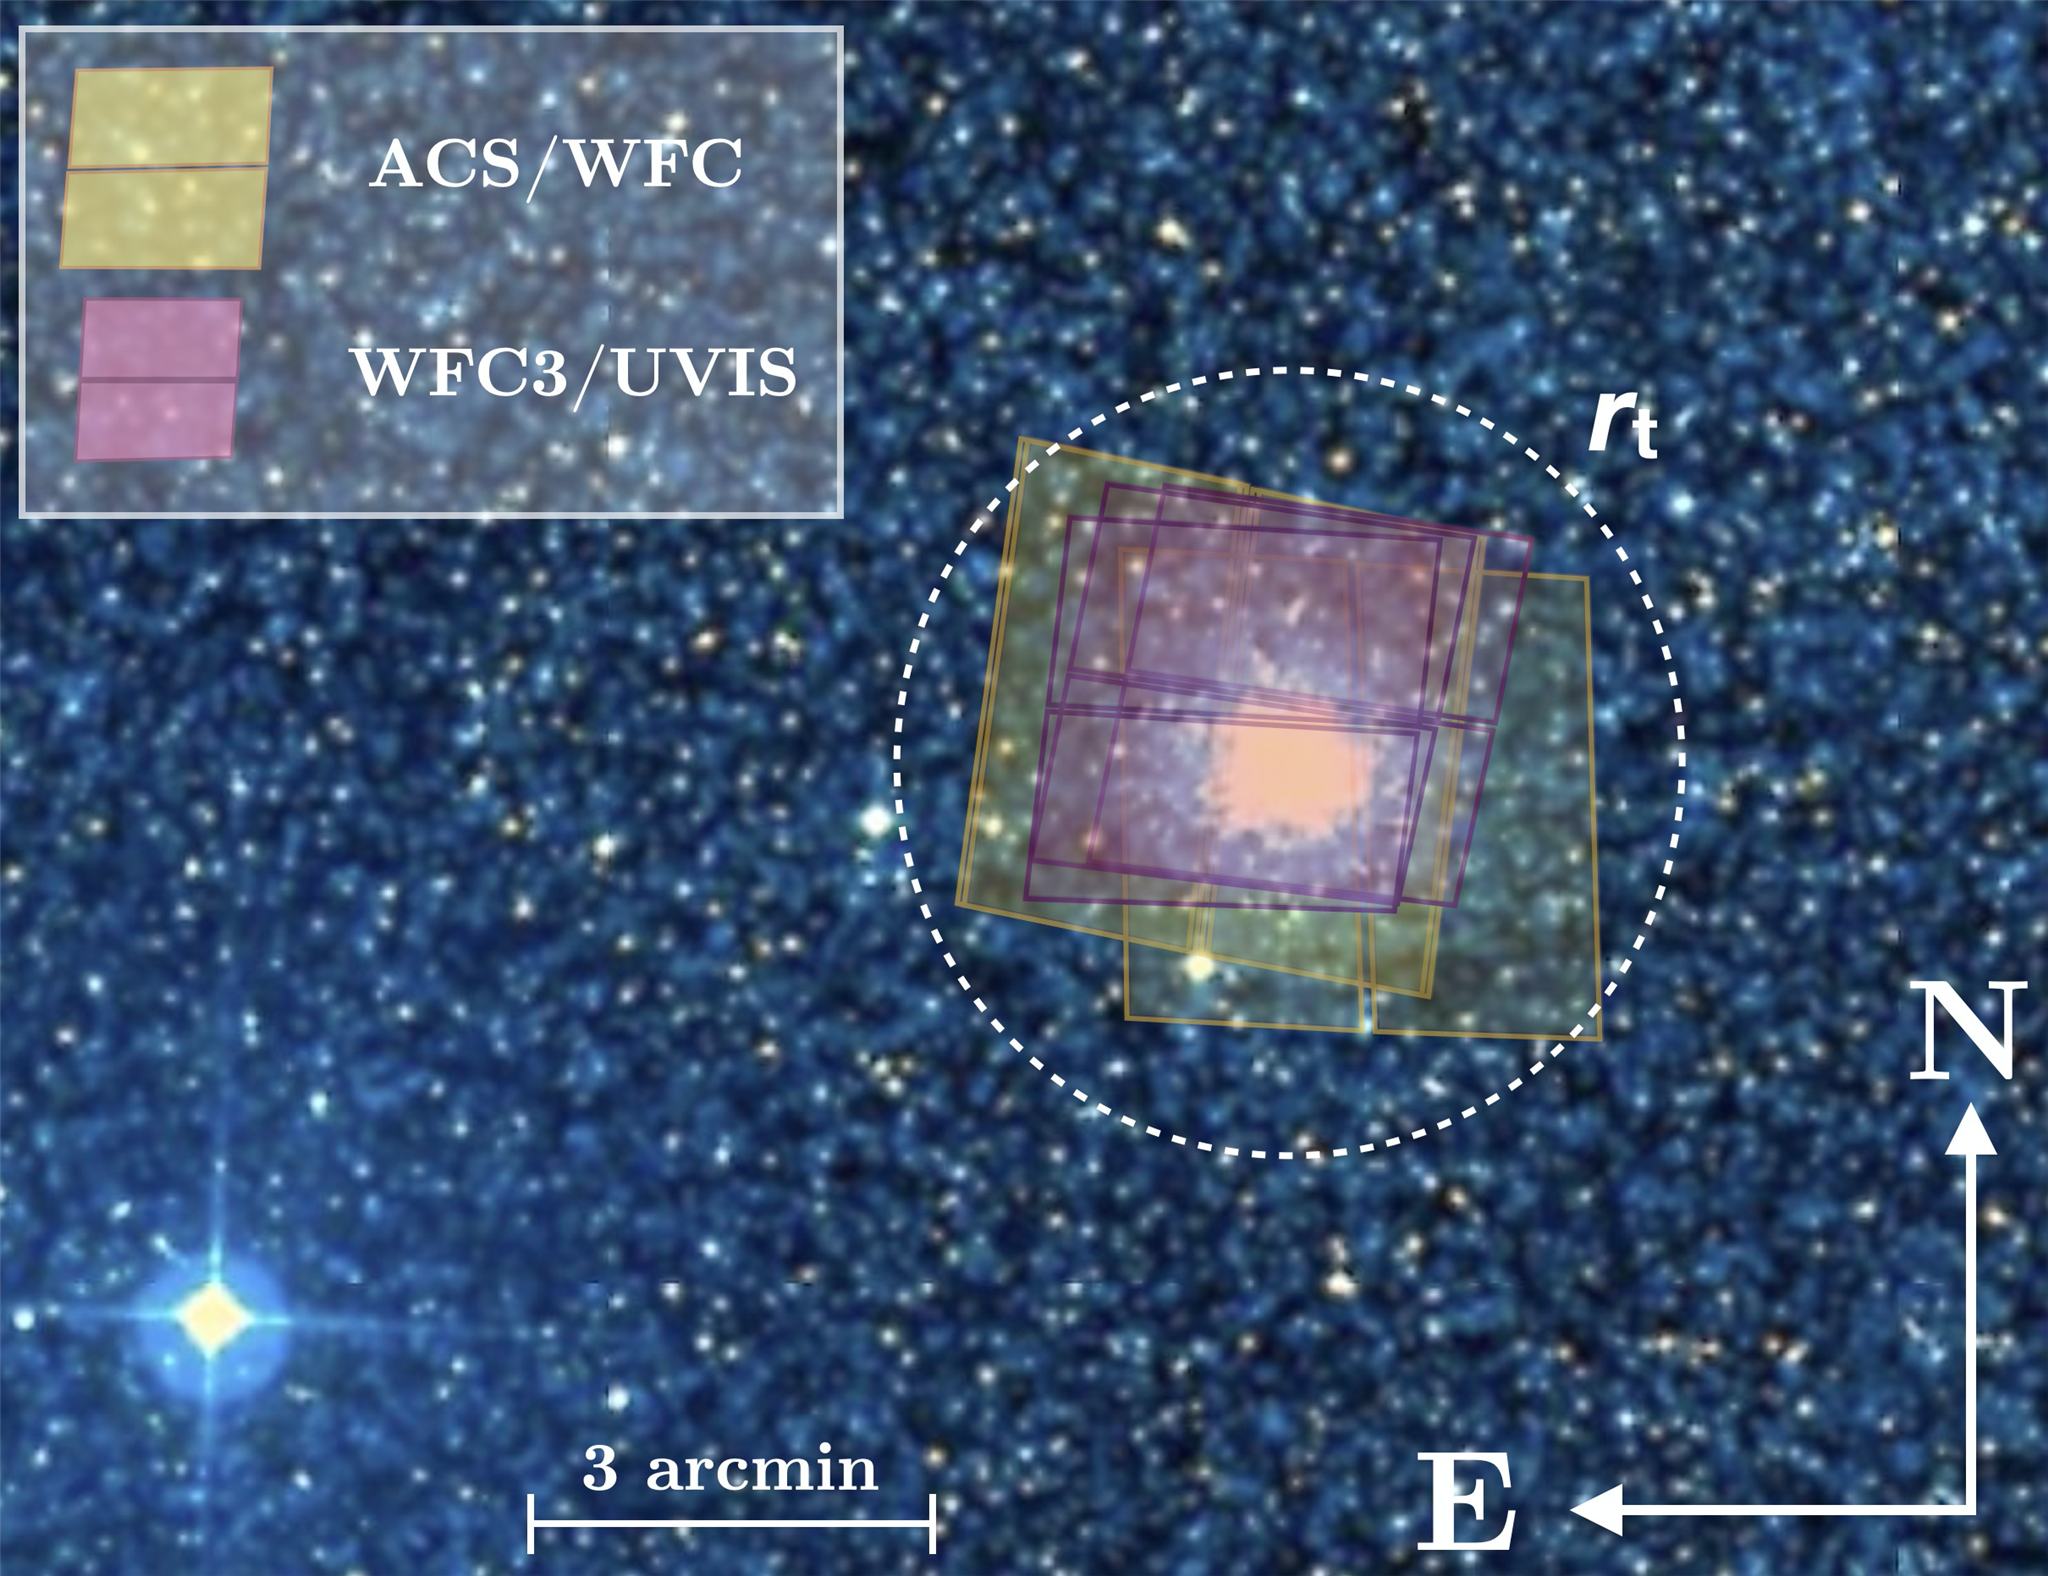
We made use of the available HST images of NGC 419 from the Ultraviolet and Visible (UVIS) channel of the Wide Field Camera 3 (WFC3), obtained with the F336W and F438W filters, and from the Wide Field Channel (WFC) of the Advanced Camera for Surveys (ACS), obtained with the F555W and F814W filters. The list of the observations is given in Table 1, and the on-sky distrbution of each data set is shown in Fig. 1.
| Program ID | PI | Epoch | Camera | Filter | Exposures |
| (yyyy/mm) | N | ||||
| GO-10396 | J. Gallagher | 2006/01 | ACS/WFC | F555W | |
| F814W | |||||
| 2006/07 | ACS/WFC | F555W | |||
| F814W | |||||
| GO-12257 | L. Girardi | 2011/08 | WFC3/UVIS | F336W | |
| GO-14069 | N. Bastian | 2016/08 | WFC3/UVIS | F438W | |
| GO-15061 | N. Bastian | 2018/09 | WFC3/UVIS | F336W | |
| F438W |
The photometric reduction was performed on the _flc images,
which preserve the un-resampled pixel data for the stellar profile
fitting and are corrected to remove charge transfer efficiency (CTE,
see Anderson & Bedin 2010), following the prescription given in
Bellini et al. (2017); Bellini, et al. (2018). We refer to the aforementioned papers
for a detailed description of the photometric reduction procedure,
which we only briefly summarise in the following. We first
created a list of bright objects in the field through a one-pass,
single finding procedure without neighbour subtraction, making use of
spatially variable library point-spread-function (PSF) of the
HST detectors111Publicly available at
http://www.stsci.edu/~jayander/STDPSFs/., which we fine-tuned
to each image using a set of bright, unsaturated and relatively
isolated stars.
We corrected stellar positions for
geometric distortion with the solutions reported in Anderson & King (2006); Bellini & Bedin (2009); Bellini, Anderson, & Bedin (2011). Secondly, we used the software KS2
(see Bellini et al. 2017 for details) for a multi-pass photometry.
This software is able to simultaneously perform the finding procedure
on all the images and to subtract neighbouring sources. In this step,
the stellar positions in each exposure are transformed, by means of
six-parameter linear transformations, onto a common reference frame
system, based on the stellar positions in the Gaia Data Release 2
(DR2) catalogue (Gaia Collaboration et al. 2018). We calibrated the magnitudes to
the VEGAMAG photometric system as described in
Bellini et al. (2017) and Raso et al. (2019), by adding to the instrumental
magnitudes the photometric zero point of the considered filter, and
the 3-clipped median difference between the aperture
photometry222The aperture photometry has been measured on the
_drc images with a 8-pixel aperture, and corrected for the
finite aperture, see
https://stsci.edu/hst/instrumentation/wfc3/data-analysis/photometric-calibration.
and the instrumental magnitudes.
The calibrated colour-magnitude diagram (CMD) of NGC 419 is shown in Fig. 2. The high photometric quality achieved allows us to recognise the complexity of the field in terms of stellar populations. The majority of the measured stars is expected to belong to the stellar cluster NGC 419, of which it is easily possible to identify the extended main sequence turn-off (eMSTO) and the sub-giant branch (SGB) regions. The surrounding SMC is clearly contaminating the CMD, as is evident from the young main sequence populating its bluest region. Yet, the way the SMC contaminates the cluster CMD is very difficult to describe precisely, because of the intrinsic variety of its stellar populations. This is one of the aspects that our proper motion analysis will help to solve.
After the photometric reduction, a number of stars were rejected as poorly measured, based on several quality criteria. In particular, the sources that survived this photometric selection (about 34 000) were those for which (i) the quality of the PSF fit described by the QFIT333The QFIT value corresponds to the linear correlation coefficient between the pixel values and the PSF model. parameter (Bellini et al. 2017) is better than the 95th percentile of its distribution at any magnitude, (ii) the shape parameter RADSX (Bedin et al. 2008) is lower than the 95th percentile of its distribution at any magnitude, (iii) the fraction of light from neighbouring sources within the fitting radius is not larger than the light from the source itself.
2.1 Relative proper motions
Relative PMs were measured using the technique developed by Bellini et al. (2014) and improved in Bellini, et al. (2018) and Libralato, et al. (2018). A detailed description of the procedure, which we only briefly summarise here, can be found in those papers. The procedure to measure the relative PMs is iterative. Each iteration starts by cross-identifying stars in the raw catalogue of each exposure with those on the master frame, once their positions have been PM-shifted at the epoch of the raw catalogue. A six-parameter linear transformation determined using a set of reference bright and unsaturated cluster members is employed at this step. The use of cluster members is the reason why the PMs are measured relative to the bulk motion of the cluster, and thus have a zero mean value by definition. At the first iteration, stellar PMs are assumed to be zero, so that cluster members are defined based on their location on the CMD. For each star, the master-frame transformed positions as a function of epoch are fit with a least-squares straight line, the slope of which is a direct estimate of the star’s PM. This fitting procedure is itself iterated after data rejection and sigma clipping. The last least-squares fit is performed with locally-transformed master-frame stellar positions, based on the closest 45 reference stars, as this helps in correcting possible local geometric distortion residuals and thus in mitigating small-scale systematic effects. At the end of each iteration, the stellar cross-identification between the single exposures and master frames is improved by adjusting the master frame positions to match the epoch of each observation. The iterative process converges when the difference between master-frame positions from one iteration to the next are negligible. After convergence, we checked and corrected for spatially variable and colour-dependent systematic effects as described in Bellini et al. (2014).
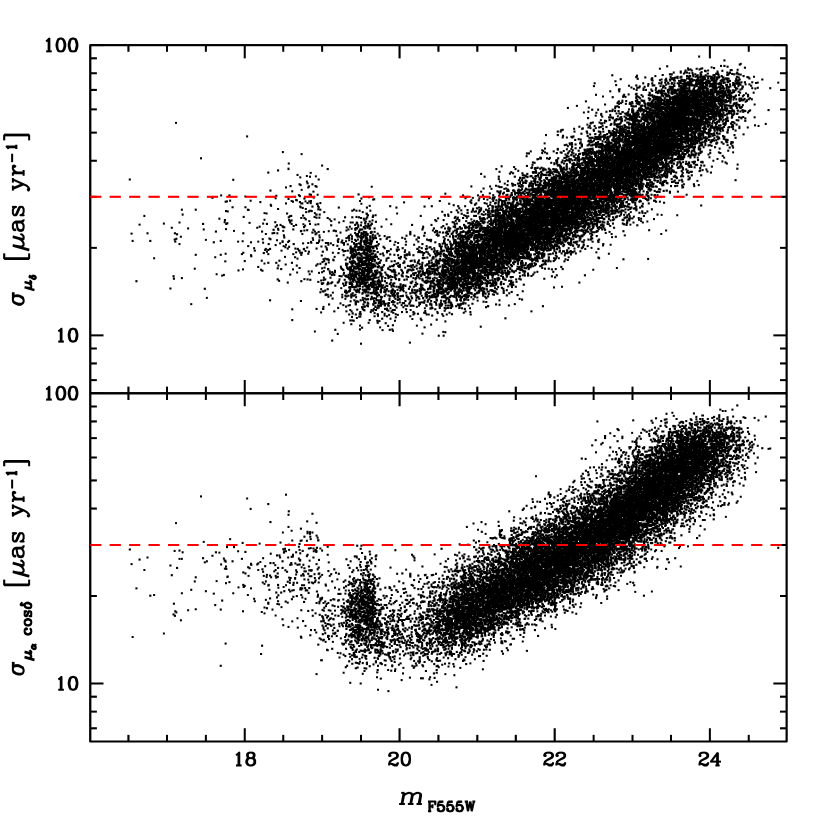
Astrometric quality criteria were also applied in order to only select stars with reliable measurements. In particular, by following the prescriptions given in Libralato, et al. (2019), we accepted stars for which (i) the reduced of the PM fit is smaller than two in both PM components, (ii) the fraction of positional measurements effectively used for the PM fit is larger than 90%, (iii) the error on the PM is smaller than the 95th percentile of the its distribution at any magnitude and (iv) the error on the PM is smaller than 0.1 mas yr-1. This leaved us with a total high-quality sample of about 19 000 stars. The behaviour of the PM uncertainty (see Bellini, et al. 2018 for the details of its derivation) as a function of the magnitude for this sample is shown in Fig. 3, where the best sources reach a PM precision of 10 as yr-1.
2.2 Absolute proper motions
HST relative astrometry has been
historically brought to an absolute system using background galaxies
and quasars, since their absolute motions are known to be null due to
their large distance. The main limitation of this method is the low
number of this kind of faint objects in the typical HST field,
combined with shallow exposures times and stellar crowdining. The
typical precision achieved on the absolute PM zero points (ZPs) using
background anchors varies from (Sohn et al. 2017) to 0.1–0.2
mas yr-1 (Massari et al. 2013, Libralato, et al. 2019), depending on each
individual case. This limitation can in principle be overcome by using
Gaia stars as a reference, as they are bright in HST images and
significantly more numerous than suitable extragalactic calibrators, thus
offering more accurate and precise registration to an absolute
astrometric system (e.g., Libralato et al. 2020).
For this reason, in this study we determined the
absolute PM zero points using the Gaia DR2
stars (Gaia Collaboration et al. 2018) that are in common with our high-quality
sample. The cross-match between the Gaia and our HST
catalogues has been performed by means of the CataPack suit of
software444http://davide2.bo.astro.it/~paolo/Main/CataPack.html. The
adopted distance criterion for two stars to be matched is to have a
separation smaller than 0.4 arcsec (which corresponds to the effective
angular resolution of the Gaia DR2 observations, see
Lindegren et al. 2018) and a difference in magnitude smaller than one
mag. In this way, we select 1755 stars having both HST and Gaia proper motions. Before estimating the absolute zero point,
though, we apply some further quality cuts in order to have the best
possible reference sample. In particular, we excluded all of the stars
with renormalised unit weight error (ruwe)
(Lindegren et al. 2018), stars with Gaia proper motion
uncertainty larger than 0.3 mas yr-1 and stars within a distance
of 50 arcsec from the cluster centre, where crowding is more severe
for Gaia. This leaves us with a total of 105 reference stars.
The application of the 0.1 mas yr-1 PM error cut adopted for
HST stars would have included only 24 stars, and this is why we
chose a more generous cut for the Gaia stars. The difference
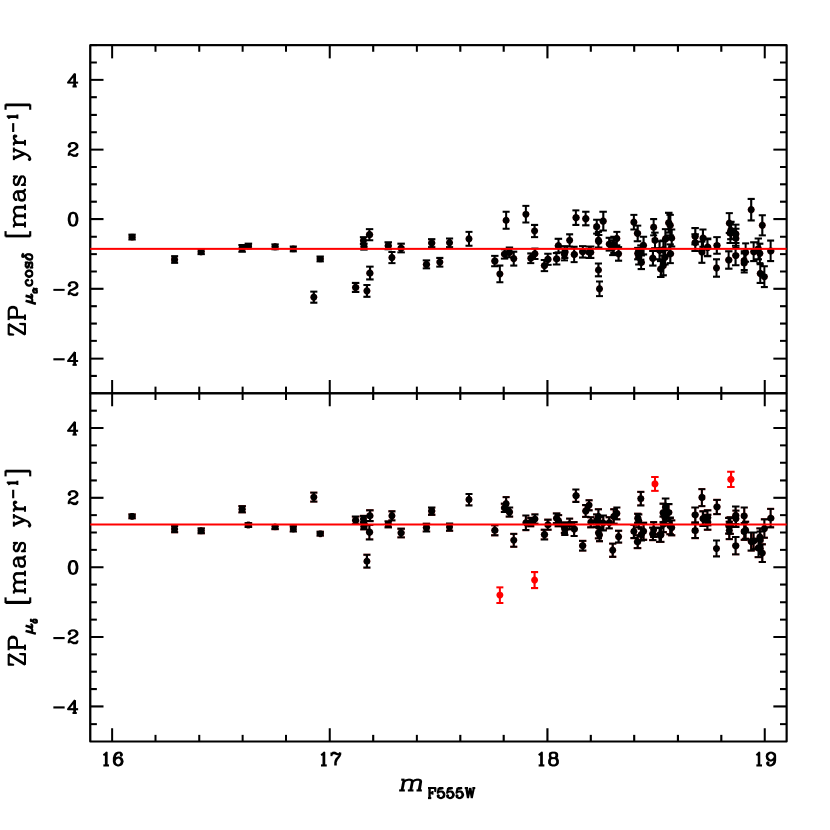
between the selected HST and Gaia proper motions is shown
in Fig. 4, where the error bars represent the associated
uncertainties, and each PM component is plotted separately. In
order to determine the absolute zero points (ZPs), we finally applied an
iterative 3-clipping algorithm (rejected stars are shown in
red in Fig. 4) that provided the following
solution:
ZP mas yr-1
ZP mas yr-1,
where the quoted uncertainties are the sum in quadrature of two
terms. The first term is given by the standard error of the
mean value of the two distributions, while the second term describes
the Gaia systematic error on its PMs, and amounts to 0.03 mas yr-1
(see Gaia Collaboration, et al. 2018). Neither of the two proper motion
zero points shows a trend with stellar magnitude, further supporting
the quality of our selection.
Parallax effects on the measured astrometric shifts among the different epochs should also be quantified, as they are a source of systematic errors in our analysis. The mean Gaia parallax of the stars used to determine the ZPs is mas, while for the sources located in the SMC we can assume a typical parallax mas. By following the prescriptions given in Massari et al. (2013), such a difference in parallax translates to a maximum apparent PM of 0.008 mas yr-1, which is negligible when compared to the uncertainty on the absolute PM ZPs.
The vector point diagram (VPD) resulting from the application of the zero points is shown in Fig.5. A further cut on the PM error, which we require to be smaller than 30 as yr-1 in both components (see the dashed red lines in Fig. 3), has been applied in order to highlight the most important kinematical features, and will be maintained throughout the rest of the analysis unless stated differently.

3 Population selections and results
The aim of our analysis is to distinguish NGC 419 members from the surrounding SMC stars by exploiting their kinematics. In order to do so we require two clean samples of stars belonging to the two different populations. We remark that we do not care about how complete these samples are at this stage, but rather that the contamination from other populations is as little as possible.
3.1 NGC 419
To select stars belonging to the star cluster, we adopted the following criteria:
-
) we only considered stars closer than 40 arcsec from NGC 419 centre, as the density of its members is obviously higher in the innermost regions;
-
) we selected stars within 80 as yr-1 from the mean motion of the bulk of sources in the VPD, which is at (0,0) mas yr-1 of the relative proper motion VPD, by construction.
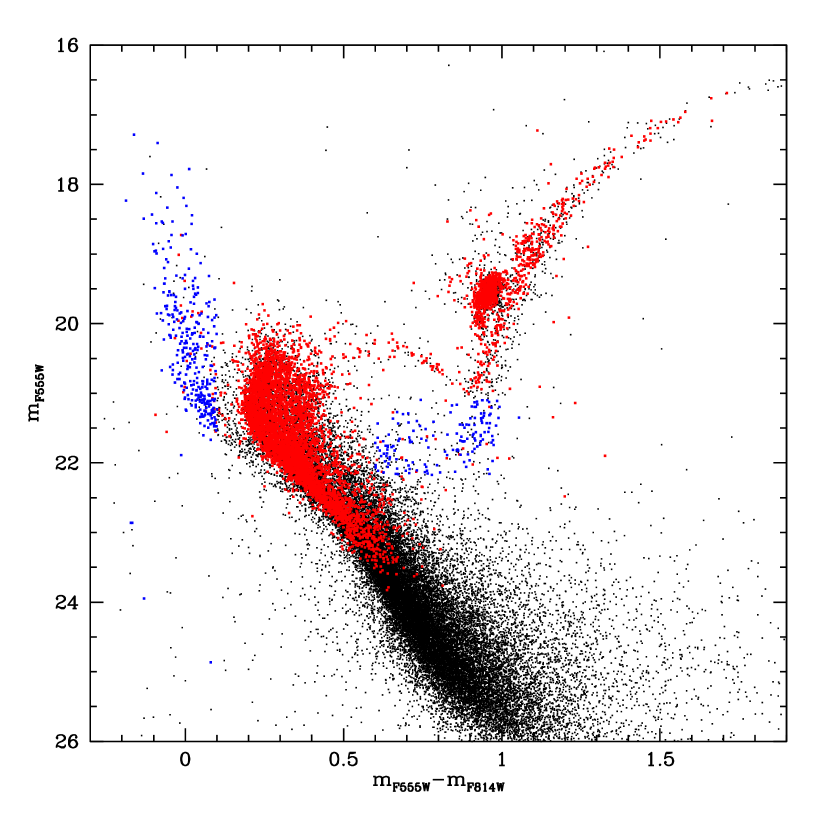
The location on the CMD of this sample of NGC 419 stars is shown with red dots in the left panel of Fig. 6. NGC 419 is one of the first star clusters where an extended main sequence turn off has been detected (Glatt et al. 2008). Our selection leads to a CMD where this feature and the fainter main sequence are defined remarkably well, as well as the more evolved giant branches. Another peculiar photometric feature of NGC 419 is the so-called secondary red clump, which according to Girardi, Rubele, & Kerber (2009) is due to the simultaneous presence in the cluster of stars that burn Helium in degenerate and non-degenerate cores. These authors had already shown that the secondary red-clump is likely a genuine feature of the cluster, rather than made up of SMC stars, based on statistical arguments. Thanks to our proper motion analysis, here we can firmly confirm that the feature is in fact described by cluster members. We underline that, to our knowledge, this is the first kinematically decontaminated CMD of a GC in the MC ever presented in the literature. Even though the focus of this paper is the kinematics of the cluster and the SMC, our analysis shows that the proper motion-based decontamination of CMDs of MC star clusters is now within the reach of HST.
Once a clean sample of cluster stars has been defined, it is possible
to investigate its distribution in the VPD. This is shown in the right
panel of Fig. 6. The members of NGC 419 (red symbols)
clearly populate the bulk of the distribution. Since this is centred
on the origin of the VPD of the relative proper motions by construction, the
absolute proper motion of NGC 419 is given by the absolute proper
motions zero points, with opposite sign:
mas
yr-1
mas yr-1.
3.2 SMC
A clean sample of SMC stars has to be selected among the sources that are not labelled as NGC 419 members. Given that the SMC stellar population is less numerous and has a larger velocity dispersion, a selection on the VPD is more subtle, as several SMC stars would end up within the limit of the cluster selection. For this reason, this time we preferred to exploit the CMD, and defined the following criteria:
-
) we selected stars more distant than 40 arcsec from NGC 419 centre;
-
) we applied a colour cut such to select stars along the young main sequence, nominally (;
-
) we selected a region in the CMD that includes the faint and old SGB, at and .
The location of the SMC sample in shown in the left panel of Fig. 6 as blue points.
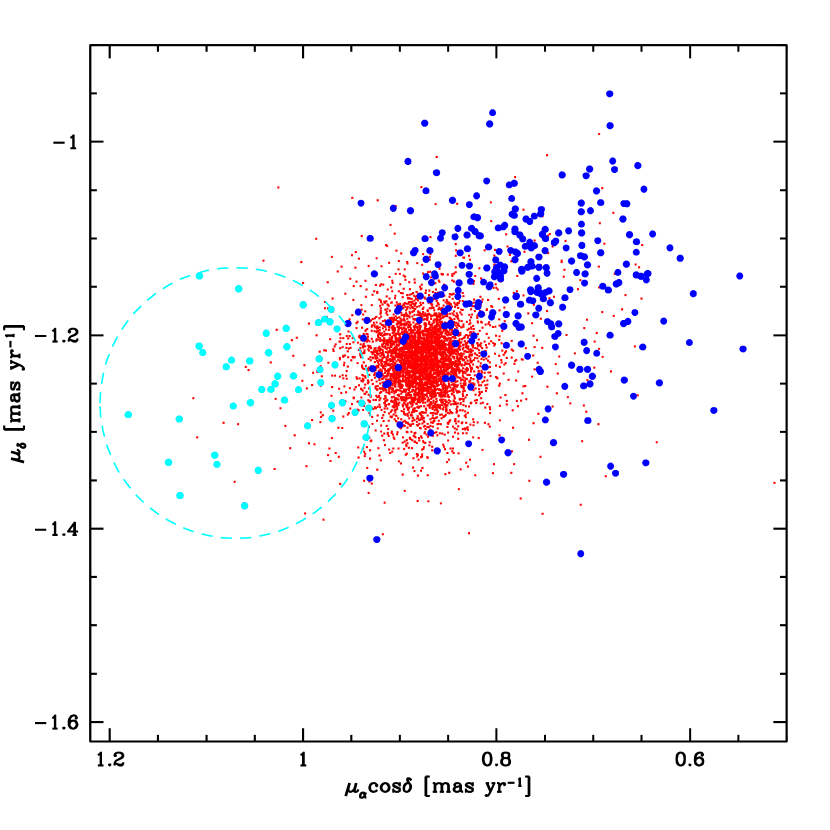
When looking at selected SMC stars in the VPD, two separate features stand out clearly. The first and more populated one is a broad clump of stars that trails NGC 419 along Right Ascension (R.A.), and is located at about (, ) mas yr-1. The second feature is instead less populated and moves faster than the cluster along R.A. It is highlighted with cyan symbols in the right panel of Fig. 6 for sake of clarity.
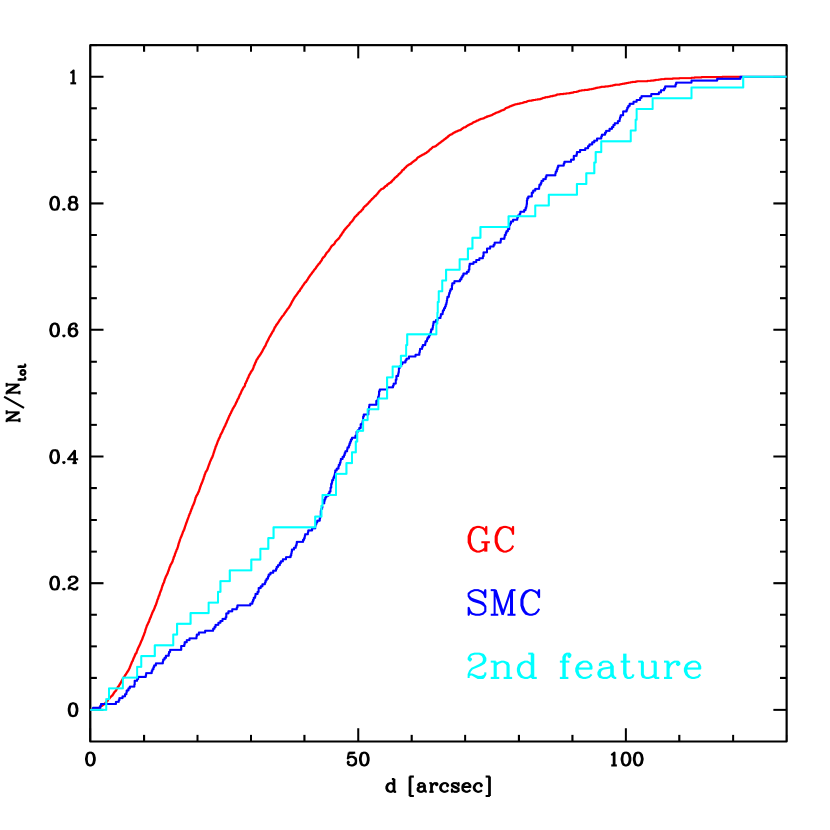
In order to better interpret the nature of these two features, we first investigated their spatial distribution. As shown in Fig. 7, both are less centrally concentrated than the cluster, as expected for field populations. Moreover, their radial distribution is basically indistinguishable. A Kolmogorov-Smirnov test run on the two samples confirms that the probability for them to have been extracted from two populations sharing the same distribution on the sky is of 96.2%.
On the other hand, a further inspection of the CMD revealed an
important difference. As shown in Fig. 8, the stars belonging
to the main feature (blue points) populate both the young main
sequence and the old SGB, regardless of the adopted combination of
filters. Instead, the secondary feature is predominantly made up of young main
sequence stars (cyan dots). We therefore recognise the main feature
as the one describing the stellar component of the main body of the SMC.
Its 3-clipped mean absolute proper motion amounts to
mas yr-1
mas yr-1,
where the second term of the associated uncertainty represents the
error on the absolute proper motion zero points. Our field lies about
1 degree off of the nominal centre of the SMC, which is moving away
from us with a radial velocity of 145.6 km s-1
(Harris & Zaritsky 2006), at a distance of 63 kpc
(Cioni et al. 2000). Prior to compare our measurements with others
available in the literature, we must therefore correct for the
perspective effect introduced by the different lines of sight. By
using the formalism described in van de Ven et al. (2006) and
Gaia Collaboration, et al. (2018), we obtain an estimate for the PM of the SMC centre
of mass (COM) of:
mas yr-1
mas yr-1.
As a comparison, Kallivayalil et al. (2013) estimated the proper motion of the SMC centre of mass to be mas yr-1, whereas Gaia Collaboration, et al. (2018) estimated the mean PM of the SMC to be mas yr-1. Both the results are in good agreement with our estimate.
The high quality of our PMs therefore allows us to clearly separate the motion of NGC 419 from that of the SMC. The net PM difference amounts to mas yr-1 along R.A. and to mas yr-1 along Declination, which at the distance of the SMC ( kpc, Cioni et al. 2000; Muraveva et al. 2018) translates to an overall velocity difference of about km s-1. This value exceeds the velocity dispersion that has been measured for the SMC from a sample of 2046 red giant stars by Harris & Zaritsky (2006), who found v km s-1. We cannot draw any clear conclusion on whether or not such a difference is significant enough to advocate for a peculiar origin for the cluster. However given the young cluster age ( Gyr, Glatt et al. 2008) and the lack of information on the anisotropy of SMC stars, we believe that our results reasonably support an in-situ origin for NGC 419 within the SMC.

The secondary feature is thus made up of young stars, which are
homogeneously distributed across the FoV as a field population. To
verify whether these stars could belong to the Milky Way disk, we
analysed their Gaia parallaxes and found out that they are too
small (the median value is mas) to be foreground
contaminants (for which one should expect parallax values about one
order of magnitude larger). The crucial piece of information to
interpret this feature is ultimately given by the location of NGC 419
itself. Its coordinates lies at about 1 degree from the centre of the
SMC and along the direction of the Magellanic Bridge
(Hindman, Kerr, & McGee 1963). The Magellanic Bridge is a gaseous structure
connecting the two MCs that also hosts stars. The stellar component of
the Bridge is mostly composed of young stars (Irwin, Kunkel, & Demers 1985),
though evidence for the presence of stars older than 1 Gyr also exists
(e.g., Bagheri, Cioni, & Napiwotzki 2013; Belokurov et al. 2017). The PM of stars in the
Magellanic Bridge has been very recently measured by Zivick, et al. (2019) and
Schmidt et al. (2020), and have lent further support to the hypothesis that
this structure has formed from the past mutual interaction of the MCs
(Besla et al. 2012). In Schmidt et al. (2020), in particular, the PM
measurements extend from the LMC up to a distance of degrees
from the SMC centre. The field around NGC 419 is even closer to the
centre of the hosting galaxy, though, and this prevents a direct
comparison with previous estimates. For the sample of stars belonging
to the secondary feature of the VPD we measure a mean absolute proper
motion of
mas yr-1
mas yr-1.
These values look consistent with the extrapolation towards smaller distances from the SMC centre of the N-body models presented by Schmidt et al. (2020), shown in their Fig. 10. When transformed to an orthografic projection centred on the SMC using the equations given in Gaia Collaboration, et al. (2018), the PM of our secondary feature become mas yr-1. These values are also in reasonable agreement with the models described in Zivick, et al. (2019).
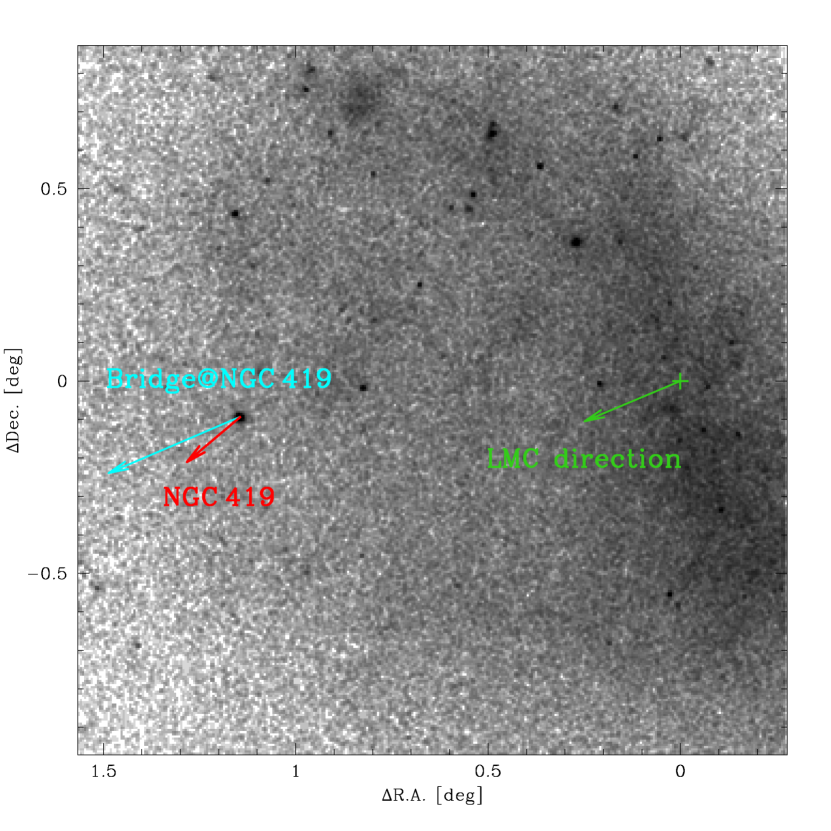
Therefore, after putting together this kinematical information with the spatial and age-related arguments, we interpret the secondary feature of the VPD as made up of stars belonging to the Magellanic Bridge in the proximity of the SMC centre. Figure 9 summarises our findings by showing how NGC 419 (red arrow) and the Bridge stars (cyan arrow) move in a reference system centred on the SMC (marked with a green cross, the underlying density map is based on Gaia DR2 data and only includes sources brighter than ) and where the SMC is at rest. If our interpretation is correct, then our measurements would provide a useful constraint on the overall kinematics of the Bridge in a region that has so far been unexplored.
4 Summary and Conclusions
We have analysed multi-epochs HST observations of the SMC globular cluster NGC 419 with the aim of measuring the PM of stars in its field. Our dataset span a temporal baseline of 12.63 years and, coupled with the exquisite astrometric capabilities of the telescope, allowed us to achieve proper motion measurements as precise as 10 as yr-1. With such a precision, we were able to resolve the intricate kinematics of the stellar populations sampled by our observations. In particular:
-
i) NGC 419 members were efficiently isolated from the field contaminants. The resulting CMD of the cluster confirmed the existence of peculiar features such as the eMSTO and the secondary red clump, which for the first time are decontaminated from non-member stars on an individual (and not statistical) basis;
-
ii) the presence of stars with a Gaia DR2 PM measurements in our field allowed us to determine the absolute PM of NGC 419, which is mas yr-1, mas yr-1;
-
iii) field stars clearly describe a main, homogeneous feature in the VPD, populated by both young and old stars. We associated this feature to stellar component of the main body of the SMC, and determine its perspective corrected absolute proper motion to be mas yr-1, mas yr-1, in excellent agreement with previous measurements;
-
iv) a few field stars clump around a secondary feature of the VPD that is solely populated by young stars, and which bulk motion is mas yr-1, mas yr-1. Based on the location of these stars on the sky and on their measured kinematics, we interpret them as belonging to the Magellanic Bridge. Our PMs seem to confirm N-body predictions for such a feature presented by Schmidt et al. (2020), when extrapolated to the position of our field.
Recently, Omkumar et al. (2020) reported on the detection of a kinematically distinct sub-structure in front of the SMC, which is particularly dominant between 2.5 and 5 degrees from the SMC centre. This sub-structure has a PM very similar to the one we measured for our secondary feature, and was interpreted by the authors as the result of tidal stripping from the Magellanic Bridge. Given that the kinematic properties of their sub-structure and our secondary component are fairly consistent, the two features might belong to the same population of Magellanic Bridge stars, which we sampled at a closer distance to the centre of the host galaxy. Future spectroscopic, radial velocity measurements could help in confirming the possible common origin of these two populations.
Because of their large distance and high density, it is challenging to study the star clusters of the MCs, even for instruments like those onboard the Gaia mission. In this paper, we demonstrate that the availability of multi-epoch HST observations makes it possible to resolve and investigate the kinematics of the stellar population in the fields of MC clusters. On one hand, this will enhance the photometric investigation of elusive features in the CMD of MC star clusters, which can be strongly contaminated by field sources. On the other hand, resolving the clusters’ 3D kinematics around the host galaxies will enable dynamical investigations that can shed light on the assembly histories of the MCs (e.g., Piatti, Alfaro, & Cantat-Gaudin 2019), in turn providing important constraints on the shape of the MCs’ gravitational potentials.
Acknowledgements
We warmly thank the anonymous referee for the constructive report that improved the quality of the paper. Based on observations made with the NASA/ESA Hubble Space Telescope, obtained from the data archive at the Space Telescope Science Institute. STScI is operated by the Association of Universities for Research in Astronomy, Inc. under NASA contract NAS 5-26555. This work has made use of data from the European Space Agency (ESA) mission Gaia (http://www.cosmos.esa.int/gaia), processed by the Gaia Data Processing and Analysis Consortium (DPAC, http://www.cosmos.esa.int/web/gaia/dpac/consortium). Funding for the DPAC has been provided by national institutions, in particular the institutions participating in the Gaia Multilateral Agreement.
Data availability statement
The data underlying this article will be shared on reasonable request to the corresponding author.
References
- Anderson & King (2006) Anderson J., King I. R., 2006, acs..rept
- Anderson & Bedin (2010) Anderson J., Bedin L. R., 2010, PASP, 122, 1035
- Bagheri, Cioni, & Napiwotzki (2013) Bagheri G., Cioni M.-R. L., Napiwotzki R., 2013, A&A, 551, A78
- Baumgardt, et al. (2019) Baumgardt H., Hilker M., Sollima A., Bellini A., 2019, MNRAS, 482, 5138
- Bedin et al. (2008) Bedin L. R., King I. R., Anderson J., Piotto G., Salaris M., Cassisi S., Serenelli A., 2008, ApJ, 678, 1279
- Bellini & Bedin (2009) Bellini A., Bedin L. R., 2009, PASP, 121, 1419
- Bellini, Anderson, & Bedin (2011) Bellini A., Anderson J., Bedin L. R., 2011, PASP, 123, 622
- Bellini et al. (2014) Bellini A., Anderson J., van der Marel R. P., Watkins L. L., King I. R., Bianchini P., Chanamé J., et al., 2014, ApJ, 797, 115
- Bellini et al. (2017) Bellini A., Bianchini P., Varri A. L., Anderson J., Piotto G., van der Marel R. P., Vesperini E., et al., 2017, ApJ, 844, 167
- Bellini, et al. (2018) Bellini A., et al., 2018, ApJ, 853, 86
- Belokurov et al. (2017) Belokurov V., Erkal D., Deason A. J., Koposov S. E., De Angeli F., Evans D. W., Fraternali F., et al., 2017, MNRAS, 466, 4711
- Besla et al. (2012) Besla G., Kallivayalil N., Hernquist L., van der Marel R. P., Cox T. J., Kereš D., 2012, MNRAS, 421, 2109
- Cioni et al. (2000) Cioni M.-R. L., van der Marel R. P., Loup C., Habing H. J., 2000, A&A, 359, 601
- Erkal & Belokurov (2020) Erkal D., Belokurov V. A., 2020, MNRAS, 495, 2554
- Gaia Collaboration et al. (2018) Gaia Collaboration, Brown A. G. A., Vallenari A., Prusti T., de Bruijne J. H. J., Babusiaux C., Bailer-Jones C. A. L., et al., 2018, A&A, 616, A1
- Gaia Collaboration, et al. (2018) Gaia Collaboration, et al., 2018, A&A, 616, A12
- Girardi, Rubele, & Kerber (2009) Girardi L., Rubele S., Kerber L., 2009, MNRAS, 394, L74
- Glatt et al. (2008) Glatt K., Grebel E. K., Sabbi E., Gallagher J. S., Nota A., Sirianni M., Clementini G., et al., 2008, AJ, 136, 1703
- Glatt et al. (2009) Glatt K., Grebel E. K., Gallagher J. S., Nota A., Sabbi E., Sirianni M., Clementini G., et al., 2009, AJ, 138, 1403. doi:10.1088/0004-6256/138/5/1403
- Goudfrooij et al. (2014) Goudfrooij P., Girardi L., Kozhurina-Platais V., Kalirai J. S., Platais I., Puzia T. H., Correnti M., et al., 2014, ApJ, 797, 35. doi:10.1088/0004-637X/797/1/35
- Harris & Zaritsky (2006) Harris J., Zaritsky D., 2006, AJ, 131, 2514
- Helmi et al. (2018) Helmi A., Babusiaux C., Koppelman H. H., Massari D., Veljanoski J., Brown A. G. A., 2018, Natur, 563, 85
- Hindman, Kerr, & McGee (1963) Hindman J. V., Kerr F. J., McGee R. X., 1963, AuJPh, 16, 570
- Ibata, Gilmore, & Irwin (1994) Ibata R. A., Gilmore G., Irwin M. J., 1994, Natur, 370, 194
- Irwin, Kunkel, & Demers (1985) Irwin M. J., Kunkel W. E., Demers S., 1985, Natur, 318, 160
- Kallivayalil et al. (2013) Kallivayalil N., van der Marel R. P., Besla G., Anderson J., Alcock C., 2013, ApJ, 764, 161
- Kallivayalil, et al. (2018) Kallivayalil N., et al., 2018, ApJ, 867, 19
- Kamann et al. (2018) Kamann S., Bastian N., Husser T.-O., Martocchia S., Usher C., den Brok M., Dreizler S., et al., 2018, MNRAS, 480, 1689
- Koppelman et al. (2019) Koppelman H. H., Helmi A., Massari D., Roelenga S., Bastian U., 2019, A&A, 625, A5
- Kruijssen, et al. (2020) Kruijssen J. M. D., et al., 2020, arXiv, arXiv:2003.01119
- Libralato et al. (2020) Libralato M., Fardal M., Lennon D., van der Marel R. P., Bellini A., 2020, MNRAS, 497, 4733. doi:10.1093/mnras/staa2327
- Libralato, et al. (2019) Libralato M., et al., 2019, ApJ, 873, 109
- Libralato, et al. (2018) Libralato M., et al., 2018, ApJ, 861, 99
- Lindegren et al. (2018) Lindegren L., Hernández J., Bombrun A., Klioner S., Bastian U., Ramos-Lerate M., de Torres A., et al., 2018, A&A, 616, A2
- Mackey, et al. (2019) Mackey D., et al., 2019, Natur, 574, 69
- Massari, et al. (2020) Massari D., Helmi A., Mucciarelli A., Sales L. V., Spina L., Tolstoy E., 2020, A&A, 633, A36
- Massari, Koppelman & Helmi (2019) Massari D., Koppelman H. H., Helmi A., 2019, A&A, 630, L4
- Massari, et al. (2018) Massari D., Breddels M. A., Helmi A., Posti L., Brown A. G. A., Tolstoy E., 2018, NatAs, 2, 156
- Massari et al. (2013) Massari D., Bellini A., Ferraro F. R., van der Marel R. P., Anderson J., Dalessandro E., Lanzoni B., 2013, ApJ, 779, 81. doi:10.1088/0004-637X/779/1/81
- Myeong et al. (2019) Myeong G. C., Vasiliev E., Iorio G., Evans N. W., Belokurov V., 2019, MNRAS, 488, 1235
- Muraveva et al. (2018) Muraveva T., Subramanian S., Clementini G., Cioni M.-R. L., Palmer M., van Loon J. T., Moretti M. I., et al., 2018, MNRAS, 473, 3131
- Omkumar et al. (2020) Omkumar A. O., Subramanian S., Niederhofer F., Diaz J., Cioni M.-R. L., El Youssoufi D., Bekki K., et al., 2020, arXiv, arXiv:2010.02687
- Patel, et al. (2020) Patel E., et al., 2020, ApJ, 893, 121
- Piatti, Alfaro, & Cantat-Gaudin (2019) Piatti A. E., Alfaro E. J., Cantat-Gaudin T., 2019, MNRAS, 484, L19. doi:10.1093/mnrasl/sly240
- Raso et al. (2019) Raso S., Pallanca C., Ferraro F. R., Lanzoni B., Mucciarelli A., Origlia L., Dalessandro E., et al., 2019, ApJ, 879, 56
- Sales, et al. (2013) Sales L. V., Wang W., White S. D. M., Navarro J. F., 2013, MNRAS, 428, 573
- Schmidt et al. (2020) Schmidt T., Cioni M.-R. L., Niederhofer F., Bekki K., Bell C. P. M., de Grijs R., Diaz J., et al., 2020, A&A, 641, A134
- Sohn et al. (2017) Sohn S. T., Patel E., Besla G., van der Marel R. P., Bullock J. S., Strigari L. E., van de Ven G., et al., 2017, ApJ, 849, 93. doi:10.3847/1538-4357/aa917b
- Vasiliev (2019) Vasiliev E., 2019, MNRAS, 484, 2832
- van de Ven et al. (2006) van de Ven G., van den Bosch R. C. E., Verolme E. K., de Zeeuw P. T., 2006, A&A, 445, 513. doi:10.1051/0004-6361:20053061
- van der Marel & Kallivayalil (2014) van der Marel R. P., Kallivayalil N., 2014, ApJ, 781, 121
- van der Marel, et al. (2002) van der Marel R. P., Alves D. R., Hardy E., Suntzeff N. B., 2002, AJ, 124, 2639
- Zivick, et al. (2019) Zivick P., et al., 2019, ApJ, 874, 78