The 60-pc Environment of FRB 20180916B
Abstract
Fast Radio Burst FRB 20180916B in its host galaxy SDSS J015800.28+654253.0 at 149 Mpc is by far the closest-known FRB with a robust host galaxy association. The source also exhibits a 16.35-day period in its bursting. Here we present optical and infrared imaging as well as integral field spectroscopy observations of FRB 20180916B with the WFC3 camera on the Hubble Space Telescope and the MEGARA spectrograph on the 10.4-m Gran Telescopio Canarias. The 60–90 milliarcsecond (mas) resolution of the Hubble imaging, along with the previous 2.3-mas localization of FRB 20180916B, allow us to probe its environment with a 30–60 pc resolution. We constrain any point-like star-formation or H II region at the location of FRB 20180916B to have an luminosity and, correspondingly, constrain the local star-formation rate to be . The constraint on suggests that possible stellar companions to FRB 20180916B should be of a cooler, less massive spectral type than O6V. FRB 20180916B is 250 pc away (in projected distance) from the brightest pixel of the nearest young stellar clump, which is pc in size (full-width at half maximum). With the typical projected velocities of pulsars, magnetars, or neutron stars in binaries ( km s-1), FRB 20180916B would need 800 kyr to 7 Myr to traverse the observed distance from its presumed birth site. This timescale is inconsistent with the active ages of magnetars ( kyr). Rather, the inferred age and observed separation are compatible with the ages of high-mass X-ray binaries and gamma-ray binaries, and their separations from the nearest OB associations.
1 Introduction
More than a decade after the discovery of the ‘Lorimer Burst’ (Lorimer et al., 2007), the physical origin(s) of Fast Radio Bursts (FRBs) remains unclear. These bright ( 0.1–100 Jy ms fluence), short-duration ( µs ms) radio flashes have been shown to be extragalactic in origin, but it is still unclear what type of object produces them, or what the exact emission mechanism might be — see Petroff et al. (2019) and Cordes & Chatterjee (2019) for recent reviews and Platts et al. (2018) for a catalogue of proposed theories. The high brightness temperatures ( K) of FRBs point to coherent emission from a compact source with high energy density, and for this reason many models have invoked neutron stars, white dwarfs and/or black holes in a variety of possible settings. The fact that some FRB sources are repeating (Spitler et al., 2016), whereas others appear to be one-off events (Shannon et al., 2018), also raises the question of whether the phenomenon can be ascribed to a single source type, or whether there are at least two sub-populations with distinct physical natures (Cui et al., 2021).
Detailed spectro-temporal and polarimetric characterisation of FRB signals can help constrain models (Farah et al., 2018; Day et al., 2020; Nimmo et al., 2020), as can multi-wavelength associations or constraints (Scholz et al., 2017; Bhandari et al., 2020a; Scholz et al., 2020). Radio interferometers have now provided robust host galaxy associations for roughly a dozen FRBs111http://frbhosts.org/ — both repeating and apparently one-off (Chatterjee et al., 2017; Ravi et al., 2019; Bannister et al., 2019; Prochaska et al., 2019; Marcote et al., 2020; Macquart et al., 2020a). In principle, the properties of these host galaxies also offer important clues, but thus far a wide range of host galaxy types have been observed (Bhandari et al., 2020b; Heintz et al., 2020; Mannings et al., 2020). FRB models need to accommodate this diversity or resort to multiple populations. High-precision ( mas) positions are possible with the Australia Square Kilometre Array Pathfinder (ASKAP; Bannister et al., 2019), Very Large Array (VLA; Chatterjee et al., 2017) and European Very-long-baseline-interferometry Network (EVN; Marcote et al., 2017), and allow for localisation within host galaxies. This can, e.g., confirm or exclude an association with the nucleus of the host galaxy, or a region of active star-formation.
Insights into the FRB mystery can also come from finding analogous sources in our own Milky Way. The recent discovery of an exceptionally bright (MJy ms) radio burst (sometimes designated FRB 200428A; CHIME/FRB Collaboration et al., 2020a; Bochenek et al., 2020a) — and accompanying hard X-ray burst (Mereghetti et al., 2020; Ridnaia et al., 2020; Tavani et al., 2020; Li et al., 2020) — from the Galactic magnetar SGR 1935+2154 bridges the many orders-of-magnitude in luminosity between the pulses (regular and giant) of canonical radio pulsars and the extragalactic FRBs. In fact, if placed at the 149-Mpc distance of the closest localised FRB, SGR 1935+2154’s bright burst would only be a factor of times less luminous compared to the least energetic FRBs seen thus far. This suggests that a significant fraction of FRBs could have a magnetar origin. The discovery of 20–100 Jy ms bursts from SGR 1935+2154 (Kirsten et al., 2020) — bright compared to FRB fluences but far weaker in luminosity — might also suggest that we are only seeing the tip of the burst energy distribution from extragalactic FRBs.
FRB 20121102A (previously FRB 121102; Spitler et al., 2014, 2016) and FRB 20180916B (previously FRB 180916.J0158+65; CHIME/FRB Collaboration et al., 2019a) are currently the two best-characterised repeating FRBs, and the first two to be precisely localised within a host galaxy (Chatterjee et al., 2017; Tendulkar et al., 2017; Marcote et al., 2017, 2020). The spectro-temporal and intrinsic polarimetric properties of bursts from FRB 20121102A and FRB 20180916B are remarkably similar, strongly suggesting that they have the same progenitor type and detailed emission mechanism.
Both sources show the characteristic downward frequency drift between sub-bursts (Hessels et al., 2019), which is seen in bursts from many repeaters (CHIME/FRB Collaboration et al., 2019b, a; Fonseca et al., 2020) and colloquially termed the ‘sad trombone’ effect. FRB 20121102A showed a -µs-wide burst component at 4.5 GHz (Michilli et al., 2018); a recent study of FRB 20180916B using voltage data finds burst structure down to 3–4 µs, and spanning close to 3 orders-of-magnitude up to ms within individual bursts (Nimmo et al., 2020).
These two repeaters also have indistinguishable polarimetric properties, showing nearly 0% circular polarization, but linear polarization with a roughly flat polarization angle during and between bursts222However, another repeating source, FRB 20180301A (previously FRB 180301), was recently shown to have diverse polarization swings and polarization fractions in different bursts (Luo et al., 2020) showing that FRB 20180916B and FRB 20121102A are not necessarily representative of the whole repeater population. (Michilli et al., 2018; Nimmo et al., 2020). However, FRB 20121102A shows a drastically higher Faraday rotation measure (RM; Michilli et al., 2018) which is highly variable () on timescales of days to years (Michilli et al., 2018; Gajjar et al., 2018; Hilmarsson et al., 2020). FRB 20121102A also shows clear dispersion measure (DM) variations (; Hessels et al., 2019; Josephy et al., 2019). In comparison, FRB 20180916B shows a much more stable DM (; CHIME/FRB Collaboration et al., 2020b; Nimmo et al., 2020), and RM variations of only (Pleunis et al., 2020).
It has recently also been reported that both sources are periodic in their activity, with FRB 20180916B modulated at day (CHIME/FRB Collaboration et al., 2020b; Pleunis et al., 2020) and FRB 20121102A likely modulated at day (Rajwade et al., 2020; Cruces et al., 2020). This could conceivably be related to an orbital period (Ioka & Zhang, 2020a; Lyutikov et al., 2020; Zhang & Gao, 2020; Popov, 2020), rotational period (Beniamini et al., 2020a), or precession period (Levin et al., 2020; Sob’yanin, 2020; Yang & Zou, 2020a; Zanazzi & Lai, 2020).
At first glance, perhaps the most striking difference between these astrophysical sources is their host galaxy and local environment: FRB 20121102A is localised to a low-metallicity dwarf at (Chatterjee et al., 2017; Tendulkar et al., 2017), while FRB 20180916B is found in a massive spiral at (Marcote et al., 2020). Both sources are found in close proximity to a prominent star-forming region (Bassa et al., 2017; Marcote et al., 2020), though FRB 20121102A’s milliarcsecond (mas) localisation (Marcote et al., 2017), Hubble Space Telescope (HST) imaging (Bassa et al., 2017), and adaptive optics observations (Kokubo et al., 2017) demonstrate that it is offset by pc from the peak of star-formation in this region333Yet another repeater, FRB 20190711 (Macquart et al., 2020b) is also found in a massive star-forming galaxy (Heintz et al., 2020) though the localization of the FRB is too imprecise to identify its local environment.. Lastly, the association of FRB 20121102A with a persistent (isotropic luminosity erg s-1) and compact ( pc) radio source (Chatterjee et al., 2017; Marcote et al., 2017) stands in stark contrast to the lack of such a counterpart to FRB 20180916B (Marcote et al., 2020), despite it being significantly nearer to Earth.
At a luminosity distance of 149 Mpc, FRB 20180916B is by far the closest-known FRB with a robust host galaxy association (Marcote et al., 2020). It is also the most precisely localised FRB to date: EVN observations achieved a 2.3-mas localisation within the International Celestial Reference Frame (ICRF), including systematic uncertainties (Marcote et al., 2020). FRB 20180916B thus provides an unprecedented opportunity for high-resolution optical studies of its local environment. In previous Gemini North observations, FRB 20180916B was associated with the apex of an apparently ‘V’-shaped star-forming region (or complex of closely spaced star-forming regions) with an extent of . Given the 0.8–1.0″ seeing of those observations, higher-resolution observations can greatly enhance our understanding of FRB 20180916B’s local environment, and perhaps even detect a massive binary companion that could elucidate its periodic activity.
Here we present an imaging and spectroscopic study of the immediate environment of FRB 20180916B using observations from HST and the 10.4-m Gran Telescopio Canarias (GTC). These observations probe 60-pc scales within the host galaxy — by far the closest view of any FRB source to date. We present the observations and analysis in §2 and §3, respectively, and discuss the astrophysical implications and interpretation in §4.
2 Observations & Reduction
We observed FRB 20180916B using the Multi-Espectrógrafo en GTC de Alta Resolución para Astronomía (MEGARA) integral field spectrograph on the GTC and the Wide Field Camera 3 (WFC3) instrument on HST in 2019 September and 2020 July (Table 1). Here we describe the observations and data reduction procedures.
2.1 MEGARA
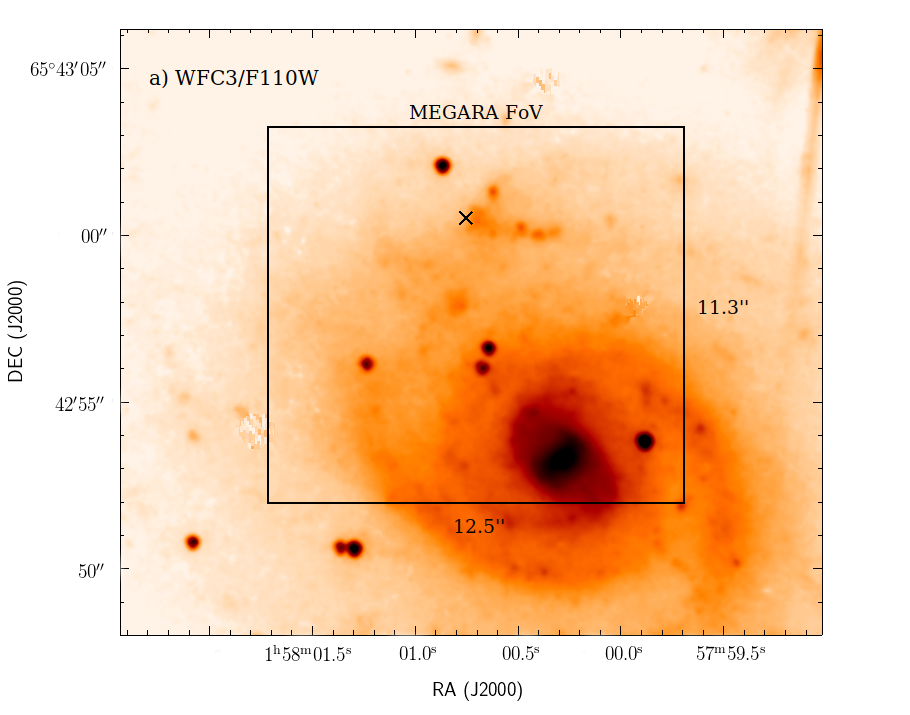
Observations of SDSS J015800.28+654253.0 were performed with the MEGARA instrument (Gil de Paz et al., 2018; Carrasco et al., 2018) at the 10.4-m GTC in 2019 September (see Table 1 for details). We used the Large Compact Bundle Integral Field Unit mode (LCB IFU), which provides a field of view (FoV) of 125 113 and a spectral pixel (spaxel) size of 062 ( at 149 Mpc). The observations were carried out using the LR-R setup with a spectral coverage of 6100–7300 Å. The pointing was set so that the MEGARA FoV covered both the ‘V’-shaped structure found near FRB 20180916B as well as the host galaxy nucleus (see Figure 1, panel a). During the run we also observed the spectrophotometric standard star HR7596, and acquired halogen lamp flats and ThNe arcs using the MEGARA Instrument Calibration Module (ICM), as well as a series of bias images.
The data were processed using the development version (v0.9.2) of the MEGARA Data Reduction Pipeline444https://github.com/guaix-ucm/megaradrp (DRP; Pascual et al., 2018, 2019), which is based on a series of processing recipes, and the cookbook555http://www.gtc.iac.es/instruments/megara/media/MEGARA_cookbook_1I.pdf. The halogen lamp observations allowed us to trace the spectra (TraceMap recipe), to recover the flux of each fiber affected by cross-talk contamination from adjacent fibers (ModelMap recipe), and to correct for changes in sensitivity from blue-to-red in between fibers (FiberFlat recipe). Prior to the correction by fiber-flat, we wavelength-calibrated the images (including the master fiber-flat), fiber-by-fiber, using ThNe arc observations obtained with the MEGARA ICM. The LcbStdStar recipe allowed us to use the LCB observations of the standard stars to derive the system response function after assuming the La Palma extinction curve666https://www.ing.iac.es/Astronomy/observing/manuals/ps/tech_notes/tn031.pdf. The results from all these recipes were finally used (LcbImage recipe) to process the SDSS J015800.28+654253.0 data. The sky background subtraction was performed using the processed fiber spectra of the 8 fixed 7-fiber minibundles (56 fibers) that are mounted on the LCB pseudo-slit and that are placed in a blank sky region 175–2′ away from the center of the LCB (which is also the optical axis of the instrument). The final product of this data reduction is a Row-Stacked Spectra (RSS hereafter) FITS file which is wavelength and flux calibrated and has its sky background subtracted.
2.2 WFC3
The host galaxy of FRB 20180916B was observed with the WFC3 instrument on the HST in the F657N (6476–6674Å) and F673N (6681–6880Å) filters of the UVIS channel, as well as the F110W filter (8832–14121Å, IR channel) on 2020 July 16 & 17. Table 1 summarizes the observations. The aim of the F110W observations was to detect or constrain the presence of bright stars or stellar clusters and to understand the morphology of the environment. At the redshift z=0.0338 of the host galaxy, the line is shifted to 6784Å (within the F673N filter coverage) while the zero-redshift filter, F657N, is used as an -off filter to constrain the underlying continuum. The -on and -off images are acquired to constrain local star-formation and understand the distribution of atomic hydrogen in the region. At 149 Mpc, the angular and spatial resolution of the F657N, F673N, and F110W filters is 56 mas, 58 mas, and 95 mas, respectively.
The UVIS observations were undertaken with 3 exposures of 959 s each (with a total exposure of 2877 s), dithered in the 3-point dither pattern (WFC3-UVIS-DITHERLINE-3PT) to optimally sample the PSF. A post-exposure flash adjusted for 9 electrons was used to minimze CTE losses, as recommended by the WFC3/UVIS data handbook777https://hst-docs.stsci.edu/wfc3dhb. The IR observations were undertaken with 10 exposures with a 4-point dither pattern (WFC3-IR-DITHERBOX-MIN) read-out with the SPARS50 readout sequence, for a total exposure of 5929 s.
The pre-calibrated and CTE-corrected UVIS and IR (.FLC and .FLT, respectively) images were distortion-corrected and astrometrically aligned to the International Celestial Reference Frame (ICRF) using the Gaia DR2 catalog (Gaia Collaboration et al., 2016, 2018) and the tweakreg tool. The images were individually aligned using 60–90 stars (UVIS images) and 30–35 stars (IR images) to achieve a typical astrometric root-mean-square (RMS) residual of 18 mas and 36 mas in the UVIS and IR images, respectively. The alignment error between the Gaia optical reference frame and the ICRF frame defined with radio sources is negligible in this context.
The aligned images were combined using astrodrizzle to make cosmic-ray rejected images with a final platescale of 30-mas/pixel. Photometry was performed on the aligned, individual exposures (dolphot Dolphin, 2016) using the appropriate point-spread functions for each filter.
There is no point-source detected at the location of FRB 20180916B. To constrain the detectable source brightness, including the underlying diffuse emission from the host galaxy, we used the addstars tool to add simulated point sources at the location of FRB 20180916B with a range of brightnesses and calculated the detection significance through dolphot in each filter.
We use the absolute photometric calibration as defined by the WFC3 calibration team888https://www.stsci.edu/hst/instrumentation/wfc3/data-analysis/photometric-calibration, which has systematic errors of (F110W) and (F657N, F673N).
| Obs. Date | Instrument/ | Grating/ | Exp. Time | Obs IDa | Notesb |
|---|---|---|---|---|---|
| (UTC) | Camera | Filter | (s) | ||
| Gran Telescopio Canarias (Program GTC18-19BMEX) | |||||
| 2019-09-24 | MEGARA/IFU | LR-R | 680 | 2303712 | AM=1.27, seeing=10 |
| 2019-09-24 | MEGARA/IFU | LR-R | 680 | 2303713 | AM=1.26, seeing=10 |
| 2019-09-24 | MEGARA/IFU | LR-R | 680 | 2303714 | AM=1.26, seeing=10 |
| Hubble Space Telescope Program (16072) | |||||
| 2020-07-16 | WFC3/UVIS1 | F673N | 2877 | IE8Q01010 | resolution=0058 |
| 2020-07-17 | WFC3/UVIS1 | F657N | 2877 | IE8Q02010 | resolution=0056 |
| 2020-07-17 | WFC3/IR | F110W | 306 | IE8Q03010 | resolution=0095 |
| 2020-07-17 | WFC3/IR | F110W | 5623 | IE8Q03020 | resolution=0095 |
Note. — a: Observation ID for the GTC Archive https://gtc.sdc.cab.inta-csic.es/gtc/jsp/searchform.jsp and the HST MAST Archive: https://archive.stsci.edu/index.html. b: Airmass (AM) and seeing conditions and full-width at half maximum of the point spread function for WFC3. The size of the spaxel for MEGARA observations is 062.
3 Analysis & Results
3.1 IFU Spectroscopy
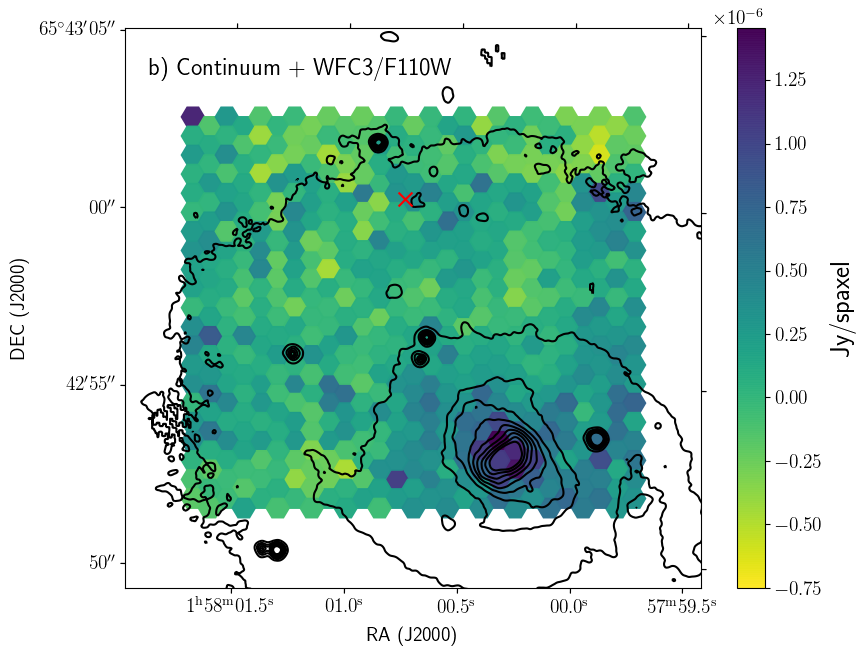
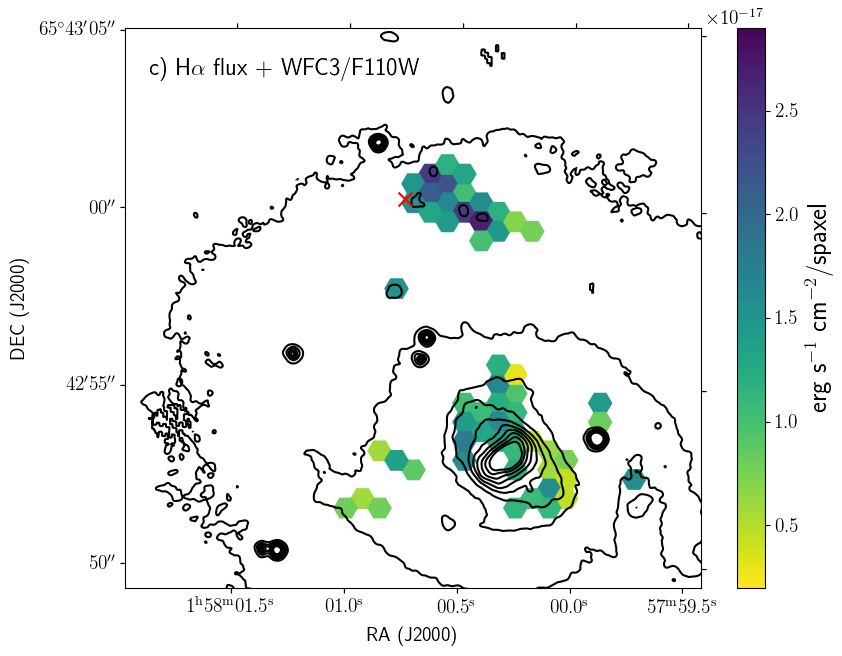
In panel b of Figure 1 we present the distribution of the continuum emission obtained by averaging the flux of the RSS in the wavelength range between 6100 and 7200 Å. We note that the fluxes shown here are per spaxel in the case of MEGARA and per pixel in the case of the HST WFC3/F110W image. In order to derive the emission line properties of the area of the SDSS J015800.28+654253.0 galaxy covered by our MEGARA LCB observations, we made use of custom Python 3 code based on the lmfit package. This code allows one to simultaneously fit a linear local continuum and the emission line profile (as a Gauss-Hermite series) for each LCB spaxel. The code generates an output RSS where each channel corresponds to a different property (line flux, equivalent width, radial velocity, etc.). In panel c we show the results of the analysis of the line adopting a single Gaussian profile for all spaxels with a signal-to-noise ratio at the peak of the line relative to the RMS of the continuum of S/N . This figure shows, on one hand, the presence of line emission associated with the nuclear spiral and, on the other hand, a series of bright, high-surface-brightness emission-line clumps associated with the brightest regions of the ‘V’-shaped structure located 7″ north of the galaxy center. The compactness of these three regions both in HST images and in the MEGARA line-emission data was used to perform a correction of 09 east and 15 south to the MEGARA astrometry. In panel d we provide the radial velocities of the ionized gas as given by for the same S/N spaxels. Here we can clearly see that most of the east side of the galaxy shows approaching velocities compared to the galaxy nucleus suggesting that the kinematical minor axis is approximately located in the north-south direction. It is also important to emphasize that the ‘V’-shaped structure shows a radial velocity in H that does not differ much from that of the rest of the galaxy, especially if we take into account the fact that the purely rotating gas in that part of the galaxy is moving towards us (see Section 3.1.1 for more details). The best-fitting systemic barycentric velocity is leading to the redshift z=0.03399. This result is consistent with that presented by Marcote et al. (2020).
Apart from we detect [NII]6584, [SII]6717 and [SII]6731 lines in the combined spectrum of all spaxels with a signal to noise at the peak of the line. The [NII]6584/ ratio () can be used to estimate the ionized gas metallicity in this region of the galaxy (Marino et al., 2013). In the 19 spaxels to the immediate west of FRB 20180916B the ratio is measured to be , consistent with the galaxy-wide average measured above.
The radial velocity measurement above and the kinematic modeling below focus on since it is brightest and most precisely measured. Measuring the radial velocity differences between the [NII] and lines in individual spaxels, we find that the mean and RMS velocity difference is . The RMS is dominated by the radial velocity uncertainties from each [NII] line measurements.


3.1.1 Kinematic Modelling of the Host Galaxy
In order to test the hypothesis that the gas in the ‘V’-shaped structure located near the FRB position is actually participating in the overall rotation of the gas in the disk, we have built a thin-disk kinematical model assuming a fixed inclination () at all galactocentric distances and a rotation curve parameterized as . The inclined rotating disk model is then projected onto the sky plane where a radial velocity is calculated for every spaxel’s location. We then explored a wide range of parameters (position angle, RAcenter, Deccenter, Vsys, , ) and derived the model that yields the minimum sum of the quadratic differences between data and model. The inclination, which is poorly constrained given the sparse information on radial velocities for this object, was adopted to be the photometric one () as measured from imaging data in the next section after assuming an axisymmetric disk. The rms of the residual obtained is 5.7 km s-1 for a kinematical position angle of and a best-fitting rotation curve with and an inverse “core” radius of (all errors are 1). Figure 2 shows the covariance in the disk parameters. The best-fitting model and the corresponding residuals are shown in panels e and f of Figure 1, respectively. The homogeneity and low amplitude of the residuals shown in panel e indicates that all regions detected in can be reproduced by a simple thin-disk, purely-rotating kinematical model.

3.2 High-Resolution Imaging
Figure 3 shows the 1′ 1′ field around FRB 20180916B in the HST F110W filter (top left) and the 5″ 5″ zoomed-in fields (marked by the dashed black box) in the F110W (top right), F673N (bottom left, -on), and F657N (bottom right, -off) filters. The images are centered at the location of FRB 20180916B with a green ellipse (pointed to by the green arrow) showing the astrometric uncertainties in the localization and radio-to-optical frame registration of 36 mas.
FRB 20180916B is located off the vertex of the ‘V’-shaped structure which lies along the spiral arm of SDSS J015800.28+654253.0. The ‘V’-shaped structure is indicated in the top left panel of Figure 3. The vertex of the ‘V’ has an emission region with full width at half maximum (FWHM) size of approximately 027, corresponding to about 190 pc. The region’s shape and the underlying background emission has complex structure making it challenging to describe with a single number. This size has not been corrected for the 0095 resolution of the F110W image — we expect the region to be more compact. The region is not bright in and is barely detectable in the F673N image. The luminosity and the star formation surface density of the vertex is discussed in Section 3.3. We assume that the F110W light also traces the distribution within the vertex region, hence the brightest F110W pixel likely has the highest star-formation density.
FRB 20180916B is 0355, i.e. pc away from the brightest pixel in the F110W image. The offset is similar to the pc separation of FRB 20121102A from the center of the knot in its host galaxy (Bassa et al., 2017; Kokubo et al., 2017). The 380-pc size of the star-forming region for FRB 20180916B is much smaller than the 1.4–1.9 kpc size of the star-forming knot hosting FRB 20121102A (Bassa et al., 2017; Kokubo et al., 2017) . The magnitude of this offset compared to the offsets of other compact objects (either isolated or in binaries) from their birth places sets strong constraints on the age and nature of FRB 20180916B, as discussed in Section 4.
FRB 20180916B is located in the Milky Way plane towards the anti-center. The Bayestar19 (Green et al., 2019) estimate for the reddening between the and filters is (1-) based on the PanSTARRs, 2MASS, and Gaia data. We follow the scaling prescribed by Green et al. (2019), and the recalibrated extinction law in Schlafly & Finkbeiner (2011), to estimate the extinction in the F110W and the F673N filters to be 0.61 mag and 1.37 mag, respectively999We note that the older extinction map from Schlafly & Finkbeiner (2011), based on SDSS photometry, estimates the F110W extinction to be 0.87 mag along this line-of-sight. The discrepancy between the older and newer estimates does not qualitatively affect our conclusions, and hence we use the newer estimates from Green et al. (2019)..
The host galaxy extinction is assumed to be negligible, considering its nearly face-on orientation, for the IR wide-band imaging (F110W). However, the conversion of flux to star-formation rate includes a correction for the typical host extinction (Kewley et al., 2002).

We also performed a surface photometry analysis on the F110W HST image using the photutils.isophote package of Astropy. The package estimates the isophotes using the method described in Jedrzejewski (1987). By assuming an intrinsically axisymmetric, infinitesimally thin disk, we estimate the inclination angle of the stellar disk, (1-), which is in agreement with the inclination angle estimated using the data. In estimating , we only considered the projected galactocentric radius range between 4 kpc and 10 kpc because at radii kpc, the radial profile traces the bulge of the galaxy and beyond 10 kpc the fitted ellipticity values show large swings.
3.3 Star Formation
The 5- limit for emission from a point source at the FRB 20180916B location (above the diffuse emission of the host galaxy) is 25.42 mag (Vega). Assuming the continuum to be negligible and all the light to be due to the redshifted- photons, this corresponds to a flux limit of after correcting for the Milky Way extinction. This corresponds to a point-source luminosity of . Using the conversions of Kewley et al. (2002), the star formation rate at the location of FRB 20180916B is constrained to be . The resolution () of the F673N image is mas. Given this size scale, the star formation surface density at the location of FRB 20180916B should be .
The nebular region at the vertex of the ‘V’ is measurably extended in the F110W and F673N images. To measure the total star formation rate in the region, we smoothed the F673N image with a Gaussian kernel with a mas revealing a detectable blob with a total extinction-corrected flux of , corresponding to an luminosity and a star formation surface density of . The measurement assumes a photometric zeropoint at infinite radius. This is roughly consistent with the extinction-corrected flux of measured in the 620-mas-wide MEGARA spaxel located at the vertex of the ‘V’. The difference in the flux measurement is likely due to extra emission outside the HST photometric region in the wings of the clump.
3.4 H II Regions and O/B stars
In the HST F110W image, we constrain a point-source at the location of FRB 20180916B to be fainter than 27.15 mag (Vega). Including the extinction correction discussed above and the distance modulus of SDSS J015800.28+654253.0, this corresponds to an absolute magnitude limit of mag (Vega). The J-band magnitude of a O3V star is mag (Worthey & Lee, 2011; Pecaut & Mamajek, 2013). Thus, the F110W data are unable to constrain the presence of single bright stars.
However, the upper limit on the luminosity at the location of FRB 20180916B can constrain the rate of ionizing photons in the neighborhood. Gutiérrez et al. (2011) demonstrated a tight correlation between the luminosity and radius for H II regions in M51 and NGC 4449. An H II region with is expected to be smaller than 10–60 pc (including the scatter in the relation). Consequently, we do not expect that our non-detection of an H II region in the F673N image is because the flux is resolved out.
The limit can be converted to a limit on the hydrogen ionizing flux (see Osterbrock & Ferland, 2006, for conversion constants). From the calculations of Martins et al. (2005), we can rule out a single main sequence star hotter than O6V. For giants and supergiants, stars hotter than O7.5III and all OI stars are ruled out.
4 Discussion
Our observations and constraints on the environment of FRB 20180916B set it apart from the other localized FRBs, and challenge some of the theoretical models put forward to explain its periodic activity. Here we discuss the observational and theoretical implications of these constraints.
4.1 Comparison to FRB 20190608B
FRB 20190608B (previously FRB 190608; Macquart et al., 2020b) is an apparently non-repeating FRB that was detected and localized by ASKAP to a spiral host galaxy, SDSS J221604.90075356.0, at a redshift of . The location of FRB 20190608B in the spiral arm of SDSS J221604.90075356.0, a face-on spiral, is strikingly similar to that of FRB 20180916B. Chittidi et al. (2020) acquired integral field spectra and HST imaging of the host galaxy and measured a local star formation surface density of at the location of FRB 20190608B. This is similar to the star formation density in the blob at the vertex of the ‘V’-shaped structure but significantly higher than the star formation density at the location of FRB 20180916B. The localization precision of FRB 20190608B of (1-) corresponds to a physical scale of 0.55 kpc at the redshift of . Hence, any offset from the star-forming region, similar to that seen for FRB 20180916B and FRB 20121102A, cannot be measured unless repeat bursts are detected and localized with milliarcsecond precision. Similar to FRB 20190608B, FRB 20180916B is also not found to be coincident with or near the brightest star-forming region in the host galaxy. While Chittidi et al. (2020) noted the spectral and the mass differences between the host galaxies, the local environments of FRB 20180916B, a repeater, and FRB 20190608B, an as-yet non-repeater101010Day et al. (2020) have shown that FRB 20190608B showed some properties similar to repeater bursts — it had a high degree of linear polarization, a non-varying position angle through the burst, and possible complex structure underneath the scattering tail., are very similar. Continued monitoring for repeat bursts from FRB 20190608B would help to improve its localization and to refine the comparison of its nature with that of FRB 20180916B.
4.2 Nature of FRB 20180916B
The high-resolution, multi-band optical imaging and spectroscopy we present here provide important insights into the nature of FRB 20180916B, which complement what can be discerned from the spectro-temporal and polarimetric properties of the bursts themselves — as well as the periodic activity of the source. We first summarize what was known previously, and then discuss the implications of the new results we present here.
4.2.1 Previous results
Observations of 3–4 µs burst structure place tight constraints on the size of the emitting region (Nimmo et al., 2020); in the absence of special relativistic effects, this corresponds to a 1 km region, given light-crossing-time arguments. In the context of magnetar models, this short timescale, along with the range of observed temporal timescales spanning 3–4 orders of magnitude from µsms (Nimmo et al., 2020), is more naturally explained in terms of emission generated relatively close to the neutron star (Beniamini & Kumar, 2020; Lyutikov et al., 2020; Lu et al., 2020) — as opposed to much further out in a relativistic shock (Margalit & Metzger, 2018; Beloborodov, 2017).
The 16.35-day activity period is also a key insight, and differentiates FRB 20180916B from the isolated Galactic magnetar, and putative FRB source, SGR 1935+2154. If FRB 20180916B is produced by a strongly magnetised neutron star, some extra ingredient is necessary to understand the emission mechanism. The activity period could in principle be related to rotation (Beniamini et al., 2020b), precession (Levin et al., 2020; Zanazzi & Lai, 2020; Sob’yanin, 2020; Yang & Zou, 2020b) or an orbit (Mottez et al., 2020; Lyutikov et al., 2020; Ioka & Zhang, 2020a). The near constancy of polarization angle within and between bursts places strong constraints on precession models (Nimmo et al., 2020). The similar constraints imposed by the constant polarization angle of FRB 20121102A (Michilli et al., 2018) argue that precession models are disfavored. The variation in rotation measure, which may correlate with orbital phase (Pleunis et al., 2020), suggests the presence of a variable magneto-ionic medium around the system, which is naturally explained in an orbiting binary model. See Pleunis et al. (2020) also for a longer discussion of how the observed frequency dependence of observed burst activity could be interpreted in the context of a binary model.
4.2.2 Constraints from this work
First, the radial velocity measurements and kinematic modeling from the MEGARA observations show that the ‘V’-shaped structure is dynamically a part of the spiral galaxy and excludes the possibility that the ionized gas that we detect belongs to a satellite galaxy — a possibility discussed in Marcote et al. (2020), when only seeing-limited images and single-slit spectroscopy of the galaxy were available.
Our on/off observations constrain the luminosity of an unresolved H II region at the location of FRB 20180916B to be . The luminosities of H II regions range from (Fich et al., 1990; Azimlu et al., 2011), with the ‘knee’ of the distribution being . Thus we can rule out the brightest H II regions powered by the youngest massive stars. Specifically, based on the rate of ionizing photons and the corresponding luminosity, we can constrain a possible stellar companion to FRB 20180916B to be cooler and smaller than O6V and O7.5III spectral types. All supergiant O stars can be ruled out. emission line stars (late O or B spectral types), which have typical luminosities of – (Apparao & Tarafdar, 1997), cannot be ruled out by these observations.

Our HST observations demonstrate that FRB 20180916B is offset by pc from the nearest knot of active star formation in the host galaxy. The separation is measured from the brightest pixel of the F110W image. Bassa et al. (2017) found a comparably large, pc offset for FRB 20121102A. This is problematic for models that require a young magnetar (age of 10– yr), since such sources are invariably found close to their birth sites. For comparison, the scale height of Galactic magnetars is only 20–30 pc (Olausen & Kaspi, 2014). While scale heights are measured perpendicular to the plane of the Galaxy and the offset measured for FRB 20180916B is in the plane of its host, since natal kicks for magnetars are statistically isotropic, the comparison is valid. Figure 4 shows the expected age of FRB 20180916B given the range of possible offsets and the typical velocities of pulsars, magnetars, and X-ray binaries in the Milky Way. With the typical projected velocities of pulsars, magnetars, or neutron stars in binaries ( km s-1), FRB 20180916B would need 800 kyr to 7 Myr to traverse the observed distance from its presumed birth site. Even with a kick velocity of km s-1 at birth, a neutron star would still require Myr to traverse the 250 pc offset we determine for FRB 20180916B.
It is possible that a putative young magnetar was born at the edge of the star-forming region and did not have to travel very far from its birth site. However, such a magnetar is more likely to originate in a region with a higher density of massive star progenitors (i.e. the center of the cluster) rather than at the edges. It is not straightforward to quantify this probability distribution based on the F110W and F673N images. Hence, we show only the distance from the brightest pixel and an approximate size for the cluster in Figure 4, but the probability distribution is not uniform across the range.
Though magnetars may also be created in compact-binary mergers or accretion-induced collapse — as opposed to the core-collapse of a massive star — such channels have a much lower rate, and thus our findings suggest that FRB 20180916B is associated with a much older, Myr, neutron star. Nonetheless, the relative proximity of star-formation — in fact a very striking complex of star-forming regions in the host galaxy — is unlikely to be pure coincidence, and suggests that FRB 20180916B is not a very old ( Myr) system.
Another possibility is that a neutron star/magnetar is created in situ from the supernova of a runaway OB star (see Zinnecker & Yorke, 2007, for a review) — a massive star ejected from a dense stellar cluster through binary interactions at high velocities (). The neutron star/magnetar would be observed to be well-separated from the stellar cluster but be young enough to create its own energetic phenomena. However, the challenges with this channel are two-fold: First, runaway OB stars represent a small fraction of the population of OB stars (1–10%; Fujii & Portegies Zwart, 2011), and magnetars are a small fraction of the population of neutron stars (10% of core-collapse rate; see Kaspi & Beloborodov, 2017), so this channel has low likelihood. Secondly, given the speeds of these runaway stars (30–120 km s-1), they would still require many millions of years to achieve the observed physical offset which is a significant fraction of, if not greater than, the lifetimes of O stars. However, B stars which have longer lifetimes are still possible.
The Galactic population of high-mass X-ray binaries (HMXBs; Walter et al., 2015) and -ray binaries (Dubus, 2013) present a potentially interesting analogy. These systems feature a neutron star and high-mass O- or Be-star companion and have orbital periods that are comparable to FRB 20180916B’s 16.35-day activity period — e.g., 1FGL J1018.65856 ( day) and LS I +61∘303 ( day). Bodaghee et al. (2012) consider the spatial correlation of HMXBs and active OB star-forming complexes in the Milky Way. They find that the locations of HMXBs reflect the distributions of the massive star-forming regions that are expected to produce them. However, they also determine an average offset of kpc between HMXBs and OB associations, which they attribute to natal kick velocities of km s-1 and typical system ages of Myr.
Safarzadeh et al. (2020) analysed the star formation rate and the separations of FRBs from the centers of their host galaxies (host offsets) for 10 FRBs with secure host associations and compared them to a simple model where FRB rates are proportional to the recent star formation rate (as expected for prompt magnetars). They reported that the star formation rates measured from the host galaxies are incompatible with such a model but the host offset distribution is compatible. Bochenek et al. (2020b) did a similar study comparing the FRB hosts properties and offsets to those of core-collapse supernovae and showed that the star-formation rates and stellar masses of localized FRB hosts as well as host offsets can be consistent with an origin in magnetars formed from core-collapse supernovae. However, we note that the population of young neutron star binaries would follow the star formation rate and stellar mass distributions to a similar degree as magnetars born in core-collapse supernovae. This highlights the need for precision localization of FRBs: it is not sufficient to know that FRBs occur near star formation sites; we need to understand exactly how near they are located.
Interestingly, a 300-ms duration magnetar-like X-ray burst was detected in the direction of the -ray binary LSI +61∘303 (Torres et al., 2012) (though there is a non-zero probability that the X-ray burst came from an unrelated background magnetar). While the nature of the compact object in LSI +61∘303 is still debated, the detection of 269.196-ms radio pulsations from this direction suggests the presence of a neutron star in the binary (Weng* et al., 2021). This suggests that the magnetar-vs-binary scenarios are not exclusive. Indeed, the case has been made for magnetars in high-mass X-ray binaries (Popov, 2016), superfast X-ray transients (SFXTs; Bozzo et al., 2008), and ultra-luminous X-ray sources (ULXs; Tsygankov et al., 2016).
Thus, the activity period, positional offset and constraints on local emission are fully consistent with a picture in which FRB 20180916B is a neutron-star HMXB or -ray binary system with a late O-type or B-type companion. In such a scenario, interaction between the neutron star’s magnetic field and the ionised wind of the companion star may be key to creating the observed radio bursts (FRBs) themselves. Such interactions could create magnetic re-connections that provide the necessary ingredients to produce coherent radio bursts on a wide range of (apparent) timescales and luminosities. The observed periodic activity could then be a reflection of the observer’s line-of-sight. The companion wind will compress the magnetosphere of the neutron star on the companion-facing side and create a tail on the opposite side. An observer may then only see radio bursts when this magnetic tail is pointed towards Earth (Ioka & Zhang, 2020b). Alternatively, such systems are often found to have very high eccentricity (0.1–0.9), and the variable distance between the neutron star and companion could mean that the companion’s wind only strongly compresses the neutron star’s magnetosphere at certain orbital phases.
Other interacting binary models have also been proposed, including ones in which a stellar companion wind is generated by a millisecond pulsar (Ioka & Zhang, 2020b), or in which the neutron star’s magnetosphere is interacting with orbiting asteroids (Mottez et al., 2020). We cannot exclude such scenarios, since such systems can also satisfy the observed spatial offset. However, such systems could potentially be quite old ( Myr), and thus not naturally explain the relative proximity of FRB 20180916B to such a prominent complex of star formation in the host galaxy.
High-cadence searches for bright radio bursts from Galactic HMXBs and gamma-ray binaries can help to better establish a connection to FRB 20180916B. There are confirmed and suspected Be/X-ray binaries, -ray binaries and known HMXBs in the Milky Way and Magellanic Clouds (Reig, 2011), at distances of up to 50 kpc. At such distances, these sources would produce few hundred MJy-ms bursts, if the luminosity is comparable to the weakest bursts seen from FRB 20180916B. Small ( m) radio dishes and individual radio antennas are more than sensitive enough to detect such emission after surmounting the challenge of distinguishing bright astrophysical bursts from radio frequency interference (Tendulkar et al., 2016).
References
- Apparao & Tarafdar (1997) Apparao, K. M. V., & Tarafdar, S. P. 1997, Bulletin of the Astronomical Society of India, 25, 345
- Astropy Collaboration et al. (2013) Astropy Collaboration, Robitaille, T. P., Tollerud, E. J., et al. 2013, A&A, 558, A33, doi: 10.1051/0004-6361/201322068
- Astropy Collaboration et al. (2018) Astropy Collaboration, Price-Whelan, A. M., SipHocz, B. M., et al. 2018, aj, 156, 123, doi: 10.3847/1538-3881/aabc4f
- Azimlu et al. (2011) Azimlu, M., Marciniak, R., & Barmby, P. 2011, AJ, 142, 139, doi: 10.1088/0004-6256/142/4/139
- Bannister et al. (2019) Bannister, K. W., Deller, A. T., Phillips, C., et al. 2019, Science, 365, 565, doi: 10.1126/science.aaw5903
- Bassa et al. (2017) Bassa, C., Tendulkar, S., Adams, E., et al. 2017, The Astrophysical Journal Letters, 843, L8
- Beloborodov (2017) Beloborodov, A. M. 2017, ApJ, 843, L26, doi: 10.3847/2041-8213/aa78f3
- Beniamini & Kumar (2020) Beniamini, P., & Kumar, P. 2020, MNRAS, 498, 651, doi: 10.1093/mnras/staa2489
- Beniamini et al. (2020a) Beniamini, P., Wadiasingh, Z., & Metzger, B. D. 2020a, MNRAS, 496, 3390, doi: 10.1093/mnras/staa1783
- Beniamini et al. (2020b) —. 2020b, MNRAS, 496, 3390, doi: 10.1093/mnras/staa1783
- Bhandari et al. (2020a) Bhandari, S., Bannister, K. W., Lenc, E., et al. 2020a, ApJ, 901, L20, doi: 10.3847/2041-8213/abb462
- Bhandari et al. (2020b) Bhandari, S., Sadler, E. M., Prochaska, J. X., et al. 2020b, ApJ, 895, L37, doi: 10.3847/2041-8213/ab672e
- Bochenek et al. (2020a) Bochenek, C. D., Ravi, V., Belov, K. V., et al. 2020a, arXiv e-prints, arXiv:2005.10828. https://arxiv.org/abs/2005.10828
- Bochenek et al. (2020b) Bochenek, C. D., Ravi, V., & Dong, D. 2020b, arXiv e-prints, arXiv:2009.13030. https://arxiv.org/abs/2009.13030
- Bodaghee et al. (2012) Bodaghee, A., Tomsick, J. A., Rodriguez, J., & James, J. B. 2012, ApJ, 744, 108, doi: 10.1088/0004-637X/744/2/108
- Bozzo et al. (2008) Bozzo, E., Falanga, M., & Stella, L. 2008, ApJ, 683, 1031, doi: 10.1086/589990
- Carrasco et al. (2018) Carrasco, E., Gil de Paz, A., Gallego, J., et al. 2018, in Society of Photo-Optical Instrumentation Engineers (SPIE) Conference Series, Vol. 10702, Ground-based and Airborne Instrumentation for Astronomy VII, ed. C. J. Evans, L. Simard, & H. Takami, 1070216, doi: 10.1117/12.2313040
- Chatterjee et al. (2017) Chatterjee, S., Law, C. J., Wharton, R. S., et al. 2017, Nature, 541, 58. https://arxiv.org/abs/1701.01098
- CHIME/FRB Collaboration et al. (2019a) CHIME/FRB Collaboration, Andersen, B. C., Band ura, K., et al. 2019a, ApJ, 885, L24. https://arxiv.org/abs/1908.03507
- CHIME/FRB Collaboration et al. (2019b) CHIME/FRB Collaboration, Amiri, M., Bandura, K., et al. 2019b, Nature, 566, 235, doi: 10.1038/s41586-018-0864-x
- CHIME/FRB Collaboration et al. (2020a) CHIME/FRB Collaboration, Andersen, B. C., Bandura, K. M., et al. 2020a, arXiv e-prints, arXiv:2005.10324. https://arxiv.org/abs/2005.10324
- CHIME/FRB Collaboration et al. (2020b) CHIME/FRB Collaboration, Amiri, M., Andersen, B. C., et al. 2020b, Nature, 582, 351, doi: 10.1038/s41586-020-2398-2
- Chittidi et al. (2020) Chittidi, J. S., Simha, S., Mannings, A., et al. 2020, arXiv e-prints, arXiv:2005.13158. https://arxiv.org/abs/2005.13158
- Cordes & Chatterjee (2019) Cordes, J. M., & Chatterjee, S. 2019, ARA&A, 57, 417, doi: 10.1146/annurev-astro-091918-104501
- Cruces et al. (2020) Cruces, M., Spitler, L. G., Scholz, P., et al. 2020, arXiv e-prints, arXiv:2008.03461. https://arxiv.org/abs/2008.03461
- Cui et al. (2021) Cui, X.-H., Zhang, C.-M., Wang, S.-Q., et al. 2021, MNRAS, 500, 3275, doi: 10.1093/mnras/staa3351
- Day et al. (2020) Day, C. K., Deller, A. T., Shannon, R. M., et al. 2020, MNRAS, 497, 3335, doi: 10.1093/mnras/staa2138
- Ding et al. (2020) Ding, H., Deller, A. T., Lower, M. E., et al. 2020, MNRAS, 498, 3736, doi: 10.1093/mnras/staa2531
- Dolphin (2016) Dolphin, A. 2016, DOLPHOT: Stellar photometry. http://ascl.net/1608.013
- Dubus (2013) Dubus, G. 2013, A&A Rev., 21, 64, doi: 10.1007/s00159-013-0064-5
- Farah et al. (2018) Farah, W., Flynn, C., Bailes, M., et al. 2018, MNRAS, 478, 1209, doi: 10.1093/mnras/sty1122
- Fich et al. (1990) Fich, M., Treffers, R. R., & Dahl, G. P. 1990, AJ, 99, 622, doi: 10.1086/115356
- Fonseca et al. (2020) Fonseca, E., Andersen, B. C., Bhardwaj, M., et al. 2020, ApJ, 891, L6, doi: 10.3847/2041-8213/ab7208
- Fujii & Portegies Zwart (2011) Fujii, M. S., & Portegies Zwart, S. 2011, Science, 334, 1380, doi: 10.1126/science.1211927
- Gaia Collaboration et al. (2016) Gaia Collaboration, Prusti, T., de Bruijne, J. H. J., et al. 2016, A&A, 595, A1, doi: 10.1051/0004-6361/201629272
- Gaia Collaboration et al. (2018) Gaia Collaboration, Brown, A. G. A., Vallenari, A., et al. 2018, A&A, 616, A1, doi: 10.1051/0004-6361/201833051
- Gajjar et al. (2018) Gajjar, V., Siemion, A. P. V., Price, D. C., et al. 2018, ApJ, 863, 2, doi: 10.3847/1538-4357/aad005
- Gil de Paz et al. (2018) Gil de Paz, A., Carrasco, E., Gallego, J., et al. 2018, in Society of Photo-Optical Instrumentation Engineers (SPIE) Conference Series, Vol. 10702, Ground-based and Airborne Instrumentation for Astronomy VII, ed. C. J. Evans, L. Simard, & H. Takami, 1070217, doi: 10.1117/12.2313299
- Green et al. (2019) Green, G. M., Schlafly, E., Zucker, C., Speagle, J. S., & Finkbeiner, D. 2019, ApJ, 887, 93, doi: 10.3847/1538-4357/ab5362
- Gutiérrez et al. (2011) Gutiérrez, L., Beckman, J. E., & Buenrostro, V. 2011, AJ, 141, 113, doi: 10.1088/0004-6256/141/4/113
- Harris et al. (2020) Harris, C. R., Millman, K. J., van der Walt, S. J., et al. 2020, Nature, 585, 357–362, doi: 10.1038/s41586-020-2649-2
- Heintz et al. (2020) Heintz, K. E., Prochaska, J. X., Simha, S., et al. 2020, arXiv e-prints, arXiv:2009.10747. https://arxiv.org/abs/2009.10747
- Hessels et al. (2019) Hessels, J. W. T., Spitler, L. G., Seymour, A. D., et al. 2019, ApJ, 876, L23, doi: 10.3847/2041-8213/ab13ae
- Hilmarsson et al. (2020) Hilmarsson, G. H., Michilli, D., Spitler, L. G., et al. 2020, arXiv e-prints, arXiv:2009.12135. https://arxiv.org/abs/2009.12135
- Hobbs et al. (2005) Hobbs, G., Lorimer, D. R., Lyne, A. G., & Kramer, M. 2005, MNRAS, 360, 974, doi: 10.1111/j.1365-2966.2005.09087.x
- Ioka & Zhang (2020a) Ioka, K., & Zhang, B. 2020a, ApJ, 893, L26, doi: 10.3847/2041-8213/ab83fb
- Ioka & Zhang (2020b) —. 2020b, arXiv e-prints, arXiv:2002.08297. https://arxiv.org/abs/2002.08297
- Jedrzejewski (1987) Jedrzejewski, R. I. 1987, MNRAS, 226, 747, doi: 10.1093/mnras/226.4.747
- Josephy et al. (2019) Josephy, A., Chawla, P., Fonseca, E., et al. 2019, arXiv e-prints, arXiv:1906.11305. https://arxiv.org/abs/1906.11305
- Kaspi & Beloborodov (2017) Kaspi, V. M., & Beloborodov, A. M. 2017, Annual Review of Astronomy and Astrophysics, 55, 261
- Kewley et al. (2002) Kewley, L. J., Geller, M. J., Jansen, R. A., & Dopita, M. A. 2002, AJ, 124, 3135, doi: 10.1086/344487
- Kirsten et al. (2020) Kirsten, F., Snelders, M., Jenkins, M., et al. 2020, arXiv e-prints, arXiv:2007.05101. https://arxiv.org/abs/2007.05101
- Kokubo et al. (2017) Kokubo, M., Mitsuda, K., Sugai, H., et al. 2017, ApJ, 844, 95, doi: 10.3847/1538-4357/aa7b2d
- Levin et al. (2020) Levin, Y., Beloborodov, A. M., & Bransgrove, A. 2020, ApJ, 895, L30, doi: 10.3847/2041-8213/ab8c4c
- Li et al. (2020) Li, C. K., Lin, L., Xiong, S. L., et al. 2020, arXiv e-prints, arXiv:2005.11071. https://arxiv.org/abs/2005.11071
- Lorimer et al. (2007) Lorimer, D. R., Bailes, M., McLaughlin, M. A., Narkevic, D. J., & Crawford, F. 2007, Science, 318, 777. https://arxiv.org/abs/0709.4301
- Lu et al. (2020) Lu, W., Kumar, P., & Zhang, B. 2020, MNRAS, 498, 1397, doi: 10.1093/mnras/staa2450
- Luo et al. (2020) Luo, R., Wang, B. J., Men, Y. P., et al. 2020, Nature, 586, 693–696, doi: 10.1038/s41586-020-2827-2
- Lyutikov et al. (2020) Lyutikov, M., Barkov, M. V., & Giannios, D. 2020, ApJ, 893, L39, doi: 10.3847/2041-8213/ab87a4
- Macquart et al. (2020a) Macquart, J. P., Prochaska, J. X., McQuinn, M., et al. 2020a, Nature, 581, 391, doi: 10.1038/s41586-020-2300-2
- Macquart et al. (2020b) —. 2020b, Nature, 581, 391, doi: 10.1038/s41586-020-2300-2
- Mannings et al. (2020) Mannings, A. G., Fong, W.-f., Simha, S., et al. 2020, arXiv e-prints, arXiv:2012.11617. https://arxiv.org/abs/2012.11617
- Marcote et al. (2017) Marcote, B., Paragi, Z., Hessels, J. W. T., et al. 2017, ApJ, 834, L8. https://arxiv.org/abs/1701.01099
- Marcote et al. (2020) Marcote, B., Nimmo, K., Hessels, J. W. T., et al. 2020, Nature, 577, 190, doi: 10.1038/s41586-019-1866-z
- Margalit & Metzger (2018) Margalit, B., & Metzger, B. D. 2018, ApJ, 868, L4, doi: 10.3847/2041-8213/aaedad
- Marino et al. (2013) Marino, R. A., Rosales-Ortega, F. F., Sánchez, S. F., et al. 2013, A&A, 559, A114, doi: 10.1051/0004-6361/201321956
- Martins et al. (2005) Martins, F., Schaerer, D., & Hillier, D. J. 2005, A&A, 436, 1049, doi: 10.1051/0004-6361:20042386
- Mereghetti et al. (2020) Mereghetti, S., Savchenko, V., Ferrigno, C., et al. 2020, ApJ, 898, L29, doi: 10.3847/2041-8213/aba2cf
- Michilli et al. (2018) Michilli, D., Seymour, A., Hessels, J. W. T., et al. 2018, Nature, 533, 132
- Mottez et al. (2020) Mottez, F., Voisin, G., & Zarka, P. 2020, arXiv e-prints, arXiv:2002.12834. https://arxiv.org/abs/2002.12834
- Newville et al. (2014) Newville, M., Stensitzki, T., Allen, D. B., & Ingargiola, A. 2014, LMFIT: Non-Linear Least-Square Minimization and Curve-Fitting for Python, 0.8.0, Zenodo, doi: 10.5281/zenodo.11813
- Nimmo et al. (2020) Nimmo, K., Hessels, J. W. T., Keimpema, A., et al. 2020, arXiv e-prints, arXiv:2010.05800. https://arxiv.org/abs/2010.05800
- Olausen & Kaspi (2014) Olausen, S. A., & Kaspi, V. M. 2014, ApJS, 212, 6, doi: 10.1088/0067-0049/212/1/6
- Osterbrock & Ferland (2006) Osterbrock, D. E., & Ferland, G. J. 2006, Astrophysics Of Gas Nebulae and Active Galactic Nuclei (University science books)
- Pascual et al. (2019) Pascual, S., Cardiel, N., Gil de Paz, A., et al. 2019, in Highlights on Spanish Astrophysics X, ed. B. Montesinos, A. Asensio Ramos, F. Buitrago, R. Schödel, E. Villaver, S. Pérez-Hoyos, & I. Ordóñez-Etxeberria, 227–227
- Pascual et al. (2018) Pascual, S., Cardiel, N., Picazo-Sanchez, P., Castillo-Morales, A., & Gil de Paz, A. 2018, guaix-ucm/megaradrp: v0.8, v0.8, Zenodo, doi: 10.5281/zenodo.2206856
- Pecaut & Mamajek (2013) Pecaut, M. J., & Mamajek, E. E. 2013, ApJS, 208, 9, doi: 10.1088/0067-0049/208/1/9
- Petroff et al. (2019) Petroff, E., Hessels, J. W. T., & Lorimer, D. R. 2019, A&A Rev., 27, 4, doi: 10.1007/s00159-019-0116-6
- Platts et al. (2018) Platts, E., Weltman, A., Walters, A., et al. 2018, arXiv e-prints. https://arxiv.org/abs/1810.05836
- Pleunis et al. (2020) Pleunis, Z., Michilli, D., Bassa, C. G., et al. 2020, arXiv e-prints, arXiv:2012.08372. https://arxiv.org/abs/2012.08372
- Popov (2016) Popov, S. B. 2016, Astronomical and Astrophysical Transactions, 29, 183. https://arxiv.org/abs/1507.08192
- Popov (2020) —. 2020, Research Notes of the American Astronomical Society, 4, 98, doi: 10.3847/2515-5172/aba0af
- Prochaska et al. (2019) Prochaska, J. X., Macquart, J.-P., McQuinn, M., et al. 2019, Science, 366, 231, doi: 10.1126/science.aay0073
- Rajwade et al. (2020) Rajwade, K. M., Mickaliger, M. B., Stappers, B. W., et al. 2020, MNRAS, 495, 3551, doi: 10.1093/mnras/staa1237
- Ravi et al. (2019) Ravi, V., Catha, M., D’Addario, L., et al. 2019, Nature, 572, 352, doi: 10.1038/s41586-019-1389-7
- Reig (2011) Reig, P. 2011, Ap&SS, 332, 1, doi: 10.1007/s10509-010-0575-8
- Ridnaia et al. (2020) Ridnaia, A., Svinkin, D., Frederiks, D., et al. 2020, arXiv e-prints, arXiv:2005.11178. https://arxiv.org/abs/2005.11178
- Safarzadeh et al. (2020) Safarzadeh, M., Prochaska, J. X., Heintz, K. E., & Fong, W.-f. 2020, arXiv e-prints, arXiv:2009.11735. https://arxiv.org/abs/2009.11735
- Schlafly & Finkbeiner (2011) Schlafly, E. F., & Finkbeiner, D. P. 2011, ApJ, 737, 103, doi: 10.1088/0004-637X/737/2/103
- Scholz et al. (2017) Scholz, P., Bogdanov, S., Hessels, J. W. T., et al. 2017, ApJ, 846, 80, doi: 10.3847/1538-4357/aa8456
- Scholz et al. (2020) Scholz, P., Cook, A., Cruces, M., et al. 2020, ApJ, 901, 165, doi: 10.3847/1538-4357/abb1a8
- Shannon et al. (2018) Shannon, R. M., Macquart, J.-P., Bannister, K. W., et al. 2018, Nature, 562, 386, doi: 10.1038/s41586-018-0588-y
- Sob’yanin (2020) Sob’yanin, D. N. 2020, MNRAS, 497, 1001, doi: 10.1093/mnras/staa1976
- Spitler et al. (2014) Spitler, L. G., Cordes, J. M., Hessels, J. W. T., et al. 2014, ApJ, 790, 101. https://arxiv.org/abs/1404.2934
- Spitler et al. (2016) Spitler, L. G., Scholz, P., Hessels, J. W. T., et al. 2016, Nature, 531, 202. https://arxiv.org/abs/1603.00581
- Tavani et al. (2020) Tavani, M., Casentini, C., Ursi, A., et al. 2020, arXiv e-prints, arXiv:2005.12164. https://arxiv.org/abs/2005.12164
- Tendulkar (2014) Tendulkar, S. P. 2014, PhD thesis, California Institute of Technology
- Tendulkar et al. (2016) Tendulkar, S. P., Kaspi, V. M., & Patel, C. 2016, ApJ, 827, 59, doi: 10.3847/0004-637X/827/1/59
- Tendulkar et al. (2017) Tendulkar, S. P., Bassa, C. G., Cordes, J. M., et al. 2017, ApJ, 834, L7. https://arxiv.org/abs/1701.01100
- Torres et al. (2012) Torres, D. F., Rea, N., Esposito, P., et al. 2012, ApJ, 744, 106, doi: 10.1088/0004-637X/744/2/106
- Tsygankov et al. (2016) Tsygankov, S. S., Mushtukov, A. A., Suleimanov, V. F., & Poutanen, J. 2016, MNRAS, 457, 1101, doi: 10.1093/mnras/stw046
- Virtanen et al. (2020) Virtanen, P., Gommers, R., Oliphant, T. E., et al. 2020, Nature Methods, 17, 261, doi: 10.1038/s41592-019-0686-2
- Walter et al. (2015) Walter, R., Lutovinov, A. A., Bozzo, E., & Tsygankov, S. S. 2015, A&A Rev., 23, 2, doi: 10.1007/s00159-015-0082-6
- Weng* et al. (2021) Weng*, S.-S., Pan*, Z., Qian*, L., et al. 2021, The Astronomer’s Telegram, 14297, 1
- Worthey & Lee (2011) Worthey, G., & Lee, H.-c. 2011, ApJS, 193, 1, doi: 10.1088/0067-0049/193/1/1
- Yang & Zou (2020a) Yang, H., & Zou, Y.-C. 2020a, ApJ, 893, L31, doi: 10.3847/2041-8213/ab800f
- Yang & Zou (2020b) —. 2020b, ApJ, 893, L31, doi: 10.3847/2041-8213/ab800f
- Zanazzi & Lai (2020) Zanazzi, J. J., & Lai, D. 2020, ApJ, 892, L15, doi: 10.3847/2041-8213/ab7cdd
- Zhang & Gao (2020) Zhang, X., & Gao, H. 2020, MNRAS, 498, L1, doi: 10.1093/mnrasl/slaa116
- Zinnecker & Yorke (2007) Zinnecker, H., & Yorke, H. W. 2007, ARA&A, 45, 481, doi: 10.1146/annurev.astro.44.051905.092549