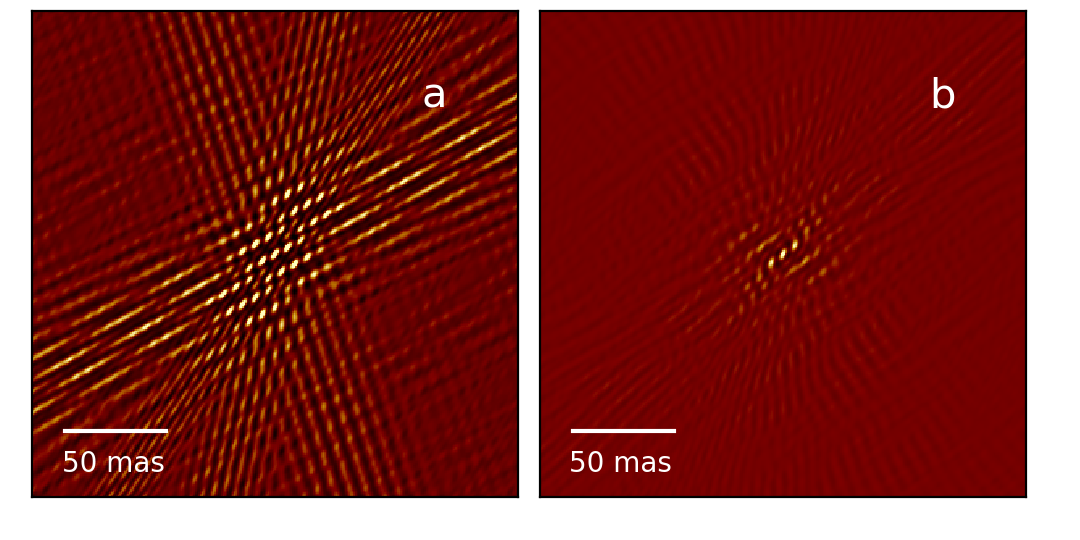
Detection of faint stars near Sgr A* with GRAVITY
The spin of the supermassive black hole that resides at the Galactic Centre can in principle be measured by accurate measurements of the orbits of stars that are much closer to Sgr A* than S2, the orbit of which recently provided the measurement of the gravitational redshift and the Schwarzschild precession. The GRAVITY near-infrared interferometric instrument combining the four 8m telescopes of the VLT provides a spatial resolution of 2-4 mas, breaking the confusion barrier for adaptive-optics-assisted imaging with a single 8-10m telescope. We used GRAVITY to observe Sgr A* over a period of six months in 2019 and employed interferometric reconstruction methods developed in radio astronomy to search for faint objects near Sgr A*. This revealed a slowly moving star of magnitude 18.9 in K band within 30mas of Sgr A*. The position and proper motion of the star are consistent with the previously known star S62, which is at a substantially larger physical distance, but in projection passes close to Sgr A*. Observations in August and September 2019 easily detected S29, with K-magnitude of 16.6, at approximately 130 mas from Sgr A*. The planned upgrades of GRAVITY, and further improvements in the calibration, hold the promise of finding stars fainter than magnitude 19 at K.
Key Words.:
galactic center – stellar population – general relativity1 Introduction
The Galactic Center (GC) excels as a laboratory for astrophysics and general relativity (GR) around a massive black hole (MBH, Genzel et al. 2010). The observation of stellar orbits in the GC around the radio source Sgr A* (Eckart & Genzel, 1996; Ghez et al., 1998; Schödel et al., 2002; Ghez et al., 2003, 2008; Gillessen et al., 2009, 2017) has opened a route to testing gravity in the vicinity of a MBH with clean test particles. The gravitational redshift from Sgr A* has been seen at high significance in the spectrum of the star S2 during the 2018 pericenter passage on its 16-year orbit (GRAVITY Collaboration et al., 2018a, 2019; Do et al., 2019). Recently the relativistic Schwarzschild precession of the pericenter has been detected in S2’s orbit as well (GRAVITY Collaboration et al., 2020a). The effects detected are of order where (Zucker et al., 2006). It is not clear, however, whether higher order effects such as the Lense-Thirring precession due to the spin of the black hole can be detected in the orbit of S2, since these fall off faster with distance from the MBH. In addition, stars located farther away from Sgr A* will be more affected by Newtonian perturbations by surrounding stars and dark objects, which can make a spin measurement with S2 more difficult (Merritt et al., 2010; Zhang & Iorio, 2017). Hence, it is natural to look for stars at smaller radii. In particular, such a star could offer the possibility of measuring Sgr A*’s spin (Waisberg et al., 2018). If it were possible to additionally measure the quadrupole moment of the MBH in an independent way, the relation between these two parameters would constitute a test of the no-hair theorem of GR (Will, 2008; Waisberg et al., 2018).
Beyond the purpose of testing GR, the GC cluster is the most important template for galactic nuclei. These are the sites of extreme mass ratio inspirals (Amaro-Seoane et al., 2007), one of the source categories for the gravitational wave observatory LISA (Baker et al., 2019). Understanding the GC cluster down to the smallest possible scales will deliver important anchor points for understanding the structure and dynamics of these stellar systems, and thus for predictions of the expected event rates.
The number of stars expected at smaller radii has until now been estimated by extrapolating the density profile in the GC to radii smaller than the resolution limit of mas in the near-infrared provided by 8-10m class telescopes and at the same time extrapolating the mass function to stars fainter than the confusion limit in the central arcsecond around . Both functions have been determined in the literature (Genzel et al., 2003b; Do et al., 2013; Gallego-Cano et al., 2018), and the resulting estimate for the number of stars suitable for GR tests is of order 1 (Waisberg et al., 2018).
The near-infrared interferometric instrument GRAVITY (GRAVITY Collaboration et al., 2017) coupled to the four 8m telescopes of the VLT makes it possible to detect and trace such faint stars for the first time with an angular resolution that exceeds that of adaptive-optics assisted imaging on 8-10m telescopes by a factor of 20. Here, we report on the detection of a faint star () within mas of Sgr A*. We use the classical radio interferometry data reduction/image reconstruction package Astronomy Image Process Software (AIPS, Greisen 2003) for our work. This detection does not yet explore the signal-to-noise ratio limit of GRAVITY, but is limited by our ability to model the point spread function (PSF) of the sparse 4-telescope interferometer and the presence of other sources and their sidelobes in the field-of-view (FOV).
This paper is organized as follows: We describe our observation in Section 2. Then in Section 3 we describe in detail the data reduction and image reconstruction process to derive the images with Sgr A* removed. We show the faint star detection in Section 4, together with validation from model fitting and constraints on the proper motion of the detected star. We cross-check our detection with the expected positions of known S-stars and also give the limitation of our current imaging technique in Section 5. Finally, we give our conclusion in Section 6.

2 Observations
We observed Sgr A* and the immediate surrounding (Fig. 1) using the VLT/GRAVITY instrument at ESO Paranal Observatory between 2019 March 27th and 2019 September 15th, under the GTO program ID 0102.B-0689 and 0103.B-0032, spread over a total of 28 nights. The data are the same as those used in GRAVITY Collaboration et al. (2020a). Compared to the 2017 and 2018 data on the Galactic Center, the 2019 data have the advantage that for the first time the bright star S2 has moved sufficiently far away from Sgr A* that its sidelobes do not dominate the residual structure in CLEANed 111Throughout this paper, we use the term ”CLEANed” image to denote a deconvolved image after applying the CLEAN algorithm. images.
We used the low spectral resolution and the split polarization mode. The nearby star IRS 7 was used for the adaptive optics correction, and we chose IRS 16C within the 2” VLTI field of view for fringe-tracking with the highest tracking rate of 1kHz. We list the observing dates and numbers of Sgr A* frames used for imaging in Table 1.
| Date | Incl. | ||
| 2019-03-27 | 6 | 0 | N |
| 2019-03-28 | 8 | 0 | N |
| 2019-03-30 | 2 | 0 | N |
| 2019-03-31 | 5 | 0 | N |
| 2019-04-15 | 8 | 0 | N |
| 2019-04-16 | 4 | 0 | N |
| 2019-04-18 | 17 | 17 | Y |
| 2019-04-19 | 12 | 10 | Y |
| 2019-04-21 | 28 | 11 | N |
| 2019-06-13 | 4 | 0 | N |
| 2019-06-14 | 4 | 0 | N |
| 2019-06-16 | 17 | 4 | N |
| 2019-06-17 | 5 | 0 | N |
| 2019-06-18 | 4 | 0 | N |
| 2019-06-19 | 8 | 6 | N |
| 2019-06-20 | 27 | 15 | Y |
| 2019-07-15 | 8 | 7 | Y |
| 2019-07-17 | 39 | 32 | Y |
| 2019-08-13 | 21 | 21 | Y |
| 2019-08-14 | 10 | 8 | Y |
| 2019-08-15 | 25 | 25 | Y |
| 2019-08-17 | 8 | 0 | N |
| 2019-08-18 | 18 | 14 | Y |
| 2019-08-19 | 21 | 15 | Y |
| 2019-09-11 | 9 | 8 | Y |
| 2019-09-12 | 14 | 8 | Y |
| 2019-09-13 | 11 | 5 | Y |
| 2019-09-15 | 12 | 10 | Y |
During most of our observations, we centered the science fiber on Sgr A*. The science fiber has an acceptance angle of mas full width half maximum. Each frame lasted 320 seconds, composed of 32 exposures of 10 seconds. During each night’s observation we also pointed the science fiber to the nearby bright stars S2 and R2 ( mag, separation 1.5), bracketing the Sgr A* observing blocks for later calibration purposes.
On the nights of August 13th, 14th and September 13th 2019, in addition to the standard Sgr A* observing sequence, we also pointed the science fiber at mas relative to Sgr A* to check the potential detection of a proposed short period faint star as reported by Peissker et al. (2020).
3 Data reduction, calibration and image reconstruction
The data reduction consists of several steps. We reduce each night’s data separately. The first step is to use the standard GRAVITY pipeline (Lapeyrère et al., 2014) to calibrate the instrumental response and derive calibrated interferometric quantities from the raw data. We follow the default pipeline settings except for the calibration step, where we only use a single, carefully chosen S2 frame to calibrate the Sgr A* data for each night.
3.1 Data format conversion
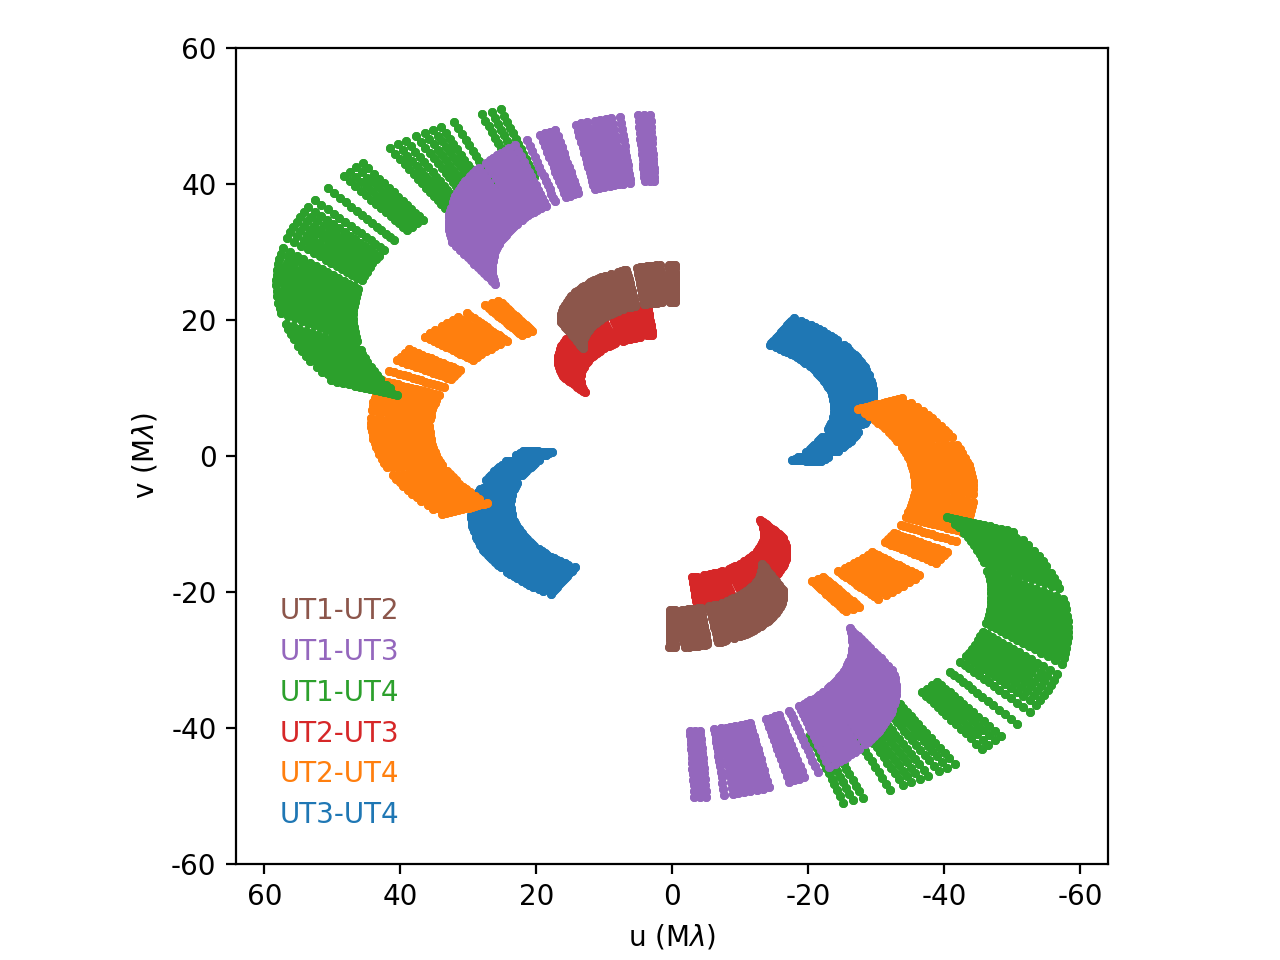
The standard GRAVITY data products after calibration are stored in the OIFITS format (Duvert et al., 2017). In order to benefit from existing radio interferometry imaging reconstruction software and algorithms, we here converted the GRAVITY data product into the UVFITS format (Greisen 2003), which is commonly used in radio interferometry.
The conversion was done with a python script which we adapted from the EHT-imaging package (Event Horizon Telescope Collaboration et al., 2019). The essential data we read in from the calibrated OIFITS files are the VISAMP, VISPHI, MJD and U-V coordinates (UCOORD, VCOORD) columns from the OIVIS table for the science channel output together with the corresponding OIFLUX table. We then rewrite these following the UVFITS format convention. We also take the OIWAVELENGTH table and write it into the FQ table used in UVFITS. Since the effective bandwidth for each wavelength output is different, we put each wavelength output as an independent intermediate frequency (IF) rather than an independent channel in the UVFITS file.
3.2 Additional amplitude calibration
Before writing out the UVFITS data product, we re-calibrate and re-scale the visibility amplitudes with the photometric flux of each baseline calculated from each telescope pair (using the OIFLUX table). This allows us to get the correlated flux from each baseline instead of the default normalized visibility, which does not reflect the true brightness of the target. During this step, we also correct for the attenuation of the telescope flux due to different air mass and AO correction by fitting a polynomial function to the OIFLUX of several S2 frames per telescope across one night and interpolating the correction per telescope accordingly.
We then renormalize each visibility amplitude with that of the S2 frame used for calibration in the previous step. Thus, our visibility amplitudes are normalized such that a visibility amplitude of 1 equals S2’s magnitude in the Ks band (mK = 14.1, Gillessen et al. 2017).
The final VISAMP quantity we write out is:
| (1) |
where is the pipeline-produced visibility amplitude of a certain target frame at time between telescope and , is the measured flux from telescope at time , and is the fitted air mass correction coefficient for telescope at time . The time corresponds to the S2 frame used for calibration in the GRAVITY pipeline.
3.3 Image reconstruction and deconvolution with CLEAN
After the data reduction steps, we load the calibrated and amplitude renormalized complex visibility data into AIPS for image reconstruction with the task IMAGR. Sgr A* is known to exhibit variability on a time scale of minutes in the near-infrared (Genzel et al., 2003a; Ghez et al., 2004; Gillessen et al., 2006; Eckart et al., 2008; Do et al., 2009; Dodds-Eden et al., 2011; Witzel et al., 2018; GRAVITY Collaboration et al., 2020a, b). This variability must be taken into account during image reconstruction in order to remove as much as possible the sidelobes of Sgr A*, which dominate the residual map and limit the sensitivity. We reduce the impact of the variability by reconstructing each 320 seconds long frame individually. While the variability on this time scale can be high during flares, it is much lower during quiescent phases. Consequently, we assume the flux to be constant over the duration of each frame.
In the spectral domain, we only include data from m to m in order to minimize systematic biases from the edge channels, which are subject to increased instrumental (short wavelengths) and thermal (long wavelengths) background. We use the data from both polarizations (as Stokes I) in the reconstruction of the images. Given that our synthesized beam size is about mas, we choose a pixel size of mas and an image size of pixels, which can fully cover the fiber FOV with a FWHM of about 74 mas. When applying CLEAN to the Sgr A* frames, we applied a spectral index of +6. 333We only keep frames where Sgr A* is relatively faint for later analysis, in which case Sgr A* is expected to have a near-infrared spectral index () between -3 and -1 (Genzel et al., 2010; Witzel et al., 2018). Since we use S2 data to normalize the Sgr A* data, we take into account a spectral index of +2 from the Rayleigh-Jeans approximation of the black body radiation from S2: this would give us a spectral index range of -1 between -6 and -4. We then choose the value of -6 as to cover the extreme cases and finally we flip the sign to follow the spectral index definition in AIPS to get the +6 value. The IMAGR task requires the user to choose the data weighting via a parameter called ROBUST, which we set to zero. This ensures a balanced result between natural and uniform weighting. The outputs at this stage are so-called ”dirty images”, which in theory are the convolution of the source distribution with the beam pattern.
We found the following procedure effective for creating residual images, in which we can identify additional sources beyond Sgr A*, from the dirty images:
CLEAN. Per 320 seconds frame, we used a small pre-defined clean box centered on Sgr A*—the central and brightest spot—with a size of pixels (i.e. smaller than the spatial periodicity of the beam pattern and thus avoiding any sidelobes). We iterate until the first negative CLEAN component appears. We repeat the same process for all the frames in a certain night to get a series of CLEANed images and residual images.
Selection. We then visually check the CLEANed image and the residual image with the following two criteria: 1) the CLEANed image shows no signs of abnormal instrumental behavior or strong baseline pattern for a specific baseline. 2) the peak value on the residual image is below 0.8 mJy. Due to the limited dynamic range we can reach with the CLEAN algorithm here, the 2nd criterion limits us to only those frames where Sgr A* is relatively faint (below 2 mJy).
Subtraction of Sgr A*. After that, we subtract the respective CLEAN component model from each frame in the visibility domain with the AIPS task UVSUB.
Combine and re-image Sgr A*-removed data for one night. Further, we group the data by each night and combine them in the uv domain with the AIPS task DBCON. Then we re-image them to get Sgr A*-removed images per night. Before we combine the data per month, we first cross-check these images with the criteria mentioned in the next section.
We note that we also tried to clean the images with the phase-only self-calibration by using the task CALIB. However, this did not improve our residual image in general, so no self-calibration was included in our data reduction process.
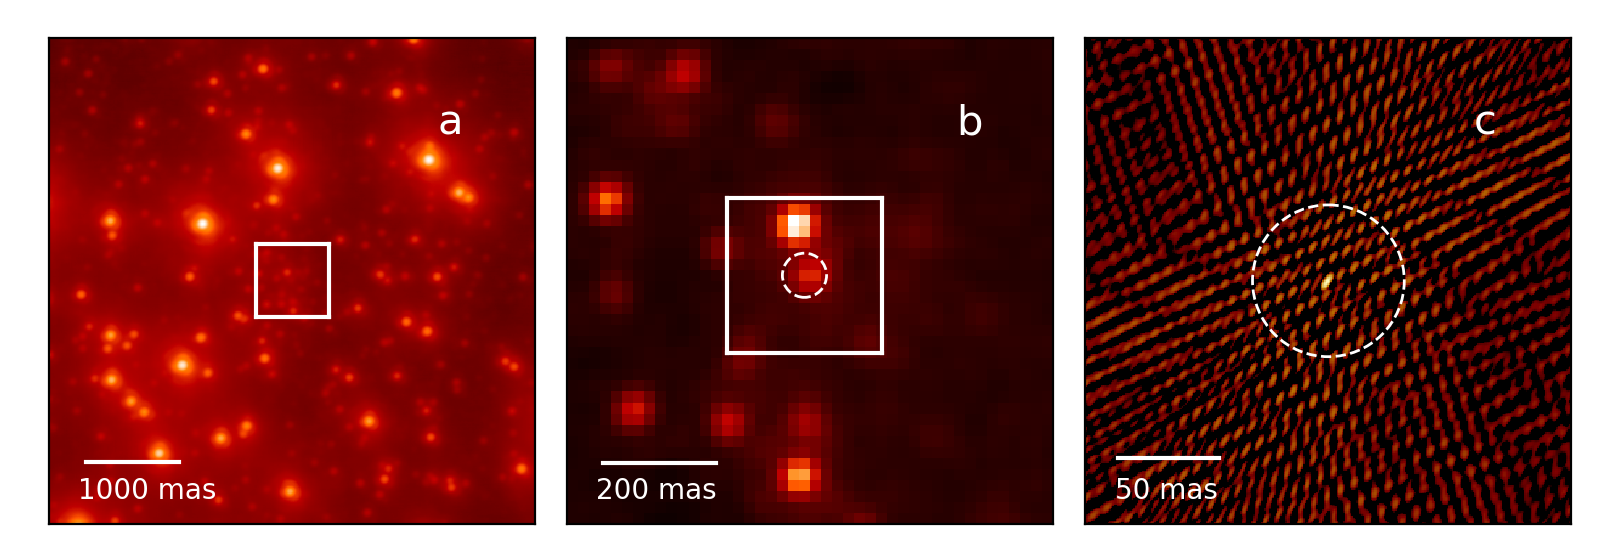
As an example, we show in Fig. 2 the GC region as observed by the VLT NACO instrument, the GRAVITY acquisition camera and one Sgr A* reconstructed image.
3.4 Sanity checks
Apart from imaging Sgr A* frames, we also repeat the same imaging procedure on S2 frames and R2 frames for each night (with a spectral index of 0) as a sanity check for the instrument behavior. This allows us to check our flux calibration as the magnitude of both S2 and R2 are known and they are not variable. Additionally, we can use these data to gauge the dynamic range we could reach with our method and compare that to the Sgr A* frames.
4 Results
4.1 Source identification
We first estimate in section 4.1.1 how much on-sky movement we might expect from a star close to Sgr A*, which puts a limit on how much data we can combine in time before our images are smeared. Then we describe the image co-adding in section 4.1.2.
4.1.1 Prerequisite requirement on the movement of a tentative star
A star belonging to the Sgr A* system is gravitationally bound to the massive black hole, and hence it is useful to know the escape velocity for stars within our field of view. For a star located mas away from Sgr A*, the escape velocity is km s-1, corresponding to . The day-to-day motion of the star on the sky is smaller than mas, and smaller than mas from month to month. Hence, a tentative star should show up in the images of multiple nights in a month in the same position, given that our synthesis beam size is about 2 4 mas. From one month to the next, the star might move by at most a few times the beam size. We can thus co-add the frames per month.
4.1.2 Co-adding
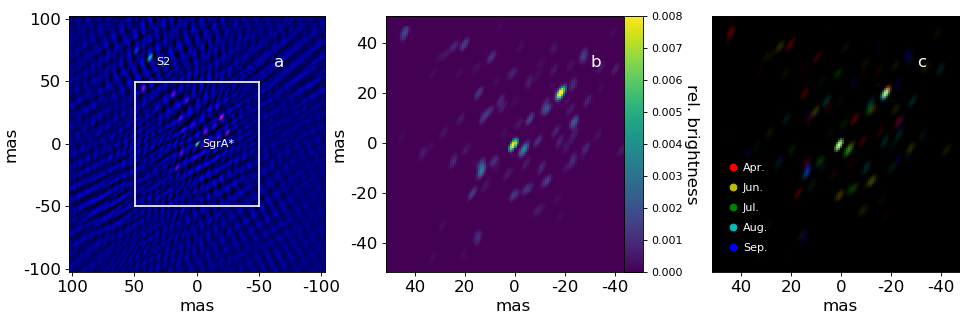
At this stage, we have a series of Sgr A*-removed images per night for March, April, June, July, August and September in 2019. We first cross-check the multiple images for each month, knowing that a real source would not move between the nights within a given month. We deselect frames which visually deviate strongly from the monthly sample. This is a very helpful selection criterion, since the total number of Sgr A* frames per night varies greatly, and we do not always reach the same sensitivity level. Since we reset our instrument every night, instrumental misbehavior or bad observing conditions are more likely to affect the image from a single night only. Finally, we average the remaining images to derive the best Sgr A* removed image per month, shown in Fig. 3.

We have tried to run the CLEAN algorithm on these Sgr A*-removed images, on both the manually and automatically selected peak positions. However, the CLEAN algorithm does not finish successfully in several instances, and hence we cannot robustly CLEAN these images. We speculate that this is because the dirty image pattern on the Sgr A*-removed images sometimes shows distortion due to time-variable systematic errors, which prevent the CLEAN algorithm from converging. Hence, we keep these Sgr A*-removed, but not further deconvolved images for a manual analysis in the next step.
4.2 Inspection of monthly co-adds
The monthly co-added images show multiple patches with some bright features embedded. These are a combination of any targets in the field convolved with our interferometric beam plus the interferometric residual background.
The most prominent bright feature on these images is the one to the northeast of Sgr A*, which is the star S2 (with the distorting effect from bandwidth smearing, and a brightness damped by our fiber profile). Despite its distance exceeding the nominal field of view of GRAVITY, S2 is very robustly detected in all images.
Besides S2, we noticed a bright feature to the northwest of Sgr A* consistently showing up in all our images. This second-most prominent feature over the sample of images corresponds to another star, as we show below. We perform a 2-D Gaussian fit on this bright feature to get the position and brightness relative to Sgr A* (see Table 2).
Since we use S2 frames to renormalize the Sgr A* frames, the target brightness is also normalized to S2. The relative brightness of this tentative star is , which is times or magnitudes fainter than S2, a 14.1 magnitude source in K-band Gillessen et al. (2009). The detected object is about 27 mas away from Sgr A*, which corresponds to a fiber damping loss (described by a Gaussian function with a full width half maximum of 74 mas) of . Taking this effect into account, the intrinsic brightness of this object is .
| Date of the | RA | RA err. | DEC. | DEC. err. | relative | relative | 1- | number of |
|---|---|---|---|---|---|---|---|---|
| averaged image | (mas) | (mas) | (mas) | (mas) | brightness | brightness of S2 | noise level | frames used |
| 2019.30 (Apr.18) | -19.18 | 0.18 | 20.78 | 0.27 | 0.009 | 0.013 | 0.0019 | 27 |
| 2019.47 (Jun.19) | -18.78 | 0.14 | 19.80 | 0.23 | 0.009 | 0.011 | 0.0018 | 15 |
| 2019.54 (Jul.17) | -18.62 | 0.26 | 19.73 | 0.30 | 0.007 | 0.009 | 0.0017 | 39 |
| 2019.62 (Aug.16) | -18.49 | 0.11 | 19.88 | 0.29 | 0.008 | 0.009 | 0.0014 | 83 |
| 2019.70 (Sep.12) | -18.14 | 0.15 | 19.57 | 0.34 | 0.009 | 0.011 | 0.0017 | 31 |
4.3 Limiting magnitude in our images
To estimate the noise level on the final best Sgr A* removed residual image per month, we select the central 74 mas 74 mas region on each image, which corresponds to the FWHM of the fiber FOV and also blank out the 5 5 mas region around the peak of our newly detected star. We then quote the root-mean-square (rms) calculated in this region as the 1- noise level for the residual image. S2 is located outside of this region, so it does not affect the noise calculation here. We report these numbers in Table 2. As the flux in our images is normalized to S2, so is the 1- noise level. We find a mean noise level of in relative brightness, corresponding to . This is the statistical limit corresponding to the brightness of a star that would create a peak in our images comparable to the noise floor in the absence of systematics. For a 5- detection, an object would need to be at least as bright as if no systematics were present. We note here that these numbers are ”apparent” magnitudes in the sense that no fiber damping effects have been considered. Therefore, the real magnitude of the star for a 5- detection will be between 18.5 and 19.3 magnitude, depending on the distance to the center of the field.
4.4 Interferometric model fit of the data
Since the star we detected is just above the 5- detection level, we use the Meudon model-fitting code as an independent way of verifying that our detection is real. This code was already used in our papers on the orbit of S2 (GRAVITY Collaboration et al., 2018a) and is able to fit two or three sources.
Our image reconstruction relies on the complex visibilities, i.e. amplitude and phase. The model fit, on the other hand, uses closure amplitudes and phases, giving equal weight to each.
We select the same frames as for the image reconstruction and fit the frames from each night together, but separate the two polarisation states. For each night, we fit one flux per file for Sgr A*, one flux per file and per telescope for S2, a single background flux, a spectral index for Sgr A*, and a single position for S2 and the third source respectively (neglecting proper motion over the course of the night). S2, the third source, and the background are assumed to have a common spectral index, which is fixed.
Blindly starting such a fit would very likely not find the best minimum, and hence we fed the fitting routine with starting values derived from our imaging. We applied a simple minimization algorithm to explore the parameter space in the 10 mas region around the position of the star derived from imaging.
In all cases, the fits recovered the third star. The reduced is of the order 2-3. Comparing the Bayesian information criterion (BIC) of the fits with and without the third source strongly supports its presence, and the third source is consistently found at the position revealed by the imaging reconstruction to within the uncertainties. For example, for the night of April 18th, 2019, using polarization state P1, the triple source model yields a reduced of 2.1 and a BIC of 493 while the binary model yields a reduced of 2.9 and a BIC of 664. BIC is thus 171. The significance of the detection estimated as flux over uncertainty of the third source is 9.6 . The polarization P2 yields similar statistical estimators. We note the improvement by fitting three stars instead of two stars is not obvious within a 5-minute frame but only for a full night of data.
4.5 Further checks
To further verify our detection, we also reconstruct images for each (linear) polarization channel of GRAVITY separately. Our newly detected star appears in both channels, indicating an origin from the sky rather than a noise artifact.
We further run the CLEAN process on Sgr A* (for which the spectral index is only poorly constrained) using a spectral index of zero, and we can still recover the newly detected star in the residual images. Since we only remove Sgr A*, any difference between using different spectral indices must come from sidelobes and beam patterns related to Sgr A*. This is especially helpful when there are only fewer than ten frames available for a certain night.
We can also rule out that the detection is caused by the overlap of sidelobes from S2 and Sgr A*. As shown in the appendix, three out of six baseline patterns are oriented in the southeast-northwest direction and one baseline pattern is oriented in the northeast-southwest direction. In principle, these baseline patterns could mimic a detection. However, since S2 is moving away from Sgr A*, any fake target formed in this way should also move away from Sgr A* in parallel to S2’s motion. This is inconsistent with the star showing up at (almost) the same position over five months.
4.6 Motion on the sky of the star
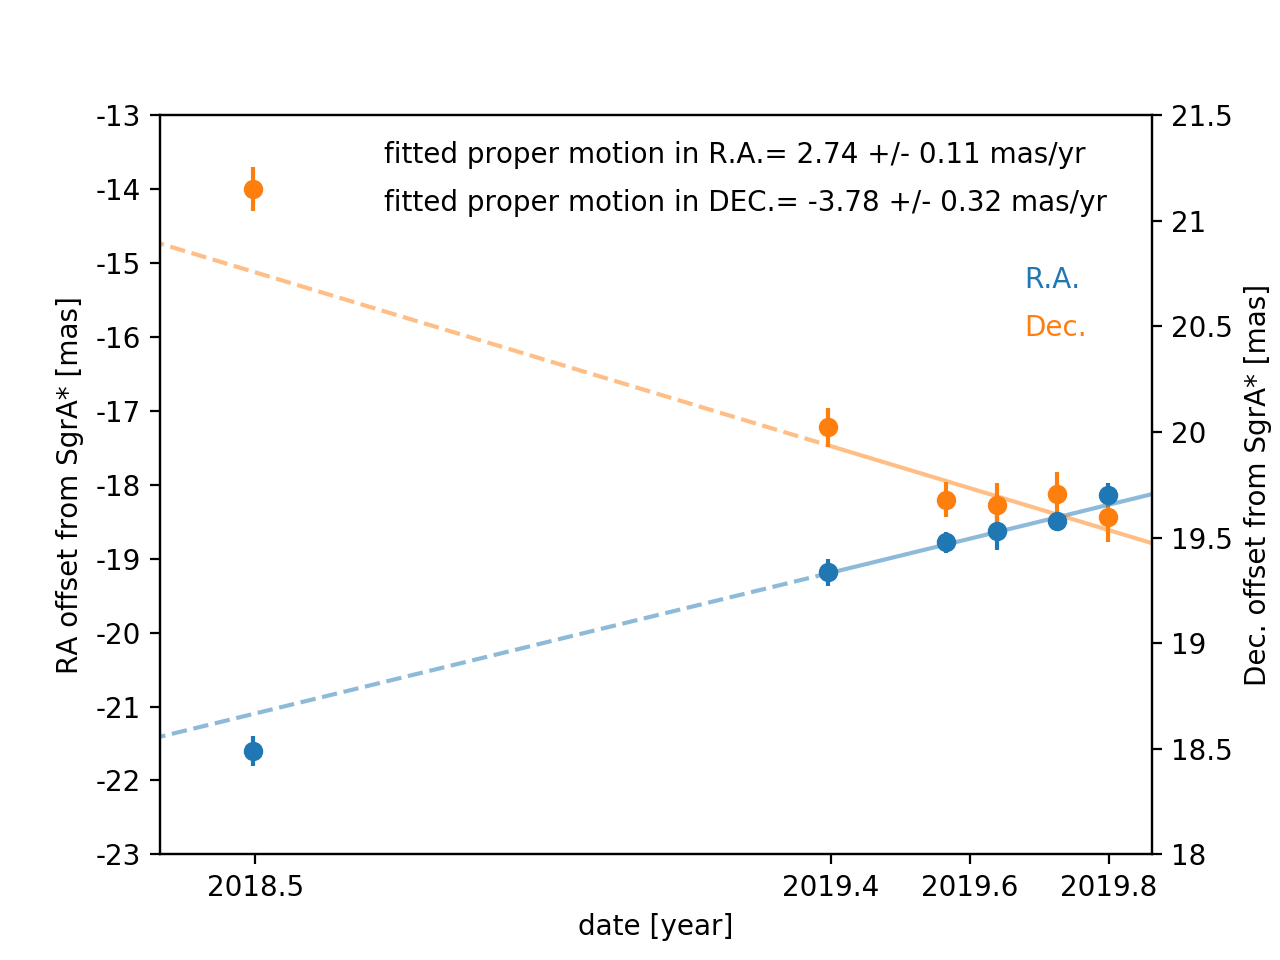
We show the change of position of our newly detected star as a function of time in Fig. 4. We see regular changes in both R.A. and Dec. with time, and a simple linear fitting (shown in solid line) gives a proper motion in R.A. of mas yr-1 and in Dec. of mas yr-1.
We list the proper motions measured based on the positions derived from the model fitting method in Table 3. These results are within 4- uncertainties of the image-based results.
| Method/data | pR.A. | pR.A. | pDec | pDec |
|---|---|---|---|---|
| imaging (2019) | 2.38 | 0.29 | -2.74 | 0.97 |
| model fitting P1 | 3.36 | 0.82 | -4.44 | 1.33 |
| model fitting P2 | 3.33 | 0.49 | -4.08 | 1.17 |
| imaging 2019 + 2018 | 2.74 | 0.11 | -3.78 | 0.32 |
4.7 Tentative detection from 2018 data
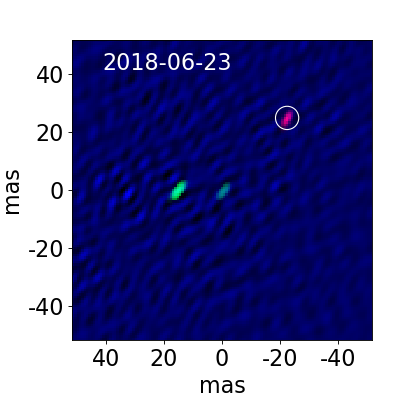
Due to the relatively small proper motion of our newly detected star, we predict that it is also located inside our field of view in the 2017 and 2018 data. We have re-checked the images reconstructed from the 2017 and 2018 data (GRAVITY Collaboration et al., 2018a) and noticed a tentative detection near the extrapolated position at the 3 level in one epoch (2018.48, 2018-06-23). We show the reconstructed three-color image in Fig. 5. The measured position offset of this tentative detection to Sgr A* is -21.6 0.2 mas in R.A. and 24.0 0.3 mas in Dec. We also refit the proper motion with both 2018 and 2019 positions and find a value of mas yr-1 in R.A. and mas yr-1 in Dec.
5 Discussion
In this section we discuss the nature of the object that has been detected in section 5.1 and 5.2, and we illustrate our current limitation of the imaging technique in section 5.3.
5.1 Identification of the detected object and constraints on the 3D position
With the position on the sky and the proper motion derived for the detected star, we cross-check whether any of the known S-stars in the Galactic Center region can be identified with this object. Inspecting the search map in figure 1 shows that only a handful of stars could potentially be the detected star. Combining the adaptive-optics based astrometry with the new positions leads to a clear best match: S62. We show the on-sky position of this star from previous NACO images and from our results together in Fig. 6.
Since S62 is at least in projection close to Sgr A*, it is worth asking why the motion appears to be linear with constant velocity. Given the projected separation of mas and the lack of observed acceleration, we can derive a lower limit on the coordinate along the line of sight. At a distance of mas, we would have detected an acceleration with significance, and at mas the significance would have reached . We conclude that S62 resides at mas. Further data will of course either improve this limit or eventually detect an acceleration and thus determine .
5.2 S62 and S29


Our data and identification are inconsistent with the conclusions of Peissker et al. (2020), who reported previously an orbit for S62 with a 9.9-year period and extreme eccentricity. Their proposed orbit predicts a position of (RA, Dec)mas over the time span of our observations, with a proper motion of mas . The position is outside the FOV of our GRAVITY data centered on Sgr A* and incompatible with our detection reported here. Hence, we address the question what object Peissker et al. (2020) have actually seen.
To check the position proposed by Peissker et al. (2020), we pointed GRAVITY to the position in question on 13, 14 August 2019 and 13 September 2019. In all three epochs, we find a single dominant source in the field of view, for which we can derive dual-beam positions (for the methodology see GRAVITY Collaboration et al. 2020a). We verify that what we observed is a celestial source by offsetting our science fiber pointing position by 10 mas to the east and north separately on August 14th, and we do see the single dominant source appearing west and south of the image center by 10 mas. The observed target is about 10 times fainter than S2, so 16.6 mag. The August position is mas with an uncertainty around 0.1 mas. In September, the object was at mas with a similar uncertainty. The resulting proper motion is thus mas , where the errors are in the mas regime. This object moves thus much faster than what Peissker et al. (2020) predict on basis of their proposed orbit for the object they assume was S62 near its apocenter.
The positions and proper motions from GRAVITY match perfectly the orbital trace of the star S29 (Gillessen et al., 2017), as shown in Fig. 6. We conclude that the offset pointing in August and September 2019 with GRAVITY has seen S29, but we cannot report the detection of any object that would correspond to the 9.9-year orbit claimed by Peissker et al. (2020).
With a much higher spatial resolution from our data, we are not able to confirm the findings of Peissker et al. (2020), and we can only speculate whether possibly misidentifying S29 with S62 in the lower resolution NACO images of the past few years yields the 9.9-year orbit.
5.3 Limitations of our imaging technique
In section 4.3 we showed that our current detection limit is at the 5 level on each image. To see if and how we can push our detection limit deeper, we discuss here the current limitations in our imaging technique.
We illustrate this in Fig. 8. First, we compare the dynamic range reached on the CLEANed image between S2 and Sgr A* frames in panel a. Here we calculate the dynamic range as the ratio between the peak flux in each CLEANed image and the rms noise level in the central 74 mas 74 mas region on each residual image. Each frame is 320 seconds long. Since there are no known bright stars within the FOV of S2 and we also do not see Sgr A* in these frames, we can use these S2 frames to show the dynamic range that can be reached with the CLEAN method. We use the same parameter settings in CLEAN for S2 as for Sgr A* frames, except we set the spectral index to zero for S2. We don’t reach the same dynamic range level as for S2 frames. We then compare the noise level reached between S2 frames and Sgr A* frames in panel b, in which Sgr A* frames are slightly deeper. This suggests the ”noise cap” we reach is from the data rather than the CLEAN algorithm itself. Since we know that both S2 and S62 are present in the Sgr A* removed frames, we further check if they could be the limiting factor for the dynamic range for Sgr A*. We show the distribution of the peak flux in all the Sgr A*-removed residual frames in panel c for comparison. Here the brightness is normalized to S2. As listed in Table 2, the relative brightness for S62 is around 0.01, which is below most of the residual peaks we see here. We have checked the position of these residual peaks and almost none of them are centered on Sgr A* or the adjacent sidelobes, so we can say the residual peaks are not a result of Sgr A* not being completely removed. Although combining multiple residual images over a night can already smooth out some of these residual peaks, we explore the source of these peaks below.
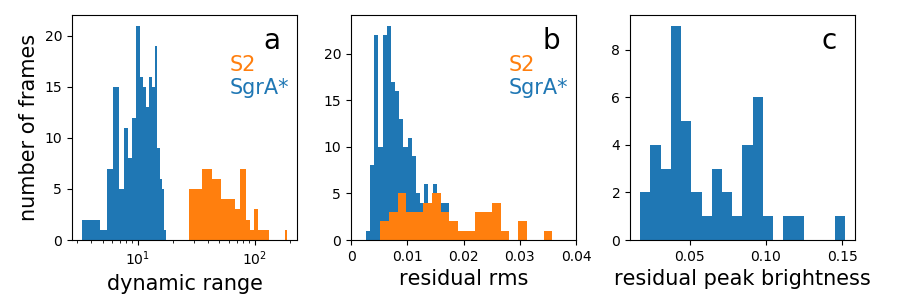
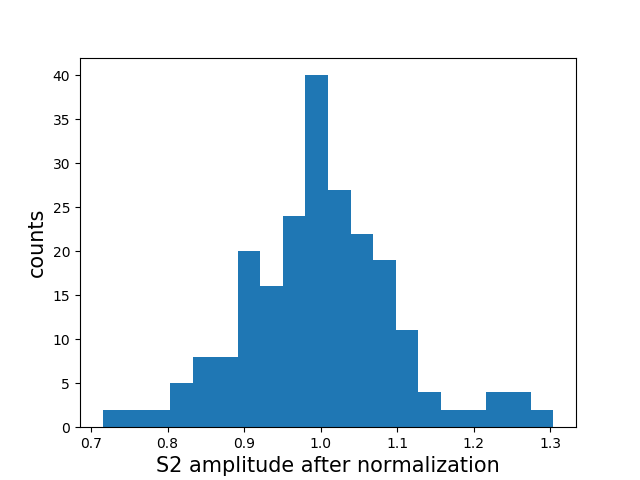
Due to the nature of the CLEAN method, these high residual peaks indicate a mismatch between the dirty image and the dirty beam used in the deconvolution. Following the traditional radio interferometry definition, the dirty beam is simply the Fourier transformation of the observation u-v coverage, which does not account for any distortion arising from errors in the real measurements. In other words, the mismatch could be put as calibration residuals of the measured visibility. As mentioned above in our data reduction process, the calibration is done by normalizing the Sgr A* complex visibility with that from an S2 frame. The visibility phase zero point is the position of S2 plus the pre-entered separation between Sgr A* and S2, which are calculated based on the S2 orbit. Any phase error here would affect all six baselines together. Meanwhile, our visibility amplitude has accounted for the photometric flux of each baseline from each telescope pair, which is a telescope-dependent time-variable quantity. We suspect that any variability here would introduce inconsistency of the visibility amplitude between different baselines, which cause deviations from our calculated synthesis beam. We show how well the amplitude of S2 is calibrated in Fig. 9. Ideally, the amplitudes should all be exactly unity; in practice the majority of our data has a deviation of the amplitude within 10.
Another known systematic effect in our instrument is the field-dependent phase error, as reported in (GRAVITY Collaboration et al., 2020a). This error will introduce a position offset of any detected targets away from the field center (e.g. at the position of S62, for a typical 40 phase error, the position offset is between 0.2 and 0.4 mas). Additionally, this error will reduce the brightness of any targets, as different baselines will shift the target in different directions, thus decreasing the total coherence. Equivalently this effect distorts the measured PSF shape from the theoretical one. Although here we only clean on Sgr A*, which is at the field center and not affected, this effect needs to be taken into account in the image reconstruction stage, prior to CLEAN. In the analysis chain presented here, there is no way to include such a systematic effect, since it needs to be taken into account at the level of the van-Cittert-Zernike theorem (Thompson et al., 2017). In essence, this means one would need to write a dedicated imaging code, which is beyond the scope of this work.
The low noise levels we have achieved show that further analysis in this direction might be very fruitful and can potentially reveal stars at magnitudes fainter than S62. Our hope is that a few of these reside physically close to Sgr A*, such that they can be used as relativistic probes of the spacetime around the MBH.
6 Conclusions
In this paper we report the detection of a 18.9 magnitude star within 30 mas projected distance to Sgr A* from recent GRAVITY observation of the Galactic Center region. We have successfully adopted the CLEAN algorithm used in radio interferometry to near-infrared interferometry. Our method recovers the faint star in multiple epochs across different months. This detection is further confirmed by a model-fitting method which uses squared visibilities and closure phases. We also measure the proper motion of this faint star to be 2.38 0.29 mas in R.A. and -2.74 0.97 mas in Dec. By comparing the orbits of previously known S-stars, we identify our source with the star S62 as reported in Gillessen et al. (2017). Throughout our observation we also detect S29 within 130 mas of Sgr A*. We are not able to confidently identify other faint stars in our current images, probably due to the limitation of our calibrations. We expect future upgrades of the instrument in the framework of the GRAVITY+ project and better calibration and removal of the PSF from bright stars will lead to deeper images near Sgr A*.
Acknowledgements.
We thank the referee for a helpful report. F. G. thanks W. D. Cotton and E. W. Greisen for the help on AIPS and UVFITS data format. We are very grateful to our funding agencies (MPG, ERC, CNRS [PNCG, PNGRAM], DFG, BMBF, Paris Observatory [CS, PhyFOG], Observatoire des Sciences de l’Univers de Grenoble, and the Fundação para a Ciência e Tecnologia), to ESO and the ESO/Paranal staff, and to the many scientific and technical staff members in our institutions, who helped to make NACO, SINFONI, and GRAVITY a reality. S. G. acknowledges the support from ERC starting grant No. 306311. F. E. and O. P. acknowledge the support from ERC synergy grant No. 610058. A. A., P. G., and V. G. were supported by Fundação para a Ciência e a Tecnologia, with grants reference UIDB/00099/2020 and SFRH/BSAB/142940/2018.Appendix A interferometric beam
References
- Amaro-Seoane et al. (2007) Amaro-Seoane, P., Gair, J. R., Freitag, M., et al. 2007, Classical and Quantum Gravity, 24, R113
- Baker et al. (2019) Baker, J., Bellovary, J., Bender, P. L., et al. 2019, arXiv e-prints, arXiv:1907.06482
- Do et al. (2009) Do, T., Ghez, A., Morris, M., et al. 2009, ApJ, 691, 1021
- Do et al. (2013) Do, T., Lu, J., Ghez, A., et al. 2013, ApJ, 764, 154
- Do et al. (2019) Do, T., Hees, A., Ghez, A., et al. 2019, Science, 365, 664
- Dodds-Eden et al. (2011) Dodds-Eden, K., Gillessen, S., Fritz, T. K., et al. 2011, ApJ, 728, 37
- Duvert et al. (2017) Duvert, G., Young, J., & Hummel, C. A. 2017, A&A, 597, A8
- Eckart & Genzel (1996) Eckart, A. & Genzel, R. 1996, Nature, 383, 415
- Eckart et al. (2008) Eckart, A., Schödel, R., García-Marín, M., et al. 2008, A&A, 492, 337
- Event Horizon Telescope Collaboration et al. (2019) Event Horizon Telescope Collaboration, 2019, ApJ, 875, 4E
- Gallego-Cano et al. (2018) Gallego-Cano, E., Schödel, R., Dong, H., et al. 2018, A&A, 609, A26
- Genzel et al. (2003a) Genzel, R., Schödel, R., Ott, T., et al. 2003a, Nature, 425, 934
- Genzel et al. (2003b) Genzel, R., Schödel, R., Ott, T., et al. 2003b, ApJ, 594, 812
- Genzel et al. (2010) Genzel, R., Eisenhauer, F., & Gillessen, S. 2010, Rev. Mod. Phys., 82, 3121
- Ghez et al. (1998) Ghez, A. M., Klein, B. L., Morris, M., & Becklin, E. E. 1998, ApJ, 509, 678
- Ghez et al. (2003) Ghez, A., Duchêne, G., Matthews, K., et al. 2003, ApJ Letters, 586, 127
- Ghez et al. (2004) Ghez, A., Wright, S., Matthews, K., et al. 2004, ApJ, 601, 159
- Ghez et al. (2008) Ghez, A., Salim, S., Weinberg, N. N., et al. 2008, ApJ, 689, 1044
- Gillessen et al. (2006) Gillessen, S., Eisenhauer, F., Quataert, E., et al. 2006, ApJ, 640, L163
- Gillessen et al. (2009) Gillessen, S., Eisenhauer, F., Trippe, S., et al. 2009b, ApJ, 692, 1075
- Gillessen et al. (2017) Gillessen, S., Plewa, P. M., Eisenhauer, F., et al. 2017, ApJ, 837, 30
- GRAVITY Collaboration et al. (2017) GRAVITY Collaboration, Abuter, R., Accardo, M., et al. 2017, A&A, 602, A94
- GRAVITY Collaboration et al. (2018a) GRAVITY Collaboration, Abuter, R., Amorim, A., et al. 2018a, A&A, 615, L15
- GRAVITY Collaboration et al. (2018b) GRAVITY Collaboration, Abuter, R., Amorim, A., et al. 2018b, A&A, 618, L10
- GRAVITY Collaboration et al. (2019) GRAVITY Collaboration, Abuter, R., Amorim, A., et al. 2019, A&A, 625, L10
- GRAVITY Collaboration et al. (2020a) GRAVITY Collaboration, Abuter, R., Amorim, A., et al. 2020a, A&A, 636, L5
- GRAVITY Collaboration et al. (2020b) GRAVITY Collaboration, Abuter, R., Amorim, A., et al. 2020b, arXiv e-prints, arXiv:2004.07185
- Greisen (2003) Greisen, E. W. 2003, Astrophysics and Space Science Library, Vol. 285, AIPS, the VLA, and the VLBA (Springer), 109
- Lapeyrère et al. (2014) Lapeyrère, V., Kervella, P., Lacour, S., et al. 2014, SPIE, 9146, 2
- Merritt et al. (2010) Merritt, D., Alexander, T., Mikkola, S., & Will, C. M. 2010, Phys. Rev. D, 81, 062002
- Peissker et al. (2020) Peissker. F, Eckart, A., & Parsa, M., 2020, ApJ, 889, 61
- Schödel et al. (2002) Schödel, R., Ott, T., Genzel, R., et al. 2002, Nature, 419, 694
- Thompson et al. (2017) Thompson. A, Moran, J., & Swenson, G., 2017, Interferometry and Synthesis in Radio Astronomy, 3rd ed., Springer
- Waisberg et al. (2018) Waisberg, I., Dexter, J., Gillessen, S., et al. 2018, MNRAS, 476, 3600
- Will (2008) Will, C., 2008, ApJ, 674, 25
- Witzel et al. (2018) Witzel, G., Martinez, G., Hora, J., et al. 2018, ApJ, 863, 15
- Zucker et al. (2006) Zucker, S., Alexander, T., Gillessen, S., Eisenhauer, F., & Genzel, R. 2006, ApJ Letters, 639, 21
- Zhang & Iorio (2017) Zhang, F., & Iorio, L. 2017, ApJ, 834, 198
