Experimental studies of plasma-antenna coupling with the JET Alfvén Eigenmode Active Diagnostic
Abstract
This paper presents a dedicated study of plasma-antenna (PA) coupling with the Alfvén Eigenmode Active Diagnostic (AEAD) in JET. Stable AEs and their resonant frequencies , damping rates , and toroidal mode numbers are measured for various PA separations and limiter versus X-point magnetic configurations. Two stable AEs are observed to be resonantly excited at distinct low and high frequencies in limiter plasmas. The values of and do not vary with PA separation. However, increases with PA separation for the low-, but not high-, mode, yet this may be due to slightly different edge conditions. The high- AE is detected throughout the transition from limiter to X-point configuration, though its damping rate increases; the low- mode, on the other hand, becomes unidentifiable. The linear resistive MHD code CASTOR is used to simulate the frequency scan of an AEAD-like external antenna. For the limiter pulses, the high- mode is determined to be an GAE, while the low- mode is likely an TAE. During the transition from limiter to X-point configuration, CASTOR indicates that and EAEs are excited in the edge gap. These results extend previous experimental studies in JET and Alcator C-Mod; validate the computational work performed by Dvornova et al 2020 Phys. Plasmas 27 012507; and provide guidance for the optimization of PA coupling in upcoming JET energetic particle experiments, for which the AEAD will aim to identify the contribution of alpha particles to AE drive during the DT campaign.
Keywords: Alfvén Eigenmodes, stability, plasma-antenna coupling, magnetic configuration
1 Introduction
The understanding of Alfvén Eigenmodes (AEs) and their stability is vital to the success of future tokamaks with significant energetic particle (EP) populations which can destabilize AEs and thereby lead to enhanced EP transport. Unstable AEs, with growth rates , are often easily observed in the Fourier spectra of magnetic data as coherent structures with well-defined resonant frequencies and toroidal mode numbers . However, if the EP population is insufficient to overcome various AE damping mechanisms - i.e. the total AE growth rate is - then the stable AEs can only be detected through active antenna excitation. This will likely be the case even in the upcoming JET DT campaign during which the alpha population alone may not destabilized AEs. Fortunately, studies of active antenna excitation have been pursued in JET [1, 2, 3, 4, 5, 6, 7, 8, 9, 10, 11, 12, 13, 14, 15, 16, 17, 18, 19, 20, 21, 22, 23, 24, 25, 26, 27, 28, 29, 30, 31, 32, 33, 34] and Alcator C-Mod [35, 36, 37, 19, 21], among other devices.
The Alfvén Eigenmode Active Diagnostic (AEAD), also known as the AE antenna, comprises two arrays of four toroidally spaced antennas (eight in total) installed inside the JET vacuum vessel [38, 39, 22]. Six amplifiers power six of the eight antennas with currents typically of the order ; thus, the system is only slightly perturbative with at the plasma edge [22, 31]. Independent phasing of the antennas allows power to be injected into a spectrum of toroidal modes with [31, 34]. Three frequency filters allow the AE antenna to scan the ranges , and . As the antenna frequency passes through an AE resonant frequency, the plasma responds like a driven, weakly damped harmonic oscillator, and the excited mode is detected by up to fourteen fast magnetic probes. Resonance parameters , , and can be calculated from the synchronously detected magnetic data; for further details, see [34].
It is of interest to study the coupling of the AE antenna with the plasma [40], that is, to study the ability of the antennas to excite AE resonances. This is determined not only by the applied currents, frequencies, and relative phases of the antennas set by AEAD operators, but also by plasma parameters. For example, the efficiency of the AE antenna has been found to decrease with the plasma current, i.e. for , in recent work [34]. In this paper, we explore the impact of the magnetic geometry on plasma-antenna (PA) coupling and AE stability. In particular, we focus on the magnetic configuration (i.e. limiter versus X-point - see Fig. 2(b), for example) and PA separation. Importantly, for some JET experiments, the configuration and plasma position can be optimized to improve coupling and increase the likelihood of stable AE excitation. This is essential for the successful operation of the AE antenna in the upcoming JET DT campaign and for key measurements of alpha particle drive [41].
Yet it is not enough to have only the excitation of stable AEs; these resonances must also be measured by the magnetic sensors. However, the optimizations of resonance excitation and detection are separable because each action is performed by different system and thus can (usually) be assessed independently. For instance, the plasma can be shaped to decrease the plasma-antenna and/or plasma-sensor separation distances. In this work, we focus on stable AE excitation as it relates to PA coupling, but do note when our actuation also affects detection.
The outline of the rest of the paper is as follows: In Section 2, we expand upon past studies of PA coupling and motivate this work. Then, we explore the impact of PA separation on coupling for limiter plasmas in Section 3. The effect of the magnetic configuration is investigated in Section 4 for plasmas transitioning from limiter to X-point. Sections 2, 4 and 3 each have subsections on experimental and computational work. Finally, a summary is given in Section 5.
2 Motivation
In this section, we provide an overview of past experimental studies and recent computational efforts to understand the coupling between the plasma and AE antenna. Gaps in experiment and new predictions from simulations motivate this work.
2.1 Past experimental efforts
The original AEAD system in JET consisted of re-purposed, in-vessel saddle coils capable of probing low toroidal mode numbers [1, 3]. In early JET experiments, stable AEs could not be excited by the AE antenna when the plasma was in an X-point (or diverted) magnetic configuration [4, 8, 11, 12]. This was attributed to wave absorption caused by strong edge magnetic shear. The first stable AEs observed during X-point in JET were reported in [10]; multiple modes were detected at different frequencies and identified as possible Drift Kinetic Toroidicity-induced Alfvén Eigenmodes (DK-TAEs). Following studies showed that real-time tracking of stable AEs could be achieved in JET X-point plasmas [21] and that the transition from limiter to X-point configuration could increase the AE damping rate approximately threefold [17, 28]. However, it should be noted that this latter observation may have been conflated with co-varying thermal plasma parameters.
Inspired by JET experiments, two poloidally separated antennas were installed at one toroidal location in Alcator C-Mod to actively probe stable AEs [35]. Resonances were measured in both limiter and X-point plasmas. Interestingly, lower damping rates (i.e. values closer to 0) were measured of stable AEs in X-point compared to limiter configuration, a trend opposite to that observed in JET. In addition, the damping rate was found to increase with the outer gap, and therefore with PA separation. The authors of [35] posited that differences in PA coupling for different magnetic configurations could be the cause.
Until this work, a dedicated study of PA coupling had not been performed in JET using the recently upgraded AE antenna system. The results have important implications for the interpretation of our measurements. In particular, we investigate how the magnetic geometry (configuration and PA separation) affect PA coupling, observations of resonances, and inferred resonance parameters (, , and ).
2.2 Recent computational efforts
This study is also motivated by recent computational work which accurately modeled PA coupling and explained some of the experimental observations of the previous section. In the study by Dvornova et al [40], the effects of PA separation and magnetic configuration on the efficiency of the JET AE antenna were thoroughly investigated using the linear, resistive MHD code CASTOR [42, 43] and nonlinear, reduced MHD code JOREK [44]. In both codes, an external antenna was modeled in the vacuum region between the plasma and wall. An antenna perturbation was simulated, and its frequency was scanned to diagnose the response of the plasma (specifically JPN 42870).
Here, we briefly summarize the main results of their study: In limiter configuration, two resonant modes ( TAEs) were excited and identified with distinct “low” and “high” frequencies within the simulated frequency scan, . The low- mode was found to be more stable - i.e. having a greater absolute damping rate - than the high- mode. The damping of both modes increased as the simulated plasma boundary approached the separatrix, i.e. becoming more X-point-like. Then, the low- mode became unidentifiable as a resonance, or “disappeared,” in X-point configuration, indicating an enhancement of continuum damping with the changing magnetic geometry.
In addition, the kinetic energy of each mode was observed to decrease in two ways: (i) as the plasma transitioned from limiter to X-point, and (ii) with increasing PA separation. Importantly, however, the computed damping rate did not change with PA separation for a given magnetic configuration. These results indicate a decrease in PA coupling which led to less (or no) antenna power absorbed by the mode, but otherwise had no impact on the inherent mode damping.
Our goals in the following sections are to identify both low- and high- stable AEs in the frequency scan of the AE antenna, assess the dependence of measured resonance parameters on PA separation, and monitor the evolution of AEs through a transition from limiter to X-point configuration, thereby further validating the modeling in [40].
3 Plasma-antenna separation
We begin by studying the effect of PA separation on PA coupling and measured AE parameters. As mentioned in Section 1, the data in the following sections include a wide range of plasma-sensor separations. However, because the fourteen magnetic probes are located at various poloidal (and toroidal) positions, and not all probes measure each resonance, plasma-sensor separation is not studied specifically.
3.1 Experimental study of plasma-antenna separation
During the 2019-2020 JET deuterium campaign, approximately 5000 resonances were excited by the AE antenna in almost 500 plasmas [34]. Three of these (limiter) plasmas - JPN 96585, 96587, and 96588 - comprised a dedicated study of PA separation, here defined as the minimum distance between the AE antenna (, ) and last closed flux surface from EFIT [45]. However, before turning to these specific pulses, we first investigate trends in the bulk data.222Data collected during external heating (NBI and/or ICRH) are excluded in this work so that EP effects can be neglected. Figure 1(a) shows the probability of resonance detection as a function of PA separation. This histogram (with all bin heights summing to one) is calculated as the ratio of the number of resonances detected within each bin to the number of times the AE antenna operated within the same range.333 See [34] for details regarding the calculations of the probability of resonance detection, damping rate, and toroidal mode number. In general, the detection probability decreases as the PA separation increases.
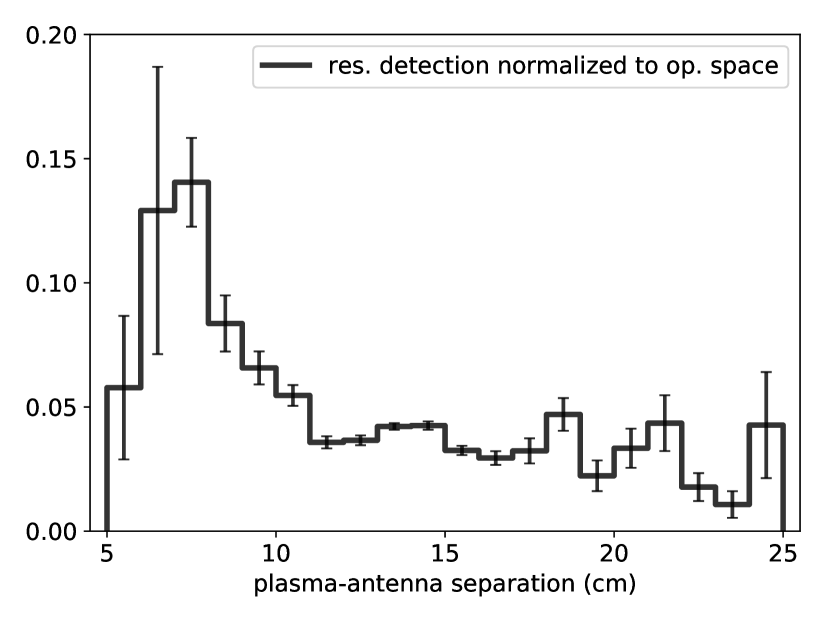
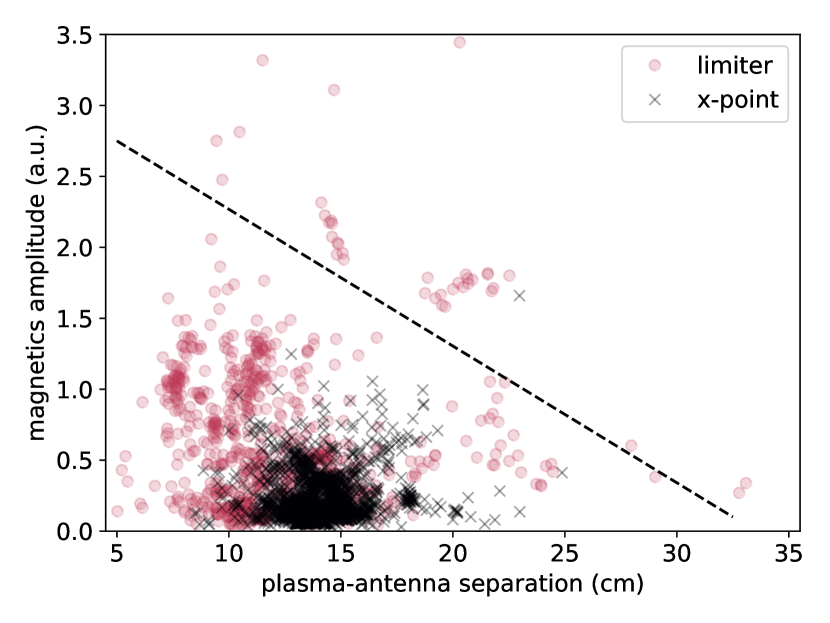
The “total” amplitude of the detected resonance, calculated as the sum of all fast magnetic probe amplitudes at the time of the resonant frequency and normalized to the antenna current, is plotted versus PA separation in Fig. 1(b). Data are split into resonances detected during limiter (light circles) and X-point (dark crosses) configurations. The PA separation during X-point is usually , while that during limiter configuration spans a wider range. We see a general trend of the maximum amplitude decreasing with PA separation. An approximate upper bound is shown in Fig. 1(b) as a dashed line, with 99% of data falling below it. The results of Figs. 1(a) and 1(b) are consistent with the computational results [40] mentioned in the previous section: the antenna coupling efficiency and antenna-driven mode energy both decrease as PA separation increases.
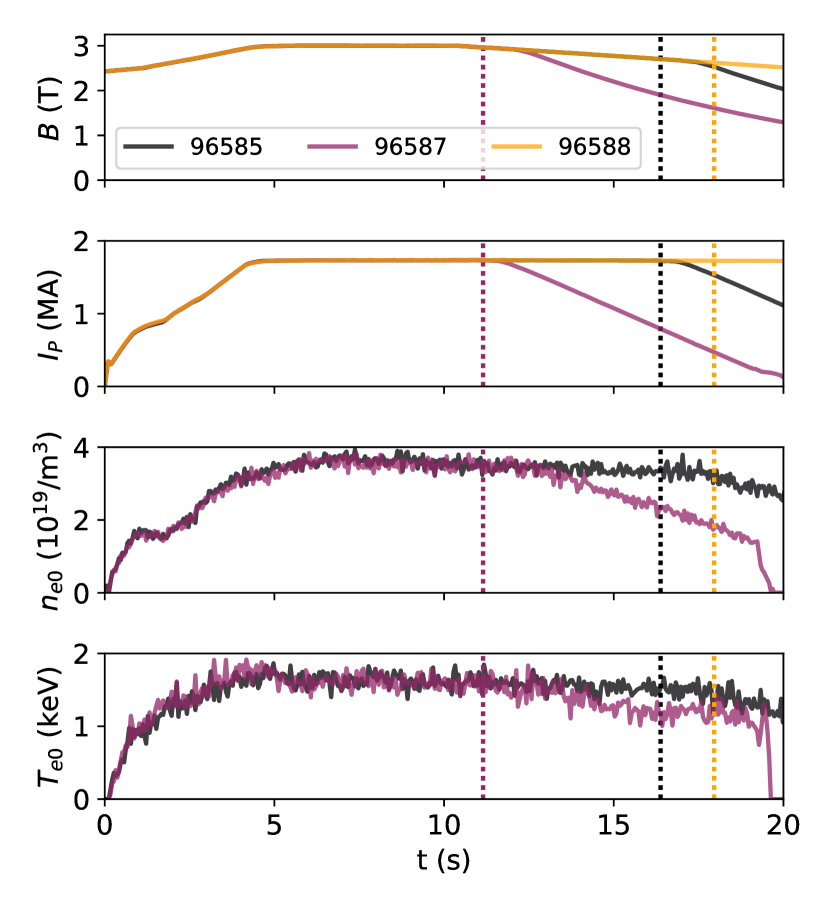
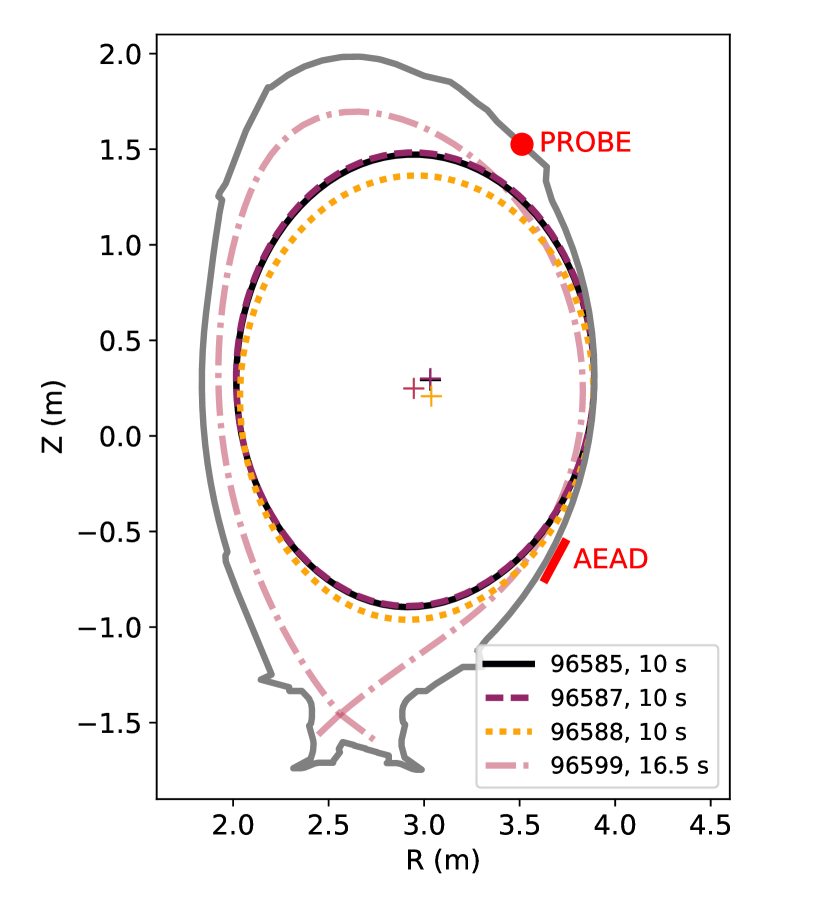
Plasma parameters for the three ohmically heated discharges of this dedicated study are shown in Fig. 2(a). Flattop values are , , , , , and ; thus, the nominal TAE gap frequency is . Since no external heating is applied, the plasma rotation is expected to be low and is thus neglected. There is good reproducibility among the three plasmas, with the exception of the timing of the plasma current ramp-down. The plasma boundary and magnetic axis, from EFIT, for these limiter pulses are shown at in Fig. 2(b). Also plotted are the approximate location, orientation, and dimensions of the AE antenna (AEAD), as well as the poloidal position of a representative fast magnetic probe. Discharges JPN 96585 and 96587 were maintained with a PA separation ; then the separation was decreased to in JPN 96588 by lowering the vertical position. Time traces of PA separation are shown in Fig. 3.
During these discharges, antennas 1-5 were driven with the same phase. Therefore, power was injected into primarily even toroidal mode numbers, with a power spectrum peaked at and decaying for and so on; power in odd mode numbers was 3 times less. The antenna frequency was scanned from in JPN 96585 and in JPN 96587 and 96588, as indicated by the triangular waveforms (dashed lines) in Fig. 3. Two stable AEs were consistently detected within this scan throughout the three discharges: a high- mode with resonant frequency and low- mode with , distinguished as circles and triangles, respectively. As expected, the mode frequency does not change with PA separation.
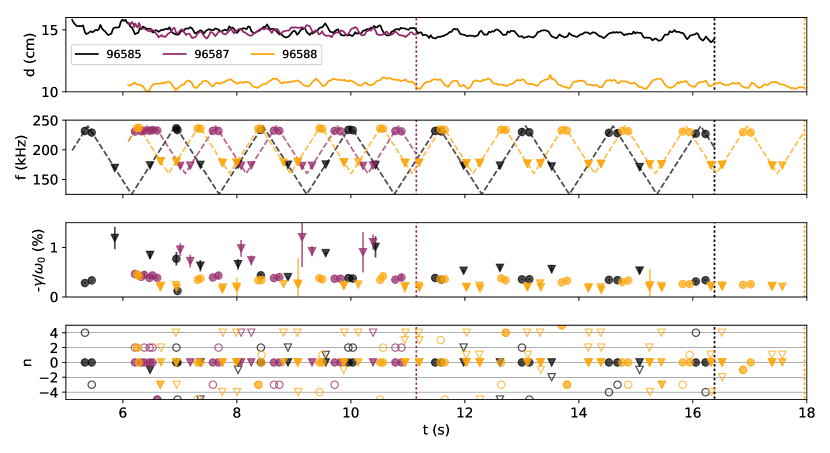
The normalized damping rates for both high- and low- modes are also shown in Fig. 3.Footnote 3 The damping rate for the high- mode (circles) is consistently throughout the three discharges and does not vary with PA separation. This result agrees with the simulations in [40]. Interestingly, there is a wider range of the measured damping rate of the low- mode, . For a PA separation , the low- mode is more stable than the high- mode, i.e. , which agrees with the findings of [40]; however, for , it is the opposite: . Thus, the damping rate appears to increase with PA separation for the low- mode; this agrees with the experimental results from C-Mod, but not the simulations from [40].
This variation in could be explained, in part, by the slightly different edge conditions for the plasmas with two PA separations: and for and , respectively. In [34], the damping rate was found to increase with for data in the same stable AE database described above, consistent with enhanced continuum damping. As will be discussed in the next section, this could more strongly affect the low- mode due to its localization in the outer plasma region, whereas the high- mode has a more global structure. Yet, it is difficult to say whether this alone could account for the wide range , and the kinetic modeling required to accurately assess the damping rate is beyond the scope of the present study.
The toroidal mode number of each resonance is estimated via two complementary methods: (i) a weighted chi-square spectrum comparing the toroidal locations of the magnetic probes and phase angles of the magnetic signals, and (ii) sparse spectral decomposition with the SparSpec algorithm [20].Footnote 3 Because both methods typically agree, we only include the chi-square results in this paper. The best estimates of (i.e. global minima of the chi-square spectra) are shown in Fig. 3 as solid symbols, limited to the range . For almost all high- and low- resonances, is estimated which could indicate that these are Global AEs (GAEs). The best estimates (i.e. the minima of the chi-square spectra excluding ) are shown as open symbols. As expected, these often have even values, e.g. and , due to the dominantly even -spectrum driven by the AE antenna. As will be discussed in the next section, MHD simulations indicate that the high- mode is an GAE, while the low- mode is likely an TAE.
Here, it is important to note that the plasma shape was kept fixed in these experiments; therefore, decreasing the PA separation actually increased the distance between the antenna and (some) fast magnetic probes (see Fig. 2(b)). While we improved PA coupling and the excitation of AEs by decreasing PA separation, the detection of AEs, in principle, became more difficult. This could have been avoided by increasing the plasma elongation; however, that could have affected PA coupling (and general plasma performance) in turn. This presents an interesting optimization problem, the solution to which will be pursued in upcoming JET EP experiments [41] in preparation for the DT campaign.
3.2 Computational analysis of plasma-antenna separation
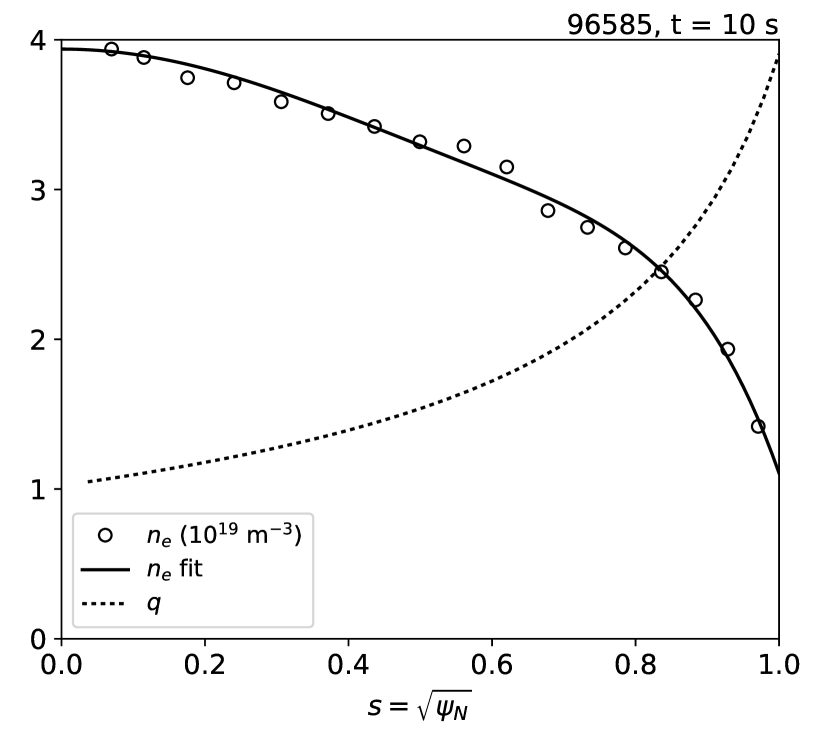
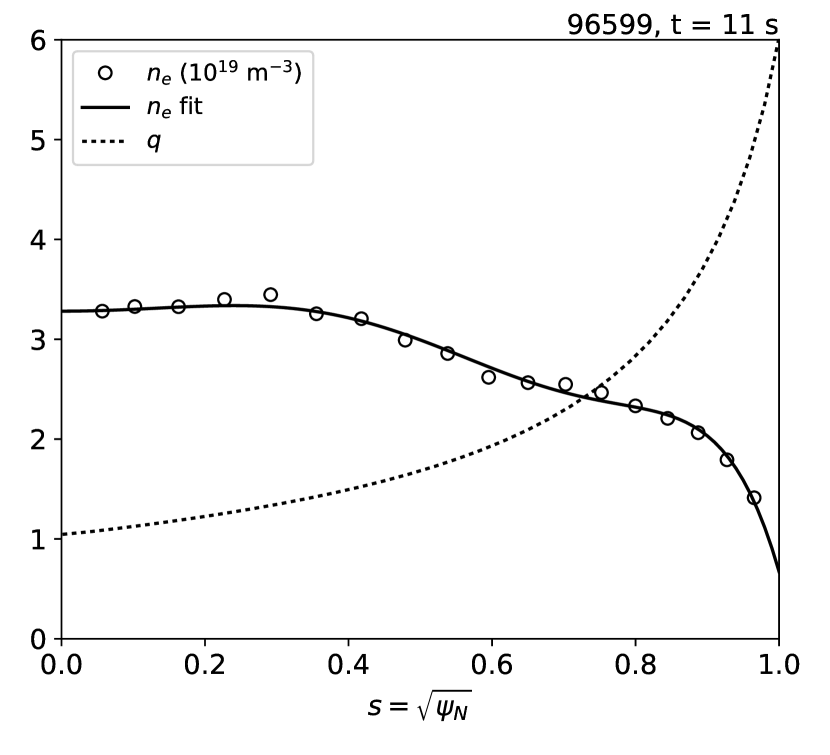
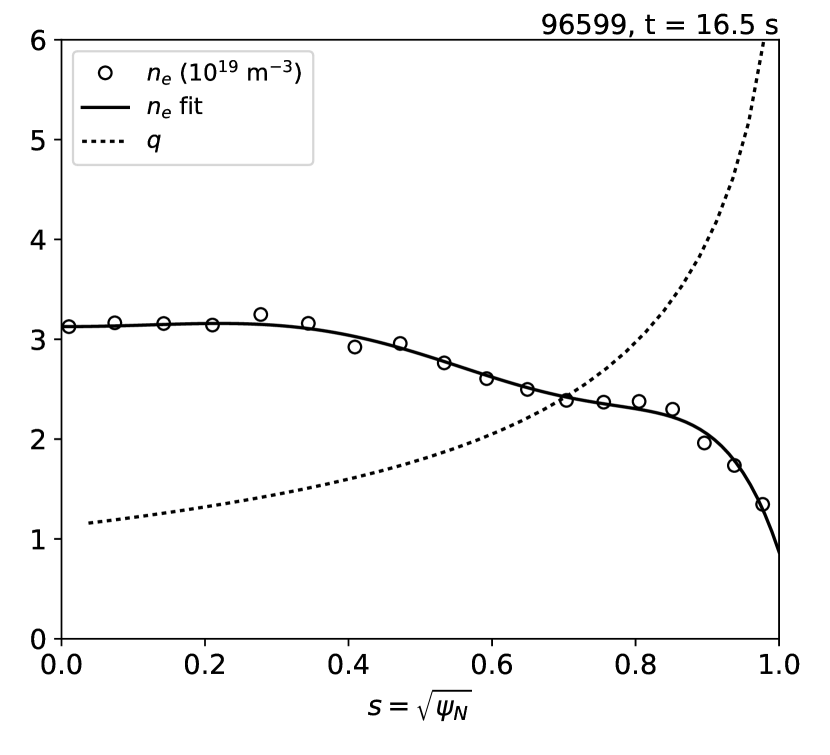
A suite of MHD codes is used to analyze the JET plasmas of the previous section and the next. First, the magnetic geometry from EFIT 444Magnetic geometries constrained by pressure (EFTP) and polarimetry (EFTF) are also available, but results are found to agree best with EFIT. Relative differences among them are typically of order 10%. [45] is converted into the appropriate format, via HELENA [46], to compute the Alfvén continuum with CSCAS [47] with no sound wave coupling included. Here, an even, eighth-order polynomial is fit to the electron density profile, and is assumed for the ion density. For example, the fitted density and safety factor profiles for JPN 96585 at are plotted in Fig. 4(a) as a function of the square root of the normalized poloidal flux, , not to be confused with the magnetic shear discussed in the next section.
Next, the linear resistive MHD code CASTOR [42, 43] is run with the external antenna module enabled. With the plasma boundary at , the locations of the antenna and wall are (unless otherwise noted) and , respectively. For a given toroidal mode number , a range of antenna frequencies is “scanned”; at each, the AE mode structure and absorbed power are computed. Due to computational constraints, the maximum number of plasma and antenna harmonics simulated is , and number of vacuum harmonics is . In addition, the same normalized resistivity is used for the following simulations. For the plasmas of this section and the next, this corresponds to a resistivity . As will be discussed, the plasma response is relatively insensitive to the choice of .
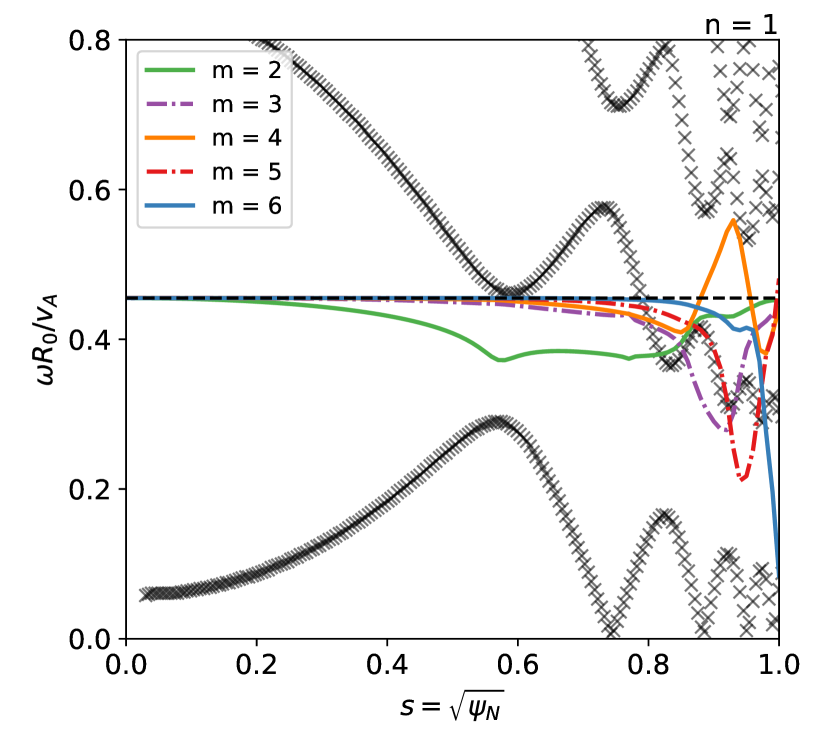
We focus first on the high-, mode observed in JPN 96585, 96587, and 96588. Because it was measured consistently throughout the three discharges, we simulate JPN 96585 at as a representative time slice. Results for are shown in Fig. 4. The Alfvén continua from CSCAS (dark crosses in Fig. 4(b)) have minima near the edge, . Here, an GAE exists having an eigenvalue () and exhibiting strong coupling of poloidal harmonics [48]. This eigenfrequency is lower than the experimentally observed frequency , but agrees within uncertainties (10%) of the central safety factor .

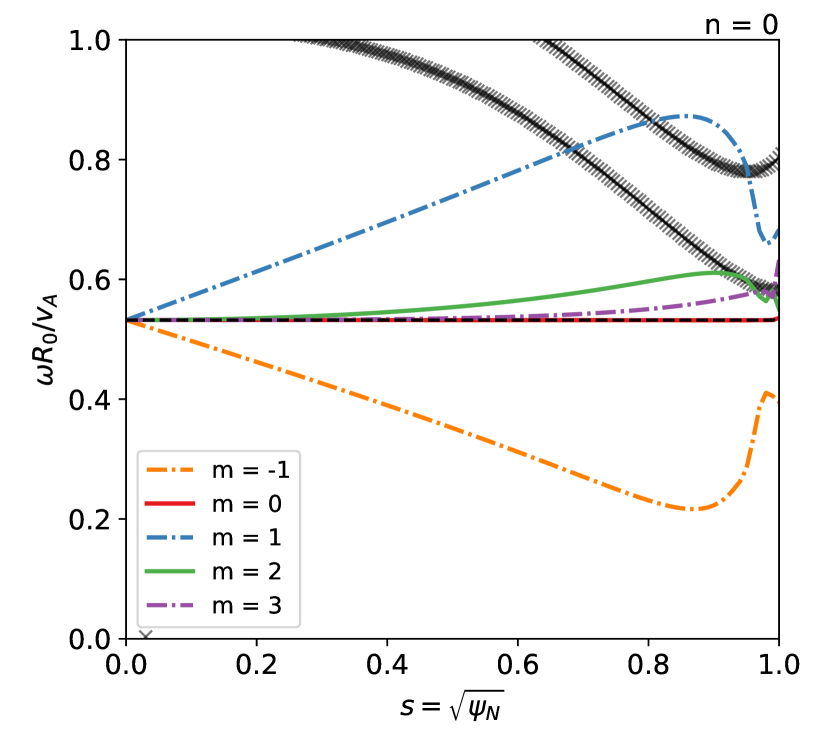
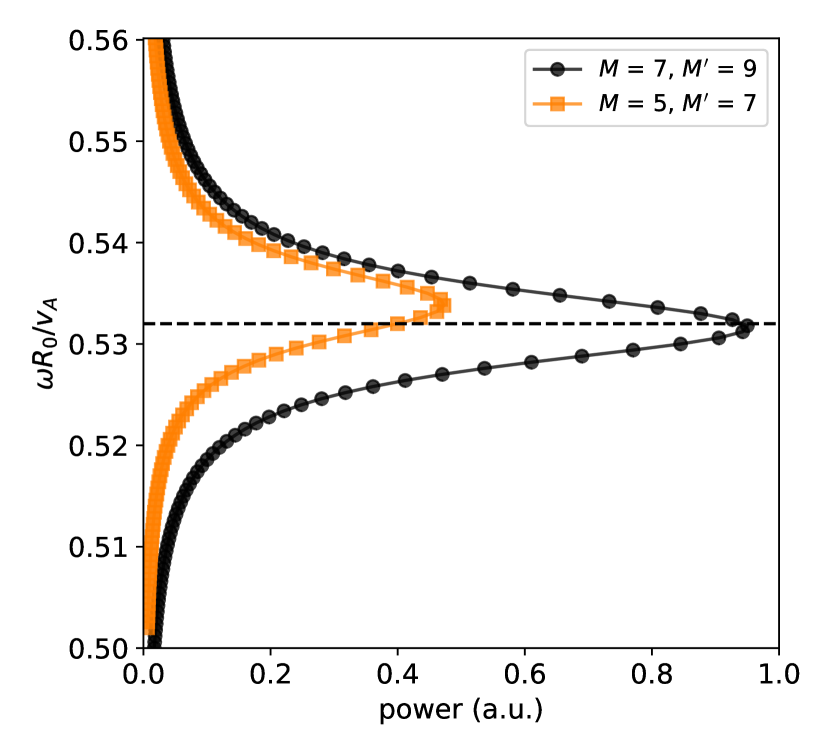
The power absorbed by this GAE, as calculated from CASTOR 555CASTOR was recently updated by the authors to allow the toroidal mode number , which caused divergences in previous versions., is seen in Fig. 4(c) and has the characteristic bell-shape of a driven, weakly damped resonance. The mode structure shown in Fig. 4(b) is that from the peak of the absorbed power. Though not shown in Fig. 4(c), no other GAE resonance is found within the full frequency range of the AE antenna, i.e. . In addition, a CASTOR simulation with reduced numbers of poloidal harmonics ( and ) finds the same mode, although with the peak of power absorption offset by only . When normalized to their respective maximum powers and translated vertically, the two curves in Fig. 4(c) overlay almost exactly, giving us confidence in the converged solution.
While it is tempting to compute a damping rate from the absorbed power to compare with experiment, we must be cautious for two reasons: (i) the 3D AE antenna geometry and resulting drive are not fully modeled here (as they were in [40]), and (ii) CASTOR does not include all sources of damping, e.g. radiative or Landau damping. Nevertheless, we see that the half width at half maximum (HWHM, ) is 1% which is at least the right order of magnitude and likely indicates a predominance of continuum damping.
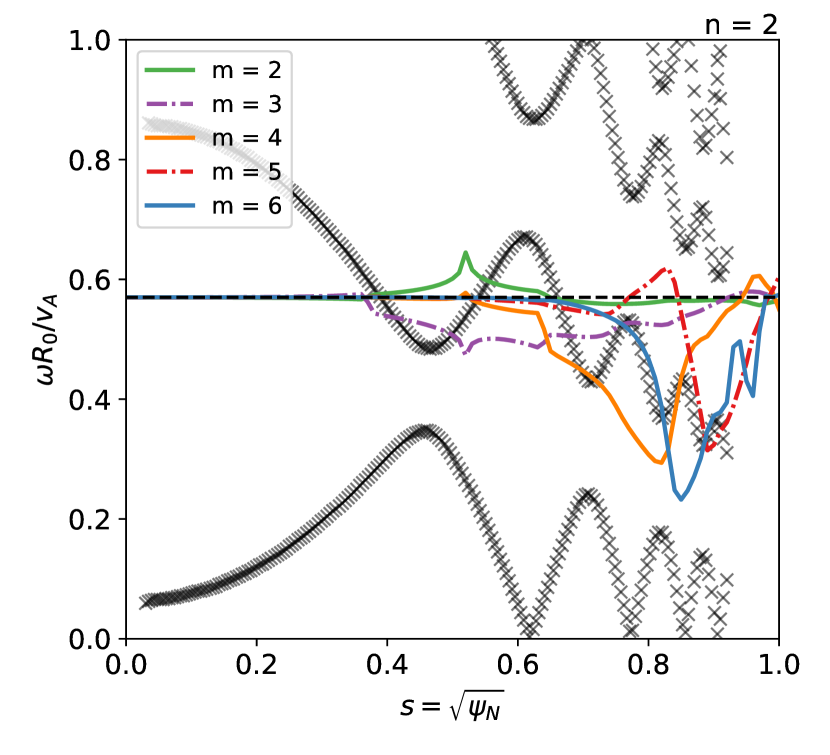
Because no low- mode was found in the above CASTOR scan for , we instead investigate for the experimentally measured low- AE. An open TAE gap is seen in the CSCAS results of Fig. 5(b) around . As seen in Fig. 5(c), a frequency scan in CASTOR finds a clear resonance with peak at (). This eigenfrequency agrees well with the experimentally observed resonant frequency . We also note that no high-, mode is found within the frequency scan of CASTOR.
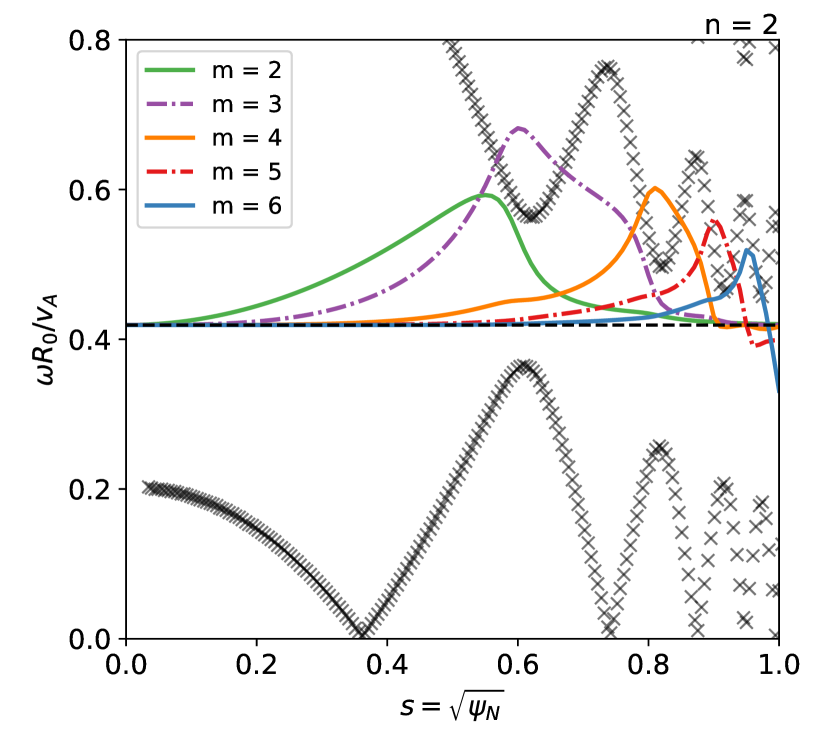
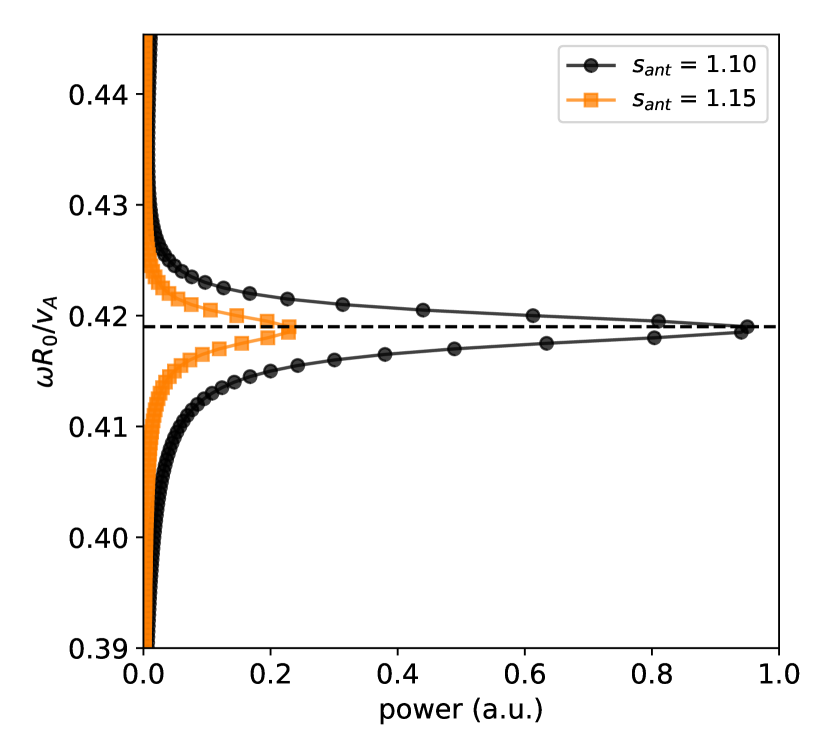
The resonant mode structure, shown in Fig. 5(b), indicates that this is an TAE [49] with strongest coupling between the poloidal harmonics at and at . Note also in Fig. 5(c) that another frequency scan was performed with the antenna moved farther away from the plasma, to . As expected, the same resonance is identified, but the absorbed power decreases due to the increased PA separation. Though not shown, when normalized to their respective maximum powers, the two curves match exactly, indicating that mode damping is independent of PA separation in CASTOR. Simulations were also performed for JPN 96587 and 96588. While their frequency scans (not shown) indicate some variation due to the slight differences in plasma parameters, their HWHM values agree within expected uncertainties. Thus, it is difficult to conclude what causes the trend of increasing with PA separation using CASTOR alone.
The simulation results of this section indicate that two AEs, with distinct low and high frequencies, can be detected by the frequency scan of an external antenna in JET plasmas, in agreement with the computational studies in [40]. For these particular discharges, the experimentally measured high- mode is consistent with an GAE, and the low- mode with an TAE. However, we note that these are not necessarily unique solutions. As current computational constraints limit our modeling of toroidal mode numbers to , a more exhaustive study of higher mode numbers is left for future work.
4 Magnetic configuration: limiter versus X-point
In this section, we consider the impact of the magnetic configuration (limiter versus X-point) on PA coupling and measured AE parameters.
4.1 Experimental study of limiter versus X-point configuration
Utilizing the same database from [34], we provide a breakdown of AE antenna operation and resonance detection in Table 1 for both limiter and X-point magnetic configurations. Because most JET experiments require diverted plasmas, the AE antenna was operated far less often in limiter compared to X-point configuration: 12% compared to 88% of the time. Naturally, the fraction of resonances detected in limiter plasmas (18%) is also less than that for X-point plasmas (82%). However, the probability of resonance detection is greater in limiter (62%) compared to X-point configuration (38%). This is consistent with the simulation results of [40] which indicated reduced PA coupling in X-point, as discussed in Section 2.2. We also note that PA separation is a conflating factor since it is typically greater for X-point compared to limiter plasmas (see Fig. 1(a)).
| Magnetic | Operational | Resonance | Detection |
|---|---|---|---|
| configuration | space | detection | probability |
| limiter | 12% | 18% | 62% |
| X-point | 88% | 82% | 38% |
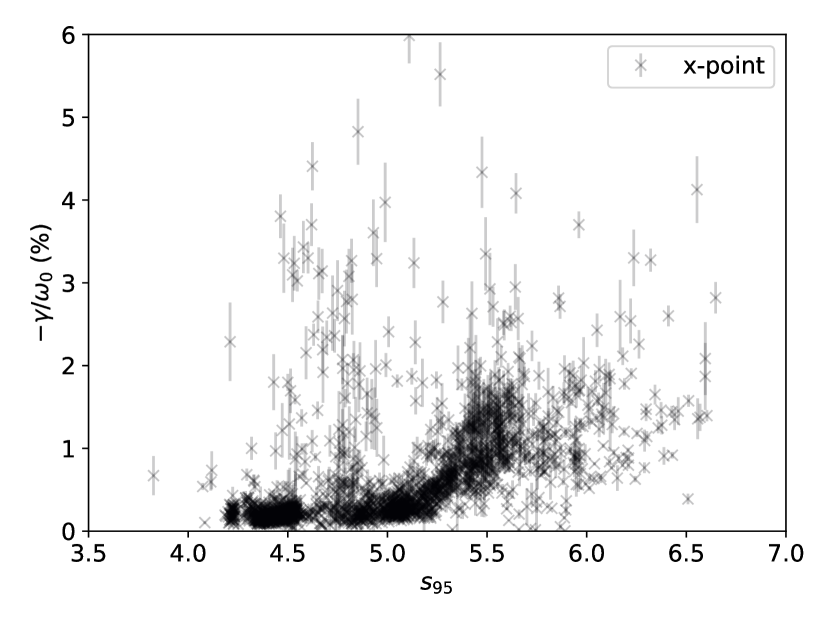
Figure 6(a) shows the measured AE damping rate as a function of the edge magnetic shear, , for resonances detected in X-point configuration and during times with no external heating (NBI or ICRH). Though not shown, no clear trend is observed in the limiter data; this could be due to a variety of reasons including the wide range of plasma parameters in the parameter space or perhaps more core-localized modes. For X-point data, however, a strong increase in the damping rate is seen for . The data are well-correlated, having a weighted, linear correlation coefficient of . This trend likely indicates a predominance of edge-localized AEs and increased continuum damping [50, 51, 52] at the edge, which is consistent with a similar trend of increasing with , reported in [34]. The nonlinear, almost parabolic shape could also indicate some contribution from radiative damping, as discussed in [53, 1] among others.
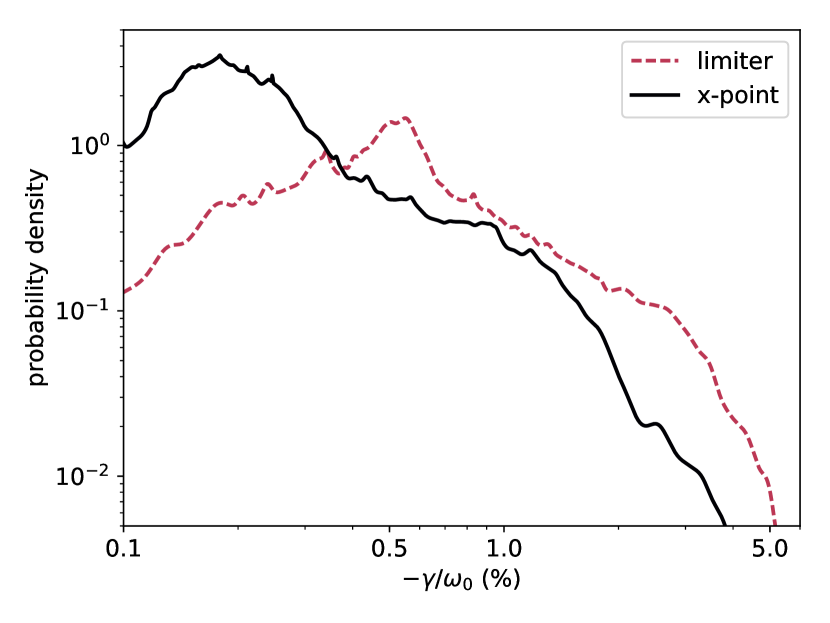
The distributions of damping rates for limiter and X-point geometries, including the data of Fig. 6(a), are shown in the probability density functions666An individual measurement is assumed to have a Gaussian pdf with mean equal to the measured damping rate and standard deviation equal to the associated uncertainty . The total pdf is then the normalized sum of all individual pdfs. See [34] for further details. (pdfs) of Fig. 6(b). Again, none of the data was collected during external heating. The pdf of limiter data is peaked at , while that for X-point data is peaked at ; both pdfs exponentially decay away from the peak. This can also be seen in the density of data points of Fig. 6(a). Thus, “low” damping rates (i.e. ) are actually observed more often in X-point than in limiter configuration. This agrees with the findings from Alcator C-Mod discussed in Section 2.1. Yet this result comes from a collection of all observations of AE resonances, which are oftentimes independent, and does not necessarily indicate the dependence of AE stability during a limiter-to-X-point transition, which is pursued next. That is to say, there could be other conflating factors - such as varying plasma parameters - contributing to the difference in pdfs.
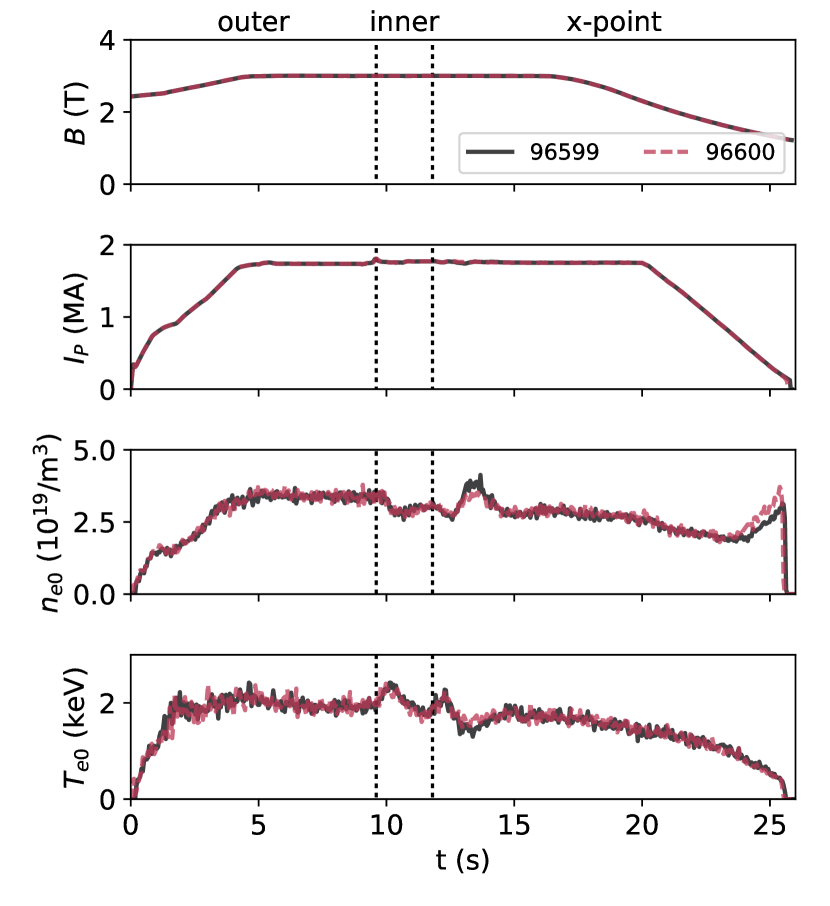
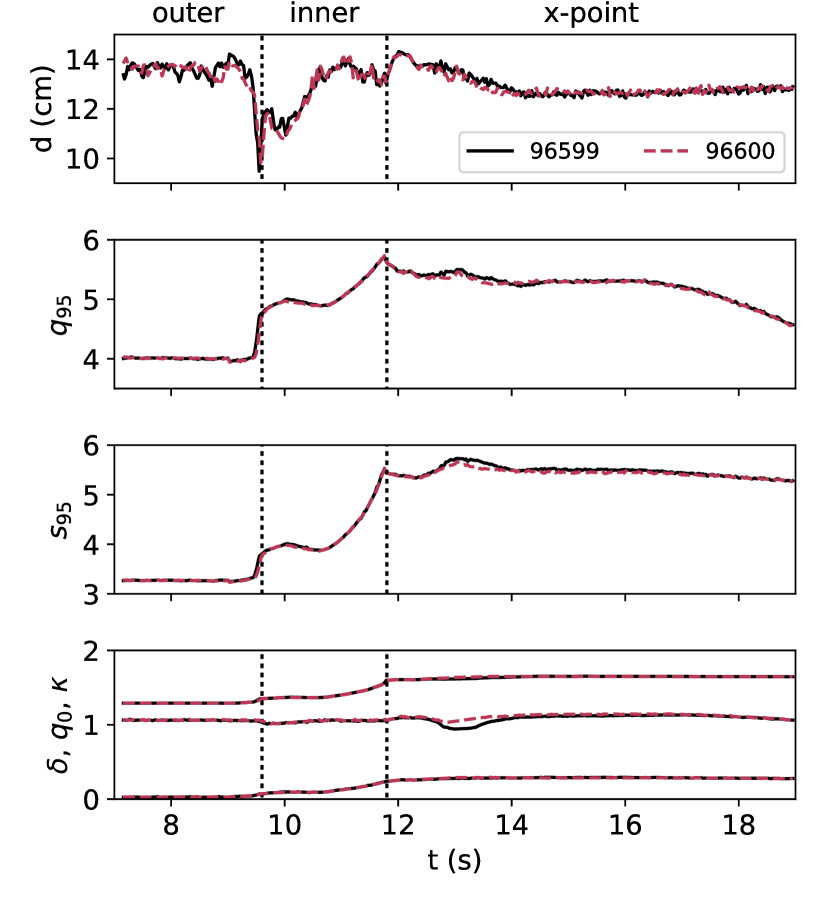
Two ohmically heated JET plasmas, JPN 96599 and 96600, were part of a dedicated study of PA coupling in different magnetic geometries. Their plasma parameters are shown in Fig. 7, with vertical lines (dotted) indicating transitions in the magnetic configuration: First, the plasma transitions from being limited on the outer limiter (low-field side) to the inner limiter (high-field side) at , and then from (inner) limiter to X-point configuration at . Some parameters remain relatively constant during these transitions, including the toroidal field , plasma current , and on-axis safety factor . Other quantities fluctuate, like the electron density and temperature along with the PA separation (and plasma-sensor separations, though not shown). As expected, the edge safety factor , edge shear , elongation , and triangularity all increase during the limiter-to-X-point transition. Good reproducibility is seen for the two pulses.
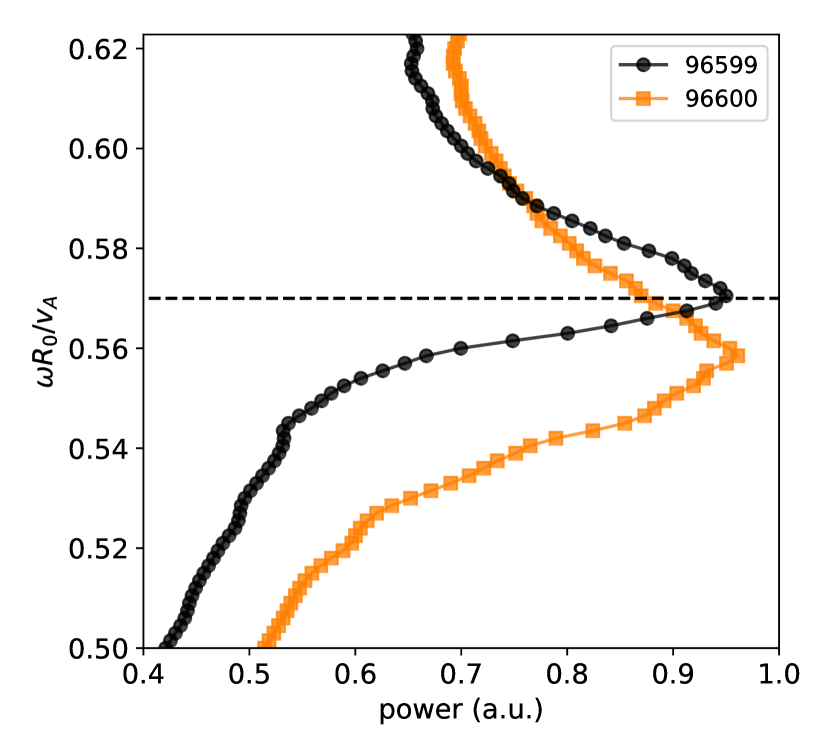
The AE antenna was operated during all three phases of the two discharges (), and resonance measurements are shown in Fig. 8. Unlike the antenna setup in Section 3.1, only antennas 1-4 were powered here (i.e. those in one toroidal octant); thus, power was injected broadly into both even and odd modes, with similar magnitudes for . The antenna frequency was scanned throughout the range in JPN 96599, while real-time mode tracking was employed in JPN 96600. As seen in Fig. 8, the measured resonant frequencies, damping rates, and toroidal mode numbers agree well for both pulses.
In JPN 96599, both high- (circles) and low- (triangles) AEs are measured during the outer limiter phase at frequencies and , respectively. Yet, during the transition to inner limiter and then X-point geometry, the low- mode is no longer detected. In the inner limiter phase, as the high- mode drops in frequency, it could be that the low- mode frequency is below the antenna’s range, i.e. . While this could still be the case during X-point, the high- mode frequency has reattained a frequency , and the low- mode is still not detected. Assuming that the low- mode is within the antenna’s frequency range, the disappearance of this mode is consistent with the JOREK simulation results of [40], as discussed in Section 2.2, in which the low- mode damping grew too strongly. Also note that the PA separation actually decreases from to from outer limiter to X-point configuration (see Fig. 7(b)), although the improvement in resonance detection is marginal (see Fig. 1(a)).
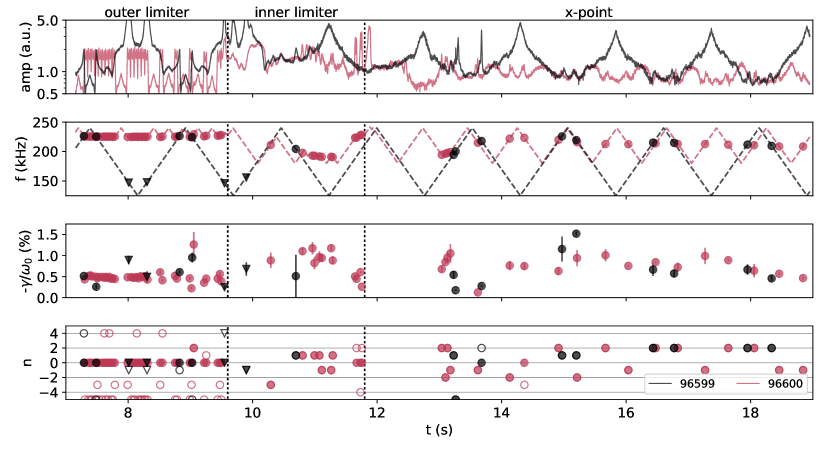
In JPN 96600, the high- mode is tracked consistently throughout the outer limiter phase and somewhat during the inner limiter phase, but tracking is more difficult during X-point. The magnetics data provide an explanation: As seen in Fig. 8, the sharp peaks in the signal amplitude, corresponding to AE resonances, are easily identifiable in the outer limiter phase, but become less distinguishable during the inner limiter phase as the plasma become more like X-point. In X-point, the high- resonances are no longer high-amplitude, sharp peaks, but low-amplitude, broad “bumps.” These are still identifiable as resonances when including phase information, which is not shown here. The decrease in mode amplitude, as measured by the fast magnetics, is also consistent with a decrease in mode energy when comparing limiter to X-point plasmas, as found in [40].
During the outer limiter phase, the damping rate is consistently , which then increases during the inner limiter phase to , likely due to the increasing edge magnetic shear (see Fig. 7(b)). There is an exception of some low damping rates () for resonances measured just before the transition from inner limiter to X-point configuration (). This appears to be a marginally stable, high- mode somehow destabilized by the change in magnetic geometry, but its explanation is beyond the scope of this paper. While there are some resonances measured with low damping rates in X-point, a majority have , consistent with increased damping of AEs during a transition from limiter to X-point configuration. Furthermore, while plasma parameters are relatively constant during AE antenna measurements (see Fig. 7), a slight decrease is observed in and beyond ; the concurrent reduction in the damping rate could therefore be explained by a decrease in collisional, Landau, and/or continuum damping.
The best estimates of the toroidal mode number - including (filled) and excluding (open) - are also shown in Fig. 8. The high- mode, measured during the outer limiter phase, appears to be a similar GAE found in the limiter plasmas of Section 3.1. During the inner limiter phase, the AEs are measured to have . As mentioned, this is due to the broad power spectrum from only one octant of the AE antenna system. The measurement is confirmed by mode analysis of magnetic spectograms, though they are not shown here. The simulations of the next section will also indicate that these are likely AEs. Finally, after the transition to X-point, there is a wider range of estimated mode numbers . We will explore a single AE at , but it is possible that the AE antenna resonates with a superposition of low- modes.
4.2 Computational analysis of limiter versus X-point configuration
The same suite of MHD codes described in Section 3.2 is now applied to the two pulses of the previous section. We forgo the analysis of the outer limiter phase due to the similarities with the analyses of the limiter plasmas in Section 3.2. Instead, we focus on the inner limiter phase, during which the plasma is becoming more “X-point-like,” and then after the transition to X-point.
We begin by modeling JPN 96599 at in search of a AE resonance at the experimentally measured frequency . The fitted electron density and safety factor profiles for this time are shown in Fig. 9(a). We see that the edge has increased significantly compared to the limiter pulses (see Fig. 5(a)). The TAE gap, computed by CSCAS and shown in Fig. 9(b), is closed at the edge, so no clear resonance is found in the scan over low frequencies with CASTOR. Instead, a resonance is observed in the edge of the Ellipticity-induced AE (EAE) gap with peak power absorbed at () and perhaps strongest coupling between poloidal harmonics at . Here, the eigenfrequency agrees well with the experimentally measured frequency.
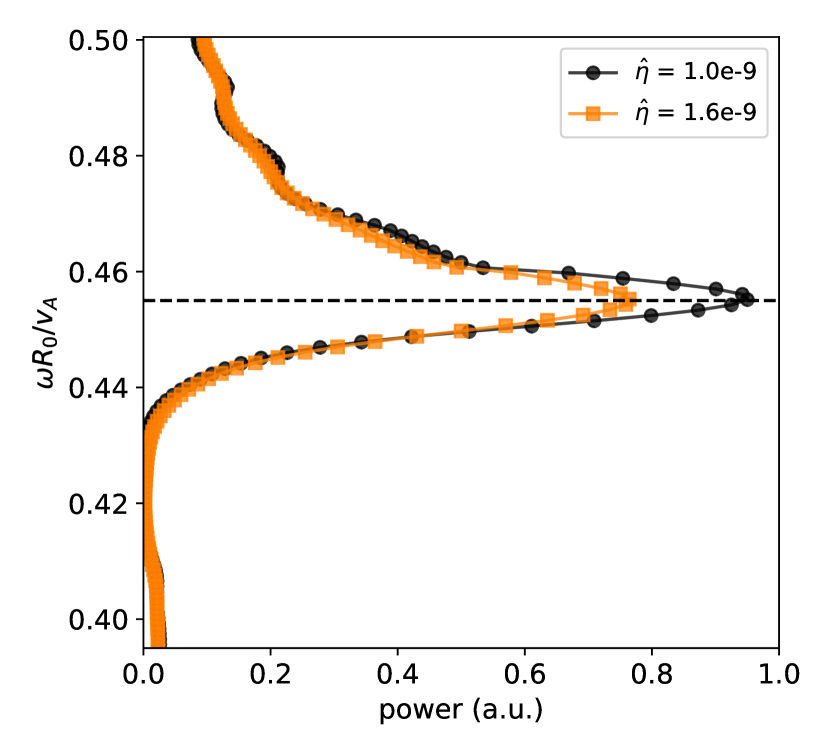
To highlight the relative insensitivity our CASTOR results to the normalized resistivity , two frequency scans are performed with and (the default value). As seen in Fig. 9(c), the same resonant peak is found for both values. In addition, though not shown here, both curves overlap almost exactly when normalized to their respective maximum powers.
Next, we model the AE observed during X-point, specifically in JPN 96599 at .777Although an GAE was observed during the outer limiter phase of JPN 96599 and 96600, CASTOR simulations found no resonance during X-point at . Safety factor and density profiles are shown in Fig. 10(a). The strong shear at the plasma edge introduces some complications in the modeling. For instance, CSCAS could only be simulated within , as seen in the continua in Fig. 10(b). As with the TAE gap in Fig. 9(b), the TAE gap is closed, and instead a more highly damped mode is found in the edge of the EAE gap, here with strongest coupling between poloidal harmonics near . The frequency scan in CASTOR finds a resonant peak at (). This is higher than the experimentally measured resonant frequency , but only by 17% which is allowable within uncertainties of the density and safety factor profiles. Furthermore, better agreement would likely be attained with improved modeling of the edge plasma and scrape-off layer, which then requires a more computationally intensive code like JOREK.
We repeat the simulations for JPN 96600, also at . Only the frequency scan in CASTOR is shown in Fig. 10(c), which shows good agreement with the scan in JPN 96599. Both have similar maximum absorbed powers, but there is a slight offset of . Note that the HWHM of JPN 96600 is slightly wider than that of JPN 96599, indicating some variation or uncertainty in the damping rate. Yet, compared to the CASTOR scans of other modes (see Figs. 4(c), 5(c) and 9(c)), the resonance width is greater, which is consistent with an increase in damping rate for a plasma transitioning from limiter to X-point configuration.
5 Summary
In this work, we reported on a dedicated study of plasma-antenna (PA) coupling between JET plasmas and the Alfvén Eigenmode Active Diagnostic, or AE antenna. The resonant excitation of stable AEs - and measurements of their frequencies , damping rates , and toroidal mode numbers - were monitored while scanning the PA separation and varying the magnetic configuration (limiter versus X-point). These experiments were motivated by similar studies carried out previously in Alcator C-Mod and in JET with the old AE antenna system, as well as by recent computational efforts by Dvornova et al [40] to interpret past data.
In the first part of the study, we assessed the impact of PA separation on AE antenna coupling, stable AE excitation, and AE stability itself. From a database of almost 5000 AE resonances, it was found that two quantities decreased as PA separation increased: the probability of resonance detection (see Fig. 1(a)) and the magnetic amplitude of the detected resonance (see Fig. 1(b)). Both results are consistent with the conclusions of [40]: increasing PA separation reduces PA coupling and leads to lower detected AE amplitudes as the antenna’s magnetic perturbation decreases with distance and less power is absorbed by the mode. It is important to note here that conflating factors, e.g. varying magnetic and thermal plasma parameters, introduce uncertainties and scatter into the analysis of bulk data, yet general trends are still observed and can then be compared with our dedicated experiments.
Three ohmic limiter plasmas were reproduced to investigate the effect of PA separation in more detail (see Fig. 2): two with PA separations , and the other with (see Fig. 3). Two stable AEs at distinct low and high frequencies were detected within the AE antenna frequency scan, as was found in the CASTOR and JOREK simulations of [40]. The resonant frequencies (and estimated toroidal mode numbers) of both the low- and high- AEs did not vary with PA separation, and neither did the damping rate of the high- mode, consistent with [40]. However, the damping rate of the low- mode was found to increase with PA separation, in disagreement with [40] but agreeing with C-Mod results [35]. A closer inspection of these plasmas indicated that slightly differing edge conditions could explain this trend, at least in part; specifically, a lower for the plasma with lower PA separation could lead to less continuum damping of the more edge-localized low- mode. However, a quantitative assessment of the damping rate would require kinetic modeling, which is beyond the scope of this paper and left for future work.
One of the limiter plasmas was modeled with the linear, resistive MHD code CASTOR with the external antenna module enabled. A simulated scan of the antenna driving frequency determined that (i) the high- mode was likely an GAE with a global mode structure (see Fig. 4), while (ii) the low- mode was likely an TAE with strongest couplings of poloidal harmonics and within their respective gaps in the outer plasma region (see Fig. 5). These results are consistent with the AE antenna’s power being injected into even, low- modes when all are phased the same. A simulated increase in the PA separation by 50% confirmed the results of [40]: the same resonance was identified, but with less absorbed power (see Fig. 5(c)); moreover, the HWHM () of the simulated mode did not change with PA separation. This provides further support for the hypothesis that the plasmas were not perfectly reproduced in the PA separation scan.
In the second part of the study, we investigated the effect of the magnetic configuration on the efficiency of the AE antenna and AE stability. A database analysis revealed that resonance detection is 50% more likely in limiter compared to X-point configuration (see Table 1). Furthermore, the damping rate was observed to increase strongly with edge magnetic shear for resonances detected in X-point configuration (see Fig. 6(a)). A closer look at the distribution of damping rates (see Fig. 6(b)) found that observations of low normalized damping rates, , were more likely in X-point than in limiter configuration, agreeing with previous C-Mod results [35]. Once again, these data come from a wide variety of JET plasmas, yet the general trends observed - especially the enhancement in AE stability with edge shear - are then seen more clearly in our dedicated study.
Two ohmic plasma discharges were reproduced (see Fig. 7) to monitor the evolution of stable AEs throughout the transition from limiter to X-point configuration. While both high- and low- AEs were observed initially during the limiter phase (see Fig. 8), the low- mode could not be identified later as it further stabilized during the plasma’s transition to X-point, consistent with JOREK simulations in [40]. In addition, the damping rate of the high- mode increased as the edge shear increased during the limiter phase and into X-point. However, AEs with various toroidal mode numbers were observed during and after the configuration change, which was not assessed in [40] and cannot be easily explained. Nevertheless, CASTOR modeling was consistent with two EAEs, and , being excited at the plasma edge (see Figs. 9 and 10, respectively), with a relatively higher damping rate inferred in X-point.
The experimental results of this paper have extended the results of previous studies and, in many ways, validated the simulation work in [40]. Modeling AE antenna excitation with CASTOR has proven to be necessary in the verification of toroidal mode number estimates and calculation of the mode structure and localization. Yet, additional modeling must be done to accurately assess the damping rate and compare with experiments; this is planned in the future. Finally, this work provides guidance in optimizing PA coupling for upcoming energetic particle experiments in JET, for which the AE antenna will play a crucial role in identifying the contribution of alphas to AE drive. If possible, the edge safety factor and edge magnetic shear could be lowered to widen the TAE gap and reduce continuum and radiative damping. Perhaps easier, we can decrease the PA separation to improve PA coupling while maintaining other plasma shaping parameters.
Acknowledgments
The authors thank H.J.C. Oliver and E. Rachlew for fruitful discussions, as well as the reviewers for improving this paper. This work was supported by US DOE through DE-FG02-99ER54563, DE-AC05-00OR22725, and DE-AC02-05CH11231, as well as the Brazilian agency FAPESP Project 2011/50773-0. This work has been carried out within the framework of the EUROfusion Consortium and has received funding from the Euratom research and training program 2014-2018 and 2019-2020 under grant agreement No 633053. The views and opinions expressed herein do not necessarily reflect those of the European Commission.
References
References
- [1] A. Fasoli, D. Borba, G. Bosia, D. J. Campbell, J. A. Dobbing, C. Gormezano, J. Jacquinot, P. Lavanchy, J. B. Lister, P. Marmillod, J. M. Moret, A. Santagiustina, and S. Sharapov. Direct measurement of the damping of toroidicity-induced alfvén eigenmodes. Physical Review Letters, 75(4):645–648, 1995.
- [2] A. Fasoli, J.B. Lister, S.E. Sharapov, S. Ali-Arshad, G. Bosia, D. Borba, D.J. Campbell, N. Deliyanakis, J.A. Dobbing, C. Gormezano, H.A. Holties, G.T.A. Huysmans, J. Jacquinot, A. Jaun, W. Kerner, P. Lavanchy, J.-M. Moret, L. Porte, A. Santagiustina, and L. Villard. Overview of Alfven eigenmode experiments in JET. Nucl. Fusion, 35:1485, 1995.
- [3] A Fasoli, J B Lister, S Sharapov, D Borba, N Deliyanakis, C Gormezano, J Jacquinot, A Jaun, H A Holties, G T A Huysmans, W Kerner, J.-M Moret, and L Villard. Observation of Multiple Kinetic Alfvén Eigenmodes. Physical Review Letters, 76(7), 1996.
- [4] A Fasoli, D Borba, C Gormezano, R Heeter, A Jaun, J Jacquinot, W Kerner, Q King, J B Lister, S Sharapov, D Start, and L Villard. Alfven eigenmode experiments in tokamaks and stellarators. Plasma Phys. Control. Fusion, 39(1067):287–301, 1997.
- [5] W W Heidbrink, A Fasoli, D Borba, and A Jaun. Stable ellipticity-induced Alfvén eigenmodes in the Joint European Torus. Physics of Plasmas, 4:3663, 1997.
- [6] A. Jaun, A. Fasoli, and W. W. Heidbrink. Prediction of Alfvén eigenmode dampings in the Joint European Torus. Physics of Plasmas, 5(8):2952–2955, 1998.
- [7] King Lap Wong. A review of Alfvén eigenmode observations in toroidal plasmas, 1999.
- [8] A. Fasoli, D. Borba, B. Breizman, C. Gormezano, R. F. Heeter, A. Juan, M. Mantsinen, S. Sharapov, and D. Testa. Fast particles-wave interaction in the Alfvén frequency range on the Joint European Torus tokamak. Physics of Plasmas, 7(5):1816–1824, may 2000.
- [9] A. Fasoli, A. Jaun, and D. Testa. Isotope mass scaling of AE damping rates in the JET tokamak plasmas. Physics Letters, Section A: General, Atomic and Solid State Physics, 265(4):288–293, jan 2000.
- [10] A Jaun, A Fasoli, and J Vaclavik. Gyrokinetic modelling of macro-instabilities in high performance tokamak plasmas. Plasma Phys. Control. Fusion, 43:207, 2001.
- [11] D. Testa and A. Fasoli. The effect of plasma shaping on the damping of low n Alfvén eigenmodes in JET tokamak plasmas. Nuclear Fusion, 41(7):809–812, jul 2001.
- [12] A Fasoli, D Testa, S Sharapov, H L Berk, B Breizman, A Gondhalekar, R F Heeter, M Mantsinen, and contributors to the EFDA-JET Workprogramme. MHD spectroscopy. Plasma Physics and Controlled Fusion, 44(12B):B159–B172, dec 2002.
- [13] D Testa, A Fasoli, A Jaun, Al , NN Gorelenkov, HL Berk, R Budny, C Boswell, and Marcos A Albarracin. Experimental test of damping models for n=1 toroidal Alfvén eigenmodes in JET. Nuclear Fusion, 43(479):479–482, 2003.
- [14] D Testa, A Fasoli, and A Jaun. Measurement of the damping rate of toroidal Alfvén eigenmodes as a function of the neutral beam heating power and plasma on JET. Nuclear Fusion, 43:724–728, 2003.
- [15] D. Testa, A. Fasoli, and E. Solano. Diagnosis and study of Alfvén eigenmodes stability in JET (invited). In Review of Scientific Instruments, volume 74, pages 1694–1700. American Institute of Physics, mar 2003.
- [16] D Testa, C Boswell, A Fasoli, Al , D Borba, M de Baar, M Bigi, J Brzozowski, P de Vries, and JET-EFDA Contributors. Alfvén mode stability and wave-particle interaction in the JET tokamak: prospects for scenario development and control schemes in burning plasma experiments. Plasma Phys. Control. Fusion, 46:59–79, 2004.
- [17] D. Testa, C. Boswell, and A. Fasoli. Experimental study of the dependence of the damping rate of n 1 TAEs on the on-axis safety factor and toroidal rotation shear. Nuclear Fusion, 45(8):907–917, aug 2005.
- [18] D Testa, C Boswell, A Fasoli, and JET-EFDA Contributors. Measurement of the instability threshold for toroidal Alfvén eigenmodes in JET plasmas with forward and reversed magnetic field. Nucl. Fusion, 46:829–836, 2006.
- [19] A. Fasoli, C. Gormenzano, H. L. Berk, B. Breizman, S. Briguglio, D. S. Darrow, N. Gorelenkov, W. W. Heidbrink, A. Jaun, S. V. Konovalov, R. Nazikian, J. M. Noterdaeme, S. Sharapov, K. Shinohara, D. Testa, K. Tobita, Y. Todo, G. Vlad, and F. Zonca. Chapter 5: Physics of energetic ions. Nuclear Fusion, 47(S264–S284):S264–S284, 2007.
- [20] A. Klein, H. Carfantan, D. Testa, A. Fasoli, and J. Snipes. A sparsity-based method for the analysis of magnetic fluctuations in unevenly-spaced Mirnov coils. Plasma Physics and Controlled Fusion, 50(12):125005, 2008.
- [21] A. Fasoli, D. Testa, T. Panis, A. Klein, J. A. Snipes, J. Sears, M. Gryaznevich, R. Martin, and S. D. Pinches. Active excitation and damping rate measurement of intermediate-n toroidal Alfvén eigenmodes in JET, C-Mod and MAST plasmas. Plasma Physics and Controlled Fusion, 52(7):075015, 2010.
- [22] T. Panis, D. Testa, A. Fasoli, A. Klein, H. Carfantan, P. Blanchard, and JET-EFDA Contributors. Optimization of the active MHD spectroscopy system on JET for the excitation of individual intermediate and high-n Alfvén eigenmodes. Nuclear Fusion, 50(084019), 2010.
- [23] D Testa, N Mellet, T Panis, P Blanchard, H Carfantan, A Fasoli, and JET-EFDA Contributors. The dependence of the damping rate of medium-n toroidal Alfven eigenmodes on the edge plasma elongation in JET. Nucl. Fusion, 50(16):084010, 2010.
- [24] D. Testa, H. Carfantan, A. Goodyear, P. Blanchard, A. Klein, T. Panis, and JET-EFDA contributors. The JET Alfvén Eigenmode Local Manager for the real-time detection and tracking of MHD instabilities. A Letters Journal Exploring the Frontiers of Physics, 92(50001), 2010.
- [25] D Testa, D Spong, T Panis, P Blanchard, A Fasoli, and JET-EFDA Contributors. Recent JET experiments on Alfvén eigenmodes with intermediate toroidal mode numbers: measurements and modelling of n = 3 toroidal Alfvén eigenmodes with the TAEFL code. Nucl. Fusion, 51:43009–43020, 2011.
- [26] D. Testa, H. Carfantan, A. Fasoli, A. Goodyear, Q. King, P. Blanchard, A. Klein, P. Lavanchy, and T. Panis. The JET Alfvén Eigenmode Local Manager for the real-time detection and tracking of a frequency-degenerate spectrum of MHD instabilities. Fusion Engineering and Design, 86(4-5):381–392, jun 2011.
- [27] T Panis, A Fasoli, D Testa, and JET-EFDA Contributors. Analysis of damping rate measurements of toroidal Alfven eigenmodes on JET as a function of n: part I. Nucl. Fusion, 52(3):023013, 2012.
- [28] T. Panis, A. Fasoli, and D. Testa. Analysis of damping rate measurements of toroidal Alfvén eigenmodes as a function of n: Part II. Nuclear Fusion, 52(3):023014, 2012.
- [29] D Testa, T Panis, P Blanchard, A Fasoli, and JET-EFDA Contributors. Plasma isotopic effect on the damping rate of toroidal Alfvén eigenmodes with intermediate toroidal mode numbers*. Nuclear Fusion, 52:094006, 2012.
- [30] Duccio Testa, Hervé Carfantan, and Alex Goodyear. Implementation of a novel real-time controller for the detection and tracking of magneto-hydrodynamic instabilities on the JET tokamak. Plasma and Fusion Research, 9(1405003):1–46, 2014.
- [31] P. Puglia, W. Pires de Sa, P. Blanchard, S. Dorling, S. Dowson, A. Fasoli, J. Figueiredo, R. Galvão, M. Graham, G. Jones, C. Perez von Thun, M. Porkolab, L. Ruchko, D. Testa, P. Woskov, M.A. Albarracin-Manrique, and JET Contributors. The upgraded JET toroidal Alfvén eigenmode diagnostic system. Nuclear Fusion, 56(11):112020, nov 2016.
- [32] F. Nabais, V. Aslanyan, D. Borba, R. Coelho, R. Dumont, J. Ferreira, A. Figueiredo, M. Fitzgerald, E. Lerche, J. Mailloux, M. Mantsinen, P. Rodrigues, M. Porkolab, P. Puglia, S.E. Sharapov, and JET Contributors. TAE stability calculations compared to TAE antenna results in JET. Nuclear Fusion, 58(8):082007, aug 2018.
- [33] V. Aslanyan, S. Taimourzadeh, L. Shi, Z. Lin, G. Dong, P. Puglia, M. Porkolab, R. Dumont, S. E. Sharapov, J. Mailloux, M. Tsalas, M. Maslov, A. Whitehead, R. Scannell, S. Gerasimov, S. Dorling, S. Dowson, H. K. Sheikh, T. Blackman, G. Jones, A. Goodyear, K. K. Kirov, P. Blanchard, A. Fasoli, and D. Testa. Gyrokinetic simulations of toroidal Alfvén eigenmodes excited by energetic ions and external antennas on the Joint European Torus. Nuclear Fusion, 59(2), feb 2019.
- [34] R A Tinguely, P G Puglia, N Fil, S Dowson, M Porkolab, A Fasoli, D Testa, and JET Contributors. Results from the Alfvén Eigenmode Active Diagnostic during the 2019-2020 JET deuterium campaign. Plasma Physics and Controlled Fusion, 62(11):115002, 2020.
- [35] J. A. Snipes, D. Schmittdiel, A. Fasoli, R. S. Granetz, and R. R. Parker. Initial active MHD spectroscopy experiments exciting stable Alfvén eigenmodes in Alcator C-Mod. Plasma Physics and Controlled Fusion, 46(4):611–620, apr 2004.
- [36] J. A. Snipes, N. Basse, C. Boswell, E. Edlund, A. Fasoli, N. N. Gorelenkov, R. S. Granetz, L. Lin, Y. Lin, R. Parker, M. Porkolab, J. Sears, S. Sharapov, V. Tang, and S. Wukitch. Active and fast particle driven Alfvén eigenmodes in Alcator C-Mod. In Physics of Plasmas, volume 12, pages 1–6, may 2005.
- [37] J. A. Snipes, N. N. Gorelenkov, and J. A. Sears. A comparison of measured and calculated toroidal Alfvén eigenmode damping rates in Alcator C-Mod. Nuclear Fusion, 46(12):1036–1046, dec 2006.
- [38] A. Fasoli, D. Testa, M. Way, R. Walton, S. Sanders, V. Riccardo, et al. The new alfvén wave excitation system at jet. In 8th IAEA Technical Committee Meeting on Energetic Particles in Magnetic Confinement Systems, San Diego, USA, pages 6–8, 2003.
- [39] D. Testa, A. Fasoli, P. Beaumont, R. Bertizzolo, M. Bigi, C. Boswell, R. Chavan, S. Huntley, N. Lam, A. Loving, S. Mills, V. Riccardo, S.G. Sanders, J.A. Snipes, J. Thomas, P. Titus, L. Villard, M. Vincent, R. Walton, M. Way, and JET-EFDA contributors. The new tae - alfvén wave active excitation system at jet. Proceedings 23rd Symposium on Fusion Technology (SOFT), Venice (Italy), 20-24 September 2004, 2004.
- [40] A. Dvornova, G. T. A. Huijsmans, S. Sharapov, F. J. Artola Such, P. Puglia, M. Hoelzl, S. Pamela, A. Fasoli, and D. Testa. Modeling of TAE mode excitation with an antenna in realistic X-point geometry. Physics of Plasmas, 27(1):012507, jan 2020.
- [41] R. J. Dumont, J. Mailloux, V. Aslanyan, M. Baruzzo, C.D. Challis, I. Coffey, A. Czarnecka, E. Delabie, J. Eriksson, J. Faustin, J. Ferreira, M. Fitzgerald, J. Garcia, L. Giacomelli, C. Giroud, N. Hawkes, Ph. Jacquet, E. Joffrin, T. Johnson, D. Keeling, D. King, V. Kiptily, B. Lomanowski, E. Lerche, M. Mantsinen, L. Meneses, S. Menmuir, K. McClements, S. Moradi, F. Nabais, M. Nocente, A. Patel, H. Patten, P. Puglia, R. Scannell, S. Sharapov, E. R. Solano, M. Tsalas, P. Vallejos, H. Weisen, and JET Contributors. Scenario development for the observation of alpha-driven instabilities in JET DT plasmas. Nuclear Fusion, 58(8):082005, aug 2018.
- [42] G. T.A. Huysmans, W. Kerner, D. Borba, H. A. Holties, and J. P. Goedbloed. Modeling the excitation of global Alfvén modes by an external antenna in the Joint European Torus (JET). Physics of Plasmas, 2(5):1605–1613, may 1995.
- [43] W. Kerner, J. P. Goedbloed, G. T.A. Huysmans, S. Poedts, and E. Schwarz. CASTOR: Normal-Mode Analysis of Resistive MHD Plasmas. Journal of Computational Physics, 142(2):271–303, may 1998.
- [44] G.T.A. Huysmans and O. Czarny. MHD stability in X-point geometry: simulation of ELMs. Nuclear Fusion, 47(7):659, jun 2007.
- [45] L.L. Lao, H. St. John, R.D. Stambaugh, A.G. Kellman, and W. Pfeiffer. Reconstruction of current profile parameters and plasma shapes in tokamaks. Nuclear Fusion, 25(11):1611–1622, 1985.
- [46] G.T.A. Huysmans, J.P. Goedbloed, and W. Kerner. Isoparametric Bicubic Hermite Elements for Solution of the Grad-Shafranov Equation. International Journal of Modern Physics C, 02(01):371–376, 1991.
- [47] G. T. A. Huysmans, S. E. Sharapov, A. B. Mikhailovskii, and W. Kerner. Modeling of diamagnetic stabilization of ideal magnetohydrodynamic instabilities associated with the transport barrier. Physics of Plasmas, 8(10):4292–4305, 2001.
- [48] H J C Oliver, S E Sharapov, B N Breizman, L.-J Zheng, and Jet Contributors. Axisymmetric global Alfvén eigenmodes within the ellipticity-induced frequency gap in the Joint European Torus. Phys. Plasmas, 24:122505, 2017.
- [49] L Villard and G.Y Fu. Geometrical and profile effects on toroidicity and ellipticity induced alfven eigenmodes. Nuclear Fusion, 32(10):1695–1713, oct 1992.
- [50] H. L. Berk, J. W. Van Dam, Z. Guo, and D. M. Lindberg. Continuum damping of low‐n toroidicity‐induced shear alfvén eigenmodes. Physics of Fluids B: Plasma Physics, 4(7):1806–1835, 1992.
- [51] M. N. Rosenbluth, H. L. Berk, J. W. Van Dam, and D. M. Lindberg. Continuum damping of high-mode-number toroidal alfvén waves. Phys. Rev. Lett., 68:596–599, Feb 1992.
- [52] Fulvio Zonca and Liu Chen. Resonant damping of toroidicity-induced shear-alfvén eigenmodes in tokamaks. Phys. Rev. Lett., 68:592–595, Feb 1992.
- [53] R. R. Mett and S. M. Mahajan. Kinetic theory of toroidicity-induced Alfvén eigenmodes. Physics of Fluids B, 4(9):2885–2893, sep 1992.