Simple and compact diode laser system stabilized to Doppler-broadened iodine-lines at 633 nm
Abstract
We present a compact iodine-stabilized laser system at 633 nm, based on a distributed-feedback laser diode. Within a footprint of cm2 the system provides 5 mW of frequency stabilized light from a single-mode fiber. Its performance was evaluated in comparison to Cs clocks representing primary frequency standards, realizing the SI unit Hz via an optical frequency comb. With the best suited absorption line the laser reaches a fractional frequency instability below for averaging times above 10 s. The performance was investigated at several iodine lines and a model was developed to describe the observed stability on the different lines.
1 Introduction
for interferometric length measurements. Without any additional reference, Zeeman-stabilized and two-mode frequency stabilized He-Ne laser have shown instabilities of and respectively at averaging times of 1000 s, and frequency drifts of about over several months [3, 4] These properties well meet the requirements of commercial laser interferometers. He-Ne lasers with internal iodine cell stabilized to Doppler free molecular hyperfine lines of iodine achieve an instability down to at 1000 s averaging time, and an absolute uncertainty of [5]. The stabilization of these systems is more demanding and they are mostly used for calibration.
However, He-Ne lasers require relatively large volumes even at low output powers, have a low power efficiency and they do not offer the possibility for wide-bandwidth frequency tuning. Furthermore, the technical know-how for building and maintaining He-Ne lasers is vanishing and hence alternative techniques in this wavelength range are needed.
Stabilizing a diode laser to a molecular or atomic reference is a promising substitute for He-Ne lasers as this eliminates their drawbacks . A narrow linewidth 633 nm diode laser stabilized to Doppler broadened iodine absorption lines has reached an instability of at 1000 s averaging time as evaluated with a wavelength meter. This laboratory setup employs an iodine cell with a length of 30 cm. Because of a low pressure (14 °C saturation temperature), a relatively long effective interaction length of 90 cm has to be used for the spectroscopy [7].
The stability of the laser system stabilized to different iodine lines was evaluated using an optical frequency comb.
2 Experimental Setup
2.1 Stabilized laser system
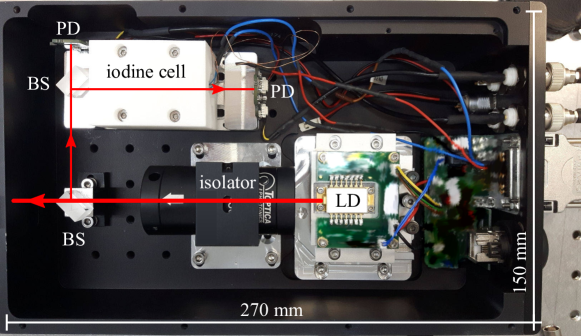
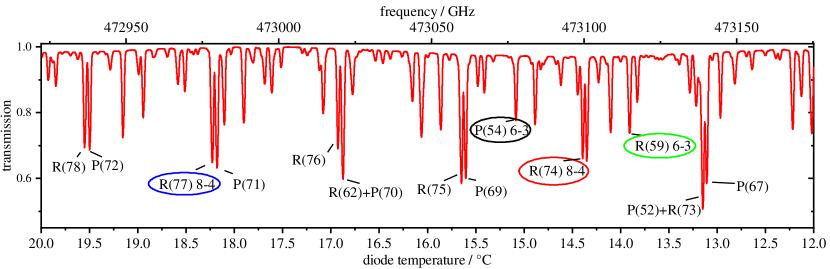
Fig. 1 shows the system in its 27 cm 15 cm housing. Light emitted from the DFB laser diode first passes an isolator to prevent perturbations by reflections back into the laser diode. Behind the isolator the light is split by a beamsplitter (BS) and The reflected part is sent through the iodine cell onto a photo diode (PD), while the transmitted beam is monitored by a second photo diode to provide a reference signal for normalization of the absorption spectrum. To achieve a strong absorption, the 3.3 cm long iodine cell (with purity according to the manufacturer >98 %) was heated to a temperature of 60 °C. Using published iodine vapor pressure data [10] interpolated by the Antoine equation [11] we estimate a saturated iodine vapor pressure of 616 Pa inside the cell.
By varying the diode temperature, the optical frequency can be tuned over a range of GHz without mode hops to scan the iodine spectrum (Fig. 2).
Depending on the diode temperature, the power at the fiber output is between 4.5 mW and 6.5 mW. To stabilize the laser frequency to a peak of an absorption line via a 1f-lock-in technique, the laser current is modulated at a frequency kHz. The corresponding peak-to-peak frequency modulation deviation of the emitted light was kept as small as MHz, which is much smaller than the Doppler-broadened iodine linewidth.
2.2 Frequency Measurement
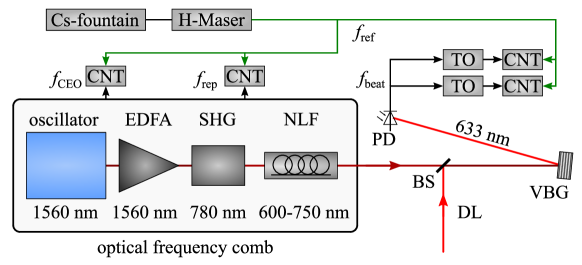
The long term instability and the absolute frequency of the laser system are characterized in comparison to two Cs fountain clocks via a hydrogen maser and an optical frequency comb (Fig. 3). The comb spectrum of the comb-generating Er:fiber-based fs-laser oscillator is centered around 1560 nm. After amplification in an Er-doped fiber amplifier (EDFA), the second harmonic comb spectrum around a wavelength of 780 nm is generated (SHG), which in a nonlinear fiber (NLF) generates a super-continuum spanning 600-750 nm [14]. The fields of the super-continuum and the DFB-laser system (DL) are overlapped using a beamsplitter. With a volume Bragg grating (VBG) most of the comb lines besides those near the line of the DFB-laser at 633 nm are filtered out in order to improve the signal-to noise ratio of the beat note detected with a photo diode. For band-pass filtering of the radiofrequency beat signal, tracking oscillators (TO) are phase-locked to the signal. Thus, clean signals are provided to the inputs of frequency counters (CNT) in -averaging mode [15] (K+K FXE) for dead-time-free synchronous measurement and recording of the RF frequencies. To make sure that the center frequency of the beat signal is tracked correctly despite the frequency modulation of the laser, different tracking oscillators with slightly different, asymmetrically chosen parameters and two counters are used. The frequency difference between these two channels is in the range of a few Hz (), thus significant measurement errors due to cycle slips of the tracking filters can be excluded. The optical absolute frequency is calculated from the beat frequency :
| (1) |
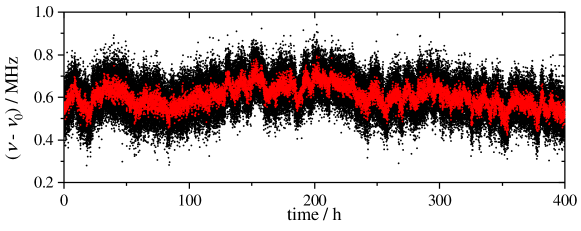
where is the carrier envelope offset frequency and the repetition rate. Both frequencies are also recorded by K+K FXE counters. The mode number of the comb line and the sign of are determined from a rough frequency measurement with a wavelength-meter having a few ten MHz uncertainty. Fig. 4 shows the measured absolute frequency of the laser stabilized to the line R(74) 8-4.
2.3 Simulation of Doppler broadened iodine spectra
Each absorption line in Fig. 2 consists of several hyperfine transitions with Voigt line shapes. Their Gaussian widths are given by the Doppler broadening () and their Lorentzian widths contain natural and collision broadening. In the investigated frequency range, the upper state lifetime of iodine is in the range of 300-400 ns [16], leading to a natural line width of about 400-500 kHz. At our vapor pressure and temperature collision broadening amounts to () [17]. Compared to these broadening contributions, additional transit time broadening can be neglected. For our simulations the Voigt profile was calculated as the real part of the Faddeeva function [18].
The absorption lines around 633 nm are between rovibrational levels in the and potentials of iodine and consist of several hyperfine lines in a range of about 1 GHz. The number of hyperfine lines depends on the rotational quantum number of the molecular ground state. Transitions with an even have 15 hyperfine components and with an odd 21, due to the required symmetry of the homonuclear molecular wavefunction [19].
The frequency and the relative intensity of the iodine hyperfine transitions were calculated using the program IodineSpec [20, 21]. This software is based on molecular potentials for the two electronic states involved and an interpolation for hyperfine splittings and achieves a standard (1-) frequency uncertainty of 1.5 MHz. The transmission spectrum of iodine in the frequency region of the laser system was simulated by summing the Voigt profiles of the individual hyperfine transitions. The relative intensities given by the program were scaled to match the simulated transmission to the experimental data (Fig. 2).
A pressure shift of about -5.9 MHz was included due to the high temperature of 333 K and corresponding vapor pressure of 616 Pa. The shift was obtained by scaling the pressure shift for a He-Ne laser stabilized to the R(127) 11-5 line of -9.5 kHz/Pa at a temperature of 288 K (18 Pa) [22].
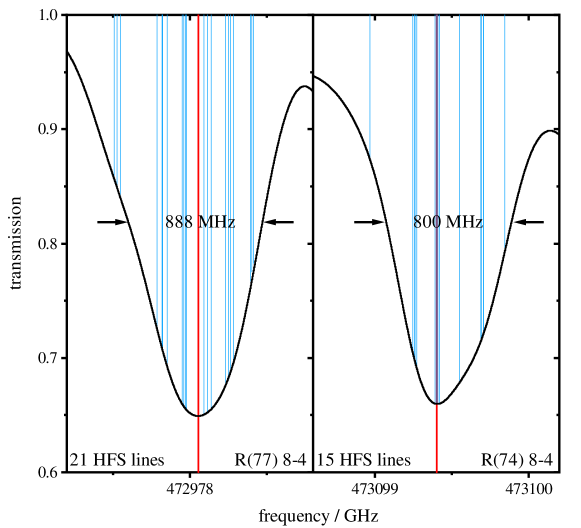
Fig. 5 presents the simulated line shapes of the transmission spectra of line R(77) 8-4 (21 HFS components) and R(74) 8-4 (15 HFS components). The two lines illustrate the influence of the number of HFS components on the total profile. The profile with 15 HFS components is more sharply peaked and shows a smaller full width at half maximum (FWHM) compared to the one with 21 components. This behavior is typical for all lines in the tuning range of the diode laser.
3 Experimental Results
To investigate the frequency stabilized laser system, Doppler broadened lines with 15 hyperfine components (P(54) 6-3, R(74) 8-4) and lines with 21 components (R(59) 6-3, R(77) 8-4) were used as reference.
| Linie | HFS | / MHz | / MHz | / MHz | / % | / | |
|---|---|---|---|---|---|---|---|
| P(54) | 15 | 473 077 641.3(2) | 473 077 638.4 | 2.9 | 78 | 1.96 | |
| R(74) | 15 | 473 099 403.6(1) | 473 099 406.6 | -3.0 | 66 | 2.83 | |
| R(59) | 21 | 473 114 765.8(4) | 473 114 756.9 | 8.9 | 74 | 1.08 | |
| R(77) | 21 | 472 978 055.3(2) | 472 978 054.5 | 0.8 | 65 | 1.77 |
Stabilized on line R(74) 8-4 the optical frequency was measured over several days. For the other lines the measurements lasted about 2 hours. For each of these iodine lines table 1 shows the number of HFS components, the measured center frequency calculated from the beat measurements data, the frequency position of the simulated minimum and the difference between simulation and experimental results. Compared to the line width of around 850 MHz, the residual frequency differences smaller than 10 MHz represent a good agreement.
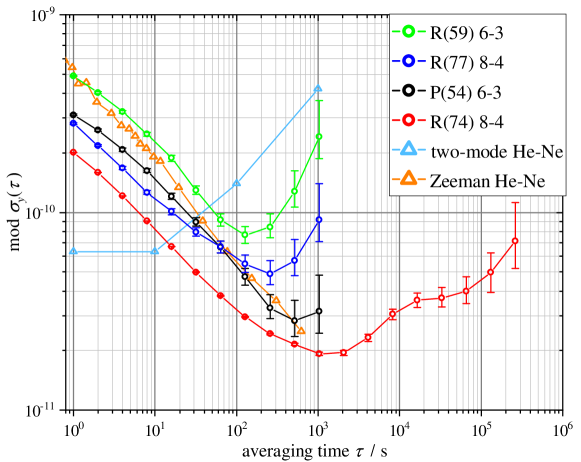
Fig. 6 shows the modified Allan deviation mod of the measured diode laser frequency as a function of the averaging time for the four investigated lines. At short averaging times the instability decreases proportionally to as expected for white frequency noise. However, at longer averaging times s it starts to rise again.
The short term instability can be explained by the signal-to-noise ratio of the error signal.
| (2) |
Thus the slope of the error signal is proportional to the curvature at the peak:
| (3) |
| (4) |
The width close to the peak is smaller for 15 HFS lines compared to the peak with 21 lines and therefore their curvature is increased by a factor of two. For all investigated lines the curvature is calculated from the simulated line shapes. Line R(59) has the smallest peak curvature with followed by line R(77) (), P(54) () and R(74) (). This order is also visible in the modified Allan deviation at intermediate averaging times (Fig. 6).
Much stronger variations between the lines are seen in the long term stability. Stabilized to line R(74) 8-4 (red) that shows the highest SNR, the laser system achieves the best frequency stability of all compared lines with a modified Allan deviation of at an averaging time and at . When stabilized to the second line with 15 HFS components, the Allan deviation rises at - , while on the lines with 21 HFS it rises already at - . We attribute this behavior to the different susceptibility of these lines to environmental perturbations.
4 Conclusion
We have presented a compact, iodine stabilized diode laser system at 633 nm with relative frequency instability below ( at ), which is competitive to Zeeman- and two-mode stabilized He-Ne lasers. In addition, we have shown that the laser can be tuned over a wide frequency range so that a large number of possible Doppler-broadened iodine lines can be used. The absolute frequency and the observed behavior of the stability was in good agreement with simulations based on molecular potentials of iodine.
We found a significant dependence of the stability on the hyperfine structure of the Doppler-broadened absorption lines that were used for stabilization. Because of its small size, lower electrical power consumption and high optical output power such stabilized diode laser systems using an external iodine-cell can become a valuable alternative to Zeeman- or two-mode stabilized He-Ne lasers at 633 nm.
5 Funding Information
This work is supported by the BMBF in the framework of the program KMU-innovativ: Photonik "FinDLiNG" (FKZ 13N13954) and by the EMPIR project 17FUN03 "USOQS". EMPIR projects are co-funded by the European Union’s Horizon 2020 research and innovation programme and the EMPIR Participating States.
6 Disclosures
CN, PL: TOPTICA Photonics (E).
References
- [1] G. Jäger, E. Manske, T. Hausotte, A. Müller, and F. Balzer, “Nanopositioning and nanomeasuring machine NPMM-200—a new powerful tool for large-range micro- and nanotechnology,” \JournalTitleSurface Topography: Metrology and Properties 4, 034004 (2016).
- [2] T. J. Quinn, “Practical realization of the definition of the metre, including recommended radiations of other optical frequency standards (2001),” \JournalTitleMetrologia 40, 103–133 (2003).
- [3] W. R. C. Rowley, “The performance of a longitudinal Zeeman-stabilised He-Ne laser (633 nm) with thermal modulation and control,” \JournalTitleMeasurement Science and Technology 1, 348–351 (1990).
- [4] P. E. Ciddor and R. M. Duffy, “Two-mode frequency-stabilised He-Ne (633 nm) lasers: studies of short- and long-term stability,” \JournalTitleJournal of Physics E: Scientific Instruments 16, 1223–1227 (1983).
- [5] BIPM, “Recommended values of standard frequencies,” online at https://www.bipm.org/en/publications/mises-en-pratique/standard-frequencies.html (Page last updated: 30 November 2018).
- [6] W. Gawlik and J. Zachorowski, “Stabilization of diode-laser frequency to atomic transitions,” \JournalTitleOptica Applicata 34, 607–618 (2004).
- [7] S. Rerucha, A. Yacoot, T. M. Pham, M. Cizek, V. Hucl, J. Lazar, and O. Cip, “Laser source for dimensional metrology: investigation of an iodine stabilized system based on narrow linewidth 633 nm DBR diode,” \JournalTitleMeas. Sci. Technol. 28, 045204 (2017).
- [8] B. Muralikrishnan, S. Phillips, and D. Sawyer, “Laser trackers for large-scale dimensional metrology: A review,” \JournalTitlePrecision Engineering 44, 13 – 28 (2016).
- [9] H. Talvitie, M. Merimaa, and E. Ikonen, “Frequency stabilization of a diode laser to Doppler-free spectrum of molecular iodine at 633 nm,” \JournalTitleOpt. Commun. 152, 182–188 (1998).
- [10] R. Honig and H. Hook, “Vapor pressure data for some common gases,” \JournalTitleRCA Rev. 21, 360–368 (1960).
- [11] G. W. Thomson, “The Antoine equation for vapor-pressure data.” \JournalTitleChemical Reviews 38, 1–39 (1946).
- [12] C. Nölleke, P. Leisching, G. Blume, D. Jedrzejczyk, J. Pohl, D. Feise, A. Sahm, and K. Paschke, “Frequency locking of compact laser-diode modules at 633 nm,” in Photonic Instrumentation Engineering V, vol. 10539 Y. G. Soskind, ed., International Society for Optics and Photonics (SPIE, 2018), pp. 28–33.
- [13] B. E. A. Saleh and M. C. Teich, Fundamentals of Photonics (John Wiley & Sons, Inc., New York, New York, 1991).
- [14] R. Holzwarth, T. Udem, T. W. Hänsch, J. C. Knight, W. J. Wadsworth, and P. S. J. Russell, “Optical frequency synthesizer for precision spectroscopy,” \JournalTitlePhys. Rev. Lett. 85, 2264–2267 (2000).
- [15] E. Benkler, C. Lisdat, and U. Sterr, “On the relation between uncertainties of weighted frequency averages and the various types of allan deviations,” \JournalTitleMetrologia 52, 565 (2015).
- [16] K. C. Shotton and G. D. Chapman, “Lifetimes of 127I2 molecules excited by the 632.8 nm He/Ne laser,” \JournalTitleJ. Chem. Phys. 56, 1012–1013 (1972).
- [17] A. Brillet and P. Cerez, “Quantitative description of the saturated absorption signal in iodine stabilized He-Ne lasers,” \JournalTitleMetrologia 13, 137 (1977).
- [18] A. K. Hui, B. H. Armstrong, and A. A. Wray, “Rapid computation of the Voigt and complex error functions,” \JournalTitleJ. Quant. Spectrosc. Radiat. Transfer 19, 509 – 516 (1978).
- [19] M. Kroll, “Hyperfine structure in the visible molecular-iodine absorption spectrum,” \JournalTitlePhys. Rev. Lett. 23, 631–633 (1969).
- [20] B. Bodermann, H. Knöckel, and E. Tiemann, “Widely usable interpolation formulae for hyperfine splittings in the 127I2 spectrum,” \JournalTitleEur. Phys. J. D 19, 31–44 (2002).
- [21] H. Knöckel, B. Bodermann, and E. Tiemann, “High precision description of the rovibronic structure of the I2 B–X spectrum,” \JournalTitleEur. Phys. J. D 28, 199–209 (2004).
- [22] C. S. Edwards, G. P. Barwood, P. Gill, and W. R. C. Rowley, “A 633 nm iodine-stabilized diode-laser frequency standard,” \JournalTitleMetrologia 36, 41 (1999).
- [23] C. Affolderbach and G. Mileti, “A compact laser head with high-frequency stability for Rb atomic clocks and optical instrumentation,” \JournalTitleRev. Sci. Instrum. 76, 073108 (2005).
- [24] S. T. Dawkins, J. J. McFerran, and A. N. Luiten, “Considerations on the measurement of the stability of oscillators with frequency counters,” \JournalTitleIEEE Trans. Ultrason. Ferroelectr. Freq. Control 54, 918–925 (2007).