Wide critical fluctuations of the field-induced phase transition in graphite
Abstract
In the immediate vicinity of the critical temperature (Tc) of a phase transition, there are fluctuations of the order parameter, which reside beyond the mean-field approximation. Such critical fluctuations usually occur in a very narrow temperature window in contrast to Gaussian fluctuations. Here, we report on a study of specific heat in graphite subject to high magnetic field when all carriers are confined in the lowest Landau levels. The observation of a BCS-like specific heat jump in both temperature and field sweeps establishes that the phase transition discovered decades ago in graphite is of the second-order. The jump is preceded by a steady field-induced enhancement of the electronic specific heat. A modest (20 percent) reduction in the amplitude of the magnetic field (from 33 T to 27 T) leads to a threefold decrease of Tc and a drastic widening of the specific heat anomaly, which acquires a tail spreading to two times Tc. We argue that the steady departure from the mean-field BCS behavior is the consequence of an exceptionally large Ginzburg number in this dilute metal, which grows steadily as the field lowers. Our fit of the critical fluctuations indicates that they belong to the universality class, similar to the case of 4He superfluid transition.
A phase transition is accompanied by sharp discontinuities of the thermodynamic properties. Quantifying entropy by measuring the specific heat across the transition pins down the order of the transition and informs on the underlying microscopic interaction. Of particular interest is the critical regime of the phase transition, which allows the identification the universality class of the transition and provides direct information on the order parameter Kadanoff et al. (1967). Critical fluctuations are important when their amplitude is comparable with the amplitude of the jump of the specific heat, , which occurs roughly when the reduced temperature is smaller that of others Ginzburg (1960), the Ginzburg criterion with:
| (1) |
Here, is the correlation length (averaged in presence of anisotropy) and is a numerical factor. In most cases, , the critical fluctuations are located in the extreme vicinity of the transition, and therefore, hardly observable. One notorious exceptions is the 4He superfluid transition for which the shape of the transition is determined by the critical fluctuation Lipa et al. (1996). Near a quantum critical point, thermal fluctuations are replaced by quantum mechanical zero-point fluctuations, which can produce new quantum phases Sachdev (2011).
Here, we report on the electronic specific heat () of graphite, using the state of the art of calorimeters, when all the carriers are confined in the lowest Landau levels (LLL), the so-called quantum limit, which can be easily achieved in this dilute metal. We find that this regime is marked by a steady field-induced enhancement of , signaling the enhancement of electron-electron correlations. Deep in this regime, we detect a jump in , unambiguously establishing a second-order phase transition induced by the magnetic field. As the magnetic field is reduced, the anomaly shifts to lower temperature and widens. It evolves from a BCS mean-field type transition at 33 T to a cross-over regime below 25 T. At the lowest critical temperature (T 1K), fluctuations can be observed up to two times Tc. We identify them as critical fluctuations associated with an exceptionally large Ginzburg number due to a low energy condensation. Comparison with a number of other phase transitions shows what distinguishes this phase transition and its criticality. In graphite, the difference in the heat capacity between the normal and ordered phase within a coherence volume rapidly drops with decreasing magnetic field and becomes exceptionally low.
With an electronic density as low as n=4cm-3 and light in-plane mass carrier (m=0.05m0), a magnetic field of 7.5T, labelled BQL, oriented along the c-axis of graphite is large enough to confine the carriers into the lowest LL (n=0). In the early 80s Tanuma and co-workers Tanuma et al. (1981) discovered the onset of an electronic phase transition at B=25T and T=1.3K. Since then, extensive electrical Yaguchi and Singleton (1998); Fauqué et al. (2013); Akiba et al. (2015); Zhu et al. (2017a); Arnold et al. (2017); Zhu et al. (2019), thermo-electrical Fauqué et al. (2011) and ultrasound measurements LeBoeuf et al. (2017) at high magnetic field have established that graphite hosts a succession of, at least, two field induced phases Fauqué et al. (2013); Zhu et al. (2019) arising from electron-hole instabilities. Depending on the nesting vector considered and the strength of the electron-electron interaction, various types of charge Yoshioka and Fukuyama (1981); Arnold et al. (2017), spin Takada and Goto (1998) density waves or an excitonic insulating phase Akiba et al. (2015); Zhu et al. (2017a, 2019); Pan and Shindou (2019) have been proposed. To the notable exception of ultrasound measurements LeBoeuf et al. (2017) these studies have employed transport probes. Due to the low electronic density of graphite, thermodynamic studies are challenging and, nevertheless, crucial.
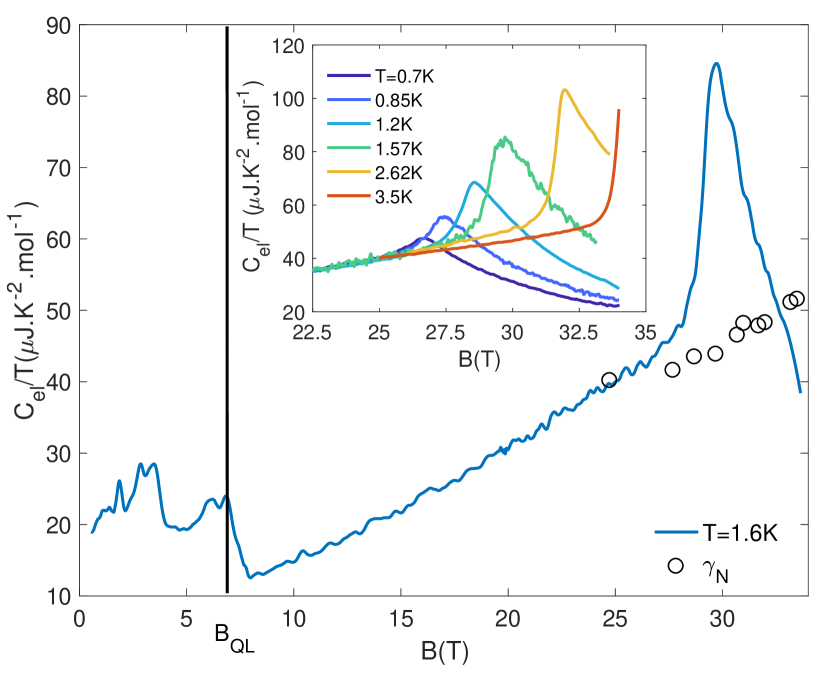
Fig.1a) shows the field dependence of = at T=1.6K up to 35T of graphite. The specific heat set-up is described in the supplementSM . At zero field, is as small as 20 3 J.mol-1.K-2 in good agreement with the value expected from the Slonczewski Weiss McClure (SWM) band model Komatsu and Nagamiya (1951); van der Hoeven and Keesom (1963). This is several orders of magnitude smaller than in metals due to its low density and lightness of carrier. Sweeping the magnetic field, we found that peaks at each LL depopulation. Above BQL, increases linearly up to 28T where it presents yet another peak, which evolves with temperature. The temperature and magnetic field dependence of the 28T peak can be tracked by field sweeps (at different temperatures), as shown in the inset of Fig.1 and by temperature sweeps (at different magnetic fields), as shown on Fig.2 a).
Let us begin by commenting the evolution of with magnetic field between 10 T and 35 T. Its magnitude in the normal state (labelled ) can be deduced from temperature sweeps, shown in Fig.2a), and is represented by open black circles in Fig.1. increases linearly with magnetic field. The threefold enhancement between 10 T and 35 T is larger than the enhancement of reported in Sr3Ru2O7 across its quantum critical point Rost et al. (2011). This remarkable enhancement is driven by the change of the density of states (DOS) induced by the magnetic field. When BBQL the DOS of the LLL is the product of the in-plane degeneracy (which scales linearly with the field) and the one dimensional DOS along the field direction. As long as the Fermi energy (EF) is far from the bottom of the LLL scales linearly with B and with where is the mass along the magnetic field and EF (see the supplement SM ). The small EF40meV and the large c-axis mass m10-20 of graphite set the large slope, which we find to be =2.2 0.5J.K-2.mol-1.T-1). Decades ago, starting from the SWM model, Jay-Gerin computed =1.8J.K-2.mol-1.T-1 Jay-Gerin (1976) in quantitative agreement with our result.
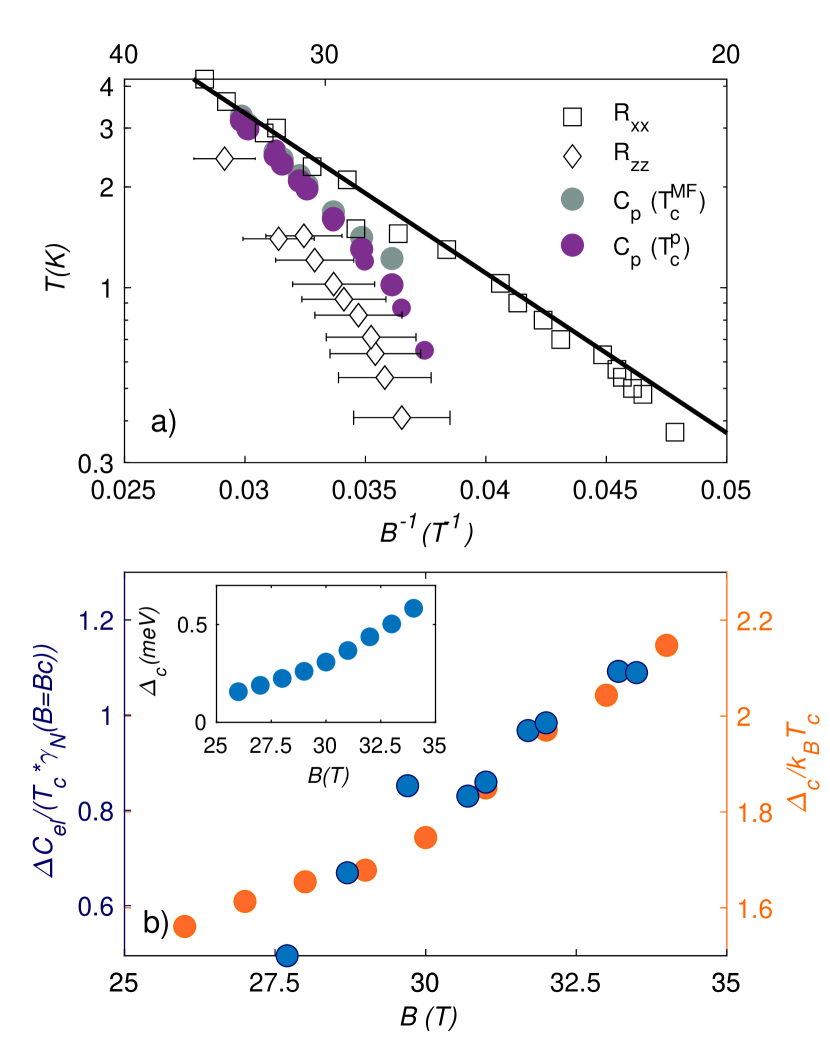
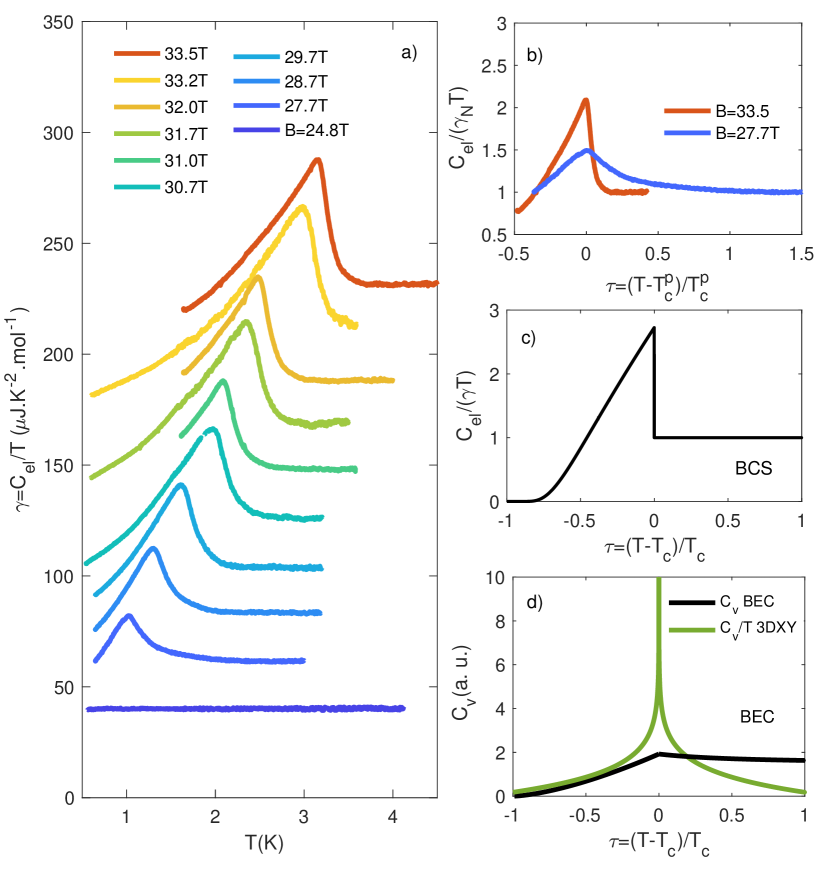
At the highest magnetic field (B=33.5T), the specific heat anomaly occurs at T3K (see Fig.2a)). The transition shifts to lower Tc with decreasing magnetic field, in contrast to a superconducting transition. By reducing the magnetic field by twenty percent, i.e. by passing from 33.5T to 27.7T, Tc decreases by a factor of 3. Fig.3a) shows how Tc derived from the peak in compares with those deduced from anomalies in the in-plane (Rxx) and the out-of-plane resistance (Rzz) measurements. Each symbol represents a Tc (B) (or Bc(T)) anomaly. The vertical axis represents and the horizontal axis B-1. Thus, the BCS-like expression Tc=T Yoshioka and Fukuyama (1981) becomes a straight line, which is the behavior of Tc(B) according to Rxx measurements. In this formula, and B⋆ are phenomenological temperature and field scales and the underlying assumption is that the DOS linearly increases with magnetic field Yoshioka and Fukuyama (1981). The onset of ordering has different manifestations in Rxx (which jumps by 30 but does not diverge) and in Rzz Fauqué et al. (2013); Zhu et al. (2019), which shows an activation behavior and a detectable energy gap (see SM for complementary measurements). As seen in Fig.3a), the peak in tracks the onset of the activation energy in Rzz and below 3 K, they both occur below the Rxx anomaly and the BCS line. Fig.3b), shows the evolution of the ratio of the activation gap, , to the critical temperature with magnetic field, which is close to what is expected in the BCS picture and it weakens with decreasing field. The same figure shows that the normalized specific heat jump presents a similar evolution towards weak coupling as the field decreases.
The steady evolution towards weak coupling with decreasing magnetic field is accompanied by a drastic change in the shape of the specific heat anomaly (see Fig.2a and b). At B=33.5T, the amplitude of the jump is =1.1, smaller than what is expected for a mean-field weak-coupling case and has a small tail caused by fluctuations above the critical temperature. With decreasing Tc the transition widens, decreases and the tail extends to higher temperatures. At Bc=27.7T, the tail of the transition extends up to twice Tc. The anomalies at two fields differing merely by a factor of 1.2 are compared in Fig.2. At B=33.5T, the anomaly looks similar to a mean-field BCS transition (sketched in Fig.2c)), but at Bc=27.7T, it acquires a cusp shape and the fluctuating contribution weighs as much as the mean-field jump. This is to be compared and contrasted with the case of the superfluid transition in 4He (sketched in Fig.2d)). In the latter case, there is no specific heat jump Feynman (1953) and the 3DXY critical fluctuations induce the non-analytical behavior of the specific heat across the ’’-transition Lipa et al. (1996). Thus, what distinguishes the case of the field induce state of graphite from a typical superconductor and the archetypal superfluid is the simultaneous presence of a BCS jump and strong fluctuations and the contrasting evolution of these two components of the specific heat anomaly in a narrow field range.
Fig.4a) shows = as a function of the reduced temperature . Here is the temperature at which specific heat peaks. quantifies the excess in specific heat relative to a mean-field transition. The log-log plot clearly shows that it does not evolve as power law and points therefore to a non-Gaussian origin (for which with is the dimension and is the BCS coherence length Larkin and Varlamov (2005)). On the other hand, as shown in the inset of the same figure, a simple empirical law of the form : captures the evolution of the data with B and . The field dependence of the two parameters and is shown in Fig.4b). With decreasing magnetic field increases and its extrapolation implies when B27 T, where no specific heat anomaly is detected down to 0.6K ( see Fig.2a). As seen in Fig.4e), it is possible to collapse all the curves on top of each other by plotting vs. where is a renormalised ( and taken as =).
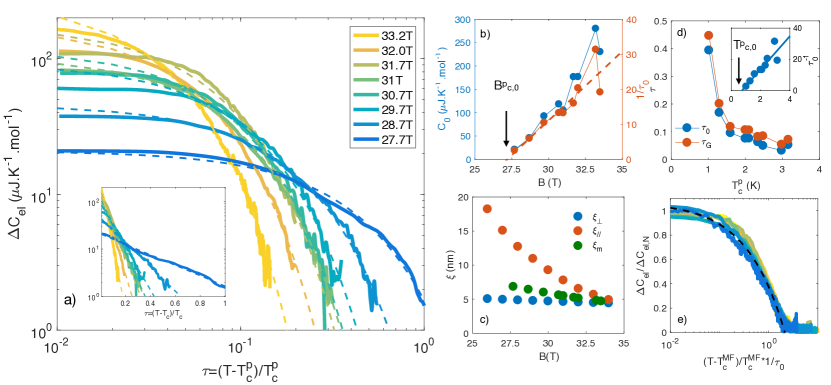
The success of this simple scaling procedure has implications for the origin of the broadening of the transition caused by a small variation in the amplitude of the magnetic field. It is unlikely that disorder plays a major role. In this layered material, however, the in-plane and out-of-plane length scales differ by several orders of magnitude. The mean free path within the graphene planes, is very long, in the range of 5m to 50m, three orders of magnitude longer than =7nm, and the magnetic length, ==5nm at 25 T which is a plausible candidate to represent the in-plane coherence length () beyond the quantum limit. On the other hand, the mean free path along the c-axis, is two or three orders of magnitude shorter than . However, it remains longer than the c-axis inter-electron distance, d and exceeds the c-axis coherence length (). The latter can be estimated using the BCS coherence length ==. Here is the c-axis gap (deduced from the activated behavior of Rzz and shown in the inset of Fig.3b)) and = (where is the interlayer distance). As seen in Fig.LABEL:FlucSMd) 5nm and 15nm. The latter number may approach the estimated below 25T. Therefore the role played by stacking disorder across the planes in causing the broadening cannot be rule out at the lowest magnetic field.
The most plausible source of the observed broadening are critical fluctuations. This can be seen by quantifying the Ginzburg criterion and the expected width of the thermal window for critical fluctuations. Plugging the measured and the estimated () in Eq.1, we deduced . As seen in Fig.4d), this estimation of closely matches deduced from our fits to the data. At the highest field, B=33T , which is already non negligible. As the field decreases to 27.7T, becomes as large as 0.45, which is exceptionally large in comparison to any other known second-order phase transition. This is seen in Table 1 which compares our case with a few other systems. The list consists of a conventional superconductor (Sn), two superconductors with higher Tcs and shorter coherence lengths (MgB2 and YBa2CuO7), and a Charge Density Wave (CDW) solid (K0.3MoO3). One can see that it is the small magnitude of , which distinguishes graphite, a system in which 10000 atoms share a single electron and hole. Even at 33 T, the amplitude of the specific heat jump is many orders of magnitude smaller than others. This 0.16mJK-1mol-1 (combined with a molar volume of Vm=5.27 cm3.mol-1) implies that the difference in average specific heat of the normal and ordered phases within a coherence volume becomes comparable to the Boltzmann constant (), making this competition critically fragile. With decreasing magnetic field, fluctuations grow and the transition widens because of further decrease in .
| Sample | (J.K-1.m-3) | () | ||
|---|---|---|---|---|
| Sn (SC)Kadanoff et al. (1967) | 800 | 2300 | ||
| MgB2 (SC)Park et al. (2002) | 3360 | 26 | ||
| K0.3MoO3 (CDW)Brill et al. (1995); McKenzie (1995) | 35800 | 6.2() | 0.01 | |
| YBa2CuO7 (SC) Junod et al. (2002) | 4993 | 6.7() | 0.2 | |
| graphite (33.2T) | 30.1 | 47() | 0.05 | |
| graphite (27.7 T) | 3.7 | 68() | 0.45 |
So far we have discussed the temperature dependence of through a phenomenological two-parameter exponential fit. As shown in Fig.4e), on the whole temperature range, it is equally possible to fit with a simplified version of the asymptotic form of 3DXY universality class expression with three parameters : (see the supplement SM ). This universality class provides a natural explanation for the saturation of at low due to its almost vanishing critical exponent (-0.01Le Guillou, J.C. and Zinn-Justin, J. (1985)). Therefore, we conclude that the observed broadening of the transition is caused by critical fluctuations belonging to the 3DXY model. Let us note that Gaussian fluctuations expected outside the critical window, i.e. for would bring a correction to the mean field behavior. Such a correction is not detected in our data, presumably because of the width and predominance of the critical fluctuations.
Let us also note that below a critical temperature, T1K, and a critical field B 25T the entrance in the ordered phase is no more accompanied by a well defined jump in but it is replaced by a cross-over. In this case, like in the case of the -transition, critical fluctuations dominate the transition. However, in contrast to the -transition Lipa et al. (1996), they are not restricted to the extreme vicinity of the transition.
The present result helps to understand the evolution of the observed anomalies in the Nernst effect Fauqué et al. (2011); Wang et al. (2020) (a measure of the entropy per carrier Bergman and Oganesyan (2010)) and the ultra-sound measurements LeBoeuf et al. (2017) caused by the transition. At low temperature, one expects that ordering induces a smooth variation in entropy (see SM ) and therefore a rounded drop in the Nernst response Fauqué et al. (2011); Wang et al. (2020). As the temperature increases the mean field component of the transition strengthens and the Nernst anomaly becomes a clear kink. Furthermore, the origin of the relatively large jump in the sound velocity becomes clear. It was argued LeBoeuf et al. (2017) that it can be caused by either a strong anisotropy in the strain dependence of Tc or a large jump in the specific heat (for example due to a putative lattice deformation accompanying the transition). According to the present study, and the transition is purely electronic. Therefore, we can safely conclude that the jump in the sound velocity is caused by a strong anisotropic strain dependence of Tc.
Future studies of the specific heat at higher magnetic field would shed light to the BCS-BEC crossover as one approaches the maximum transition temperature around 47T, where the degeneracy temperature and critical temperature become close to each otherWang et al. (2020). Specific heat studies on other dilutes metals pushed to extreme quantum limit and hosting field-induced state (such as bismuth Zhu et al. (2017b); Iwasa et al. (2019), InAs Jaoui et al. (2020), TaAs Ramshaw et al. (2018) or ZrTe5 Tang et al. (2019)) could bring interesting insights.
In summary, we measured the specific heat of graphite in high magnetic field and detected a second-order phase transition jump at high field. The specific heat anomaly drastically evolves in a narrow field window as a consequence of the change in the balance between critical fluctuations and a mean-field jump. The field-induced phase transition in graphite emerges from this study as possessing an exceptionally wide critical window compared to any other electronic phase transition.
Acknowledgements.
We thank Zengwei Zhu for useful discussions. We acknowledge the support of the LNCMI-CNRS, member of the European Magnetic Field Laboratory (EMFL). This work was supported by JEIP-Collège de France and by the Agence Nationale de la Recherche (ANR-18-CE92-0020-01; ANR-19-CE30-0014-04). J.K. was supported by the Slovak grants No. APVV-16-0372 and VEGA 2/0058/20.References
- Kadanoff et al. (1967) L. P. Kadanoff, W. Götze, D. Hamblen, R. Hecht, E. A. S. Lewis, V. V. Palciauskas, M. Rayl, J. Swift, D. Aspnes, and J. Kane, Rev. Mod. Phys. 39, 395 (1967).
- Ginzburg (1960) V. Ginzburg, Soviet Phys.—Solid State 2, 1824 (1960).
- Lipa et al. (1996) J. A. Lipa, D. R. Swanson, J. A. Nissen, T. C. P. Chui, and U. E. Israelsson, Phys. Rev. Lett. 76, 944 (1996).
- Sachdev (2011) S. Sachdev, Quantum Phase Transitions (Cambridge University Press, 2011).
- Tanuma et al. (1981) S. Tanuma, R. Inada, A. Furukawa, O. Takahashi, Y. Iye, and Y. Onuki, Springer Series in Solid State Sciences (1981).
- Yaguchi and Singleton (1998) H. Yaguchi and J. Singleton, Phys. Rev. Lett. 81, 5193 (1998).
- Fauqué et al. (2013) B. Fauqué, D. LeBoeuf, B. Vignolle, M. Nardone, C. Proust, and K. Behnia, Phys. Rev. Lett. 110, 266601 (2013).
- Akiba et al. (2015) K. Akiba, A. Miyake, H. Yaguchi, A. Matsuo, K. Kindo, and M. Tokunaga, Journal of the Physical Society of Japan 84, 054709 (2015), https://doi.org/10.7566/JPSJ.84.054709 .
- Zhu et al. (2017a) Z. Zhu, R. D. McDonald, A. Shekhter, B. J. Ramshaw, K. A. Modic, F. F. Balakirev, and N. Harrison, Scientific Reports 7, 1733 (2017a).
- Arnold et al. (2017) F. Arnold, A. Isidori, E. Kampert, B. Yager, M. Eschrig, and J. Saunders, Phys. Rev. Lett. 119, 136601 (2017).
- Zhu et al. (2019) Z. Zhu, P. Nie, B. Fauqué, B. Vignolle, C. Proust, R. D. McDonald, N. Harrison, and K. Behnia, Phys. Rev. X 9, 011058 (2019).
- Fauqué et al. (2011) B. Fauqué, Z. Zhu, T. Murphy, and K. Behnia, Phys. Rev. Lett. 106, 246405 (2011).
- LeBoeuf et al. (2017) D. LeBoeuf, C. W. Rischau, G. Seyfarth, R. Küchler, M. Berben, S. Wiedmann, W. Tabis, M. Frachet, K. Behnia, and B. Fauqué, Nature Communications 8, 1337 (2017).
- Yoshioka and Fukuyama (1981) D. Yoshioka and H. Fukuyama, Journal of the Physical Society of Japan 50, 725 (1981).
- Takada and Goto (1998) Y. Takada and H. Goto, Journal of Physics: Condensed Matter 10, 11315 (1998).
- Pan and Shindou (2019) Z. Pan and R. Shindou, Phys. Rev. B 100, 165124 (2019).
- (17) See Supplemental Material for more details on the sample, a discussion on the density of state and the electronic specific heat of 3D metals in the quantum limit, the c-axis transport measurement and the fit of with the 3DXY model.
- Komatsu and Nagamiya (1951) K. Komatsu and T. Nagamiya, Journal of the Physical Society of Japan 6, 438 (1951).
- van der Hoeven and Keesom (1963) B. J. C. van der Hoeven and P. H. Keesom, Phys. Rev. 130, 1318 (1963).
- Rost et al. (2011) A. W. Rost, S. A. Grigera, J. A. N. Bruin, R. S. Perry, D. Tian, S. Raghu, S. A. Kivelson, and A. P. Mackenzie, 108, 16549 (2011).
- Jay-Gerin (1976) J.-P. Jay-Gerin, Solid State Communications 19, 1241 (1976).
- Feynman (1953) R. P. Feynman, Phys. Rev. 91, 1291 (1953).
- Larkin and Varlamov (2005) A. Larkin and A. Varlamov, Theory of Fluctuations in Superconductors (Oxford University Press, 2005).
- Park et al. (2002) T. Park, M. B. Salamon, C. U. Jung, M.-S. Park, K. Kim, and S.-I. Lee, Phys. Rev. B 66, 134515 (2002).
- Brill et al. (1995) J. W. Brill, M. Chung, Y. K. Kuo, X. Zhan, E. Figueroa, and G. Mozurkewich, Phys. Rev. Lett. 74, 1182 (1995).
- McKenzie (1995) R. H. McKenzie, Phys. Rev. B 51, 6249 (1995).
- Junod et al. (2002) A. Junod, Y. Wang, F. Bouquet, and P. Toulemonde, in Studies of High Temperature Superconductors, Nova Science Publishers,, edited by A. Narlikar (Nova Science Publishers, Commack, N.Y. 38, 2002) p. 179.
- Le Guillou, J.C. and Zinn-Justin, J. (1985) Le Guillou, J.C. and Zinn-Justin, J., J. Physique Lett. 46, 137 (1985).
- Wang et al. (2020) J. Wang, P. Nie, X. Li, H. Zuo, B. Fauqué, Z. Zhu, and K. Behnia, PNAS xx, under press (2020).
- Bergman and Oganesyan (2010) D. L. Bergman and V. Oganesyan, Phys. Rev. Lett. 104, 066601 (2010).
- Zhu et al. (2017b) Z. Zhu, J. Wang, H. Zuo, B. Fauqué, R. D. McDonald, Y. Fuseya, and K. Behnia, Nature Communications 8, 15297 (2017b).
- Iwasa et al. (2019) A. Iwasa, A. Kondo, S. Kawachi, K. Akiba, Y. Nakanishi, M. Yoshizawa, M. Tokunaga, and K. Kindo, Scientific Reports 9, 1672 (2019).
- Jaoui et al. (2020) A. Jaoui, G. Seyfarth, C. W. Rischau, S. Wiedmann, S. Benhabib, C. Proust, K. Behnia, and B. Fauqué, “Giant seebeck effect across the field-induced metal-insulator transition of ,” (2020), arXiv:2008.06356 [cond-mat.mtrl-sci] .
- Ramshaw et al. (2018) B. J. Ramshaw, K. A. Modic, A. Shekhter, Y. Zhang, E.-A. Kim, P. J. W. Moll, M. D. Bachmann, M. K. Chan, J. B. Betts, F. Balakirev, A. Migliori, N. J. Ghimire, E. D. Bauer, F. Ronning, and R. D. McDonald, Nature Communications 9, 2217 (2018).
- Tang et al. (2019) F. Tang, Y. Ren, P. Wang, R. Zhong, J. Schneeloch, S. A. Yang, K. Yang, P. A. Lee, G. Gu, Z. Qiao, and L. Zhang, Nature 569, 537 (2019).