Conceived and designed the analysis; Collected the data; Contributed data or analysis tools; Performed the analysis; Writing - original draft \cortext[cor1]Corresponding author \creditCollected the data; Contributed data or analysis tools; Performed the analysis; Writing - review
Growth and dynamics of Econophysics: A bibliometric and network analysis
Abstract
Digitization of publications, advancement in communication technology, and the availability of bibliographic data have made it easier for the researchers to study the growth and dynamics of any discipline. We present a study on “Econophysics” metadata extracted from Web of Science managed by the Clarivate Analytics from 2000-2019. The study highlights the growth and dynamics of the discipline by measures of a number of publications, citations on publications, other disciplines contribution, institutions participation, country-wise spread, etc. We investigate the impact of self-citations on citations with every five-year interval. Also, we find the contribution of other disciplines by analyzing the cited references. Results emerged from micro, meso and macro-level analysis of collaborations show that the distributions among authors collaboration and affiliations of authors follow a power law. Thus, very few authors keep producing most of the papers and are from few institutions. We find that China is leading in the production of a number of authors and a number of papers; however, shares more of national collaboration rather than international, whereas the USA shares more international collaboration. Finally, we demonstrate the evolution of the author’s collaborations and affiliations networks from 2000-2019. Overall the analysis reveals the “small-world” property of the network with average path length 5. As a consequence of our analysis, this study can serve as an in-depth knowledge to understand the growth and dynamics of Econophysics network both qualitatively and quantitatively.
keywords:
Econophysics \sepBibliometric analysis \sepCitations analysis \sepScientific collaboration \sepCo-authorship networkThe objective of this research is to assess the scientific development of “Econophysics” in terms of the total number of studies carried out over two decades. This study analyses the growth of publications, citations, key disciplines, journals, nations, organizations, and authors involved in information productivity and dissemination of knowledge. For the analysis, the data has been taken from the Clarivate Analytics Web of Science from 2000-2019.
We have shown the dynamics of citations and self-citations with a gap of five-year intervals. Also, the contribution of disciplines has been measured from the cited references.
We have identified the disciplines from the cited references that have highly contributed to the development of the field.
We have explored the scientific collaborations networks at the micro, meso, and macro-levels to investigate the key author’s, their affiliations, and corresponding countries, respectively.
We have demonstrated the evolution and growth of co-authorship and institutional collaborations networks over the years.
1 Introduction
Scientific collaborations have seen considerable growth in recent times and have emerged as an important factor for productive and qualitative research. The citation analysis of the scientific publications have become a tool to analyze the individual’s performance, journal’s impact as well as the discipline’s growth (Zeng et al., 2017; Radicchi et al., 2017). Bibliometrics analysis not only makes a decision on the researcher’s growth, in fact, it also measures the growth of a discipline. Many new interdisciplinary and multidisciplinary fields have arisen over time which in turn have increased and strengthened the interdisciplinary collaborations (Amaral et al., 1999; Stanley et al., 1999; Chakraborti et al., 2016). One such interdisciplinary field is “Econophysics” which was coined by H. Eugene Stanley in 1995 (Stanley and Mantegna, 2000; Chakrabarti et al., 2006; Rosser, 2008). Initially, physicists and economists contributed together to start this field and started applying theories and methods of physics to address problems in economics and stock markets (Carbone et al., 2007; Roehner, 2010; Chakraborti et al., 2011; Pereira et al., 2017; Abergel et al., 2019). Later on, with the acceptance of the idea, scholars from other disciplines started contributing. Before the term Econophysics was coined, many people from different branches of science had worked and applied their knowledge in the field of economics leading to the evolution of Econophysics (Dash, 2014).
Citations play a significant role in understanding the link between scientific works (Tahamtan and Bornmann, 2019). Nowadays, most of the research publications are created by teams of researchers instead of single individuals (Guimera et al., 2005). To investigate the patterns and trends of scientific collaboration, researchers have been working on publications data for a long time. There are different methods available in the literature to study collaborations and among them investigating the co-authorship network is the popular one (Sun and Rahwan, 2017). A co-authorship network is a social network built on scientific collaborations, and thus it is amenable to social network analysis (Barabási et al., 2016; Singh et al., 2020). With the development of complex network theory, researchers have been using network science to re-investigate the structural properties of co-authorship networks (Price, 1965; Newman, 2001, 2003; Newman et al., 2006; Zheleva et al., 2009).
Over time many such networks have been studied in different domains of social aspects like the author’s collaborations (Newman, 2001; Andrikopoulos et al., 2016), author’s affiliations collaborations (Zheleva et al., 2009), and countries collaborations networks (Ortega and Aguillo, 2013). Finding communities inside network (Good et al., 2010) and calculating centralities have been a major focus of social network analysis (Freeman, 1977; Valente et al., 2008). It identifies critical pointers in the network and often used to equate popularity and leadership. The above-mentioned social networks are either directed or undirected where nodes act as authors and edges represent the collaboration among authors. The author’s collaboration analysis is a micro-level study however, such interactions among authors also give rise to institutional collaborations at meso-level and cross-country collaborations at the macro-level. Investigating the co-authorships network can help to identify entrants, leading researchers, and new collaborations. Co-authorship, institutional, and cross-country collaboration networks jointly reveal scientific collaboration and its growth (Chakrabarti and Chakraborti, 2010; Ghosh, 2013; Sinatra et al., 2016). This way we captured the changes in network structure at the microscopic, mesoscopic, and macroscopic levels and identified the key leaders at all levels.
The scholars have studied the econophysicists collaboration network earlier (Fan et al., 2004; Li et al., 2007), however, to the best of our knowledge, no one has performed systematic empirical research highlighting the patterns in data, key disciplines by cited references, and the patterns of collaborations at micro, meso, and macro-levels. At the micro-level, an author’s collaboration, at the meso-level author’s affiliation, and at macro-level countries’ collaboration networks have been analyzed that demonstrate the in-depth knowledge of the growth of the discipline. This is the first time we are showing the detailed analysis of Econophysics through bibliometric and network analyses which cover the gap of the previous studies accomplished on it. It demonstrates the current state of Econophysics and provides researchers and practitioners with up-to-date knowledge. Thus, the objective of this study is to appraise the scientific evolution of Econophysics through various factors involved in information productivity and diffusion of knowledge.
To demonstrate the progress, growth and dynamics of Econophysics, the study is organized as follows: Section 2 provides the data description. Section 3 highlights the results which are further divided into three subsections: Subsection 3.1 discusses the results on dynamics of citation patterns in the data and the key disciplines of the cited references. Subsection 3.2 presents a detailed discussion on the collaboration networks at micro- (3.2.1 and 3.2.2), meso- (3.2.3) and macro- (3.2.4) levels. Subsection 3.3 shows the growth of co-authorship and institutional networks over years. Section 4 concludes this study and discusses the limitations and future directions.
2 Data description
We collected the data from Web of Science managed (WoS) by Clarivate Analytics. The data mining API (https://apps.webofknowledge.com/) of WoS is used to fetch the records (Bacis, 2019). We searched for the papers that match the keyword Econophysics published during 2000-2019. During 1995-1999 significant publication count is not available in WoS, so we could not perform the analysis since 1995. A total of 1458 records are retrieved including all document types. We further filtered the data based on the Document Type and included papers which are: Articles, Reviews, Proceedings, Editorial Material, and Book Chapter as these categories are having a sufficient number of papers. Hence, we finally filtered 1437 records. All records contain the full description of the paper like author name, affiliation, citations, publication journals, references, etc.
To retrieve the disciplines of the cited references of each paper, first, we extracted the title of each reference and then searched for that title in the WoS database. Not all cited references are listed in the WoS and this allowed us to match of the references. This way we get the list of relative disciplines of all cited references in 1437 papers. To get the list of author’s collaborations, we identified the author’s unique ID provided by WoS (DAIS number) as there could be two authors with the same name. Similarly, corresponding to the author’s ID, we identified the institutions. The corresponding author’s location information is extracted from the reprinting address in the paper. Many scholars have studied the economy and the stock market behavior by using the methods of statistics, mathematics, computer science, etc. However, the focus of our study is to select papers where physics concepts have been used to study the economy and stock market behavior.
3 Results
3.1 Dynamics of citation patterns
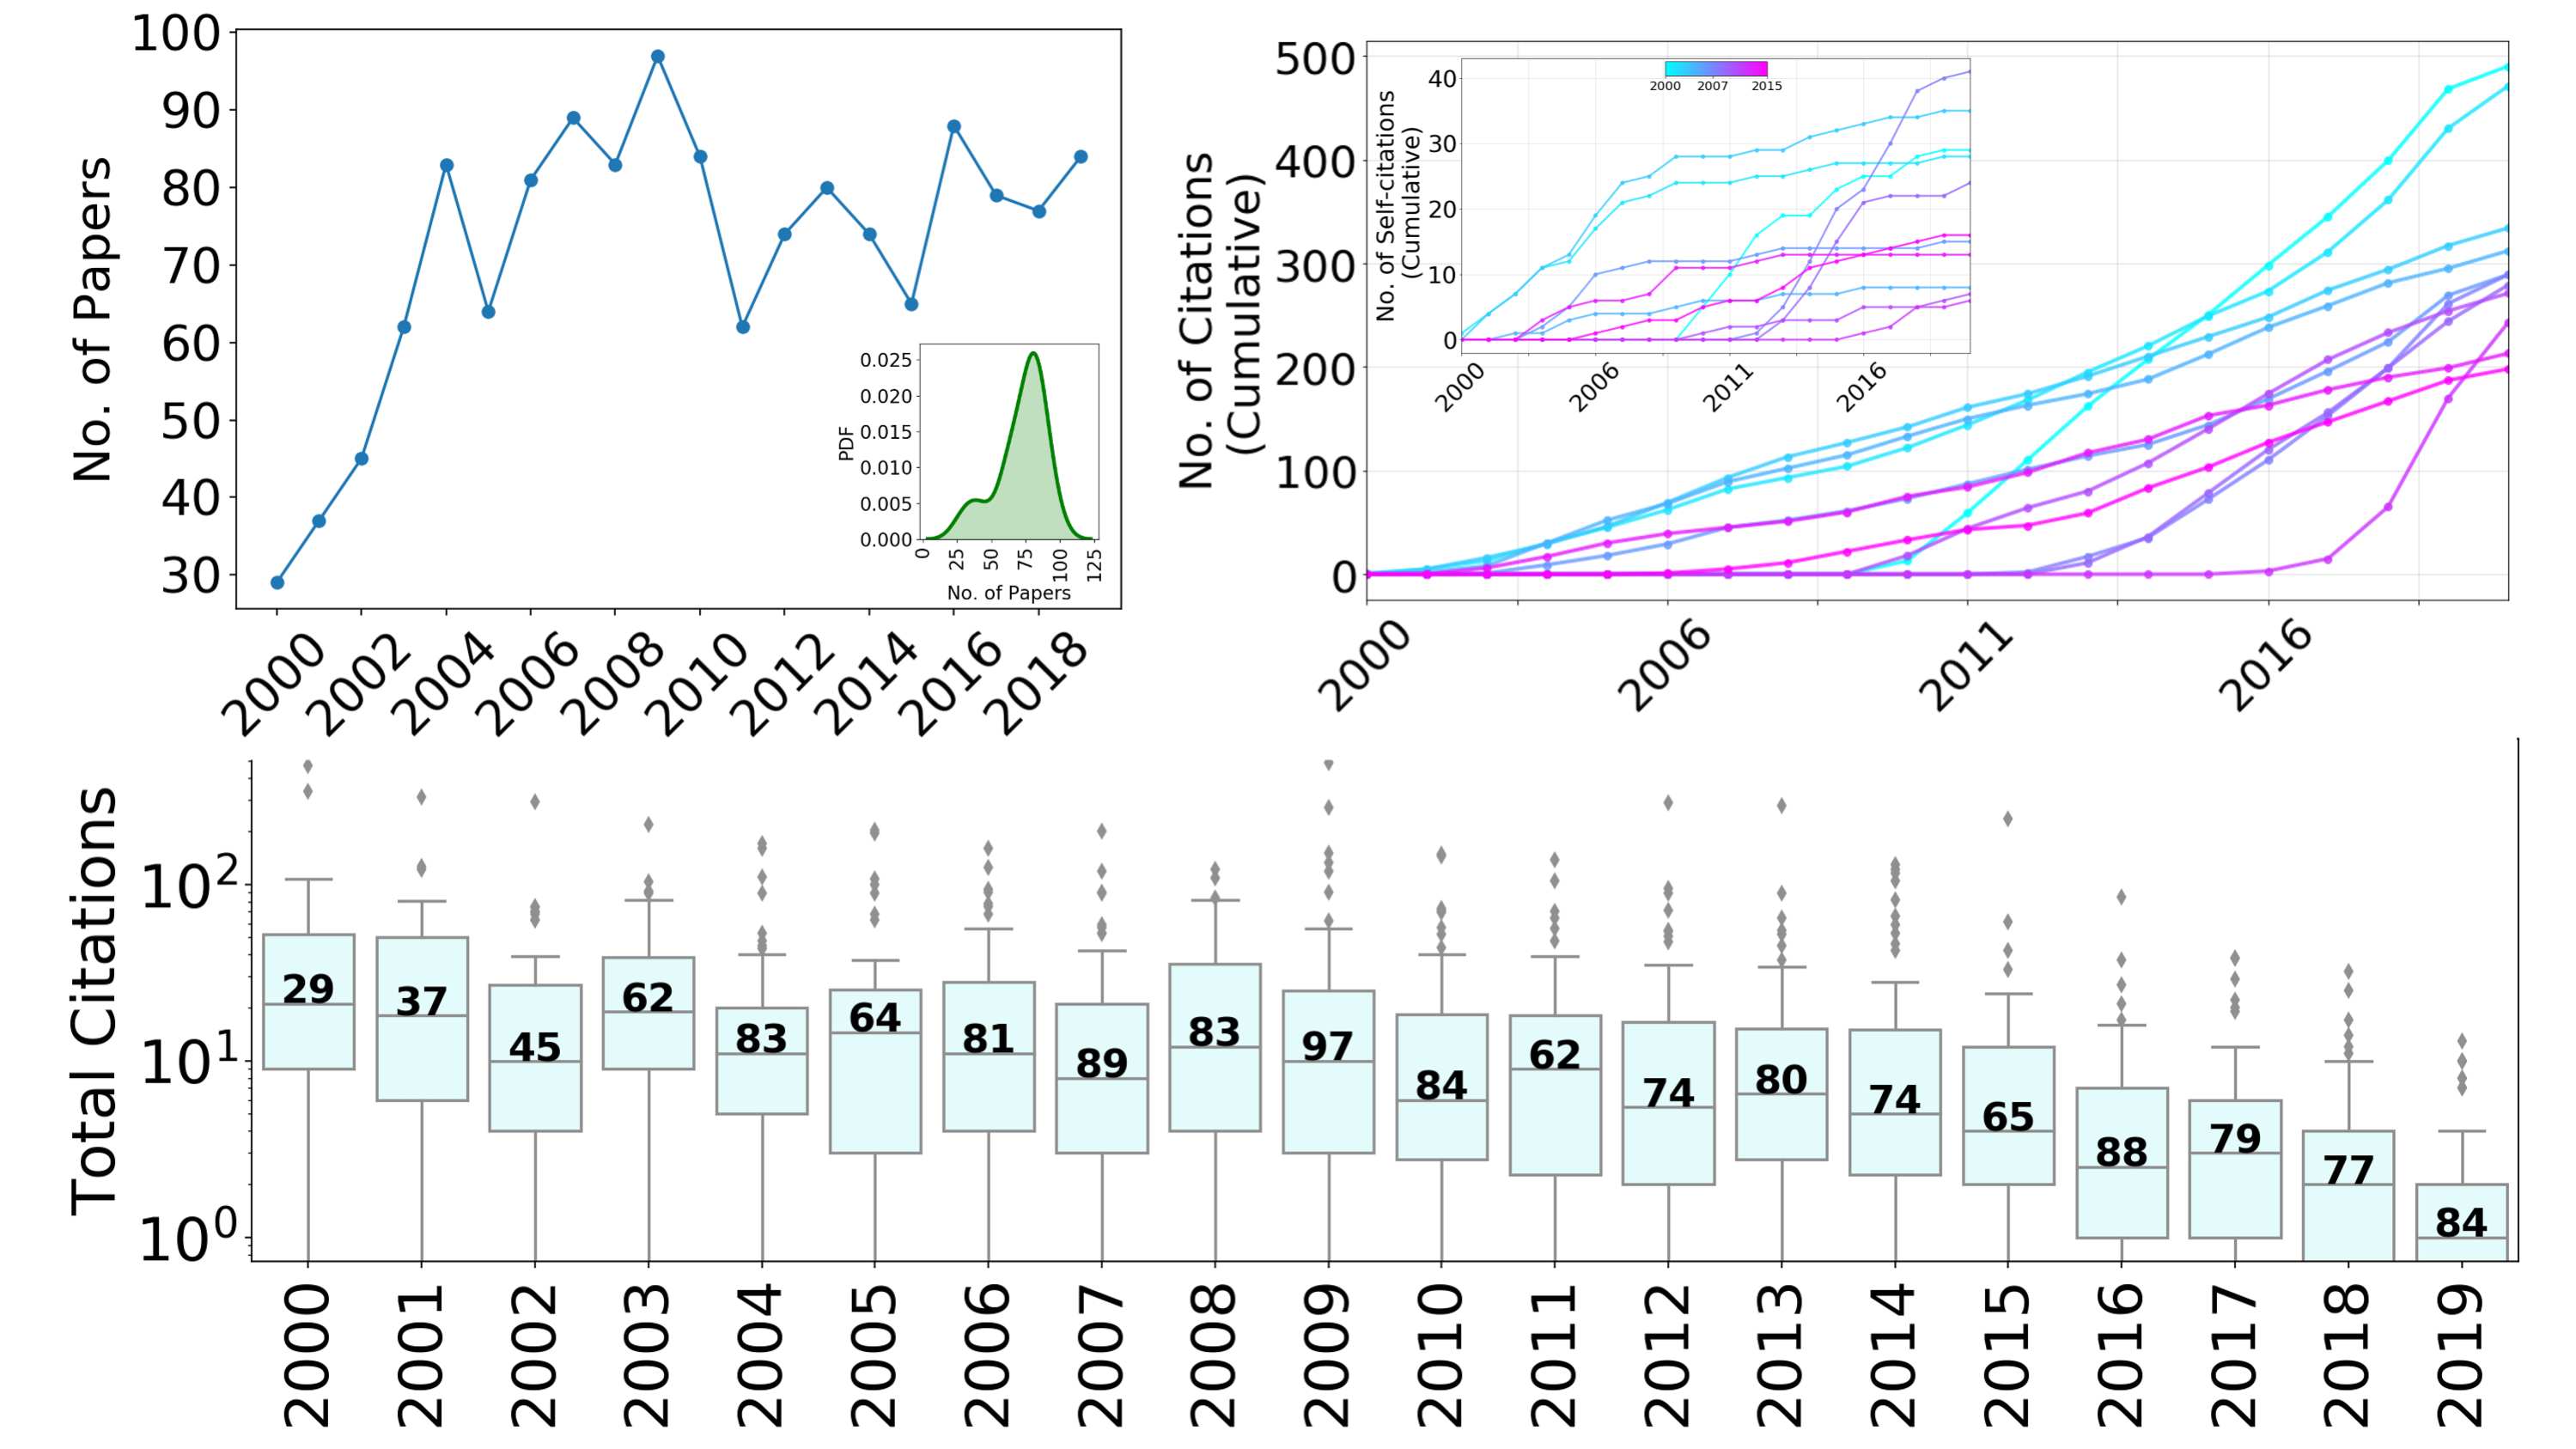
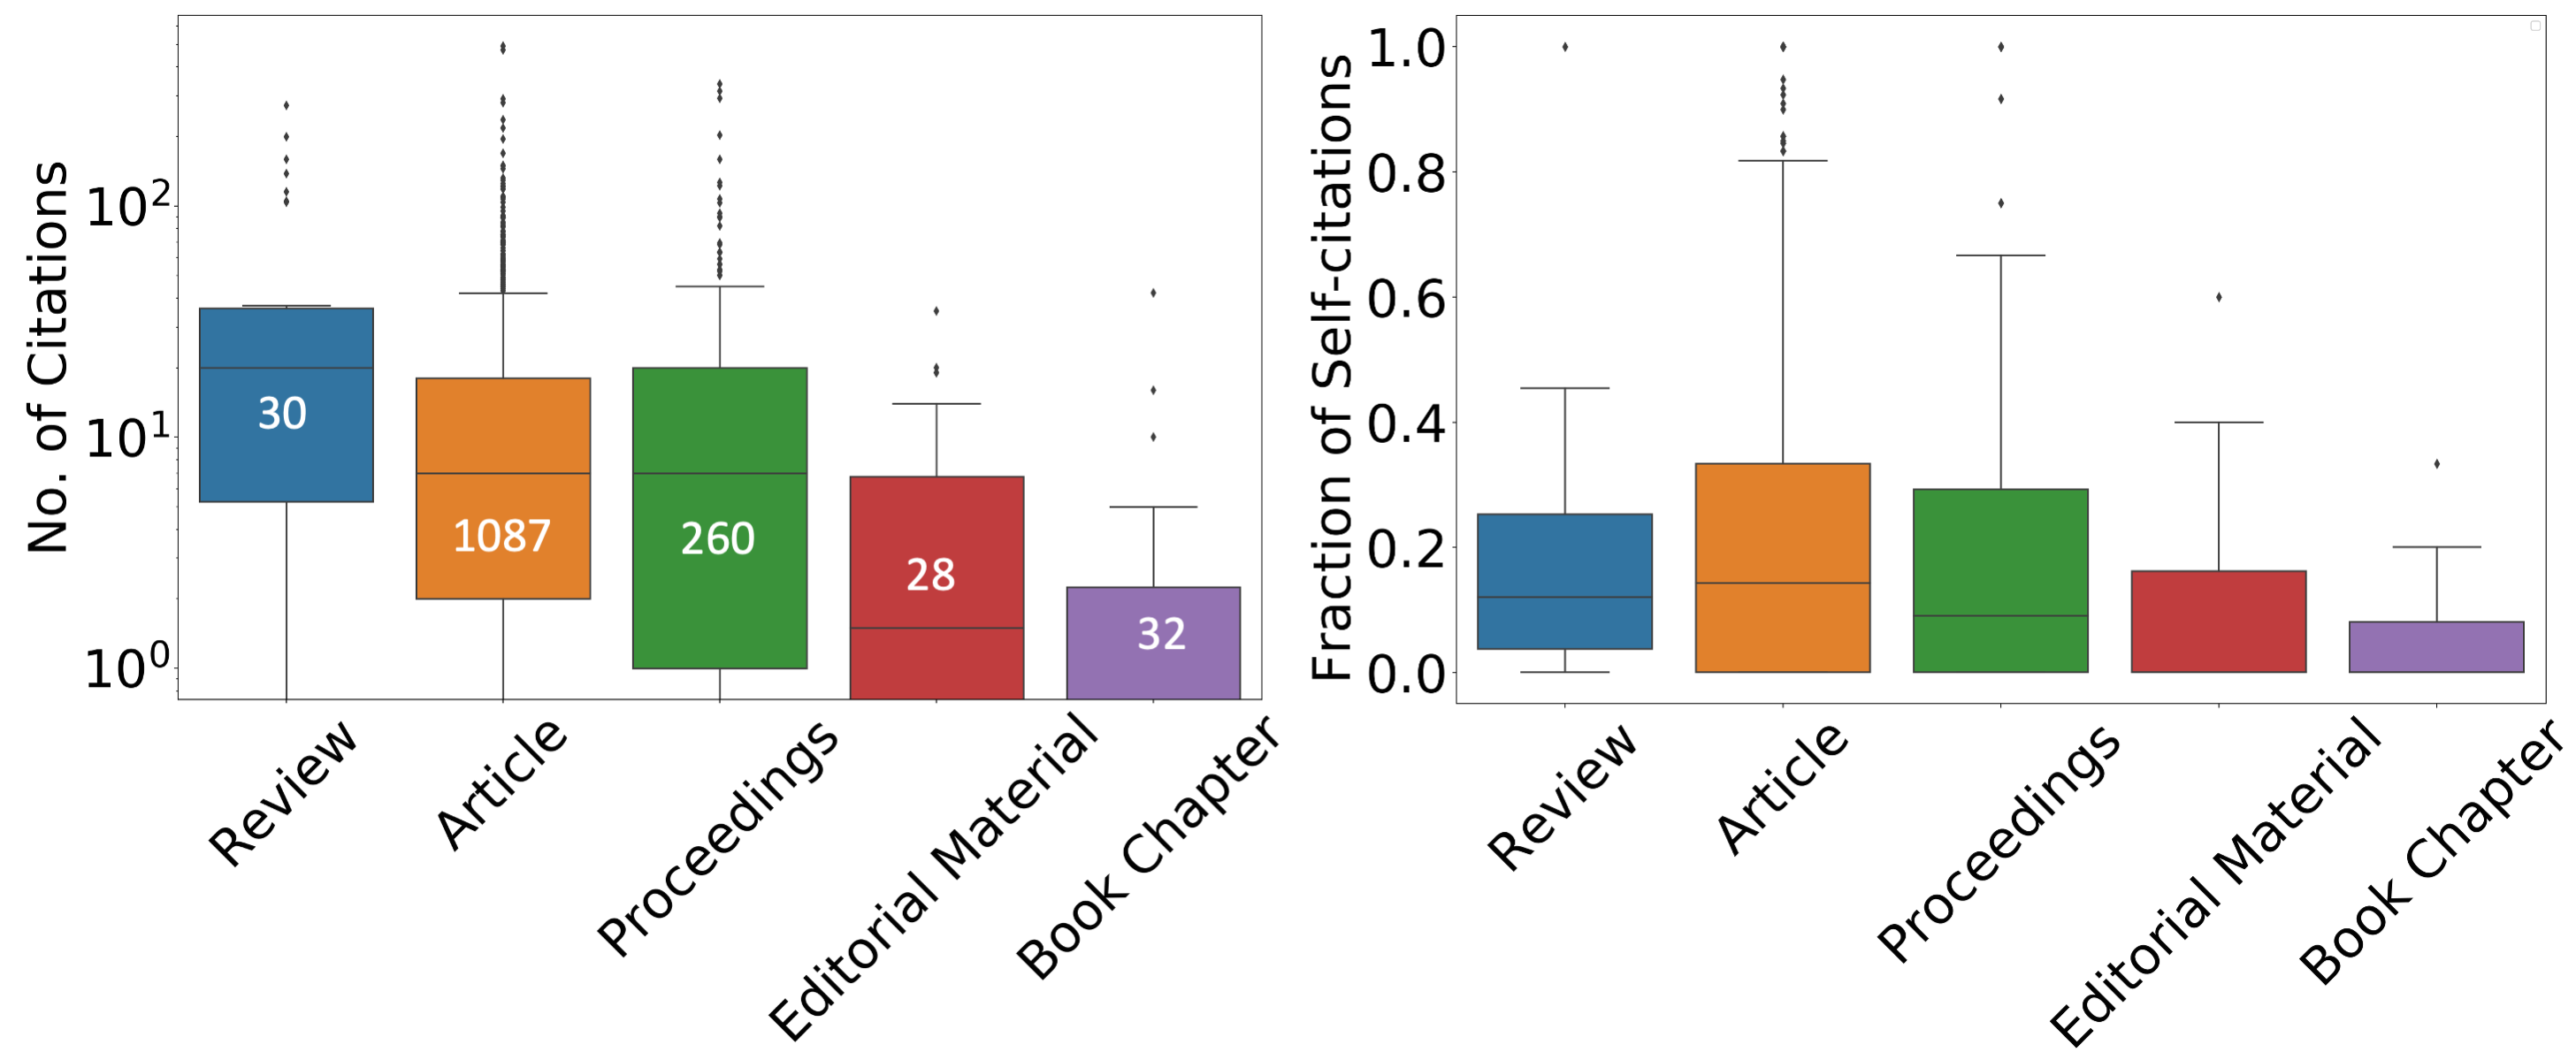
We have presented the characterization of number of publications, citations, self-citations, etc. in Fig.1. The number of papers published from 2000-2019 are reported in Fig.1(a). To show the growth of the citations and self-citations we randomly selected a few papers published from 2000-2015. The citations received by each paper over the years since its publication is plotted cumulatively in Fig.1(b). The color code depicts the publication year. The inset of the figure shows the growth of self-citations received by the same set of papers over years since its publication. Fig.1(c) represents the median number of citations received by all papers published over years. The numeric value inside the box plot represents the count for the total number of papers published in the respective year. The median number of citations received by papers published as Articles, Reviews, Book Chapter, etc. is shown in Fig.1(d) and corresponding median self-citations is shown in Fig.1(e). The numeric value inside the plot is the number of papers published. The bars are arranged according to the median number of citations rather than the number of publications. For example, papers published as Articles and Proceedings have received equal median number of citations; however, the number of publications as Articles are higher than Proceedings. On the other hand, Review papers are less published as compared to other document types but have received the highest median number of citations. The median self-citations received by Reviews and Articles are almost same.
(a)
(b)
(c)
 (d)
(e)
(d)
(e)
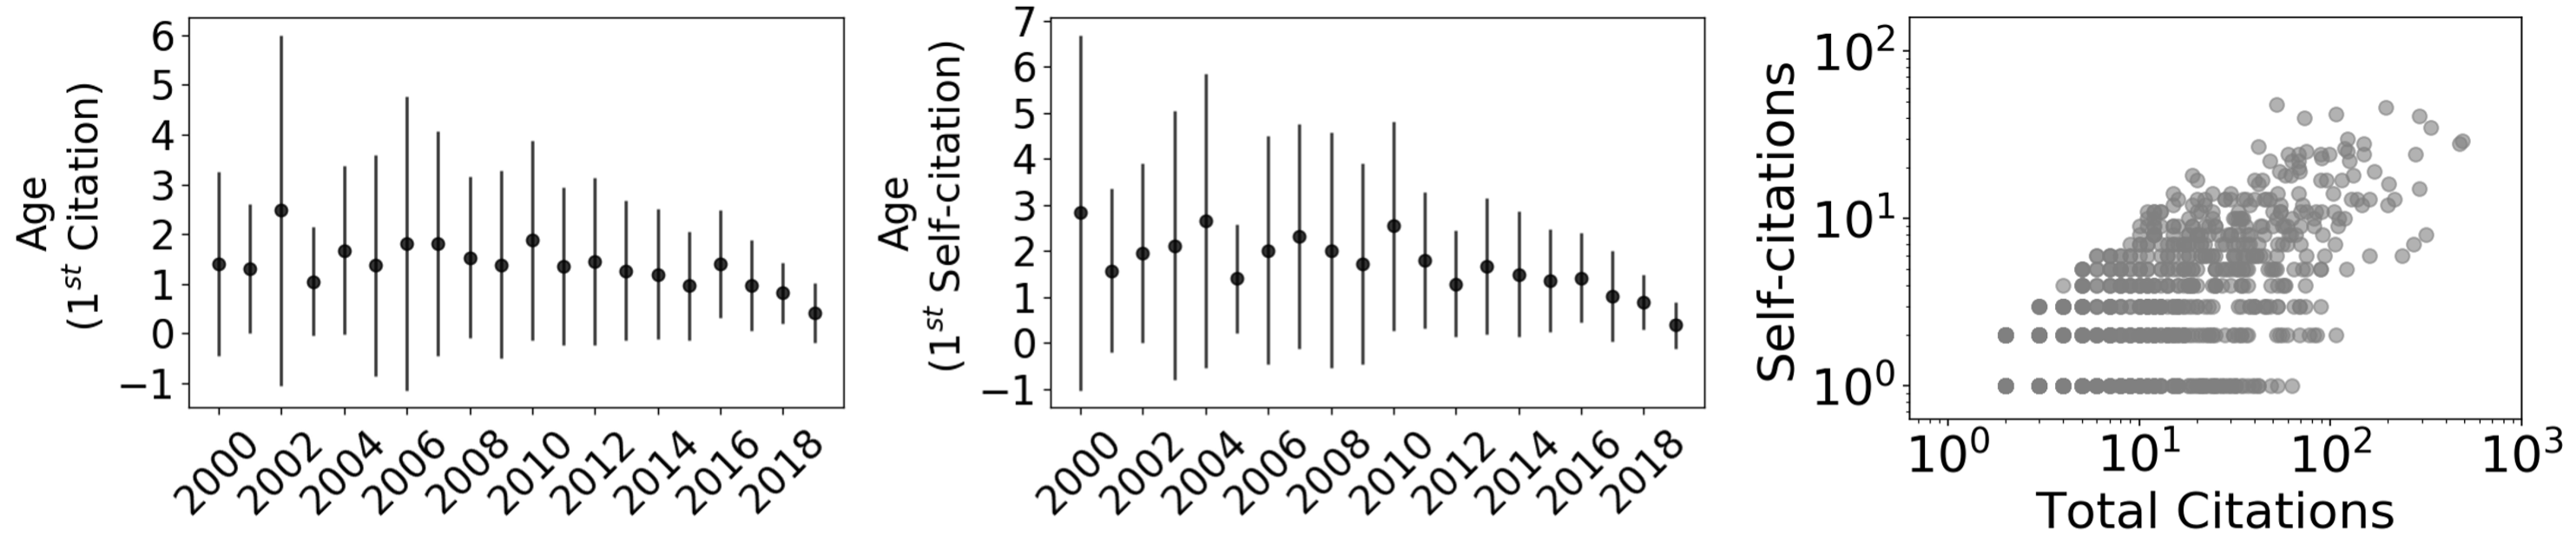
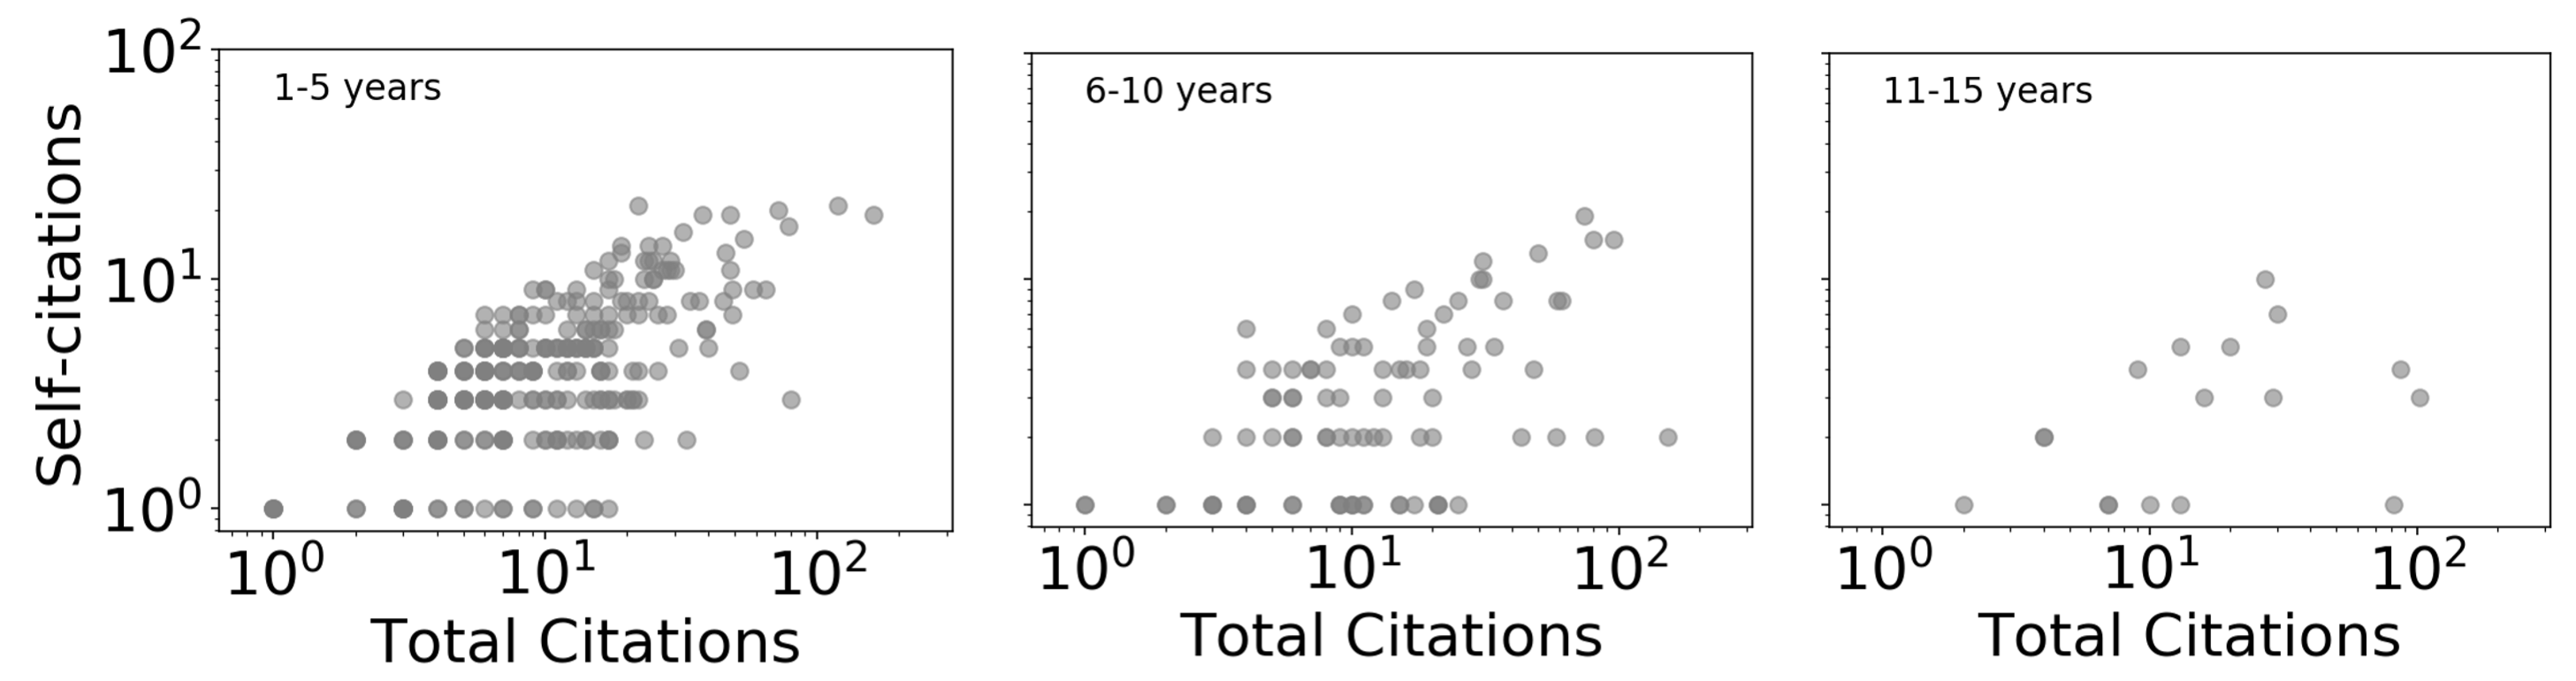
Fig.2 represents the dynamics of citations and self-citations over the years. Fig.2(a) shows the average age of a paper when it has received the first citation which is not a self-citation during 2000-2019. Similarly, the average age of a paper when it has received first self-citation is shown in Fig.2(b). On an average, the paper receives first citation and self-citation within the first two years after its publication. Fig.2(c) shows the overall citations and self-citations received by papers from 2000-2019. Higher the number of citations, the higher the self-citations. During the first five years of a publication, the count of self-citations has increased with the increase of citations as shown in Fig.2(d) (Fowler and Aksnes, 2007). This shows that during the initial year’s authors tend to cite their papers quite often to maintain the visibility of the papers. This association decreases with the increase of the time interval (Fig.2(e-f)).
(a)
(b)
(c)
 (d)
(e)
(f)
(d)
(e)
(f)
3.1.1 Referencing disciplines in the papers
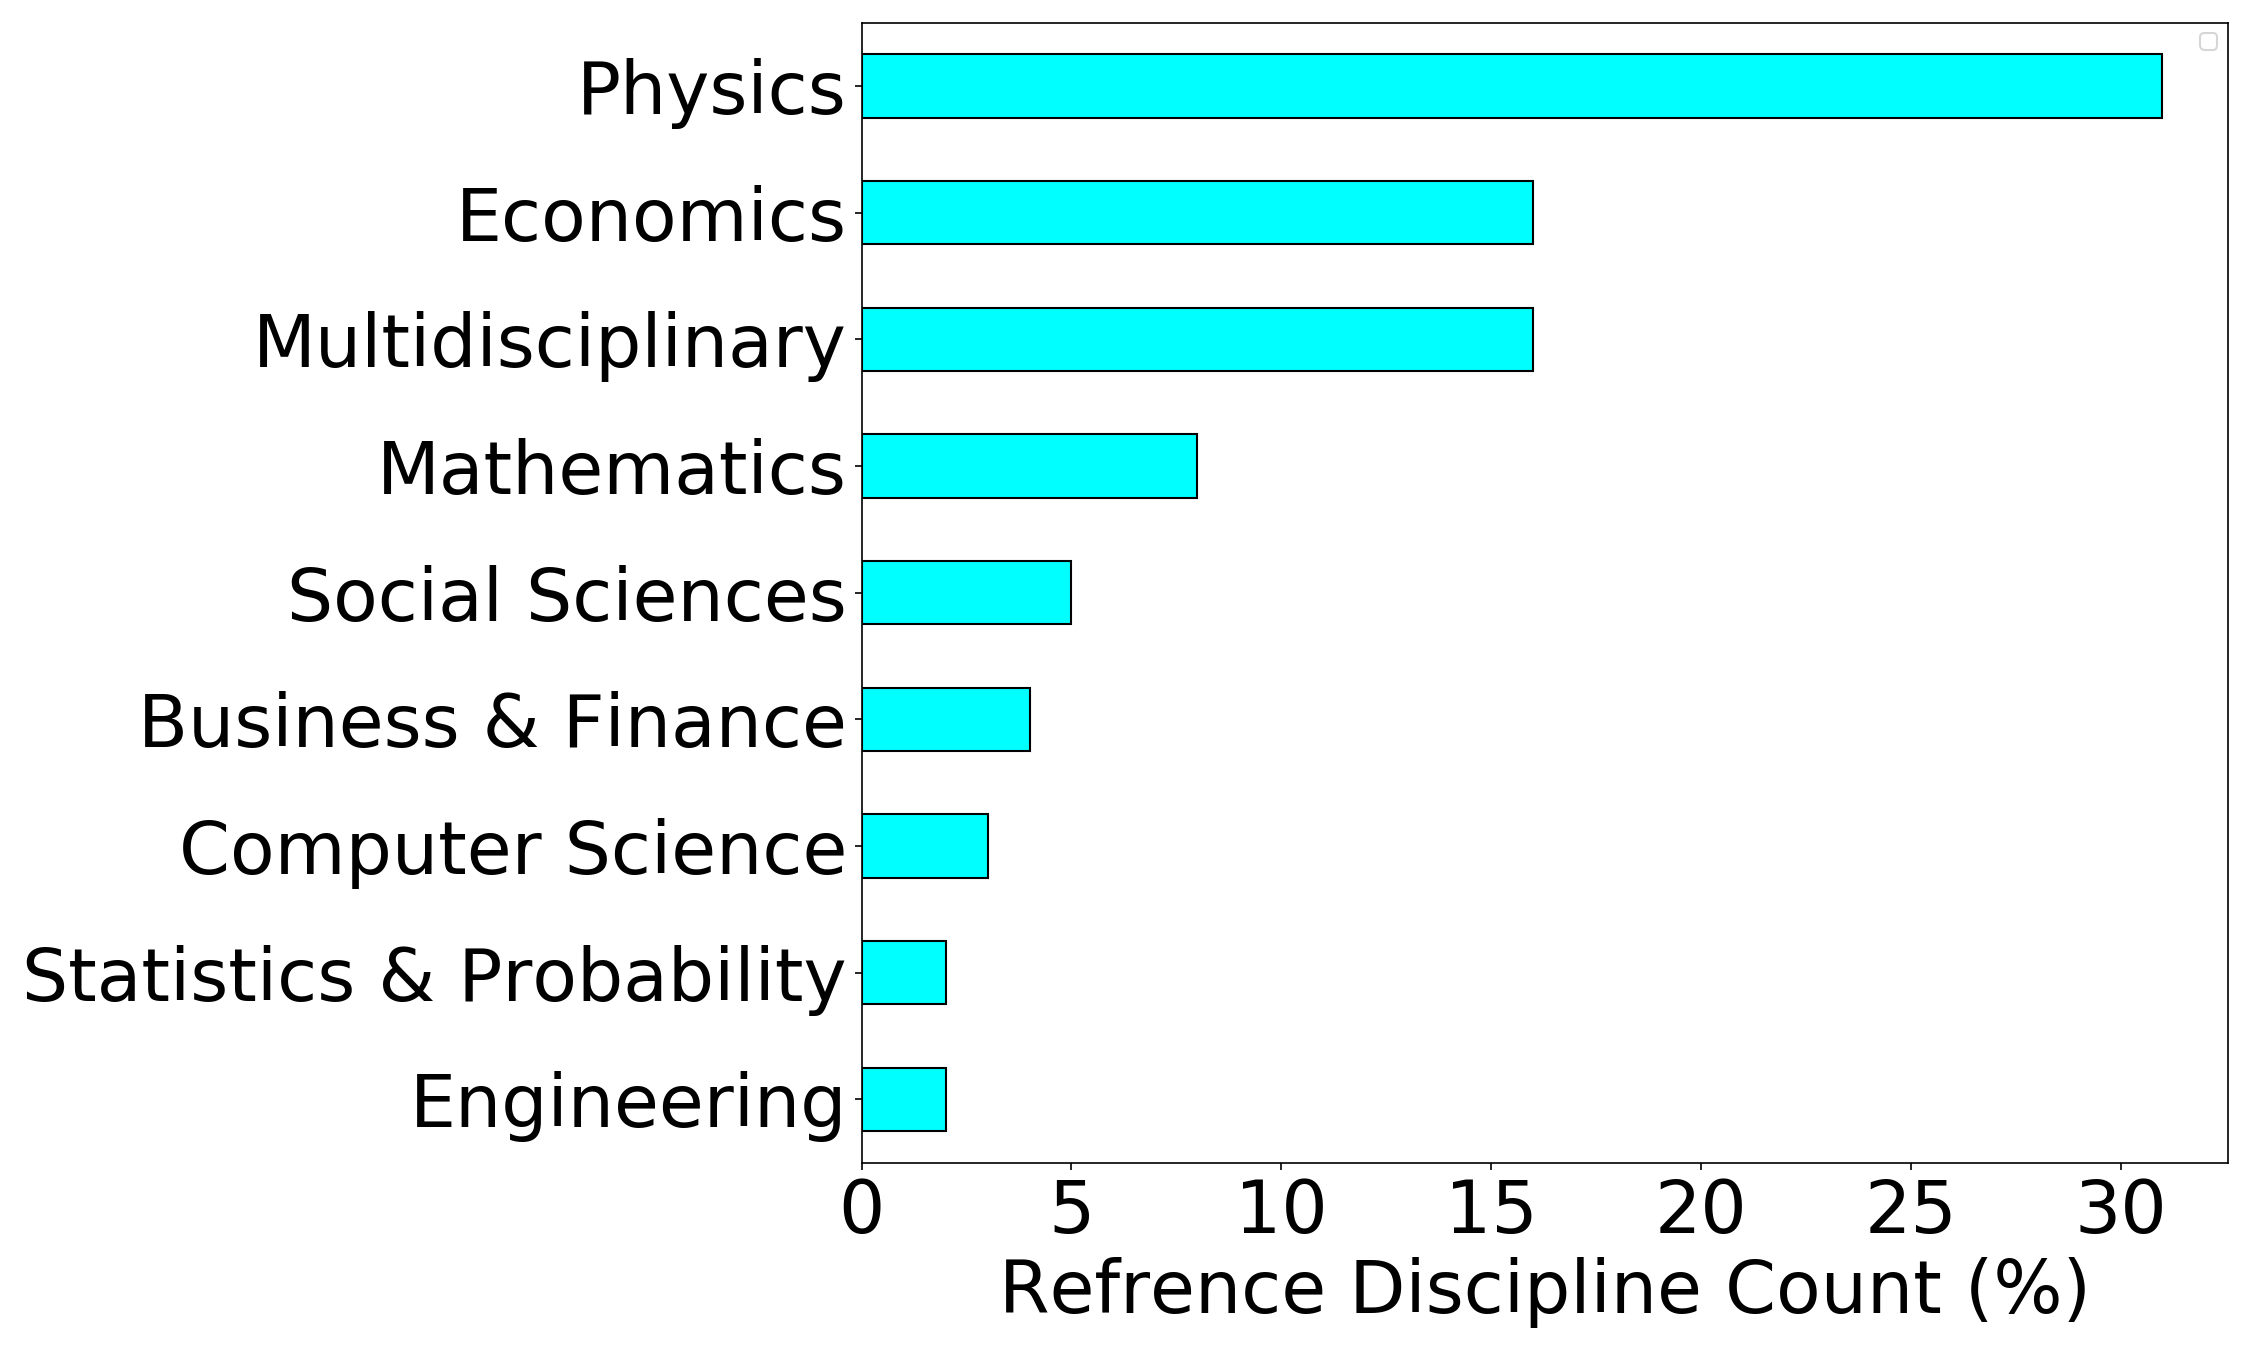
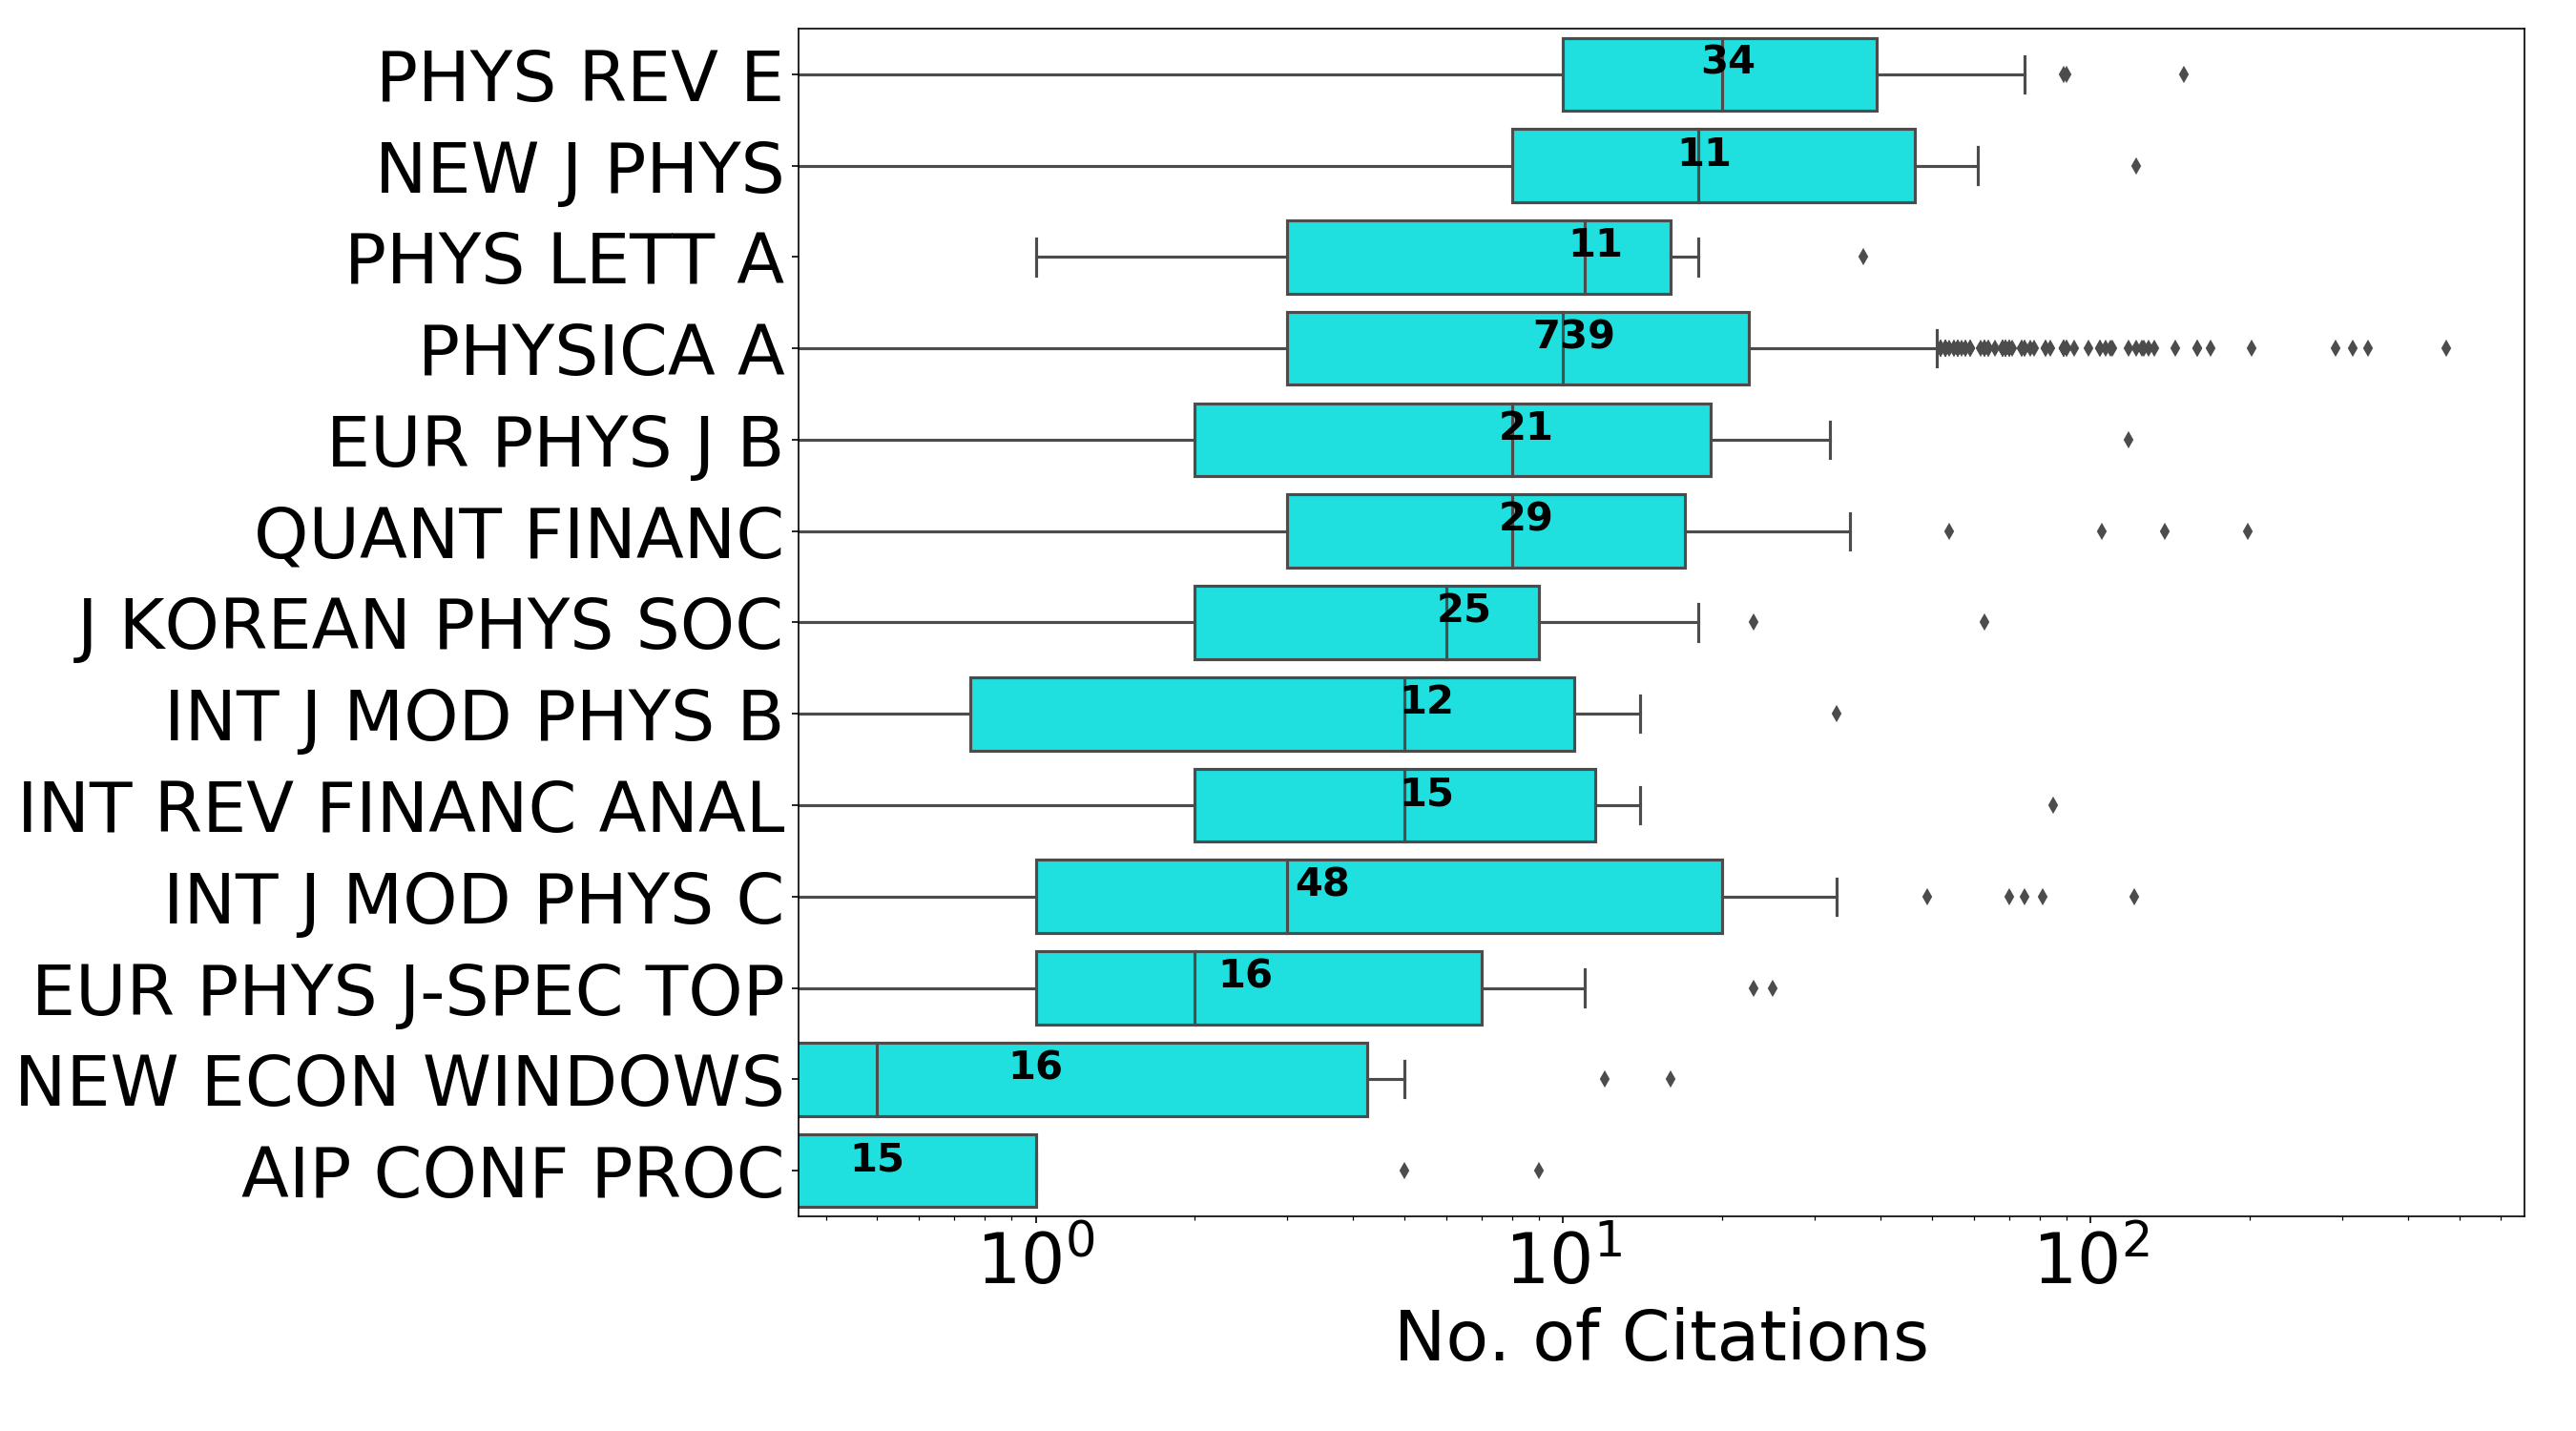
To understand which disciplines have contributed more to the growth of Econophysics, we analyzed the references cited by each paper. We retrieved the disciplines of all the cited references and analyzed the contribution of disciplines. Fig.3(a) highlights the disciplines according to the number of cited references (in ). It is evident that major references were quoted from Physics followed by Economics which clearly represents the true nature of Econophysics. The proportion of physics references also revealed the major contribution of physicists’ in the field. Fig.3(b) highlights the journals based on the median number of citations received by the papers. The bars are arranged according to the median of citations rather than the number of citations. Physica A has published more papers (739) than Physics Review E (34); however, Physics Review E has received higher the median number of citations (20) than Physica A (10). The first few journals are also physics-based journals where papers have gained higher citations.
(a)
 (b)
(b)
3.2 Collaboration network
Here we presented the scientific collaborations at micro, meso, and macro-level.
3.2.1 Micro-level analysis: Author’s collaboration network
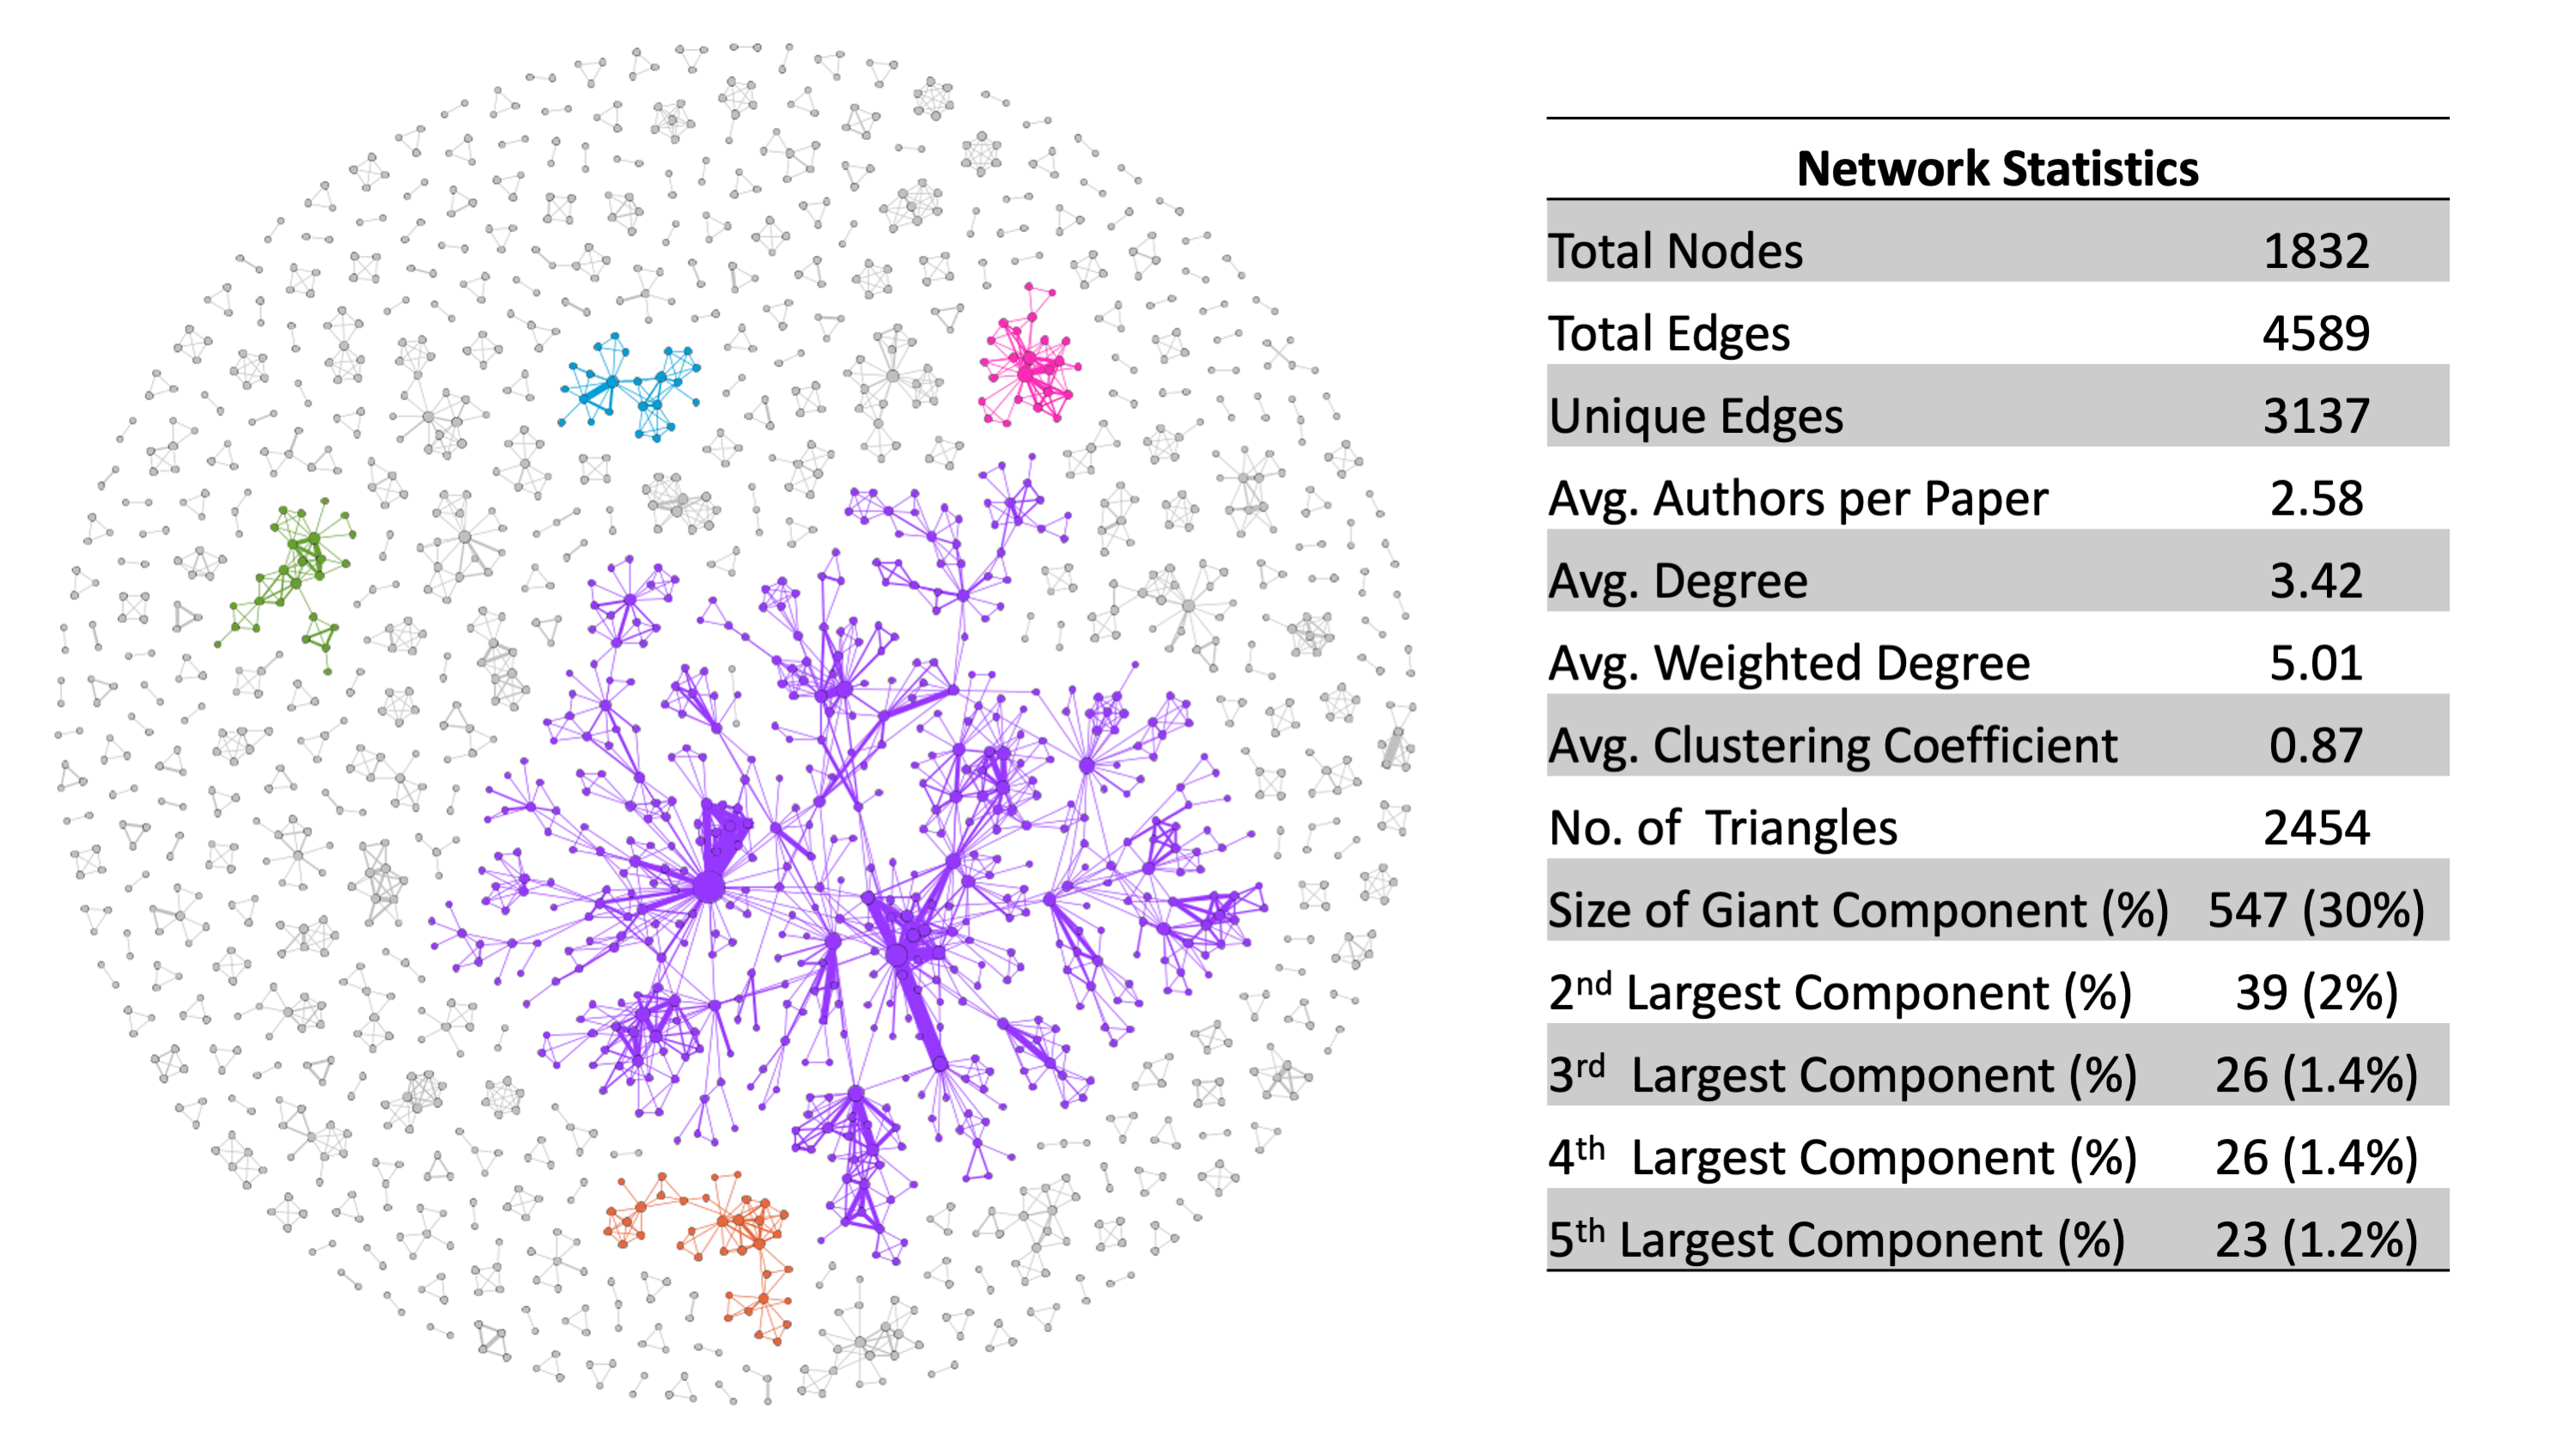
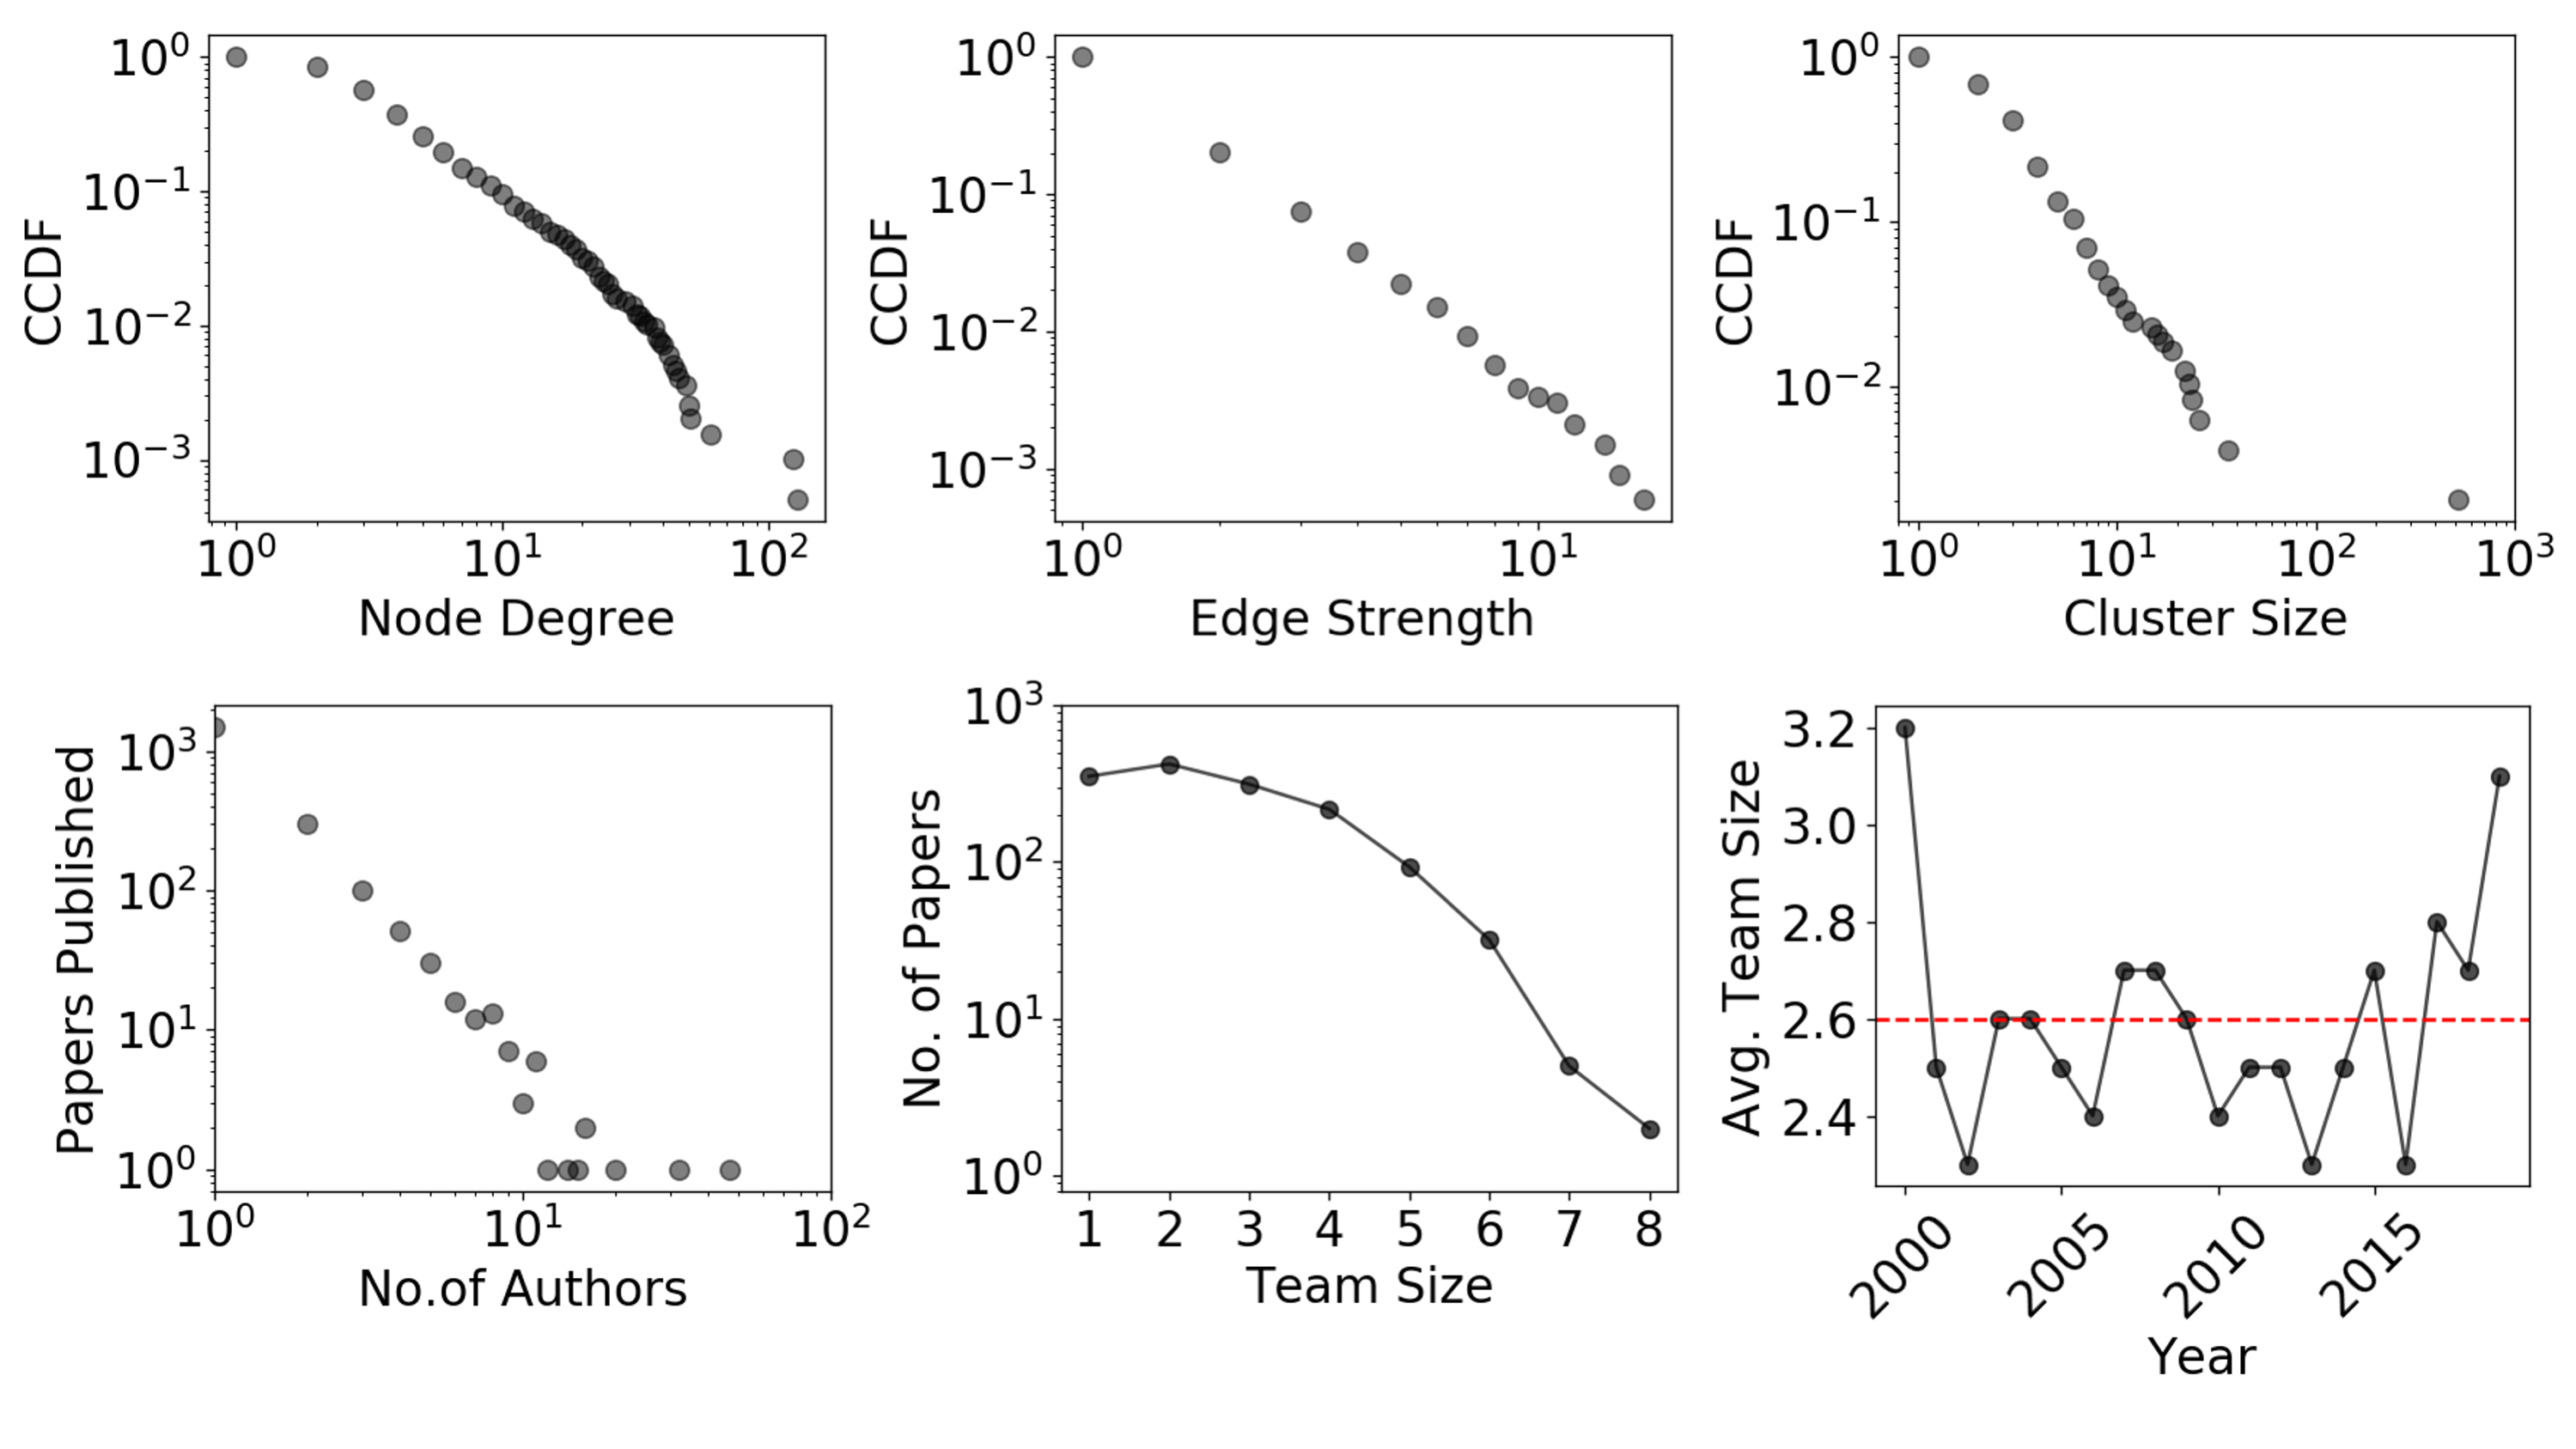
In the co-authorship network (Fan et al., 2004), we have constructed an undirected weighted network consists of 1834 nodes and 4590 edges (3137 unique edges) as shown in Fig.4(a), where nodes correspond to authors and edges represent the collaboration (when two or more authors write a paper together). Single-authored articles are excluded from the data set since they do not contribute to the co-authorship network. The first five largest connected components of the network are colored differently. The giant component (colored in purple) contains the of the total nodes of the network. The giant component is further elaborated in Fig.5. The second-largest component (colored in green) contains nodes, and so on (see network statistics table in Fig.4). It is often perceived that certain authors are actively engaged in collaboration than others. Fig.4(b-c) shows the complementary cumulative density function (CCDF) of the degree of the nodes and edges strength which represents the author’s collaborations and the strength of the collaboration. The power-law behavior of CCDF shows that there are few authors who share a large number of collaborations. The CCDF’s of the cluster size or connected components are shown in Fig.4(d). The power-law behavior of the cluster size distribution clearly shows that only one component contains a large number of nodes. In the network, of nodes have clustering coefficient 1, and have 0. The highest clustering coefficient represents how well the nodes are connected to their neighbors. The highest average clustering coefficient (0.87) shows that almost everyone is connected to others in the network. Fig.4(e) shows the relation between the number of authors and the number of papers published by them. A few authors have published more than 10 papers, whereas a large number of authors have published less than 10 papers. Also, how big is the team size of authors is studied in Fig.4(f). The majority of the papers are either published as a single author or two authors. There are few papers that have been written by 7 to 8 authors which is also the largest team size. Fig.4(g) shows the evolution of team size in scientific collaborations (Guimera et al., 2005). Over the years the team size fluctuates from an average of 2 to an average of 3.
(a)
 (b)
(c)
(d)
(e)
(f)
(g)
(b)
(c)
(d)
(e)
(f)
(g)
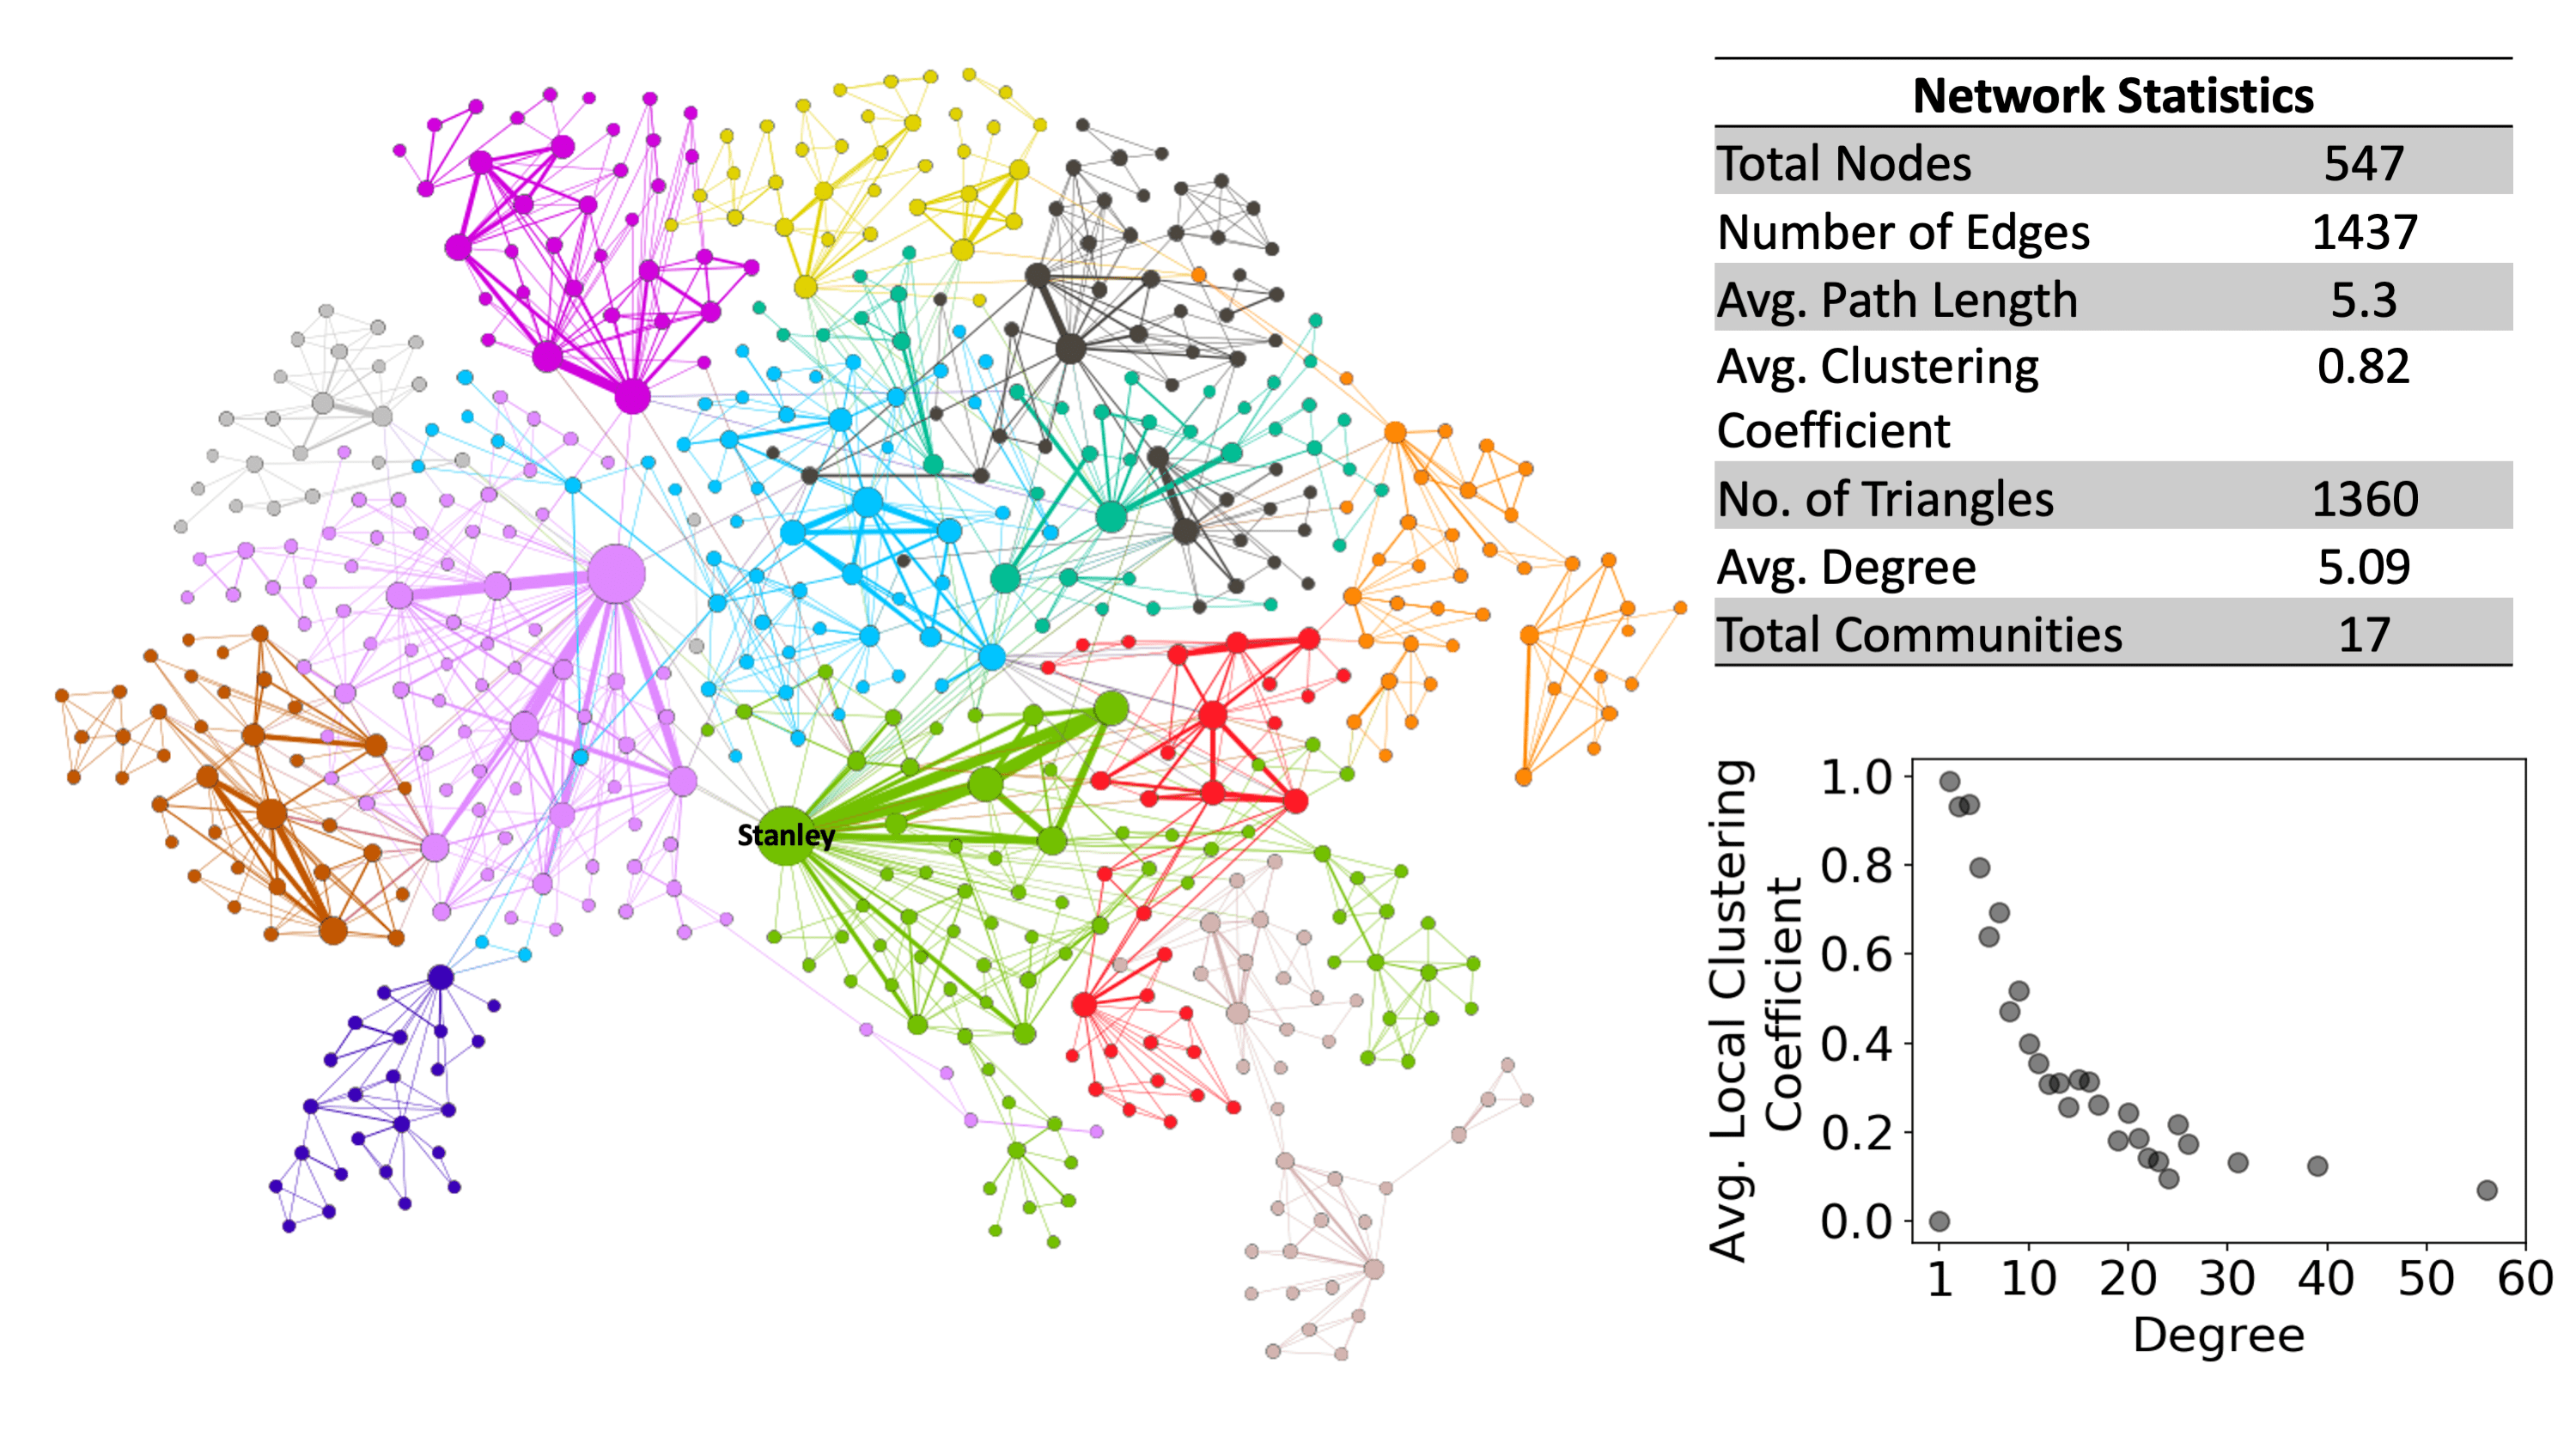
3.2.2 Giant component
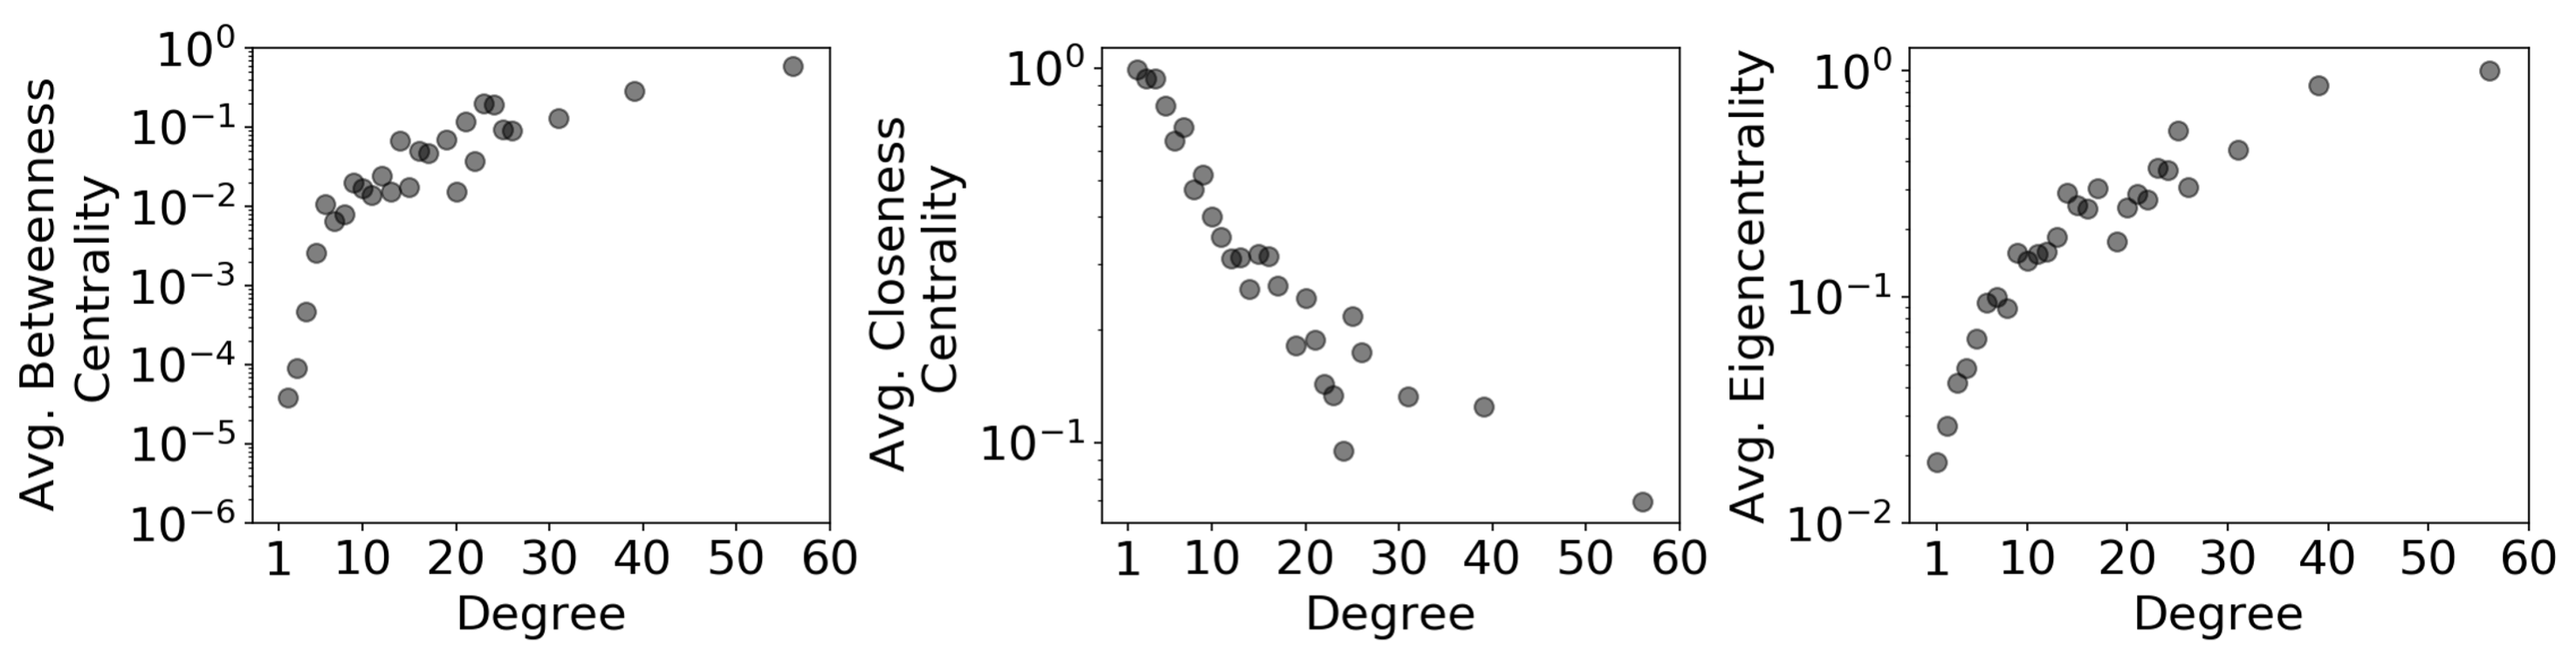
Fig.5(a) shows the zoomed-in view of the giant component of the co-authorship network extracted from Fig.4(a). A modularity maximization algorithm is used to find out the communities inside the giant component (Chen et al., 2014). Different colors represent different communities in the giant network. There is a total of 17 communities in the network and the node with the highest number of connections is labeled with the author’s name. Also, the average path length of the network is 5.3 which reveals the “small-world” property of the network (Watts and Strogatz, 1998). In the community of econophysicists’, everyone is connected to others in 5 steps. The relationship between nodes degree and local clustering coefficient is shown in Fig.5(b)). On an average, nodes of higher degree exhibit lower local clustering. A list of top 50 authors based on the degree (collaboration) is shown in Table1. Fig.5(c-e) represents the relationship among nodes degree and the centrality measures: betweenness, closeness, and eigencentrality. On an average, nodes of higher degree exhibit higher betweenness and eigencentrality but lower closeness centrality. Nodes with higher betweenness centrality represent the potential key authors in the network, whereas nodes with higher degree represent hubs in the network. It highlights that the nodes with the highest degree act as the bridge to compute the shortest-path among all nodes in the network. Also, the largest value of eigencentrality represents the prestige/influence of the node in the network.
(a)
(b)
 (c)
(d)
(e)
(c)
(d)
(e)
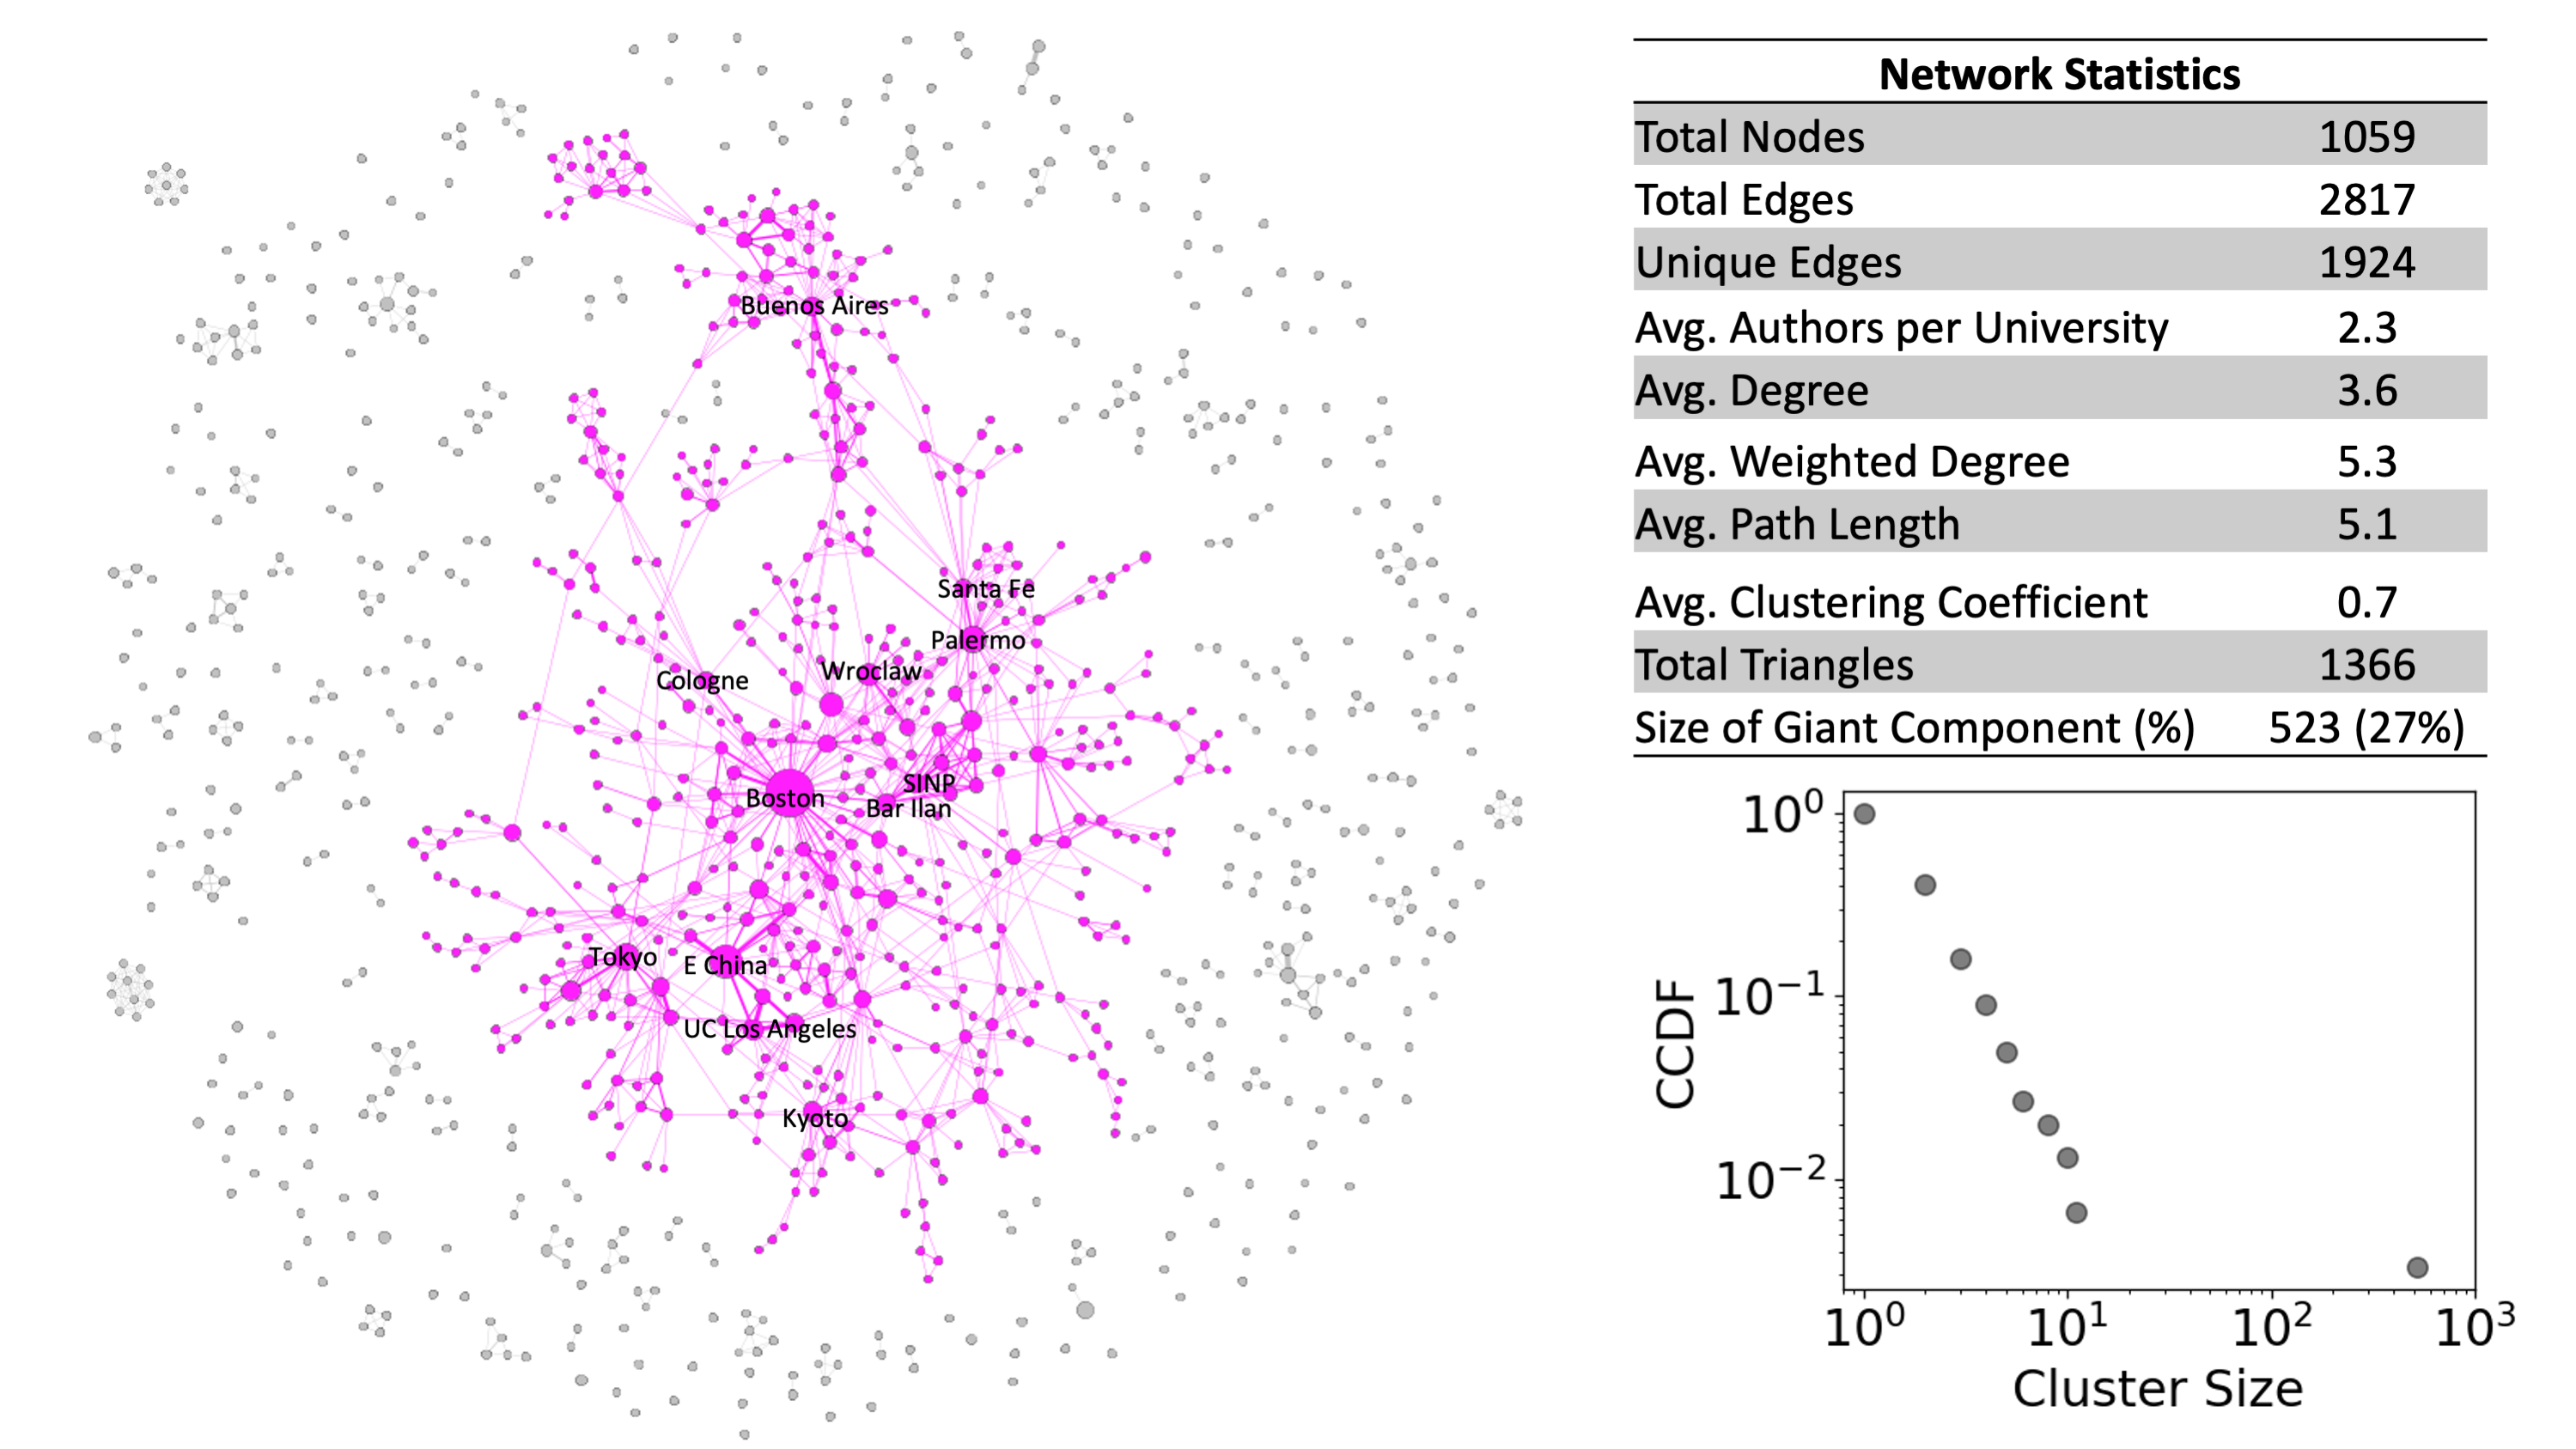
3.2.3 Meso-level analysis: Authors’ affiliations network
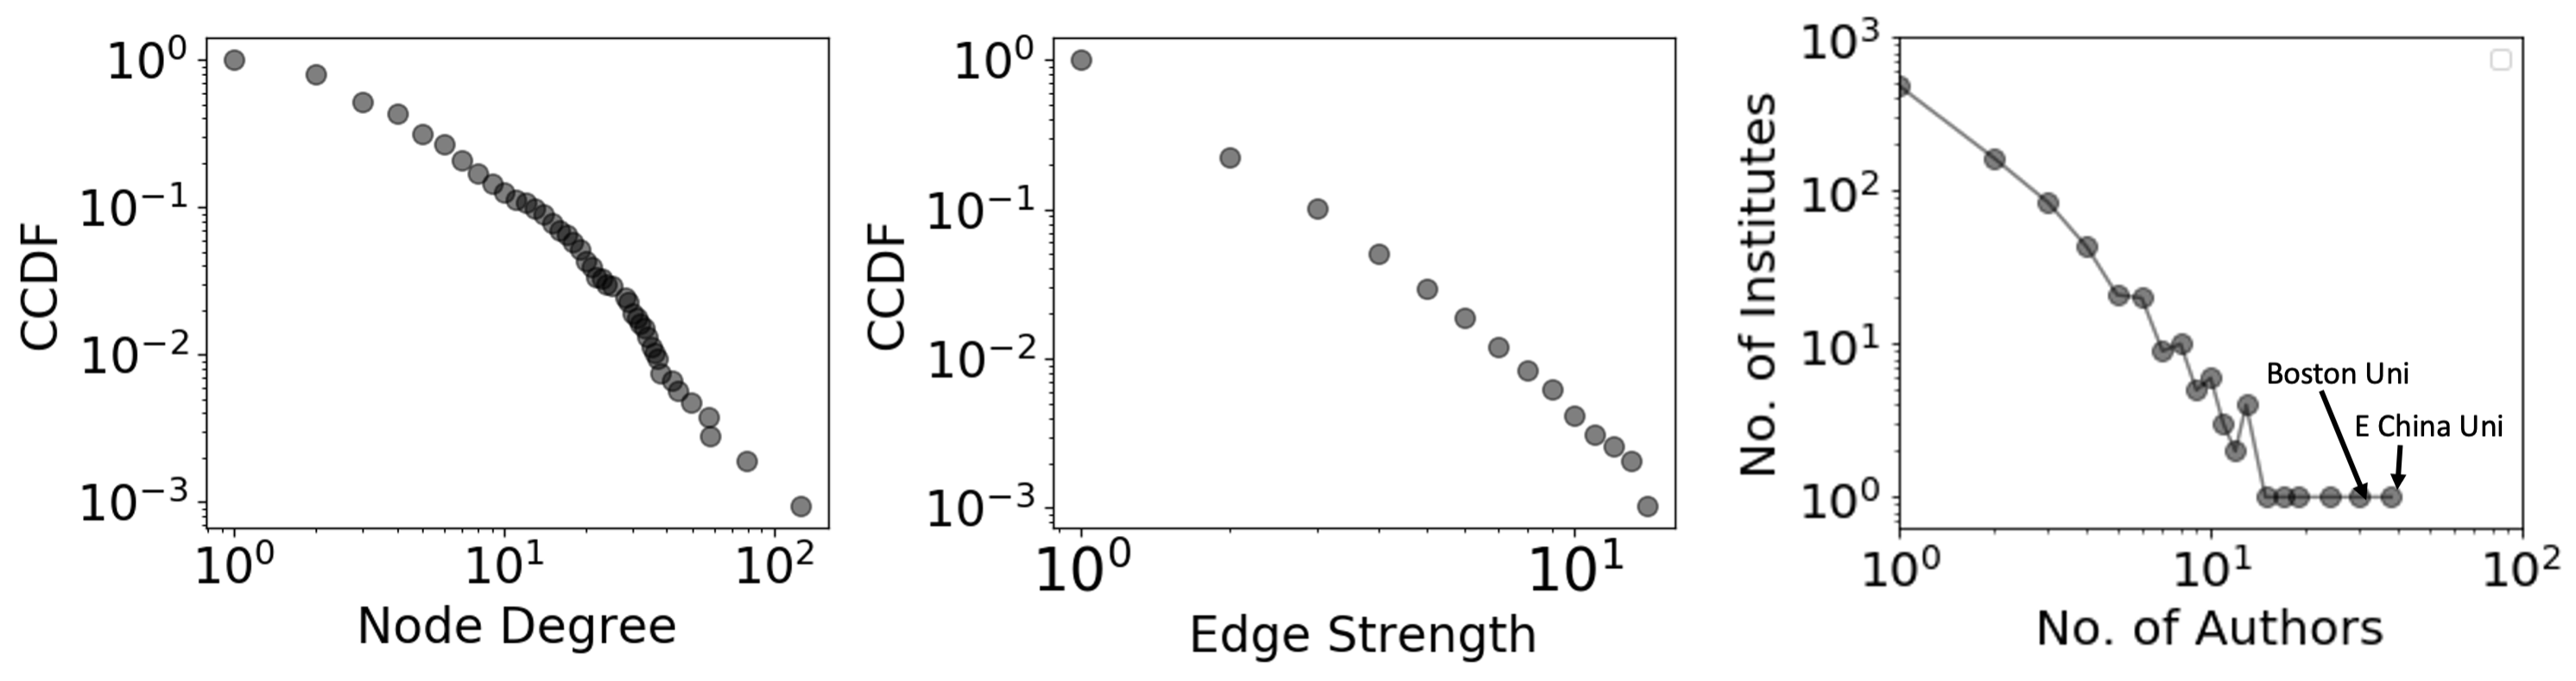
After the institutionalization of Econophysics in 1995, many reputed institutes have initialized research on it and some institutes have started courses on it (Dash, 2015; Ortega and Aguillo, 2013). To investigate the contribution of different institutions, an undirected weighted authors’ affiliations (institutions) network is constructed (see Fig.6 (a)). The network consists of 1059 institutions/universities and shows 2817 possible collaborations between institutions across the globe. Self-loops are removed while plotting the network, however, included in the analysis. The giant component (colored in dark pink) contains of the network nodes shown in Fig.6(b) as CCDF of cluster size. Fig.6(c-d)) show the CCDF’s of nodes degree and edges strength, respectively. Fig.6 (e) shows the number of authors corresponding to the number of institutions working on Econophysics. A large number of authors belong to a few institutions. The top two institutions in terms of the number of authors and collaborations are East China University of Science and Technology (ECUST) and Boston University. ECUST produces a large number of authors, whereas Boston University shares a large number of collaborations (see Table 2 for institutions details).
(a)
(b)
 (c)
(d)
(e)
(c)
(d)
(e)
3.2.4 Macro-level analysis: Countries’ collaborations network
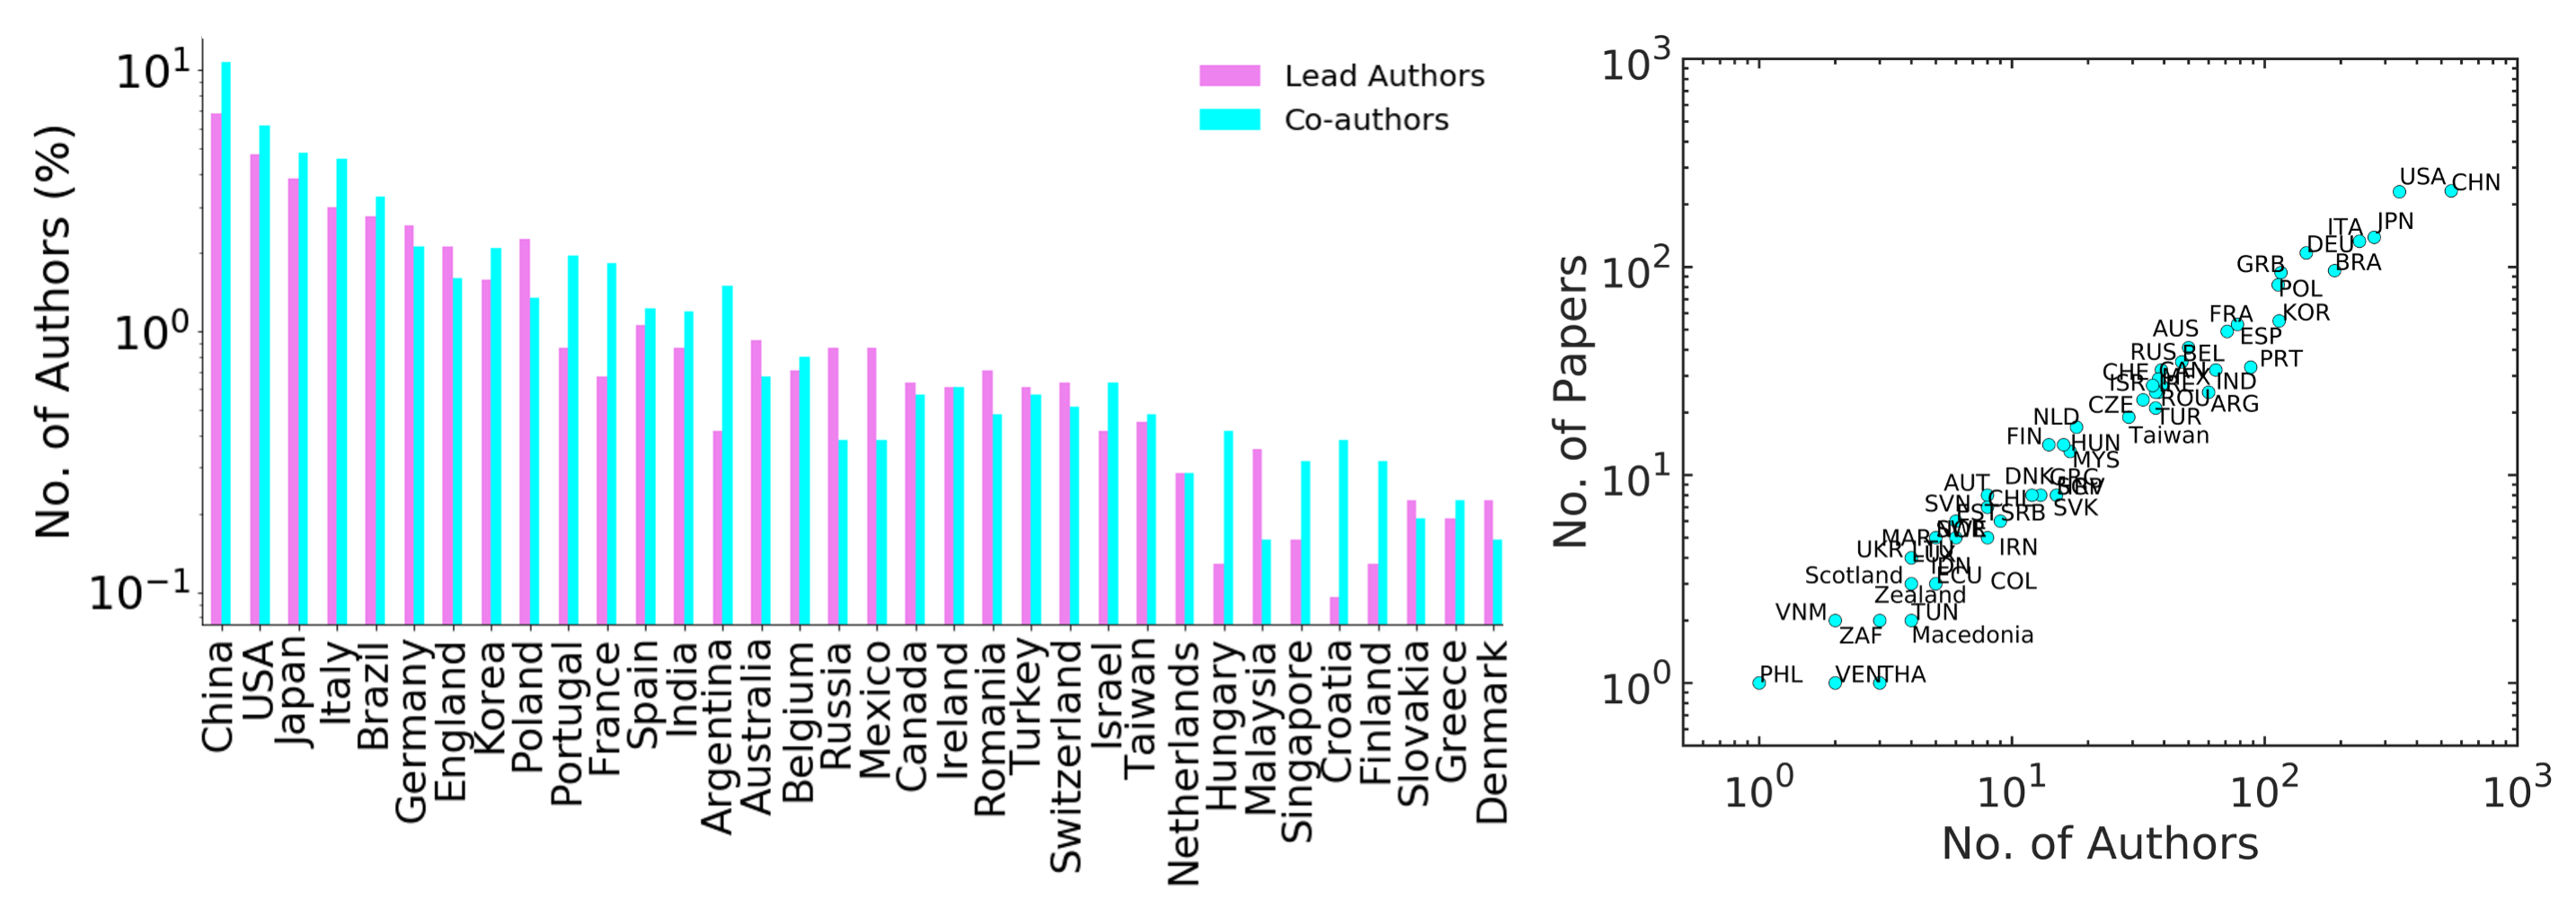
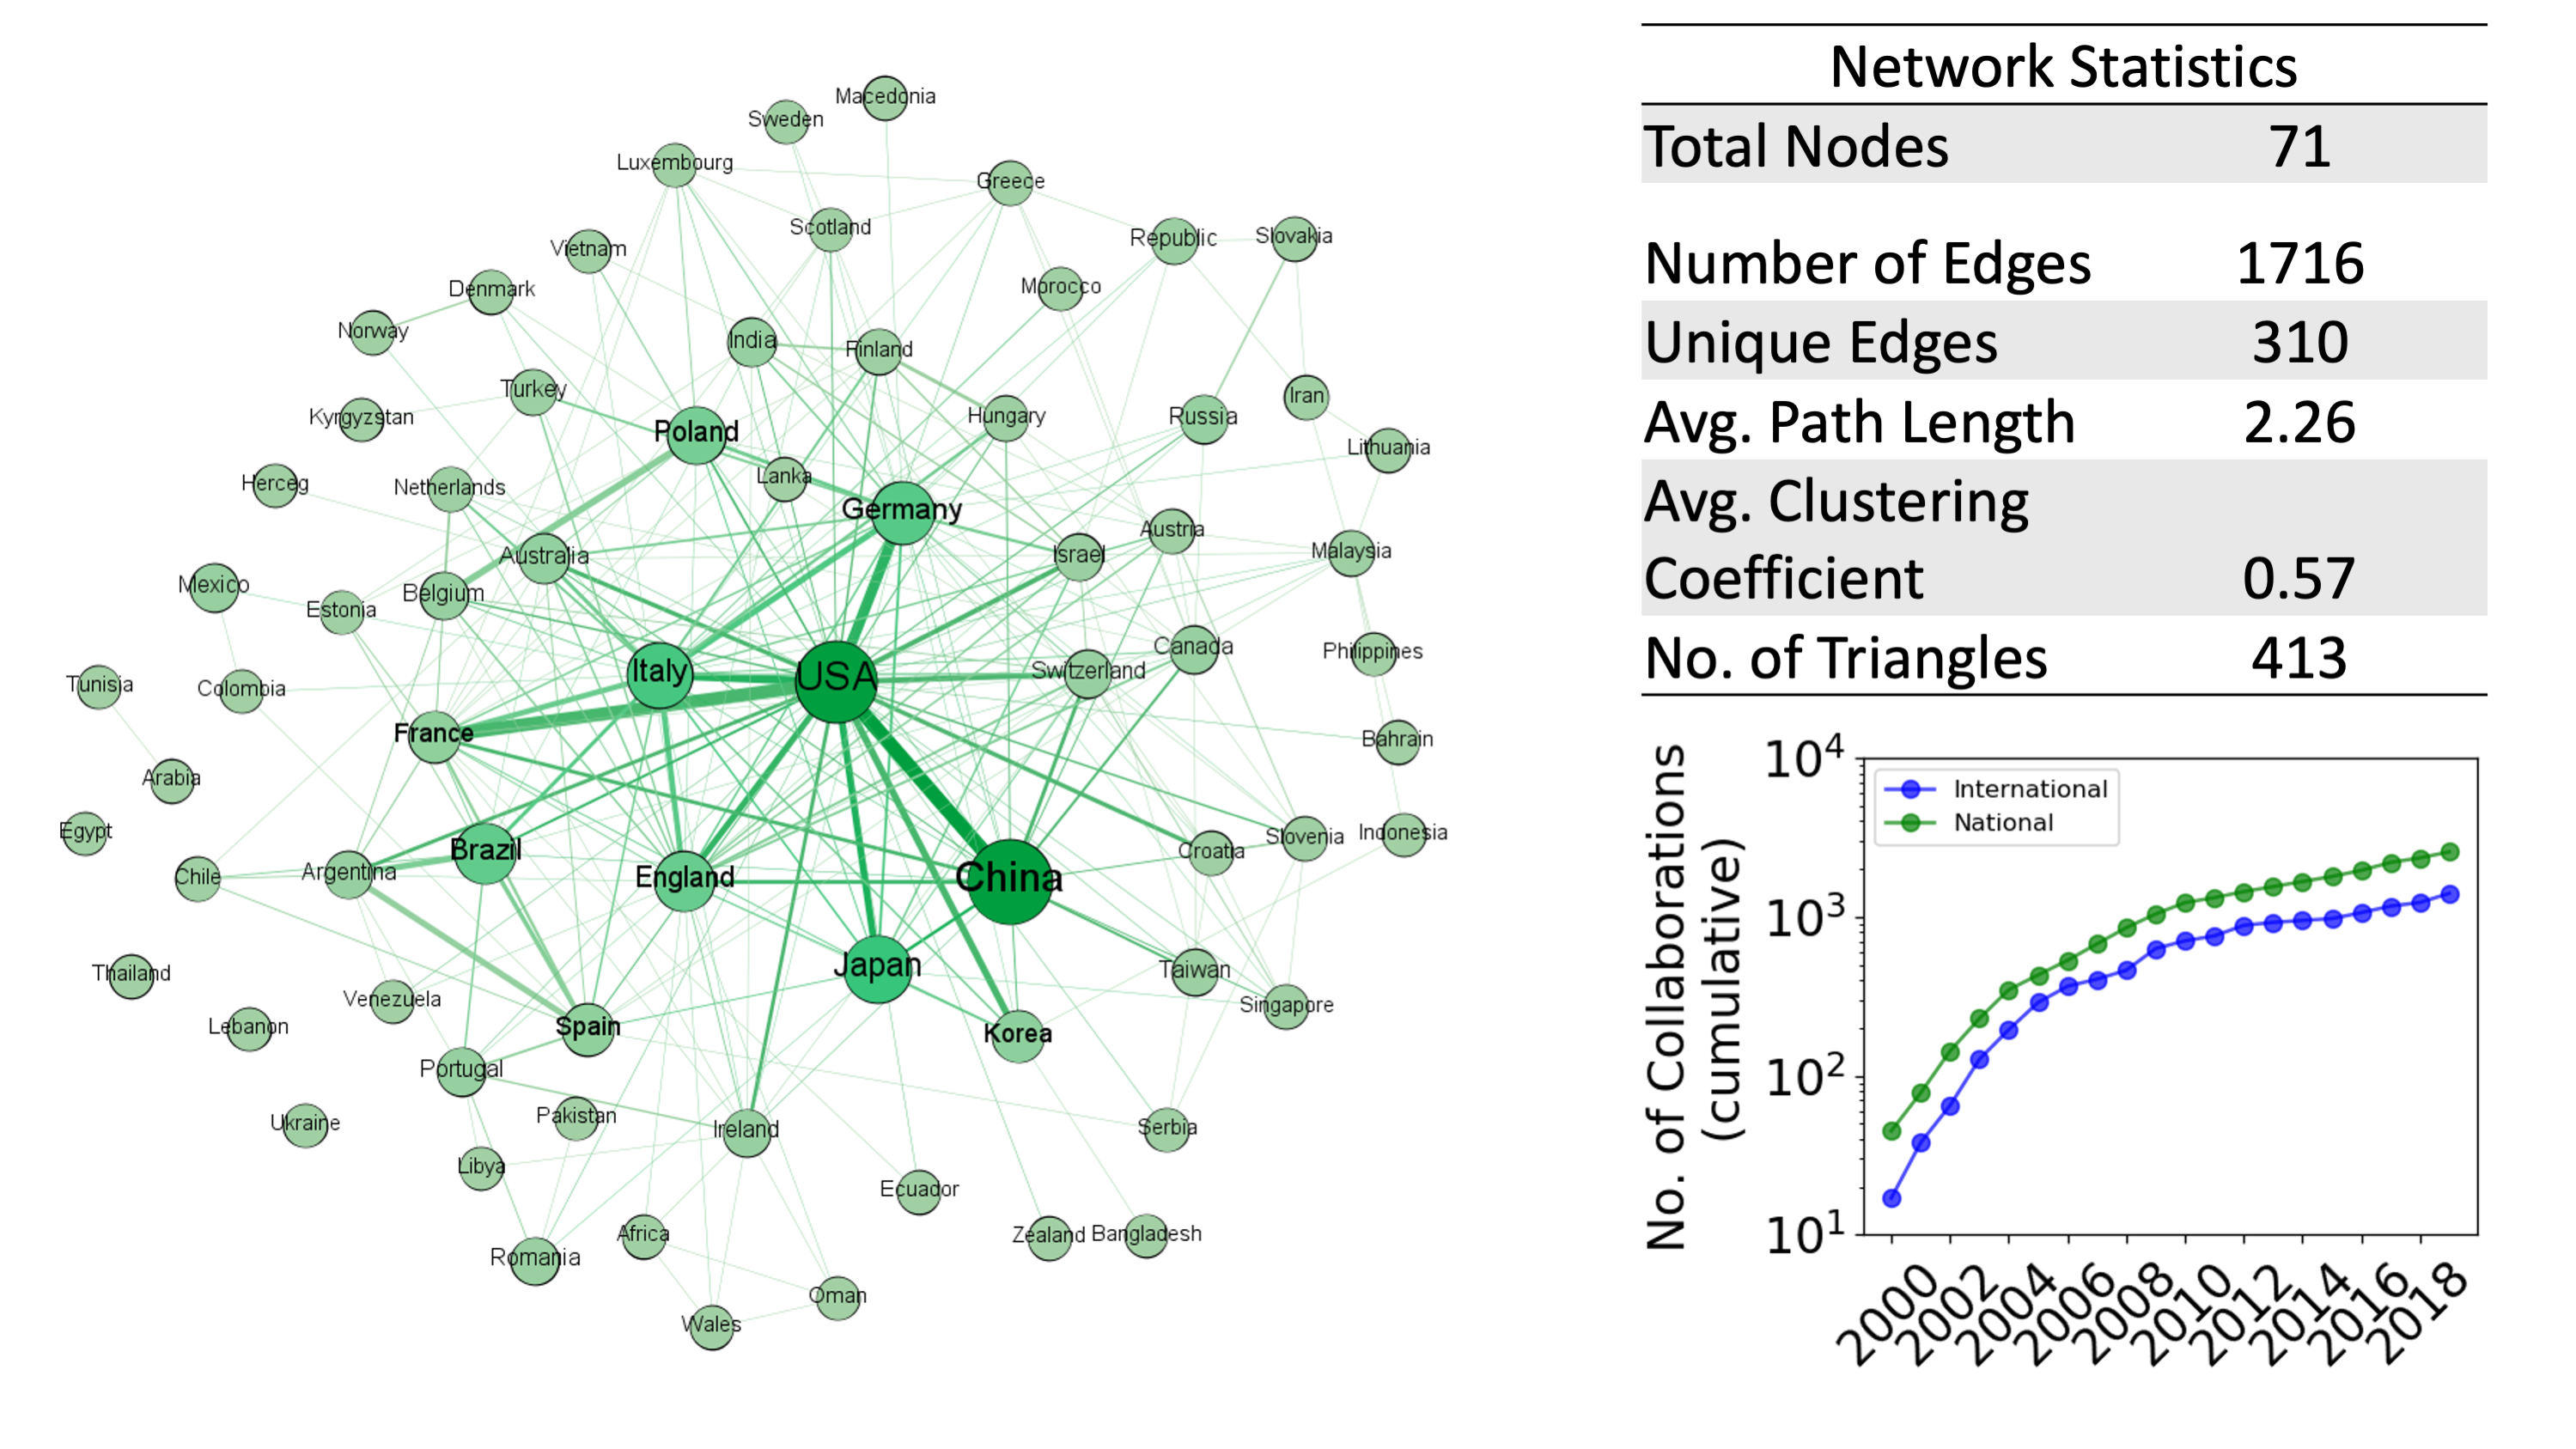
To visualize the expansion of the econophysicists’ across the globe we have studied the geolocations of authors. Fig.7(a) represents the number of authors in different countries’ (in ) working on Econophysics. The violet-colored bars represent the corresponding authors who lead the projects and cyan colored bars represent the co-authors of the papers. Here, we displayed results only for few countries’ as per the number of corresponding authors. China is leading in terms of the number of corresponding as well as co-author’s participation. Fig.7(b) highlights the number of papers published by the number of authors in the respective countries. The results are presented in 71 countries. The trend reveals the signature of scaling behavior in terms of the author’s publications across the globe. Further, an undirected weighted network of countries’ with 71 nodes and 1716 edges is constructed in Fig.7(c). There are self-loops present in the network which correspond to either a single author paper or collaboration among the same country. The size of the node represents the number of authors in the respective country and the edge width represents the number of times a collaboration occurred. Results highlight a strong collaboration between the USA and France; however, the number of authors is higher in the USA rather than in France which shows there might be a small but active community of researchers in the field. We also find that the within-country collaboration is more active as compared to cross-country. Hence, China, the USA, Italy, Japan, Germany, France, etc. have a large number of authors, a large number of publications, and strong connectivity/ collaboration among them (self-loops not shown in-network). We can say that these leading countries’ are driving the discipline, however, other countries are also contributing to the growth of the discipline and getting connecting to the leading countries. Fig.7(d) shows the evolution of the cumulative growth of international and national collaborations. Results highlights that national collaboration is higher than international collaborations. China shares more nationals, whereas the USA shares more international collaborations. There is a dip in the international collaborations trend during 2007-2008, this was the time when the stock market crashed due to the bankruptcy of Lehman Brothers.
(a)
(b)
 (c)
(d)
(c)
(d)
3.3 Network growth
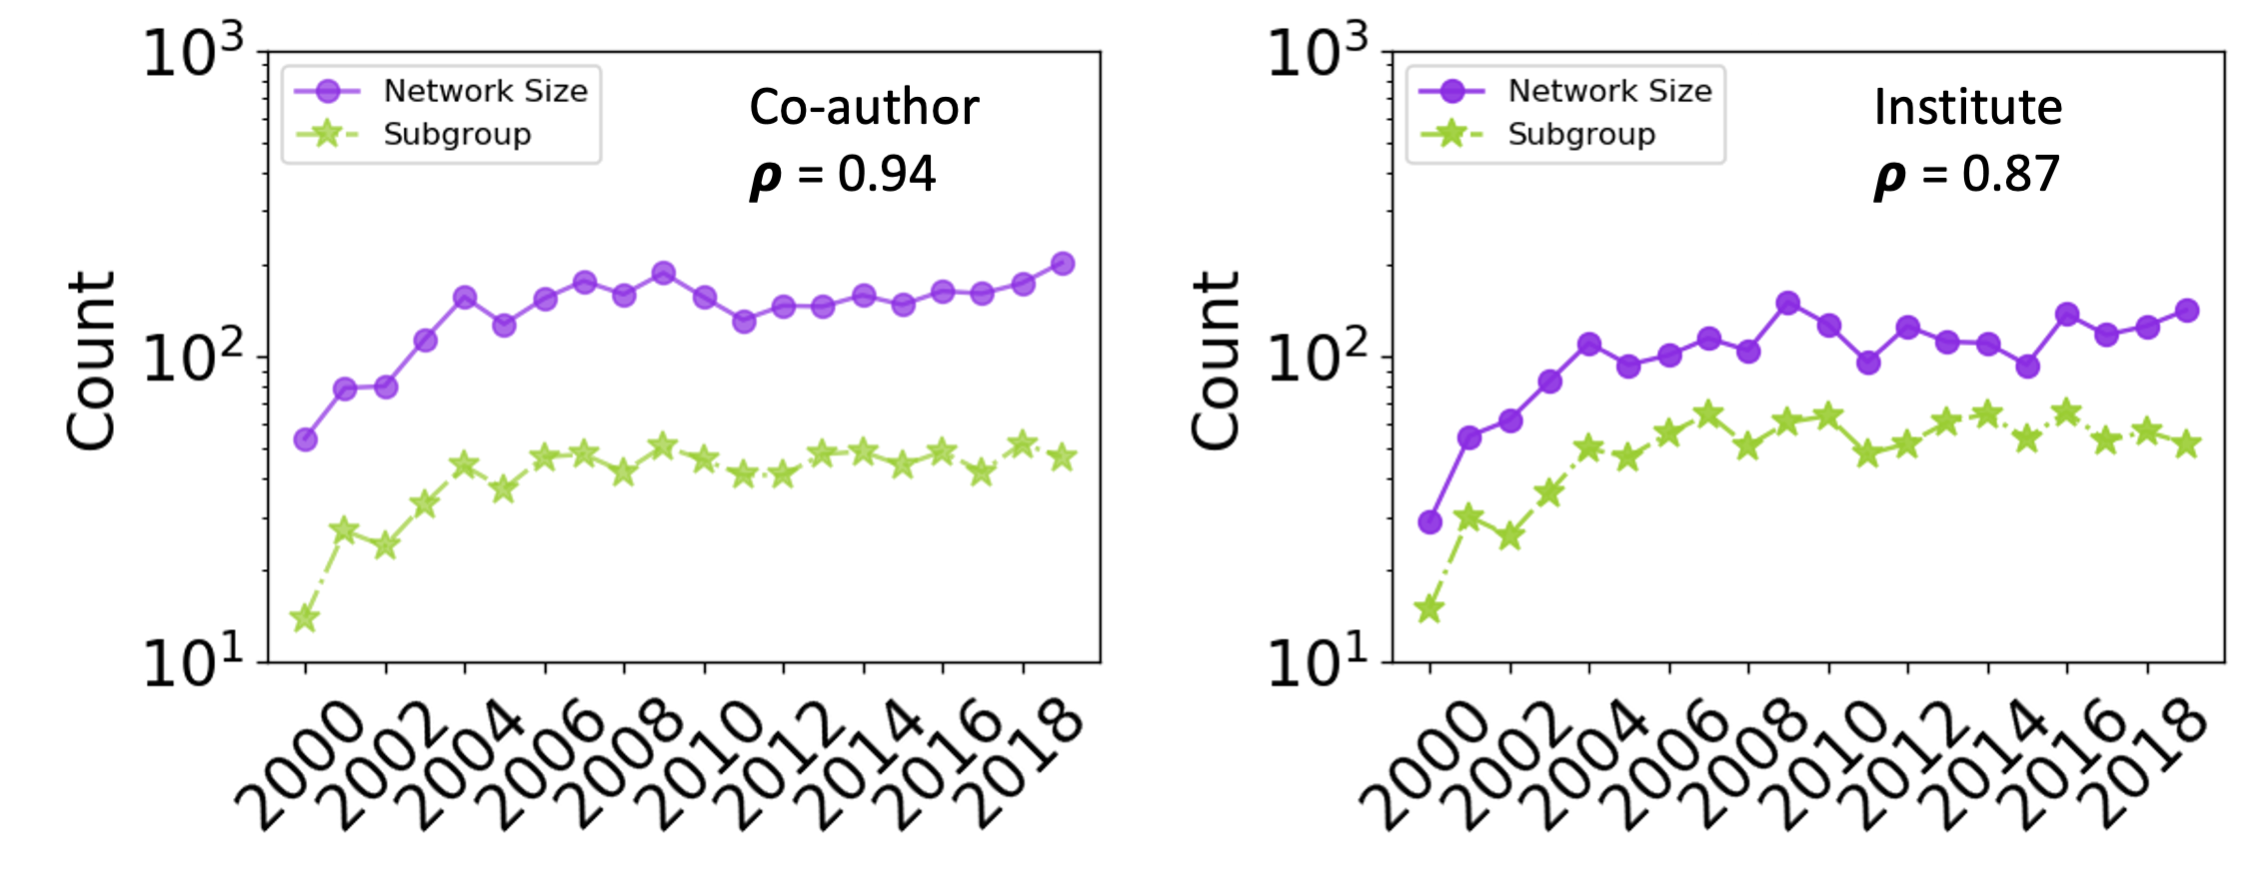
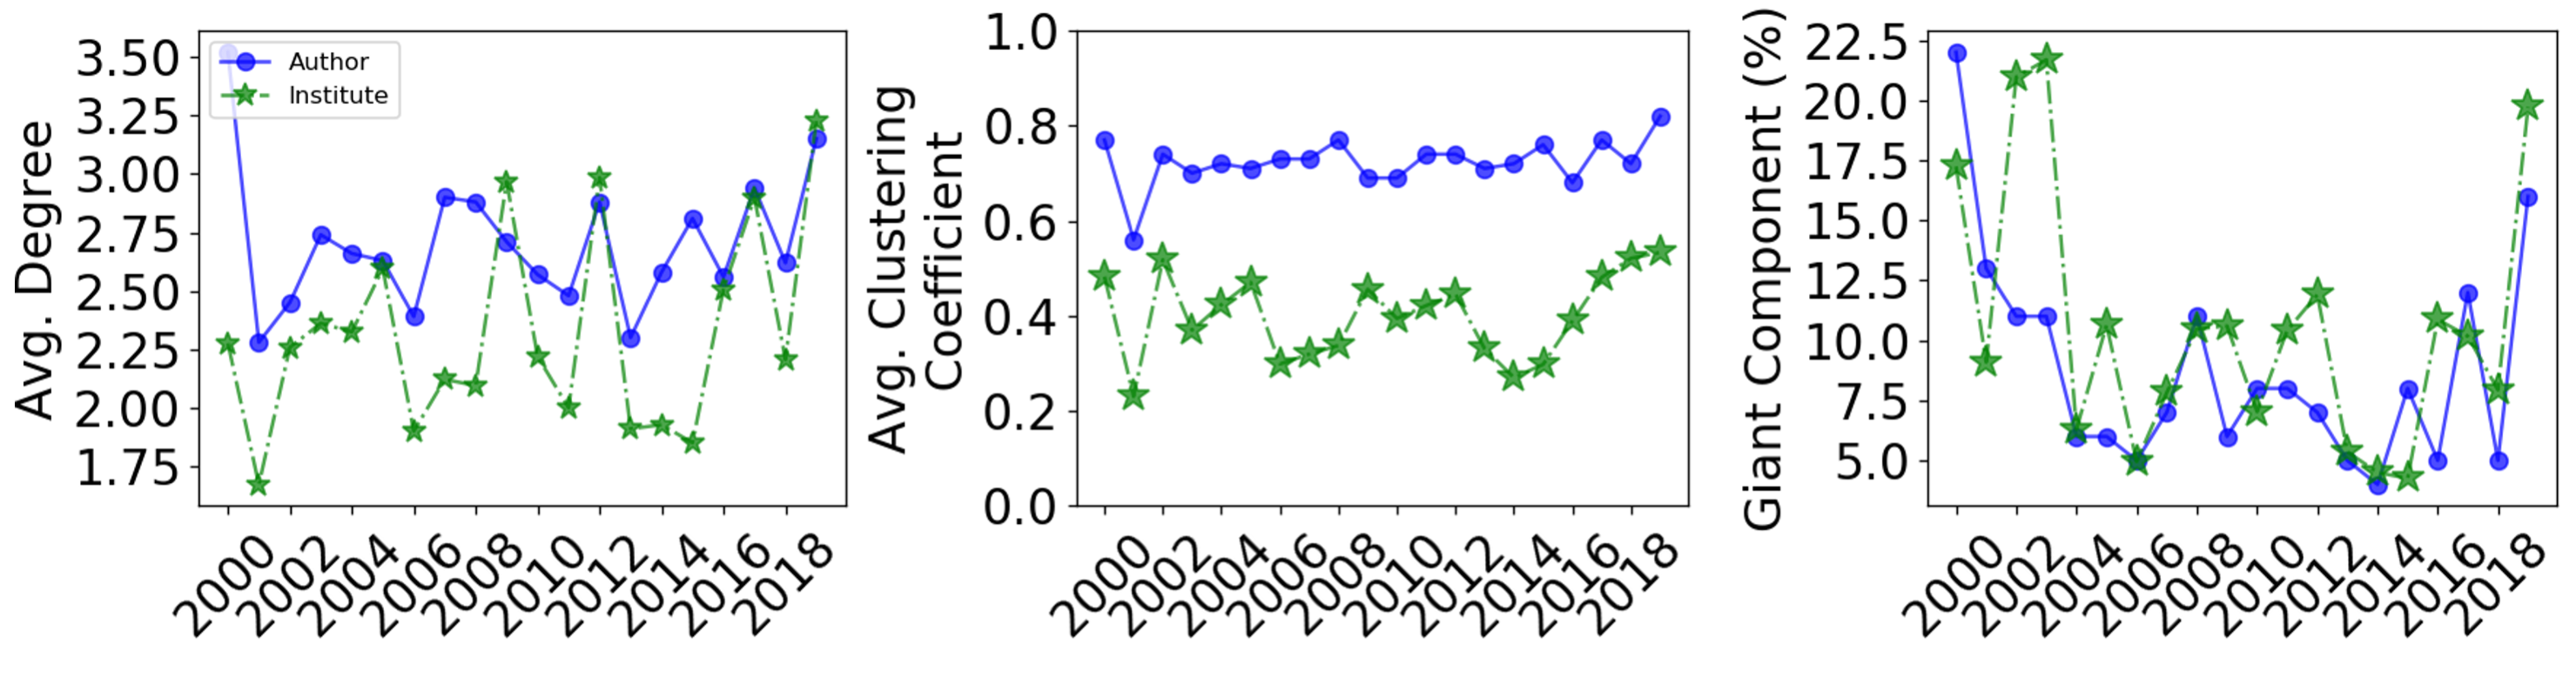
The evolution of fundamental statistical properties of the scientific collaboration networks in terms of the average degree of the nodes (), average clustering coefficient (), and size of the giant component (GC(%)) during 2000-2019 is shown in Fig.8. The evolution of the co-authorship network is shown in Fig.8(a) where the time series of network growth and a number of connected components shares a high amount of correlation (0.94). Similarly, the evolution of the author’s affiliation network is shown in Fig.8(b) where the time series of network growth and a number of connected components also shares a high amount of correlation (0.87). The evolution of the network’s average degree, average clustering coefficient, and size of the giant component (in%) are shown for both the co-authorship and affiliations networks in Fig.8(c-e), respectively. On an average, the degree of the co-authorship network varies between 2 to 3, and the clustering coefficient varies between 0.6 to 0.8. Similarly, on an average, the degree of the affiliations network varies between 1 to 3 and the clustering coefficient varies between 0.2 to 0.6 over years. The average path length of the network lies between 2 to 3 which reveals the “small-world” behavior of the network at every time step. A higher average clustering coefficient shows that nodes are grouped into communities.
(a)
(b)
 (c)
(d)
(e)
(c)
(d)
(e)
|
Country | Author | Affiliation |
|
Country | Author | Affiliation | ||||||||
| 1 | USA | Stanley, HE | Boston University | 56 | 0.07 | 26 | China | Gu, GF |
|
15 | 0.45 | ||||
| 2 | China | Zhou, WX | Chinese Academy of Sciences | 39 | 0.13 | 27 | South Korea | Jung, WS |
|
15 | 0.34 | ||||
| 3 | Japan | Takayasu, H |
|
31 | 0.13 | 28 | USA | Johnson, NF | University of Miami | 15 | 0.16 | ||||
| 4 | Italy | Mantegna, RN | University of Palermo | 26 | 0.17 | 29 | England | Schinckus, C | University Leicester Finance | 14 | 0.26 | ||||
| 5 | China | Ren, F |
|
25 | 0.22 | 30 | China | Jiang, XF |
|
13 | 0.32 | ||||
| 6 | Belgium | Ausloos, M | University of Liege | 24 | 0.10 | 31 | China | Zheng, B |
|
13 | 0.26 | ||||
| 7 | England | Di Matteo, T | Kings College London | 23 | 0.13 | 32 | China | Zhang, W | Tianjin University | 13 | 0.59 | ||||
| 8 | Switzerland | Sornette, D | Swiss Finance Institute | 22 | 0.10 | 33 | Croatia | Podobnik, B | University of Rijeka | 13 | 0.24 | ||||
| 9 | Japan | Takayasu, M | Tokyo Institute of Technology | 22 | 0.19 | 34 | England | Preis, T | University College London | 13 | 0.33 | ||||
| 10 | Japan | Kaizoji, T | Int Christian University | 21 | 0.20 | 35 | India | Chakrabarti, BK | Saha Institute of Nuclear Physics | 13 | 0.24 | ||||
| 11 | USA | Yakovenko, VM | University of Maryland | 21 | 0.18 | 36 | Ireland | McCauley, JL | NUI Galway | 13 | 0.26 | ||||
| 12 | China | Qiu, T | Nanchang Hangkong University | 20 | 0.24 | 37 | Japan | Mizuno, T | University of Tsukuba | 13 | 0.33 | ||||
| 13 | Ireland | Richmond, P | Univ Dublin Trinity College | 19 | 0.17 | 38 | South Korea | Kim, SY |
|
13 | 0.24 | ||||
| 14 | Italy | Gallegati, M | Univ Politecn Marche | 19 | 0.22 | 39 | Australia | Aste, T | Australian National University | 12 | 0.21 | ||||
| 15 | South Korea | Lee, JW | Inha University | 19 | 0.15 | 40 | China | Wang, GJ | Hunan University | 12 | 0.26 | ||||
| 16 | Canada | Li, SP | University of Toronto | 17 | 0.20 | 41 | China | Xie, C | Hunan University | 12 | 0.30 | ||||
| 17 | China | Jiang, ZQ |
|
17 | 0.33 | 42 | South Korea | Yang, JS | Korea University | 12 | 0.36 | ||||
| 18 | China | Huang, JP | Fudan University | 17 | 0.23 | 43 | South Korea | Moon, HT |
|
12 | 0.41 | ||||
| 19 | China | Xiong, X | Tianjin University | 17 | 0.40 | 44 | Germany | Mimkes, J |
|
11 | 0.36 | ||||
| 20 | Japan | Takahashi, T | University of Tokyo | 17 | 0.15 | 45 | South Korea | Kim, S |
|
11 | 0.29 | ||||
| 21 | China | Zhong, LX | Dianzi University | 16 | 0.33 | 46 | South Korea | Oh, G |
|
11 | 0.31 | ||||
| 22 | China | Chen, W | Shenzhen Stock Exchange | 16 | 0.42 | 47 | USA | Amaral, LAN | Northwestern University | 11 | 0.46 | ||||
| 23 | England | Scalas, E | University of Sussex | 16 | 0.15 | 48 | China | Yang, G | Fudan University | 10 | 0.49 | ||||
| 24 | Italy | Lillo, F | Scuola Normale Super Pisa | 16 | 0.37 | 49 | China | Zhang, YJ | Tianjin University | 10 | 0.51 | ||||
| 25 | Japan | Fujiwara, Y | University of Hyogo | 16 | 0.30 | 50 | India | Chakraborti, A | Jawaharlal Nehru University | 10 | 0.29 |
. S.No. Institutes #a S.No. Institutes #a 1 Boston University, USA 56 30 26 University of Evora, Portugal 14 3 2 East China University of Science & Technology, China 36 38 27 CNRS, France 13 3 3 University of Palermo, Italy 34 13 28 Saha Institute of Nuclear Physics, India 13 10 4 University Buenos Aires, Argentina 26 5 29 Sony Compter Science Labs, Japan 13 2 5 University of Tokyo, Japan 25 17 30 Swiss Federal Institute of Technology, Switzerland 13 6 6 Int Christian University, Japan 23 2 31 Trinity College Dublin, Ireland 13 6 7 University of Leicester, England 23 8 32 Federal University of Rio Grande do Sul, Brazil 13 6 8 Santa Fe Institute, USA 22 9 33 University of Pavia, Italy 13 3 9 UCL, England 21 8 34 Artemis Capital Asset Management GmbH, Germany 12 1 10 Kyoto University, Japan 19 7 35 Kings College London, England 12 10 11 Tokyo Institute of Technology, Japan 19 13 36 Korea University, South Korea 12 3 12 Aalto University, Finland 18 7 37 Peking University, China 12 9 13 Ist Nazl Fis Nucl, Italy 18 2 38 Tel Aviv University, Israel 12 6 14 Korea Advance Institute of Science & Technology, South Korea 18 11 39 University of Catolica Brasilia, Brazil 12 3 15 University of Wroclaw, Poland 18 7 40 University of Electronic Science and Technology, China 12 7 16 University Maryland, USA 17 5 41 University of Fed Alagoas, Brazil 12 8 17 Bar Ilan University, Israel 16 4 42 University of Kiel, Germany 12 3 18 University Cologne, Germany 16 6 43 University of Piemonte Orientale, Italy 12 2 19 Kanazawa Gakuin University, Japan 15 2 44 University of Politecn Madrid, Spain 12 6 20 National University of Singapore 15 5 45 University of Porto, Portugal 12 6 21 University of California Los Angeles, USA 15 1 46 Budapest University of Technology & Economics, Hungary 11 7 22 University Politecn Marche, Italy 15 2 47 Pohang University of Science & Technology, South Korea 11 5 23 Complexity Science Hub Vienna, Austria 14 3 48 University of Adelaide, Australia 11 2 24 Consejo Nacl Invest Cient & Tecn, Argentina 14 3 49 University of Liege, Belgium 11 1 25 ETH, Switzerland 14 6 50 Zhejiang University, China 11 27
4 Discussion and conclusion
We have presented the detailed analysis of “Econophysics” in terms of the evolution and structure of collaborations networks from 2000-2019. We have performed a systematic empirical research highlighting the patterns in data, key disciplines by cited references, and the patterns of collaborations at micro, meso, and macro-levels. The key findings of the study are: (i) The impact of self-citations on citations reveals that in first few years the publications have received more self-citations and this trend goes down with time. Also, on an average a paper has received first self-citations in first two years after the publication. (ii) The disciplines extracted from cited references from all published papers highlights the higher contribution of physics and second highest of economics. The higher contribution of physicists’ towards the growth of Econophysics reveals the true nature of the discipline. (iii) The co-authorship network at micro-level identifies the key authors and their contributions as an individual or in group. Also, the number of papers contributed by teams of varying sizes and the evolution of the team size over time is presented. We identified communities inside the giant component of the network and presented the relationships among nodes degrees and centrality measures (betweenness, closeness and eigencentrality). (iv) We also explored the authors’ affiliations and country collaborations at meso and macro level. Results highlight that large number of authors are affiliated to a few numbers of institutions and China and USA has produced the higher authors as well as institutions. In terms of national and international collaborations, China share more national and USA shares more international collaborations. (v) Finally, the author’s collaborations and affiliations networks are explored in terms of average degree, average clustering coefficient, average path length, size of giant component, etc. to study the networks evolution with a yearly resolution.
To conclude further, our study has provided an integrated view of citation dynamics and the growth of scientific collaborations networks of Econophysics metadata from 2000-2019. Our study justified the highest contribution of physicists’ towards the field and to spread the visibility of the discipline, we suggest authors should publish more in interdisciplinary journals. However, the low number of publications reported under the Econophysics domain in Web of Science points out as a limitation of the study which further leads to the absence of the significant contribution of few authors. A possible future direction to extend the study is to integrate temporal data and quantify the evolution process of the co-authorship network and affiliations network (Börner et al., 2004). This could reveal how the importance of an author varies with time at different stages in his/her career.
Acknowledgment
This work greatly benefited from discussions with and comments from A. Chakraborti and H. K. Pharasi. This work uses Web of Science data by Thomson Reuters provided by the Northwestern University. \printcredits
References
- Abergel et al. (2019) Abergel, F., Chakrabarti, B.K., Chakraborti, A., Deo, N., Sharma, K., 2019. New Perspectives and Challenges in Econophysics and Sociophysics. Springer.
- Amaral et al. (1999) Amaral, L.A., Cizeau, P., Gopikrishnan, P., Liu, Y., Meyer, M., Peng, C.K., Stanley, H., 1999. Econophysics: can statistical physics contribute to the science of economics? Computer Physics Communications 121, 145–152.
- Andrikopoulos et al. (2016) Andrikopoulos, A., Samitas, A., Kostaris, K., 2016. Four decades of the journal of econometrics: Coauthorship patterns and networks. Journal of econometrics 195, 23–32.
- Bacis (2019) Bacis, E., 2019. enricobacis/wos. URL: https://github.com/enricobacis/wos.
- Barabási et al. (2016) Barabási, A.L., et al., 2016. Network science. Cambridge university press.
- Börner et al. (2004) Börner, K., Maru, J.T., Goldstone, R.L., 2004. The simultaneous evolution of author and paper networks. Proceedings of the National Academy of Sciences 101, 5266–5273.
- Carbone et al. (2007) Carbone, A., Kaniadakis, G., Scarfone, A.M., 2007. Where do we stand on econophysics?
- Chakrabarti and Chakraborti (2010) Chakrabarti, B.K., Chakraborti, A., 2010. Fifteen years of econophysics research. arXiv preprint arXiv:1010.3401 .
- Chakrabarti et al. (2006) Chakrabarti, B.K., Chakraborti, A., Chatterjee, A., 2006. Econophysics and sociophysics: trends and perspectives. John Wiley & Sons.
- Chakraborti et al. (2016) Chakraborti, A., Raina, D., Sharma, K., 2016. Can an interdisciplinary field contribute to one of the parent disciplines from which it emerged? The European Physical Journal Special Topics 225, 3127–3135.
- Chakraborti et al. (2011) Chakraborti, A., Toke, I.M., Patriarca, M., Abergel, F., 2011. Econophysics review: I. empirical facts. Quantitative Finance 11, 991–1012.
- Chen et al. (2014) Chen, M., Kuzmin, K., Szymanski, B.K., 2014. Community detection via maximization of modularity and its variants. IEEE Transactions on Computational Social Systems 1, 46–65.
- Dash (2014) Dash, K.C., 2014. Evolution of econophysics, in: Econophysics of Agent-Based Models. Springer, pp. 235–285.
- Dash (2015) Dash, K.C., 2015. Judging the impact of ‘econophysics’ through response to questionnaire, in: Econophysics and Data Driven Modelling of Market Dynamics. Springer, pp. 327–348.
- Fan et al. (2004) Fan, Y., Li, M., Chen, J., Gao, L., Di, Z., Wu, J., 2004. Network of econophysicists: a weighted network to investigate the development of econophysics. International Journal of Modern Physics B 18, 2505–2511.
- Fowler and Aksnes (2007) Fowler, J., Aksnes, D., 2007. Does self-citation pay? Scientometrics 72, 427–437.
- Freeman (1977) Freeman, L.C., 1977. A set of measures of centrality based on betweenness. Sociometry , 35–41.
- Ghosh (2013) Ghosh, A., 2013. Econophysics research in india in the last two decades. IIM Kozhikode Society & Management Review 2, 135–146.
- Good et al. (2010) Good, B.H., De Montjoye, Y.A., Clauset, A., 2010. Performance of modularity maximization in practical contexts. Physical Review E 81, 046106.
- Guimera et al. (2005) Guimera, R., Uzzi, B., Spiro, J., Amaral, L.A.N., 2005. Team assembly mechanisms determine collaboration network structure and team performance. Science 308, 697–702.
- Li et al. (2007) Li, M., Wu, J., Fan, Y., Di, Z., 2007. Econophysicists collaboration networks: Empirical studies and evolutionary model, in: Econophysics of Markets and Business Networks. Springer, pp. 173–182.
- Newman (2001) Newman, M.E., 2001. Scientific collaboration networks. i. network construction and fundamental results. Physical review E 64, 016131.
- Newman (2003) Newman, M.E., 2003. The structure and function of complex networks. SIAM review 45, 167–256.
- Newman et al. (2006) Newman, M.E., Barabási, A.L.E., Watts, D.J., 2006. The structure and dynamics of networks. Princeton university press.
- Ortega and Aguillo (2013) Ortega, J.L., Aguillo, I.F., 2013. Institutional and country collaboration in an online service of scientific profiles: Google scholar citations. Journal of Informetrics 7, 394–403.
- Pereira et al. (2017) Pereira, E.J.d.A.L., da Silva, M.F., Pereira, H.d.B., 2017. Econophysics: Past and present. Physica A: Statistical Mechanics and its Applications 473, 251–261.
- Price (1965) Price, D.J.D.S., 1965. Networks of scientific papers. Science , 510–515.
- Radicchi et al. (2017) Radicchi, F., Weissman, A., Bollen, J., 2017. Quantifying perceived impact of scientific publications. Journal of Informetrics 11, 704–712.
- Roehner (2010) Roehner, B.M., 2010. Fifteen years of econophysics: worries, hopes and prospects. arXiv preprint arXiv:1004.3229 .
- Rosser (2008) Rosser, J.B., 2008. Econophysics .
- Sinatra et al. (2016) Sinatra, R., Wang, D., Deville, P., Song, C., Barabási, A.L., 2016. Quantifying the evolution of individual scientific impact. Science 354.
- Singh et al. (2020) Singh, C.K., Vasques Filho, D., Jolad, S., O’Neale, D.R., 2020. Evolution of interdependent co-authorship and citation networks. Scientometrics , 1–20.
- Stanley et al. (1999) Stanley, H.E., Amaral, L.A.N., Canning, D., Gopikrishnan, P., Lee, Y., Liu, Y., 1999. Econophysics: Can physicists contribute to the science of economics? Physica A: Statistical Mechanics and its Applications 269, 156–169.
- Stanley and Mantegna (2000) Stanley, H.E., Mantegna, R.N., 2000. An introduction to econophysics. Cambridge University Press, Cambridge.
- Sun and Rahwan (2017) Sun, L., Rahwan, I., 2017. Coauthorship network in transportation research. Transportation Research Part A: Policy and Practice 100, 135–151.
- Tahamtan and Bornmann (2019) Tahamtan, I., Bornmann, L., 2019. What do citation counts measure? an updated review of studies on citations in scientific documents published between 2006 and 2018. Scientometrics 121, 1635–1684.
- Valente et al. (2008) Valente, T.W., Coronges, K., Lakon, C., Costenbader, E., 2008. How correlated are network centrality measures? Connections (Toronto, Ont.) 28, 16.
- Watts and Strogatz (1998) Watts, D.J., Strogatz, S.H., 1998. Collective dynamics of ‘small-world’networks. nature 393, 440–442.
- Zeng et al. (2017) Zeng, A., Shen, Z., Zhou, J., Wu, J., Fan, Y., Wang, Y., Stanley, H.E., 2017. The science of science: From the perspective of complex systems. Physics Reports 714, 1–73.
- Zheleva et al. (2009) Zheleva, E., Sharara, H., Getoor, L., 2009. Co-evolution of social and affiliation networks, in: Proceedings of the 15th ACM SIGKDD international conference on Knowledge discovery and data mining, pp. 1007–1016.