Cosmic rays, neutrinos and GeV-TeV gamma rays from Starburst Galaxy NGC 4945
Abstract
The detection of high-energy astrophysical neutrinos and ultra-high-energy cosmic rays (UHECRs) provides a new way to explore sources of cosmic rays. One of the highest energy neutrino events detected by IceCube, tagged as IC35, is close to the UHECR anisotropy region detected by Pierre Auger Observatory. The nearby starburst galaxy (SBG), NGC 4945, is close to this anisotropic region and inside the mean angular error of the IC35 event. Considering the hypernovae contribution located in the SB region of NGC 4945, which can accelerate protons up to and inject them into the interstellar medium, we investigate the origin of this event around this starburst galaxy. We show that the interaction of these protons with the SB region’s gas density could explain Fermi-LAT gamma-ray and radio observations if the magnetic field’s strength in the SB region is the order of . Our estimated PeV neutrino events, in ten years, for this source is approximately 0.01 () if a proton spectral index of 2.4 (2.7) is considered, which would demonstrate that IC35 is not produced in the central region of this SBG. Additionally, we consider the superwind region of NGC 4945 and show that protons can hardly be accelerated in it up to UHEs.
I INTRODUCTION
The detection of high-energy (HE) astrophysical neutrinos provides us the unique opportunity to investigate their origin. The IceCube observatory reported the discovery of 28 TeV-PeV neutrino events in 2013 [1, 2]. In their latest update, 54 more neutrino events have been added to the high-energy starting events (HESE) catalog [3]. The Pierre Auger Observatory detected ultra-high-energy cosmic rays (UHECRs) above 57 EeV in their 3.7 years of observations [4, 5]. These observations exhibited an anisotropic distribution of UHECRs and their possible correlation with nearby extragalactic objects. Additionally, a large-scale anisotropic distribution was detected above 8 EeV, indicating a non-galactic origin [6]. The Pierre Auger Collaboration showed that if nearby starburst galaxies (SBGs) are included in the UHECR source population with Active Galactic Nuclei (AGNs), then patterns of arrival directions of UHECRs above 39 EeV could be explained with a ( for a recent update) confidence level against the isotropic hypothesis [7, 8]. Furthermore, many works have pointed out that Centaurus A (a type of AGN)[9, 10, 11, 12], and/or M82 and NGC 253 (types of SBGs) [13, 14, 15, 16, 17] are potential UHECR candidate sources. These astrophysical objects have also been proposed as candidates for HE neutrino production (for a review see [18, 19]). Up to date, TXS 0506 +056 is the only astrophysical object identified as a neutrino source [20, 21]. However, a recent search for point-like neutrino sources showed a 2.9 fluctuation over the expected background near the location of the SB/Seyfert 2 galaxy NGC 1068 [22]. Although the significance is not enough to claim a real connection, several works have been developed to explore feasible explanations of the neutrino flux coming from this galaxy [23, 24, 25, 26].
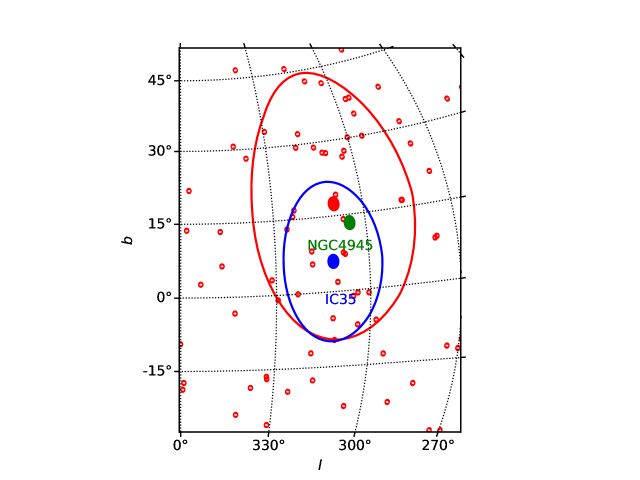
Inside the direction of the suggested Auger hotspot and the neutrino event IC35 with an energy of , which is one of the most energetic neutrino events reported by IceCube Observatory in the HESE catalog, is located the galaxy NGC 4945. This galaxy is also detected in gamma rays by Fermi-LAT (Large Area Telescope) and reported in the first Fermi-LAT catalog [1FGL; 27]. The gamma-ray emission was explained using the interaction of cosmic ray (CR) protons with the gas medium in the SB region [28, 29].
NGC 4945 a nearly edge-on spiral galaxy classified as SB type is located at a distance of [30, 31]. This galaxy is one of the brightest emitters in the infrared (IR) band, which originate from the heating of dusty medium by ultraviolet (UV) and optical photons from the central SB activity. Moreover, optical line splitting provides evidence of an ionization region embedded within a conical cavity with a dimension of along the minor and major axis of the galaxy [32, 33]. This conical-shaped region was also observed in the X-ray band, which is consistent with a super wind driven by SB activity [34]. Furthermore, NGC 4945 has an obscured AGN/Seyfert type 2 nucleus indicated by the variability on timescales of hours in the hard X-ray emission [35]. This galaxy is considered one of the nearby brightest hard X-ray emitters at 100 keV only after NGC 4151 [36]. The mass of its supermassive black hole is , estimated by the detection of megamaser [37].
In this work, we investigate if there could be a connection among the SBG/Seyfert 2 NGC 4945, the IceCube neutrino event IC35, and UHECRs hotspot (Fig. 1 shows their spatial correlation). We analyze if the nuclear SB region could produce PeV neutrinos via proton-proton () collisions for protons accelerated up to . We assume that protons can be accelerated up to these energies by an energetic supernovae (SNe) explosion called hypernovae (HNe). This assumption differs from the work of [29] because they only consider SNe as proton acceleration sites, for which PeV neutrinos are not expected. Additionally, they did not consider the contribution of both primary and secondary pairs, which are important to explain the radio emission in the SB region. Although neutral pion decay products dominate the Fermi observations, the resulting cascade of secondary electrons could have significantly contribution. Furthermore, we estimate the maximum energy that CRs can reach in the superwind region and its possible contribution to the Auger hotspot.
The paper structure is as follows: in section 2, we introduce the sources of CRs in starburst galaxies, including two regions: the nuclear starburst and the superwind. Section 3 describes the theoretical model to calculate the gamma-ray and radio spectrum produced in starburst galaxies. Also, we include neutrino production. In section 4, we apply the model described in the previous section for the case of the starburst galaxy NGC 4945. Finally, in section 5, the conclusions are presented.
II Cosmic rays in SBGs
II.1 Cosmic-ray acceleration requirements
A charged particle moving along a uniform magnetic field has a helical motion with radius given by where is the atomic number, is the particle energy, is the electron charge, and is the strength of the magnetic field. The so-called Hillas criterion provides the maximum energy that CRs can reach, expressed as with the source’s size. The maximum energy of CRs that a source can confine, independent of the acceleration mechanism, is given by [38]. A useful parametrization of the characteristic acceleration timescale of CRs, independent of the Fermi first and second order acceleration mechanism is with [39] and . Therefore, the characteristic acceleration time can be written as with the parameter , where is the velocity of the source and is the diffusion coefficient. This coefficient in the Bohm limit is , and in the case of Kolmogorov turbulence is with the coherence length scale.
II.2 Cosmic rays in SB region
It is well accepted that CRs are accelerated in SN shocks via the Fermi mechanism up to energies of eV [40]. Similarly, CRs can be accelerated up to higher energies in a special and most powerful SN type called HN. These HNe can provide CRs with energies as high as [41, 42, 43]. Therefore, CRs are injected by SNe and/or HNe into the SB region with a rate of , where is the spectral index and the normalization constant in units of , is calculated using the total CR luminosity
| (1) |
where is the ratio of HN to SN rates, is the CR energy provided by HNe (SNe). We simplify the above equation defining the term in the parenthesis as the effective or average energy of CR supplied for both SNe or HNe
| (2) |
where is the fraction of energy transferred from HN (SN) to CR acceleration, and is the typical energy released in a HNe (SNe). The terminology CRs refers to both electrons and protons. The proton density, , is higher in SBGs compared to the electron density, , () [44]. The steady-state of CR spectrum can be approximated as [45, 46]
| (3) |
where is the lifetime of CRs in the SB region. CR distribution in the SB region is controlled by their diffusion in the random magnetic field and their outflow due to the galactic wind. The diffusion and advection time scales are defined as and , respectively, where is the galactic wind velocity, is the scale height of the SB region and is the diffusion coefficient. The diffusion coefficient is parametrized as , where lies in the range of and depends on the spectrum of the magnetic turbulence of ISM. In SBGs, the Kolmogorov turbulence could be assumed, which agrees with recent studies of CR propagation in our galaxy with values of and [47]. However, the escape time will be a competition between diffusion and advection process and defined as . The lifetime of CRs is compound by losses and escape, i.e, . The Appendix lists the main loss processes for protons and electrons.
II.3 Cosmic rays in Superwinds
The SN-driven Superwinds have been investigated by [48, 49]. The Superwind is expected when SNe and stellar winds collide each other. This collision forms a shock that thermalizes the central region and creates a cavity with heated gas at a temperature . This hot gas can reach the pressure necessary to produce an unbound gas under the gravitational potential, leading to an outflow away from the SB region. The escaping gas creates a region with an X-ray emission surrounded by a warm material detected in the optical band.
In Superwind theory, there are two main quantities, (i) the rate of energy transfer from SNe and stellar winds to the superwind, defined by and (ii) the rate at which the hot matter is injected into the Superwind, i.e., . Using these quantities, we determine the temperature of hot gas where is the Boltzmann constant, is the adiabatic index, and is the mean molecular weight. The number density of the hot gas in the central cavity is given by where and are the radius and half-scale height of the nuclear star formation region, respectively. Therefore, the thermal pressure in the central cavity is . Once the wind escapes from the nuclear star forming region, the superwind undergoes re-acceleration, reaching a terminal velocity of The material is dragged through the disk and the halo from the star formation region in a strong shock. This strong shock accelerates particles via the Fermi mechanism producing a power-law distribution with a spectral index of . The total CR luminosity provided by the superwind is , where is the fraction of the Superwind energy used to accelerate particles and is the superwind velocity. The maximum energy reached in the superwind region can be estimated comparing where is the dynamical timescale.
II.4 UHECRs
The recent anisotropic region reported by Pierre Auger Collaboration hints at a possible association with the starburst galaxy NGC 4945. This galaxy is 6° away from the hotspot’s center, being the astrophysical object with a larger contribution in the model applied based on starburst galaxies [50]. This anisotropic region was parameterized with a circle centered at R.A. = and . This region has an excess of 62 events above the expected for the isotropic case. To estimate the expected number of UHECRs that could be observed from NGC 4945, , as function of the bolometric luminosity of UHECRs, , we use the relation given by [11]
| (4) |
where is the exposure of the Pierre Auger Observatory with almost 15 years of data, is the minimum energy of the CR spectrum and is the threshold energy.
III Gamma rays and neutrinos from SBGs
III.1 Gamma-ray production
III.1.1 Neutral pion decay products
During their propagation, protons interact with the gas density of the medium, and the principal energy loss is via inelastic hadronuclear collision [e.g., 51, 52, 53]. The collision timescale is given by , where is the inelasticity, is the average gas number density of the medium and is the inelastic cross section [54, 55],
| (5) |
where and .
III.1.2 Bremmstrahlung
Another significant gamma-ray production is via Bremsstrahlung, for which the spectrum produced is given by [60]
| (8) |
where .
III.1.3 Inverse Compton Scattering
Ultra-relativistic electrons will suffer Compton scattering with the radiation field; lower-energy photons are scattered up to very high energies (VHEs). The spectrum produced by photons scattered, including the Klein-Nishina regime, is [61]
| (9) |
where is the Compton scattering kernel for an isotropic photon and electron distributions with and .
III.2 Secondary electrons
III.2.1 Pionic production
Electrons produced by collision can be approximated as the pion production rate because the muon moves nearly the pion speed. Then their source functions can be equivalent with a little bit difference on the value of for spectral index [54]. Then, the electron production rate is given by
| (10) |
where , , and the electron distribution in the muon rest frame is given by [62]
| (11) |
III.2.2 production
The radiation field of SBGs will attenuate VHE gamma rays, where the principal internal attenuation source is the IR radiation. The optical depth is calculated assuming a homogeneous and isotropic photon distribution as [63, 64, 65]
| (12) |
where is the mean distance traveled by gamma rays, is the total cross-section, is the velocity of the pair created in the center-of-mass system, is the threshold energy for the production of electron-positron pairs and is the cosine of the angle of collision. Assuming a planar geometry, the absorption coefficient of gamma rays in the SB region would be . Once gamma rays escape from the source, their absorption due to the extragalactic medium becomes important so that we include this effect using . The pair production rate in the nuclear SB region is [66]
| (13) |
where .
Finally, the observed gamma-ray spectrum due to hadronic, cascade processes and Bremsstrahlung is calculated using .
III.3 Radio emission
Synchrotron emission is the main responsible for radio observation, which has an emissivity given by
| (14) |
where and the function is defined in [67].
III.4 Neutrino production
SB galaxies have been proposed as neutrino sources. The main assumption is that SNe accelerate protons and inject them into ISM shooting pion-production via hadronuclear interactions [68]. As discussed by [69, 70, 42, 71], HNe inside SB galaxies can provide CRs in order to explain neutrinos.
A simple way to relate the CRs and neutrino production is via the efficiency of the process given by . Therefore, the relation between protons and all neutrino flavor in the case of interactions is given by [72],
| (15) |
The average fraction of energy transferred from protons to neutrinos is . The expected number of neutrinos between 30 TeV and 10 PeV observed in the IceCube detector can be estimated from neutrino flux as
| (16) |
with the observation time, the effective area at specific energy and the luminosity distance.
IV Application: NGC 4945
IV.1 Starburst region
In the inner region ( 250 pc) for NGC 4945, [73] derived the limits for the SN rate as , and the star formation rate as . Similarly, [74] obtained a value of using and 85.69 GHz free-free emission. The total IR emission could also trace both the dusty region or the star formation region. Given this fact, [75] reported a value of using the total IR luminosity that arises in a region of [76]. We follow the relation between the SFR and the gas contained in starburst galaxies, [77], where is the surface gas density asuming a disk geometry. Then, it is possible to estimate the gas content in the star formation region
| (17) |
This value is in agreement with the estimation, , obtained by [78].
IV.1.1 Magnetic fields
The magnetic field, , inside a starburst region plays an important role to control diffusion and emission processes (e.g., synchrotron and IC). The strength’s value will be reflected in the shape and intensity of the observed spectrum. For ultra-relativistic electrons, lower values of suppress synchrotron emission and lead to IC scattering to be the dominant process. Otherwise, values of B larger than (for which ), synchrotron emission becomes dominant, and therefore IC scattering is suppressed. The value of is found with the condition , where is the IR energy density and is the magnetic energy density. We estimate using different methods: (i) the relation with following [79] (see, references therein) we have different values
| (18) |
(ii) The equipartition, , and minimum, , values were previously estimated by [46] under different assumptions. They found the ranges of and . (iii) Radio emission is a feasible way to set the value of if SF activity is assumed as its origin. Here, we estimate from radio observations by assuming that all emission in this band comes from primary and secondary electrons confined in the SB region.
IV.1.2 Gamma-ray absorption
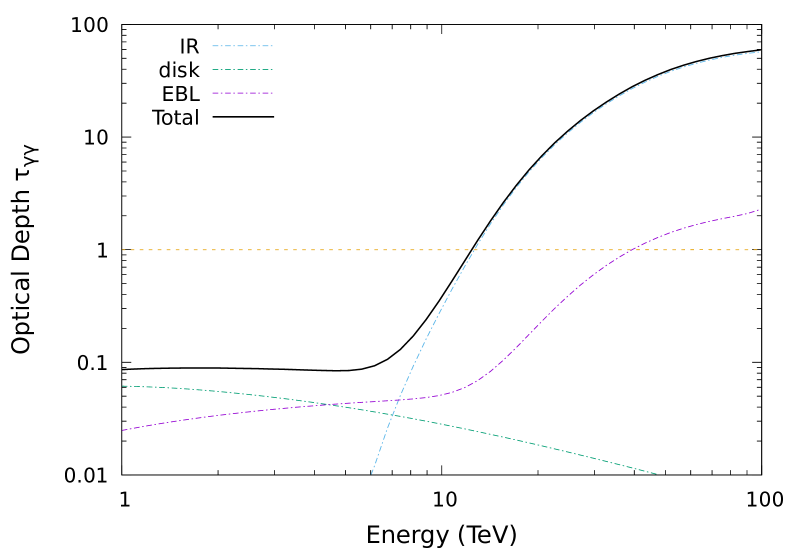
The pair production process strongly attenuates VHE gamma rays produced in the SB region due to the high density of IR photons. Taking the energy peak of IR spectrum provided by [74], the attenuation threshold for VHE gamma-rays in a head-on collision with IR photons is Additionally, [80] discussed the existence of an accretion disk to explain the observed spectrum. This accretion disk radiation permeates the central region producing attenuation of gamma rays. Considering the energy corresponding to the peak flux of the model proposed in [80], the threshold energy of gamma rays for attenuation is Finally, external attenuation due to the extragalactic background light (EBL) is considered using the parametrization introduced in [81]. The total optical depth is calculated using Eq. (12) and displayed in Fig. 2. The result shows that the principal attenuation source above is the IR radiation field.
IV.1.3 Radio and gamma-ray spectrum
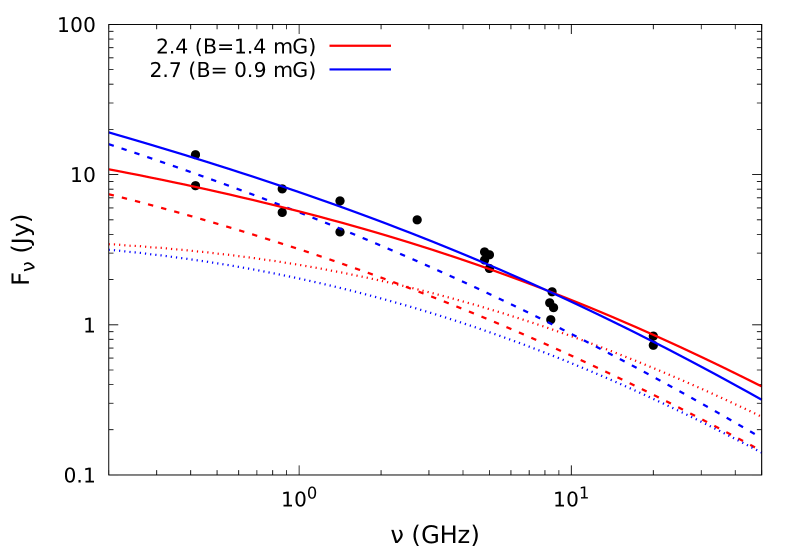
We explain radio observation with synchrotron emission of electrons (primaries and secondaries) and gamma-rays with the hadronic model ( collisions). We consider secondary electrons, as pointed by [46]. They showed that these electrons are dominant over the primary ones by a factor , for typical values of , and .
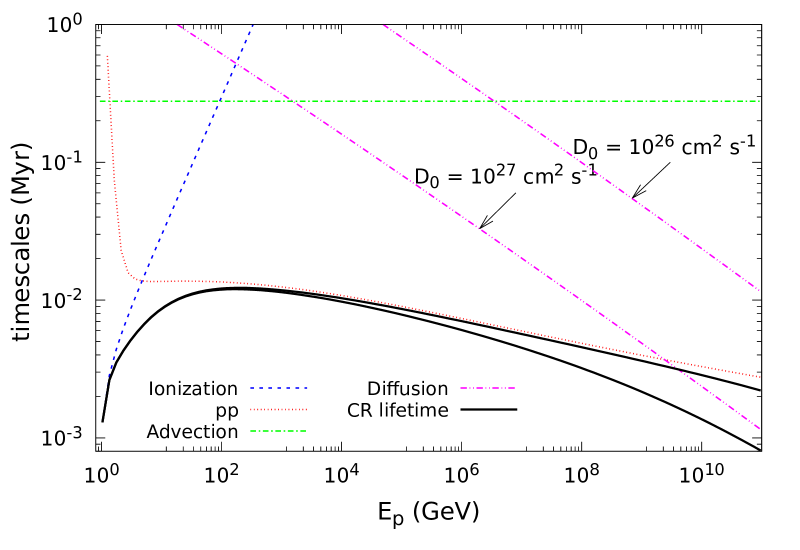
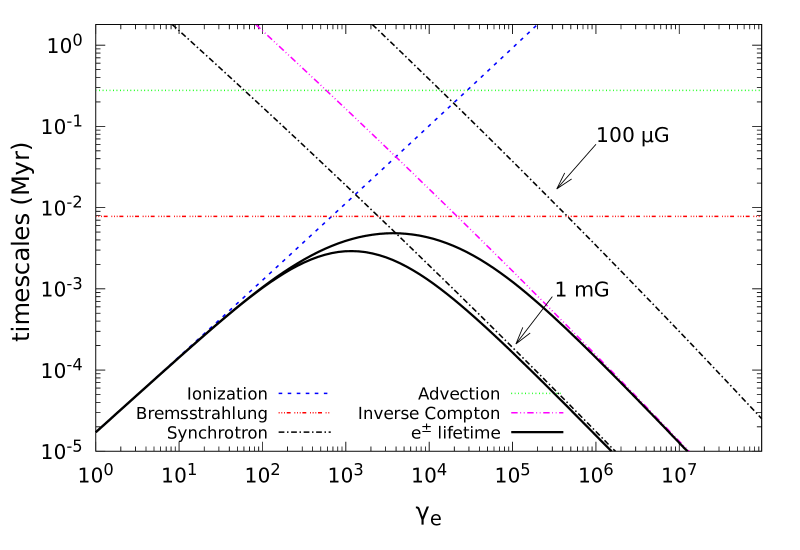
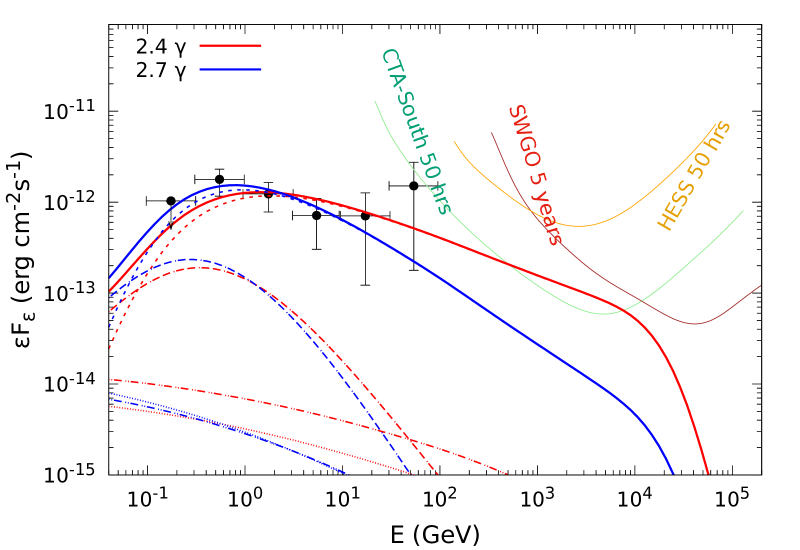
We use the bolometric CR luminosity injected by SN (HN) and the spectral index as parameters (see Eq. 1) to normalize the CR injection rate, . Another parameter is the magnetic field, which influences mainly in the radio emission. In order to explain the radio emission with SF activity, is demanded. As discussed above, if electrons are cooled mainly by synchrotron while IC scattering is suppressed. Additionally, we assume an equal spectral index for protons and primary electrons and a constant ratio between them [44]. Finally, the steady-state spectrum, , was calculated using the lifetime inside the star formation region, as given by Eq. (3). The computed lifetime of electrons and protons is plotted in Figs. (3) and (4), respectively. In this work, we chose two extreme values and , because softer and steeper values cannot fit the spectrum of gamma-rays appropriately (see Fig. 6). We mention that only frequencies below was considered, because at high energies free-free and dust emission are expected to be dominant. Therefore, the radio and gamma-rays spectra have good fits for , and whereas if is chosen, we demand and . Results are plotted in Figures 5 and 6. From our resulting radio spectrum, we observe that below frequencies of secondary electrons are the dominant population, but at high frequencies, primaries equal or even overwhelm the secondary contribution. In the case of -rays, our result shows that secondary electrons, although the dominant population over the primary, do not have essential contributions. This does not happen for Bremmstrahlung because, at sub-GeV, energies cannot be neglected. Furthermore, depending on the choice of spectral index, future TeV gamma-ray observations are expected. As we observe in Fig. (6) only implies future detection by the Cerenkov Telescope Array (CTA)[82].
IV.1.4 Energy injection of Cosmic rays by HN and SN
We consider the contribution of HN and SN to the injection of CRs. These CRs correspond to the source of the observed resulting spectrum. Until now, we do not emphasize what provides more CRs energy into the SB region; only the average CRs provided by both SN and HN can be estimated (see, Eq.1). Then, using our result from previous subsection we have, and for and , respectively. Hereafter, we use the value .
Similar CRs luminosity from HNe and SNe must be expected because of HN rate represents a tiny fraction of the SN rate about of the 7% [83] but HNe are more energetic event with typical kinetic energy of whereas SNe have . In the case of NGC 4945 we have (see Table 1) then will have . The efficiency of CR acceleration of SNe, , is uncertain but some works based on the observation of our galaxy suggest that it lies in the range of (e.g., [84, 85]). Note that with these values SNe cannot be the only accelerator of CRs because they demand kinetic energies , which are slightly bigger than the typical SN kinetic energy. Therefore, the efficiency of CR acceleration by HNe could be estimated from Eq. (2) as
| (19) |
with
| (20) |
Taking and from Eq. (20), we have that the value of lies in the range of . If an HN has similar or less efficient particle acceleration than SN, therefore, only the higher value leads to a feasible value of . This suggests similar contributions of CRs from SNe and HNe to the SB region of NGC 4945, and .
It is worth noting that we use the lower limit on , which translates into an upper value of , but higher values of can be considered, as estimated by [73]. However, examining Eq. (20) again, we notice that only satisfies if typical values are chosen. This lower limit could be interpreted as a case of complete CR injection by SNe without any contribution by HNe. The last lower value set an upper limit on . Using the relationship given by [86], we obtain . Note that this result suggests that SN rate and SF rate cannot be as high as the values estimated by [73]. Our result of the SB region is summarized in the Table 2.
IV.1.5 Expected HE-neutrino and UHECR Events
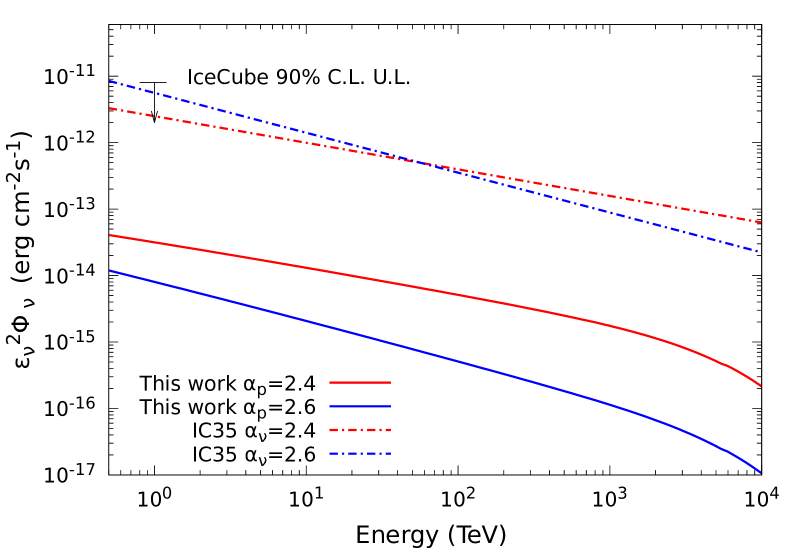
We calculate the expected number of neutrinos in the range of 30 TeV to 10 PeV in the IceCube detector during 10 years of observations. Using Eq. (16) and an spectral index in the range of , we obtain the number of neutrino events to be . Furthermore, the neutrino flux obtained with our model is compared with that associated with the IC35 event, as shown in Fig. 7. This figure shows that fluxes are consistent with the point-source flux upper-limit established by IceCube [22], and also that our model cannot explain the IC35 flux with any value of parameters used to describe the gamma-ray observations. This implies that the IC35 neutrino event could not have been produced inside the nuclear SB region. Interestingly, the IC35 event would imply a flat spectrum instead of a steeper one as the IceCube’s result for NGC 1068.
We have assumed that HN are CR accelerators up to 100 PeV. However, some authors have pointed out that these astrophysical objects could reach energies beyond EeV [87, 88]. Extrapolating our results at ultra-high energies, the luminosity above 37 EeV would be for . Using these quantities in Eq. 4, we found that the expected number of UHECRs above would be for . These values are too low to explain the anisotropy reported by Pierre Auger Observatory.
| Starburst region | Value | Description | |
| 4.6 | Star formation rate | (1) | |
| 110 | Radius | (2) | |
| 80 | Half-scale height | (2) | |
| 0.1 | SN rate | (3) | |
| Total far infrared | (2) | ||
| luminosity | |||
| Superwind | Value | Description | |
| half-open angle | (6) | ||
| Scale length | (4, 7) | ||
| 300 - 600 | Superwind velocity | (5) | |
| 0.6 | Temperature | (6) |
| Parameter | Value | Description |
|---|---|---|
| Gas number density | ||
| Maximum proton energy | ||
| 2.4 - 2.7 | spectral index | |
| 1.4 - 0.9 | Magnetic field strength | |
| 1.3 - 1.8 | Bolometric CRs luminosity | |
| injected by SN and HN | ||
| 4.2 - 5.9 | Average CRs energy injected | |
| per SN and HN | ||
| Upper limit of SN rate | ||
| Expected number of in | ||
| IceCube during 10 years |
IV.2 Superwind
A conically shaped X-ray morphology was observed in NGC 4945 by [34], which infers a thermal temperature of (similar to NGC 253). Additionally, optical emission lines were detected, attributed to a superwind with a velocity of 300-600 km/s at a distance of 70-700 pc from the nucleus [32]. [33] observed optical radial filaments from a region with an extension of 1 kpc x 6 kpc towards the halo. Along the major axis of the galaxy, these filaments are ionized gas flowing from the nuclear region.
IV.2.1 Scaling relations
Following [49], the rate of energy transferred from SNe and stellar winds to galactic wind is
| (21) |
and the rate at which the hot matter is injected into the wind is
| (22) |
From the above two quantities, it is possible to determine the temperature of hot gas in the central cavity. To be in agreement with observations performed by [34], we consider the limits obtained by [49] for the case of M82 and find a temperature of
| (23) |
The limits of thermalization parameters provide the constrains . Using the dimensions of the starburst region, we can estimate the hot gas’s number density in the central cavity as
| (24) |
Given the values of number densities in the range of , the thermal pressure lies in . Once the wind escapes from the starburst region, the terminal velocity is
| (25) |
| Parameter | Value | Description |
|---|---|---|
| 0.3 - 1 | Thermalization efficiency | |
| 4 -14 | Load mass factor | |
| 5 - 20 | Density of the hot gas | |
| 713 | Terminal velocity | |
| Bolometric proton luminosity | ||
| 10 | Maximum proton energy |
IV.2.2 Cosmic rays inside the Superwind
The superwind shocks accelerate particles via the Fermi mechanism. The CR luminosity inside the superwind is with as the terminal velocity. Taking into account Eq. (25) and , the total CR luminosity becomes
| (26) |
Considering the upper limit on the magnetic field in the halo provided by [91] as a value in the superwind region, the maximum proton energy that superwind can confine is
| (27) |
For heavy nuclei like iron, the maximum energy becomes . To determine if the superwind can accelerate UHECRs, we compare the dynamical and the acceleration timescales, such that , where the dynamical timescale is
| (28) |
and the acceleration timescale is
| (29) |
Taking into account the relation , the maximum proton energy reached is , and in the case of iron nuclei is . Therefore, superwind in NGC 4945 cannot explain the Auger hotspot above . Our result agrees with that found for the similar SBG NGC 253 [16]. On the other hand, our result is different from the conclusion reported by [92] because we use a more conservative assumption while they used the larger size and larger magnetic field in the Superwind. Moreover, if the Superwind could accelerate UHECRs, as pointed out by [92], then the luminosity above 37 EeV would be , and for spectral indexes of , and , respectively. These luminosities correspond to , and UHECRs, which are too low explain the 62 events over the expected background [50]. From Eq. 26, we can note that by increasing the star formation rate, the CR luminosity could be enhanced by a factor of considering the gamma-ray observations. Therefore, the number of UHECRs could be increased by the same factor reaching a significant fraction of the anisotropic flux, i.e., , but only for the case of . Finally, protons at 10 PeV interact with the hot gas inside the superwind with a timescale of
| (30) |
Therefore, the efficiency of collision in the halo region is very low , implying not a very significant contribution to neutrinos and gamma-rays in comparison with the central SB region. Our result of the Superwind region is summarized in Table 3.
IV.3 Core region
The association of the neutrino hotspot with the Seyfert 2 galaxy NGC 1068 has been discussed in the scenario of the AGN coronae-disk model by [25, 26]. In this model, neutrinos and MeV gamma-rays emerge, and gamma-rays above GeV are fully attenuated by photons from the UV-disk and X-ray corona. The issue with this scenario is that PeV neutrinos are difficult to explain because protons cannot accelerate beyond PeV energies due to cooling processes. In the case of NGC 4945, no significant neutrino emission at TeV energies was found by [22], and the spectrum associated is harder than the one seen for the NGC 1068 case.
NGC 4945 has an accretion disk with a temperature close to , which radiates UV-photons at an energy of . Protons with energies above interact with UV-photons via photopion processes and produce PeV neutrinos above . The corresponding photopion efficiency could be estimated as , where the size is restricted by the variability timescale of the order of . Therefore, the key to produce PeV neutrinos in the AGN-core is to accelerate protons beyond energies near the accretion disk. These protons could be accelerated by a relativistic jet, as observed in NGC 1068. Similarly, NGC 4945 exhibited a structure with a morphology type, suggesting a core-jet with a size of 5 pc of length and 1.5 pc of width [73].
V Conclusion
SBGs are promising sources of HE neutrinos as well as UHECRs. We analyzed if the nearby SBG NGC 4945 could contribute to the anisotropic region reported by Pierre Auger Observatory, and be associated with the neutrino event IC35, which is close to this region. We considered two regions around this galaxy: the SB and the superwind or halo region.
For the SB region, we used spectral indexes in the range of 2.4 and 2.7 to explain the Fermi and radio observations. We found that the average CRs energy injected per SN or HN is . Our estimations show that HN and SN have similar contributions in the luminosity of CRs and similar CR efficiencies . Also, if there is not CR contribution by HNe, an upper value of SN rate can be set . This estimate is lower than the value reported by other authors. Additionally, we found that SB provides at a proton luminosity at least times larger than that generated in the Superwind. The total gamma-ray flux is estimated by interactions in the SB region, by bremsstrahlung, and from secondary electrons, i.e., pionic and pairs produced in the interactions of primary gamma-rays and the SB’s radiation field. The radio observation is explained by both the primary and secondary pionic electrons, but demanding a magnetic field of .
We estimated the maximum energy that CRs could reach in the nuclear SB and the superwind regions. In the nuclear SB region, particles are accelerated by HN reaching energies of . We extrapolated the CR spectrum obtained by modelling gamma-rays up to ultra high energies and showed that the contribution to the hotspot is too low (less than one event).
For the Superwind case, protons are accelerated in the shock front via Fermi acceleration. The maximum energy that could be reached is , although this value could be higher if we do not consider conservative parameter values. If the Superwind accelerates UHECRs, the contribution to the Auger’s hotspot is events if we assume a flat spectrum (). This value could be enhanced near one-third of the total number of events if we increase the value of SFR without overproducing the gamma-rays spectrum. This result suggests that the SBG NGC 4945 could not be the only one responsible for the Auger hotspot. Therefore, we concluded that only a tiny fraction of UHECRs reported by Pierre Auger Observatory could have been produced in NGC 4945 (by either the SB region or the superwind). It leads to the open question about the origin of UHECRs.
Finally, we estimated the expected number of neutrinos in the energy range from 30 TeV to 10 PeV from the SB region. We found that this number lies in the range of for ten years of IceCube observations. Also, we showed that IC35 flux was consistent with the upper limit set by IceCube. Therefore, we concluded that the SB region could not produce the IC35 event. It is worth noting that our conclusion does not discard the AGN-core, which, as discussed above, is a highly efficient region for PeV-neutrino production. However, a feasible mechanism to accelerate CRs above 10 PeV is unclear for Seyfert galaxies, e.g., NGC 1068 case. If the AGN-core of NGC 4945 produced the IC35 event, then a flat neutrino spectrum would be associated to it. If this is the case, significant differences must exist with the neutrino emission mechanism in NGC 1068. An opposite case could be happening in NGC 1068, where a possible association with a TeV-neutrino hotspot could exist. In this case, the absence of a PeV neutrino would indicate a steeper spectrum, i.e., . Therefore, detailed studies are needed in the AGN-core of these two SB/Seyfert galaxies to claim differences in PeV-neutrino emission and CR acceleration signatures.
VI Acknowledgements
We thank Kotha Murase, Luis Anchordoqui, Ana Laura Müller, Floyd Stecker and Gustavo Romero for useful discussions. This work is supported by UNAM-DGAPA-PAPIIT through grant IN106521.
Appendix A CR timescales
A.1 CR escape timescale
We have discussed below the numerical values of characteristic timescales, which affect the CR distribution in the SB region. The escape time is a competition between diffusion and advection . Electrons and protons escape following the same reaction. Assuming a Kolmogorov turbulence spectrum as observed in our Galaxy, the diffusion coefficient is parametrized as where is the diffusion coefficient at 3 GeV. The value of in NGC 4945 must be lower than the one obtained by our Galaxy, i.e., [47] . This assumption is because of SBs galaxies have larger magnetic field strength than our galaxy, and the diffusion coefficient is expected to scale with the Larmor radius as . Here, we use the assumption as done in [93]. Therefore, the diffusion time is given by
| (31) |
Another way that proton can escape is via advective transportation by the galactic wind. Considering the superwind lowest velocity the timescale is given
| (32) |
From above estimation, we notice that advection is the principal electron’s escape way and the diffusion mechanism can be neglected.
A.2 Proton loss timescales
The proton lifetime is given by
| (33) |
At low energies, proton mainly losses energy by ionization [62]
| (34) |
where is the proton velocity and is the Heaviside function. The energy loss timescale via collision is simple approximated as
| (35) |
From comparing the above timescales, we can infer that the advection process dominates protons’ escape while losses dominate the total lifetime via interactions. Furthermore, the re-acceleration processes can be neglected. The proton timescales are calculated as energy’s function and are plotted in Figure 3.
A.3 Electron loss timescale
Electrons are accelerated and injected together protons, and the principal energy losses are synchrotron, IC, Bremsstrahlung, and ionization. Then, electron lifetime is given by
| (36) |
Considering an electron Lorentz factor of as typical break value, we calculate the losses timescale (e.g, [46] and references therein). The synchrotron cooling time is
| (37) |
the Bremmstrahlung timescale is only dependent on the gas density [95]
| (39) |
while the ionization process is energy dependent
| (40) |
All loss processes are comparable at GeV energies, and none can be neglected.
References
- Aartsen et al. [2013a] M. G. Aartsen et al. (IceCube Collaboration), First Observation of PeV-Energy Neutrinos with IceCube, Phys. Rev. Lett. 111, 021103 (2013a), arXiv:1304.5356 [astro-ph.HE] .
- Aartsen et al. [2013b] M. G. Aartsen et al. (IceCube Collaboration), Evidence for High-Energy Extraterrestrial Neutrinos at the IceCube Detector, Science 342, 1242856 (2013b), arXiv:1311.5238 [astro-ph.HE] .
- Aartsen et al. [2017] M. G. Aartsen et al. (IceCube Collaboration), The IceCube Neutrino Observatory - Contributions to ICRC 2017 Part II: Properties of the Atmospheric and Astrophysical Neutrino Flux, arXiv e-prints , arXiv:1710.01191 (2017), arXiv:1710.01191 [astro-ph.HE] .
- Abraham et al. [2007] J. Abraham et al. (The Pierre Auger Collaboration), Correlation of the Highest-Energy Cosmic Rays with Nearby Extragalactic Objects, Science 318, 938 (2007), arXiv:0711.2256 [astro-ph] .
- Abraham et al. [2008] J. Abraham et al. (The Pierre Auger Collaboration), Correlation of the highest-energy cosmic rays with the positions of nearby active galactic nuclei, Astroparticle Physics 29, 188 (2008), arXiv:0712.2843 [astro-ph] .
- Aab et al. [2017] A. Aab et al. (The Pierre Auger Collaboration), Observation of a large-scale anisotropy in the arrival directions of cosmic rays above 8 × 10¹⁸ eV, Science 357, 1266 (2017), arXiv:1709.07321 [astro-ph.HE] .
- Aab et al. [2018] A. Aab et al. (The Pierre Auger Collaboration), An indication of anisotropy in arrival directions of ultra-high-energy cosmic rays through comparison to the flux pattern of extragalactic gamma-ray sources, Astrophys. J. 853, L29 (2018).
- Aab et al. [2019] A. Aab et al. (The Pierre Auger Collaboration), The pierre auger observatory: Contributions to the 36th international cosmic ray conference (icrc 2019) (2019), arXiv:1909.09073 [astro-ph.HE] .
- Biermann and de Souza [2012] P. L. Biermann and V. de Souza, Centaurus A: The Extragalactic Source of Cosmic Rays with Energies above the Knee, Astrophys. J. 746, 72 (2012), arXiv:1106.0625 [astro-ph.HE] .
- Becker and Biermann [2009] J. K. Becker and P. L. Biermann, Neutrinos from active black holes, sources of ultra high energy cosmic rays, Astroparticle Physics 31, 138 (2009), arXiv:0805.1498 [astro-ph] .
- Fraija et al. [2018] N. Fraija, E. Aguilar-Ruiz, A. Galván-Gámez, A. Marinelli, and J. A. de Diego, Study of the PeV neutrino, -rays, and UHECRs around the lobes of Centaurus A, MNRAS 481, 4461 (2018), arXiv:1709.05766 [astro-ph.HE] .
- Matthews et al. [2018] J. H. Matthews, A. R. Bell, K. M. Blundell, and A. T. Araudo, Fornax A, Centaurus A, and other radio galaxies as sources of ultrahigh energy cosmic rays, MNRAS 479, L76 (2018), arXiv:1805.01902 [astro-ph.HE] .
- Anchordoqui et al. [1999] L. A. Anchordoqui, G. E. Romero, and J. A. Combi, Heavy nuclei at the end of the cosmic-ray spectrum?, Phys. Rev. D 60, 103001 (1999), arXiv:astro-ph/9903145 [astro-ph] .
- Anchordoqui [2018] L. A. Anchordoqui, Acceleration of ultrahigh-energy cosmic rays in starburst superwinds, Phys. Rev. D 97, 063010 (2018), arXiv:1801.07170 [astro-ph.HE] .
- Attallah and Bouchachi [2018] R. Attallah and D. Bouchachi, Ultrahigh energy cosmic rays from nearby starburst galaxies, Monthly Notices of the Royal Astronomical Society 478, 800–806 (2018).
- Romero et al. [2018] G. E. Romero, A. L. Müller, and M. Roth, Particle acceleration in the superwinds of starburst galaxies, A&A 616, A57 (2018), arXiv:1801.06483 [astro-ph.HE] .
- Anchordoqui and Soriano [2019] L. A. Anchordoqui and J. F. Soriano, Evidence for UHECR origin in starburst galaxies, arXiv e-prints , arXiv:1905.13243 (2019), arXiv:1905.13243 [astro-ph.HE] .
- Becker [2008] J. K. Becker, High-energy neutrinos in the context of multimessenger astrophysics, Reports on Progress in Physics 458, 173 (2008), arXiv:0710.1557 [astro-ph] .
- Ahlers and Halzen [2015] M. Ahlers and F. Halzen, High-energy cosmic neutrino puzzle: a review, Reports on Progress in Physics 78, 126901 (2015).
- Aartsen et al. [2018a] M. G. Aartsen et al., Multimessenger observations of a flaring blazar coincident with high-energy neutrino IceCube-170922A, Science 361, eaat1378 (2018a), arXiv:1807.08816 [astro-ph.HE] .
- Aartsen et al. [2018b] M. G. Aartsen et al. (IceCube Collaboration), Neutrino emission from the direction of the blazar TXS 0506+056 prior to the IceCube-170922A alert, Science 361, 147 (2018b), arXiv:1807.08794 [astro-ph.HE] .
- Aartsen et al. [2020] M. G. Aartsen et al. (IceCube Collaboration), Time-Integrated Neutrino Source Searches with 10 Years of IceCube Data, Phys. Rev. Lett. 124, 051103 (2020), arXiv:1910.08488 [astro-ph.HE] .
- Inoue et al. [2021] Y. Inoue, D. Khangulyan, and A. Doi, Gamma-ray and Neutrino Signals from Accretion Disk Coronae of Active Galactic Nuclei, Galaxies 9, 36 (2021), arXiv:2105.08948 [astro-ph.HE] .
- Anchordoqui et al. [2021] L. A. Anchordoqui, J. F. Krizmanic, and F. W. Stecker, High-Energy Neutrinos from NGC 1068, arXiv e-prints , arXiv:2102.12409 (2021), arXiv:2102.12409 [astro-ph.HE] .
- Kheirandish et al. [2021] A. Kheirandish, K. Murase, and S. S. Kimura, High-Energy Neutrinos from Magnetized Coronae of Active Galactic Nuclei and Prospects for Identification of Seyfert Galaxies and Quasars in Neutrino Telescopes, arXiv e-prints , arXiv:2102.04475 (2021), arXiv:2102.04475 [astro-ph.HE] .
- Inoue et al. [2020] Y. Inoue, D. Khangulyan, and A. Doi, On the Origin of High-energy Neutrinos from NGC 1068: The Role of Nonthermal Coronal Activity, ApJ 891, L33 (2020), arXiv:1909.02239 [astro-ph.HE] .
- Abdo et al. [2010] A. A. Abdo et al. (The Fermi LAT Collaboration), Fermi Large Area Telescope First Source Catalog, ApJS 188, 405 (2010), arXiv:1002.2280 [astro-ph.HE] .
- Eichmann and Becker Tjus [2016] B. Eichmann and J. Becker Tjus, The Radio-Gamma Correlation in Starburst Galaxies, Astrophys. J. 821, 87 (2016), arXiv:1510.03672 [astro-ph.HE] .
- Wang and Fields [2018] X. Wang and B. D. Fields, Are starburst galaxies proton calorimeters?, MNRAS 474, 4073 (2018), arXiv:1612.07290 [astro-ph.HE] .
- Whiteoak and Wilson [1990] J. B. Whiteoak and W. E. Wilson, Australia Telescope observations of excited-state OH transitions in NGC 4945., MNRAS 245, 665 (1990).
- Karachentsev et al. [2007] I. D. Karachentsev, R. B. Tully, A. Dolphin, M. Sharina, L. Makarova, D. Makarov, S. Sakai, E. J. Shaya, O. G. Kashibadze, V. Karachentseva, and L. Rizzi, The Hubble Flow around the Centaurus A/M83 Galaxy Complex, AJ 133, 504 (2007), arXiv:astro-ph/0603091 [astro-ph] .
- Heckman et al. [1990] T. M. Heckman, L. Armus, and G. K. Miley, On the Nature and Implications of Starburst-driven Galactic Superwinds, ApJS 74, 833 (1990).
- Nakai [1989] N. Nakai, Large optical filaments of the galaxy NGC 4945., PASJ 41, 1107 (1989).
- Schurch et al. [2002] N. J. Schurch, T. P. Roberts, and R. S. Warwick, High-resolution X-ray imaging and spectroscopy of the core of NGC 4945 with XMM-Newton and Chandra, Monthly Notices of the Royal Astronomical Society 335, 241 (2002).
- Iwasawa et al. [1993] K. Iwasawa, K. Koyama, H. Awaki, H. Kunieda, K. Makishima, T. Tsuru, T. Ohashi, and N. Nakai, X-Ray Evidence for Seyfert Activity Buried in the Infrared Galaxy NGC 4945, Astrophys. J. 409, 155 (1993).
- Done et al. [1996] C. Done, G. M. Madejski, and D. A. Smith, NGC 4945: The brightest seyfert 2 galaxy at 100 keV, The Astrophysical Journal 463, L63 (1996).
- Greenhill et al. [1997] L. J. Greenhill, J. M. Moran, and J. R. Herrnstein, The distribution of h2o maser emission in the nucleus of NGC 4945, The Astrophysical Journal 481, L23 (1997).
- Hillas [1984] A. M. Hillas, The origin of ultra-high-energy cosmic rays, Annual Review of Astronomy and Astrophysics 22, 425 (1984).
- Lemoine and Waxman [2009] M. Lemoine and E. Waxman, Anisotropy vs chemical composition at ultra-high energies, J. Cosmology Astropart. Phys. 2009, 009 (2009), arXiv:0907.1354 [astro-ph.HE] .
- Bell [2004] A. R. Bell, Turbulent amplification of magnetic field and diffusive shock acceleration of cosmic rays, MNRAS 353, 550 (2004).
- Wang et al. [2007] X.-Y. Wang, S. Razzaque, P. Mészáros, and Z.-G. Dai, High-energy cosmic rays and neutrinos from semirelativistic hypernovae, Phys. Rev. D 76, 083009 (2007).
- He et al. [2013] H.-N. He, T. Wang, Y.-Z. Fan, S.-M. Liu, and D.-M. Wei, Diffuse pev neutrino emission from ultraluminous infrared galaxies, Physical Review D 87, 10.1103/physrevd.87.063011 (2013).
- Bykov et al. [2018] A. M. Bykov, D. C. Ellison, A. Marcowith, and S. M. Osipov, Cosmic Ray Production in Supernovae, Space Sci. Rev. 214, 41 (2018), arXiv:1801.08890 [astro-ph.HE] .
- Torres [2004] D. F. Torres, Theoretical modeling of the diffuse emission of gamma rays from extreme regions of star formation: The case of ARP 220, The Astrophysical Journal 617, 966 (2004).
- Yoast-Hull et al. [2014] T. M. Yoast-Hull, I. Gallagher, J. S., E. G. Zweibel, and J. E. Everett, Active Galactic Nuclei, Neutrinos, and Interacting Cosmic Rays in NGC 253 and NGC 1068, Astrophys. J. 780, 137 (2014), arXiv:1311.5586 [astro-ph.HE] .
- Lacki and Beck [2013] B. C. Lacki and R. Beck, The equipartition magnetic field formula in starburst galaxies: accounting for pionic secondaries and strong energy losses, MNRAS 430, 3171 (2013), arXiv:1301.5391 [astro-ph.CO] .
- Trotta et al. [2011] R. Trotta, G. Jóhannesson, I. V. Moskalenko, T. A. Porter, R. Ruiz de Austri, and A. W. Strong, Constraints on Cosmic-ray Propagation Models from A Global Bayesian Analysis, Astrophys. J. 729, 106 (2011), arXiv:1011.0037 [astro-ph.HE] .
- Chevalier and Clegg [1985] R. A. Chevalier and A. W. Clegg, Wind from a starburst galaxy nucleus, Nature (London) 317, 44 (1985).
- Strickland and Heckman [2009] D. K. Strickland and T. M. Heckman, Supernova Feedback Efficiency and Mass Loading in the Starburst and Galactic Superwind Exemplar M82, Astrophys. J. 697, 2030 (2009), arXiv:0903.4175 [astro-ph.CO] .
- Caccianiga [2019] L. Caccianiga, Anisotropies of the Highest Energy Cosmic-ray Events Recorded by the Pierre Auger Observatory in 15 years of Operation, in 36th International Cosmic Ray Conference (ICRC2019), International Cosmic Ray Conference, Vol. 36 (2019) p. 206.
- Fraija et al. [2012] N. Fraija, M. M. González, M. Perez, and A. Marinelli, How Many Ultra-high Energy Cosmic Rays Could we Expect from Centaurus A?, Astrophys. J. 753, 40 (2012), arXiv:1204.4500 [astro-ph.HE] .
- Fraija and Marinelli [2016] N. Fraija and A. Marinelli, Neutrino, -Ray, and Cosmic-Ray Fluxes from the Core of the Closest Radio Galaxies, Astrophys. J. 830, 81 (2016), arXiv:1607.04633 [astro-ph.HE] .
- Fraija et al. [2019] N. Fraija, M. Araya, A. Galván-Gámez, and J. A. de Diego, Analysis of Fermi-LAT observations, UHECRs and neutrinos from the radio galaxy Centaurus B, J. Cosmology Astropart. Phys. 2019, 023 (2019), arXiv:1811.01108 [astro-ph.HE] .
- Kelner et al. [2006] S. R. Kelner, F. A. Aharonian, and V. V. Bugayov, Energy spectra of gamma rays, electrons, and neutrinos produced at proton-proton interactions in the very high energy regime, Phys. Rev. D 74, 034018 (2006).
- Fraija [2014a] N. Fraija, Correlation of -Ray and High-energy Cosmic Ray Fluxes from the Giant Lobes of Centaurus A, Astrophys. J. 783, 44 (2014a), arXiv:1312.6944 [astro-ph.HE] .
- Fraija [2014b] N. Fraija, GeV-PeV neutrino production and oscillation in hidden jets from gamma-ray bursts, MNRAS 437, 2187 (2014b), arXiv:1310.7061 [astro-ph.HE] .
- Fraija [2014c] N. Fraija, Gamma-ray fluxes from the core emission of Centaurus A: a puzzle solved, MNRAS 441, 1209 (2014c), arXiv:1402.4558 [astro-ph.HE] .
- Fraija [2015] N. Fraija, Resonant oscillations of GeV-TeV neutrinos in internal shocks from gamma-ray burst jets inside stars, MNRAS 450, 2784 (2015), arXiv:1504.00328 [astro-ph.HE] .
- Stecker et al. [1968] F. W. Stecker, S. Tsuruta, and G. G. Fazio, The Effects of the Decay of Nucleon Isobars and Hyperons on the Cosmic Gamma-Ray Spectrum, Astrophys. J. 151, 881 (1968).
- Stecker [1971] F. W. Stecker, Cosmic Gamma Rays (NASA SP-249; Baltimore, MD: Mono Book Coorp), (1971).
- Blumenthal and Gould [1970] G. R. Blumenthal and R. J. Gould, Bremsstrahlung, synchrotron radiation, and compton scattering of high-energy electrons traversing dilute gases, Rev. Mod. Phys. 42, 237 (1970).
- Schlickeiser [2002] R. Schlickeiser, Cosmic Rays Astrophysics (New York: Springer ), (2002).
- Stecker et al. [1992] F. W. Stecker, O. C. de Jager, and M. H. Salamon, TeV Gamma Rays from 3C 279: A Possible Probe of Origin and Intergalactic Infrared Radiation Fields, ApJ 390, L49 (1992).
- Dermer and Menon [2009] C. D. Dermer and G. Menon, High Energy Radiation from Black Holes: Gamma Rays, Cosmic Rays, and Neutrinos (Princeton University Press, 2009).
- Fraija et al. [2020] N. Fraija, E. Aguilar-Ruiz, and A. Galván-Gámez, Electron-positron pair plasma in TXS 0506+056 and the ’neutrino flare’ in 2014-2015, MNRAS 497, 5318 (2020), arXiv:2004.09772 [astro-ph.HE] .
- Inoue [2011] Y. Inoue, High Energy Gamma-ray Absorption and Cascade Emission in Nearby Starburst Galaxies, Astrophys. J. 728, 11 (2011), arXiv:1011.6511 [astro-ph.HE] .
- Finke et al. [2008] J. D. Finke, C. D. Dermer, and M. Böttcher, Synchrotron Self-Compton Analysis of TeV X-Ray-Selected BL Lacertae Objects, Astrophys. J. 686, 181 (2008), arXiv:0802.1529 [astro-ph] .
- Loeb and Waxman [2006] A. Loeb and E. Waxman, The cumulative background of high energy neutrinos from starburst galaxies, J. Cosmology Astropart. Phys. 2006, 003 (2006), arXiv:astro-ph/0601695 [astro-ph] .
- Murase et al. [2013] K. Murase, M. Ahlers, and B. C. Lacki, Testing the hadronuclear origin of PeV neutrinos observed with IceCube, Phys. Rev. D 88, 121301 (2013), arXiv:1306.3417 [astro-ph.HE] .
- Senno et al. [2015] N. Senno, P. Mészáros, K. Murase, P. Baerwald, and M. J. Rees, Extragalactic Star-forming Galaxies with Hypernovae and Supernovae as High-energy Neutrino and Gamma-ray Sources: the case of the 10 TeV Neutrino data, Astrophys. J. 806, 24 (2015), arXiv:1501.04934 [astro-ph.HE] .
- Xiao et al. [2016] D. Xiao, P. Mészáros, K. Murase, and Z.-G. Dai, Revisiting the contributions of supernova and hypernova remnants to the diffuse high-energy backgrounds: constraints on very high redshift injection, The Astrophysical Journal 826, 133 (2016).
- Ahlers and Halzen [2017] M. Ahlers and F. Halzen, IceCube: Neutrinos and multimessenger astronomy, Progress of Theoretical and Experimental Physics 2017, 10.1093/ptep/ptx021 (2017), 12A105.
- Lenc and Tingay [2008] E. Lenc and S. J. Tingay, The sub-parsec scale radio properties of southern starburst galaxies. ii. supernova remnants, the supernova rate, and the ionised medium in the ngc 4945 starburst, The Astronomical Journal 137, 537–553 (2008).
- Bendo et al. [2016] G. J. Bendo, C. Henkel, M. J. D’Cruze, C. Dickinson, G. A. Fuller, and A. Karim, Free–free and H42 emission from the dusty starburst within NGC 4945 as observed by ALMA, Monthly Notices of the Royal Astronomical Society 463, 252 (2016).
- Strickland et al. [2004] D. K. Strickland, T. M. Heckman, E. J. M. Colbert, C. G. Hoopes, and K. A. Weaver, A high spatial resolution x‐ray and h study of hot gas in the halos of star‐forming disk galaxies. i. spatial and spectral properties of the diffuse x‐ray emission, The Astrophysical Journal Supplement Series 151, 193–236 (2004).
- Brock et al. [1988] D. Brock, M. Joy, D. F. Lester, P. M. Harvey, and J. Ellis, H. Benton, Far-Infrared Observations of a Luminous Dust-shrouded Source in the Nucleus of NGC 4945, Astrophys. J. 329, 208 (1988).
- Robert C. Kennicutt [1998] J. Robert C. Kennicutt, The global schmidt law in star-forming galaxies, The Astrophysical Journal 498, 541 (1998).
- Curran et al. [2001] S. J. Curran, L. E. B. Johansson, P. Bergman, A. Heikkilä, and S. Aalto, Molecular gas conditions in NGC 4945 and the Circinus galaxy, A&A 367, 457 (2001).
- Chang and Wang [2014] X.-C. Chang and X.-Y. Wang, The Diffuse Gamma-Ray Flux Associated with Sub-PeV/PeV Neutrinos from Starburst Galaxies, Astrophys. J. 793, 131 (2014), arXiv:1406.1099 [astro-ph.HE] .
- Lenain et al. [2010] J.-P. Lenain, C. Ricci, M. Türler, D. Dorner, and R. Walter, Seyfert 2 galaxies in the gev band: jets and starburst, A&A 524, A72 (2010).
- Dermer [2007] C. D. Dermer, On Gamma Ray Burst and Blazar AGN Origins of the Ultra-High Energy Cosmic Rays in Light of First Results from Auger, arXiv e-prints , arXiv:0711.2804 (2007), arXiv:0711.2804 [astro-ph] .
- Cherenkov Telescope Array Consortium et al. [2019] Cherenkov Telescope Array Consortium, B. S. Acharya, I. Agudo, I. Al Samarai, R. Alfaro, and et al., Science with the Cherenkov Telescope Array (2019).
- Guetta and Valle [2007] D. Guetta and M. D. Valle, On the rates of gamma-ray bursts and type ib/c supernovae, The Astrophysical Journal 657, L73 (2007).
- Gaisser [1990] T. K. Gaisser, Cosmic rays and particle physics. (1990).
- Caprioli [2012] D. Caprioli, Cosmic-ray acceleration in supernova remnants: non-linear theory revised, Journal of Cosmology and Astroparticle Physics 2012 (07), 038–038.
- Condon [1992] J. J. Condon, Radio emission from normal galaxies., Annual Rev. of Astronomy and Astrophysics 30, 575 (1992).
- Wang et al. [2007] X.-Y. Wang, S. Razzaque, P. Mészáros, and Z.-G. Dai, High-energy cosmic rays and neutrinos from semirelativistic hypernovae, Phys. Rev. D 76, 083009 (2007), arXiv:0705.0027 [astro-ph] .
- Wang et al. [2008] X.-Y. Wang, S. Razzaque, and P. Mészáros, On the Origin and Survival of Ultra-High-Energy Cosmic-Ray Nuclei in Gamma-Ray Bursts and Hypernovae, Astrophys. J. 677, 432 (2008), arXiv:0711.2065 [astro-ph] .
- Lipari et al. [1997] S. Lipari, Z. Tsvetanov, and F. Macchetto, Luminous infrared galaxies. II. NGC 4945: A nearby obscured starburst/seyfert nucleus, The Astrophysical Journal Supplement Series 111, 369 (1997).
- Venturi et al. [2017] G. Venturi, A. Marconi, M. Mingozzi, S. Carniani, G. Cresci, G. Risaliti, and F. Mannucci, Ionized gas outflows from the MAGNUM survey: NGC 1365 and NGC 4945, Frontiers in Astronomy and Space Sciences 4, 46 (2017), arXiv:1801.05448 [astro-ph.GA] .
- Elmouttie et al. [1997] M. Elmouttie, R. F. Haynes, K. L. Jones, M. Ehle, R. Beck, J. I. Harnett, and R. Wielebinski, The radio continuum structure of the edge-on spiral galaxy NGC 4945, MNRAS 284, 830 (1997).
- Anchordoqui and Torres [2020] L. A. Anchordoqui and D. F. Torres, Exploring the superwind mechanism for generating ultrahigh-energy cosmic rays using large-scale modeling of starbursts, Physical Review D 102, 10.1103/physrevd.102.023034 (2020).
- Liu et al. [2014] R.-Y. Liu, X.-Y. Wang, S. Inoue, R. Crocker, and F. Aharonian, Diffuse PeV neutrinos from EeV cosmic ray sources: Semirelativistic hypernova remnants in star-forming galaxies, Phys. Rev. D 89, 083004 (2014), arXiv:1310.1263 [astro-ph.HE] .
- Fraija et al. [2017] N. Fraija, A. Marinelli, A. Galván-Gámez, and E. Aguilar-Ruiz, Modeling the spectral energy distribution of the radio galaxy IC310, Astroparticle Physics 89, 14 (2017), arXiv:1701.06173 [astro-ph.HE] .
- Longair [2011] M. S. Longair, High Energy Astrophysics (3rd ed.; Cambridge: Cambridge Univ. Press), (2011).