Modelling size distributions of marine plastics under the influence of continuous cascading fragmentation
Abstract
Field studies have shown that plastic fragments make up the majority of plastic pollution in the oceans in terms of abundance. How quickly environmental plastics fragment is not well understood, however. Here, we study this fragmentation process by considering a model which captures continuous fragmentation of particles over time in a cascading fashion. With this cascading fragmentation model we simulate particle size distributions (PSDs), specifying the abundance or mass of particles for different size classes. The fragmentation model is coupled to an environmental box model, simulating the distributions of plastic particles in the ocean, coastal waters, and on the beach. We compare the modelled PSDs to available observations, and use the results to illustrate the effect of size-selective processes such as vertical mixing in the water column and resuspension of particles from the beach into coastal waters. The model quantifies the role of fragmentation on the marine plastic mass budget: while fragmentation is a major source of (secondary) plastic particles in terms of abundance, it seems to have a minor effect on the total mass of particles larger than 0.1 mm. Future comparison to observed PSD data allow us to understand size-selective plastic transport in the environment, and potentially inform us on plastic longevity.
1 Introduction
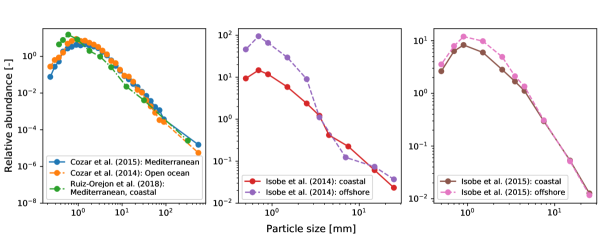
Studies have shown that fragments make up the majority of marine plastic litter in terms of abundance (Cózar et al., 2015; Suaria et al., 2016). The large amount of fragments is evident from particle size distribution (PSD) data, specifying the abundance or mass of particles for different size classes. An overview of PSD data from various studies is given in Kooi and Koelmans (2019); some examples are presented in figure 1. What is commonly observed in PSD data is a power law for larger fragments (1 mm in figure 1), resulting in a straight line on a log-log scale. Oftentimes, a maximum in the PSD is observed at smaller particle sizes (1 mm in figure 1), ending the power law regime.
If we want to explain the particular shapes of measured PSD data, we should first investigate the fragmentation process. Fragmentation of plastics is likely dominant on beaches, where plastics are subjected to UV-radiation, oxidation, and higher temperatures, embrittling the particles, which enhances the breaking down of particles by mechanical abrasion (Andrady, 2011; Kalogerakis et al., 2017; Song et al., 2017; Efimova et al., 2018). Fragmentation models have been proposed in e.g. Cózar et al. (2014), hypothesising that the PSD slope depends on whether particles break down in a three-dimensional fashion (i.e. like a cube), or more in a two-dimensional fashion (like a thin sheet).
While the main driver behind the PSD might be fragmentation, physical processes can have a size-selective influence on plastic particles (van Sebille et al., 2020). Vertical mixing has been shown to influence PSDs measured in the water (Reisser et al., 2015; Poulain et al., 2019). Assuming similar particle shapes and densities, smaller particles tend to have lower rise velocities due to a lower buoyancy which counteracts the water friction. Turbulent mixing, induced by for example the wind, will therefore distribute these smaller particles across larger depths (Kukulka et al., 2012; Chor et al., 2018), reducing smaller size fractions in PSDs measured by nets at the ocean surface (typically submerged 10–50 centimeters depending on net type, see e.g. Pedrotti et al. (2016), Cózar et al. (2015), and Suaria et al. (2016)).
Size-selective lateral transport of plastic particles is likely to influence the PSD shape as well. Floating particles experience a net drift caused by waves at the ocean surface, i.e. Stokes drift (Stokes, 1847). Bigger (more buoyant) particles likely experience more influence from Stokes drift, given its limited depth of influence (Bremer and Breivik, 2017; Breivik et al., 2016). Model studies have shown that Stokes drift tends to push particles towards coastal areas (Iwasaki et al., 2017; Onink et al., 2019; Delandmeter and Sebille, 2019). In Isobe et al. (2014) it was shown that PSD data obtained close to the coast indeed showed relative overabundances of larger plastic particles. In figure 1 this is illustrated by differentiating between coastal and offshore areas: relatively high abundances of small fragments in the open ocean can be seen.
Coastal processes, such as beaching and resuspension, can be size-selective. In Hinata et al. (2017), residence times of particles on beaches were estimated using tagged litter. Higher particle rise velocities in the water were related to longer residence times, as these particles are more likely to be pushed to the backshore by wave swash. This could mean that larger objects remain longer on beaches, and hence experience more weathering (Hinata et al., 2020).
Finally, PSDs could be influenced by size selective sinking, induced by for example biofouling (Ryan, 2015). Biofouling models predict that smaller particles, which have a larger surface to volume ratio, tend to sink more quickly (Kooi et al., 2017). This has been observed in experimental studies as well (Fazey and Ryan, 2016).
In this work, we first consider a fragmentation model, based on fractal theory (Turcotte, 1986; Charalambous, 2015). We will use this model to simulate how PSDs resulting from fragmentation might evolve over time. Afterwards, we couple this fragmentation model to a conceptual box model, simulating movement of plastic particles between the beach, coastal water, and open ocean. Different particle sizes experience different forcings in this model, under the influence of wind-induced turbulence (Kukulka et al., 2012; Poulain et al., 2019), size-selective transport due to Stokes drift (Breivik et al., 2016), and size-selective resuspension from beaches (Hinata et al., 2017). We will compare the modelled PSDs to available observations.
Instead of counting the amount of particles in a given size-range, one can also measure their mass. In this work, we make a distinction between the two, by considering a number (i.e. abundance) size distribution (NSD), and a mass size distribution (MSD). The term PSD is used when applicable to both.
2 Methodology
2.1 The cascading fragmentation model
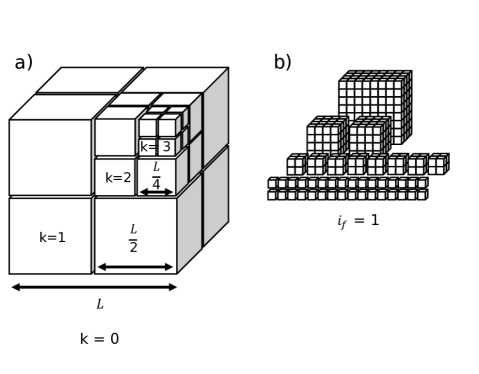
The fragmentation model discussed here is based on simple fractal geometries. We define the spatial dimension as . When , we start with a cube with a size of which we call the parent object, see figure 2a. This cube can be split in eight equally-sized cubes, which can each be recursively split again. The size class of the parent object is defined as , the size class of the cubes with length is defined as , and so on. When , the starting object is a sheet instead of a cube, which can be split in four smaller sheets each time the size class increases.
Cózar et al. (2014) presented a fragmentation model where objects are broken down into a set of smaller (equally sized) fragments in a series of successive fragmentation events. This fragmentation model was used to explain why measured PSDs often resemble power laws, i.e. functions of the form
| (1) |
where is the abundance, is the particle size, is the power law slope, and is a constant. However, this fragmentation model requires a constant input of new parent objects to achieve a power law, while laboratory experiments have shown that power laws in the PSD also appear after fragmenting a single input of parent objects (Song et al., 2017).
The fragmentation model used here builds upon the work of Turcotte (1986), where it was noted that scale-invariance of the fragmentation process, whether it be caused by weathering, explosions, or impacts, leads to such a power law. The idea behind the model of Turcotte (1986) can be illustrated using figure 2b. Following one fragmentation event , a certain fraction of the original cube (size class ) splits off. For example, if , this results in 4 fragments of splitting off, leaving 0.5 object in size class . This process is assumed to be scale invariant: a fraction will split off from the fragments in size class as well: 16 fragments of size class are created, and fragments are left in size class . This process is repeated indefinitely.
Bird et al. (2009) and Gregory et al. (2012) extended this model by including a temporal component, with each fragment breaking down further as progresses. Charalambous (2015) showed that repeatedly breaking down fragments over discrete steps of is a sequence of independent and identical Bernoulli trials with a chance of success , yielding a negative binomial distribution. This is rewritten in terms of a continuous fragmentation index (instead of the discrete ), yielding a probability density function giving the mass in size class at fragmentation index as:
| (2) |
where is the gamma function. We will call this the cascading fragmentation model. We assume that is directly proportional to time in the environment, and will review this assumption in the discussion.
We assume to be a material property. The amount of fragments in a given size class is estimated by multiplying the mass with , a factor determining how many fragments of size class fit inside the parent object:
| (3) |
We use as the baseline. However, this factor is for purely flat objects like plastic sheets and for fibers or lines. As real-world samples contain a combination of these objects, the value for in the environment can be a non-integer between 1 and 3.
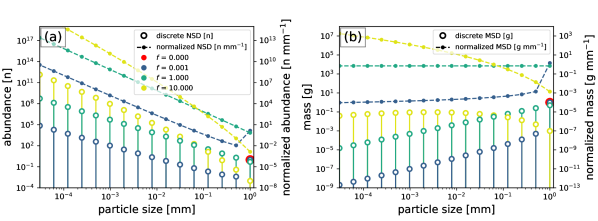
Figure 3a shows the NSD resulting from the cascading fragmentation model at various fragmentation indices . We start with one cube with a length of 1 mm at . The continuous description in (3) allows us to model the amount of fragments at a very small fragmentation index of . There are few larger fragments ( mm) per parent object at this stage. At we have exactly a power law in the NSD, equivalent to the model by Turcotte (1986). A fractal dimension of the object formed by all fractions can be defined, relating to and by:
| (4) |
The NSD power law slope at is given by this fractal dimension.
Fragments can be broken down further, eventually resulting in the NSD shown for . This is not a power law anymore, and the slope of this curve has increased significantly, with relatively many particles in the small size classes. The NSD (units: n) can be normalized, by dividing the amount of fragments by the size class bin width (units: n mm-1). These normalized NSDs are presented by the dashed lines. Because of the log-scale on the x-axis, the distance between the given particle sizes increases by a constant factor. This increases the magnitude of the normalized NSD slopes by 1 compared to the discrete NSD. These normalized NSDs allow for comparison between different studies, and are therefore usually reported in literature.
Figure 3b shows the same analysis in terms of mass, i.e. the MSD, starting with one cube of 1 g and 1 mm3. As fragmentation progresses, mass shifts from the large fragments towards smaller fragments. At we have a power law: the difference in the slope between the NSD and MSD is 3, resulting from the term in (3), with .
2.2 Environmental box model
With the cascading fragmentation model we can now simulate PSDs over time. How particles are affected by the environment varies for different particle sizes, however. The combination of fragmentation and size-selective transport is investigated using a box model, presented in figure 4. The boxes in this model represent three different environmental regions: the beach, coastal waters, and open ocean.
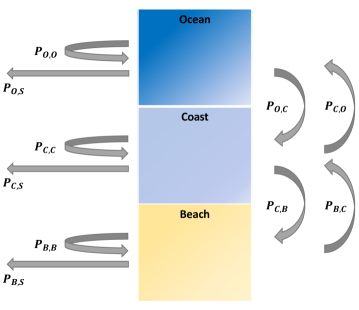
Particles can move between the different environments, defined by a set of transition probabilities (): particles can move to a different environmental box (the arrows on the right in figure 4), remain in the current box (recurring arrows on the left), or vanish from the system (i.e. a sink, arrows on the left). Subscripts in figure 4 denote ocean, coast, beach, or sink (O, C, B, and S respectively).
Besides different environmental regions, we have different particle size classes. For a given size class, certain mass fractions will move to smaller size classes under the influence of fragmentation. These fractions are estimated by evaluating (2) for the given time step of the box model. Similarly, (3) is evaluated to determine the abundance of fragments moving to smaller size classes. Fragmentation is assumed to only happen on the beach, where degradation is expected to be much more effective than in the sea (Efimova et al., 2018).
Each environmental box contains a range of different particle size classes. The combination of environmental transition probabilities and fragmentation is modelled using a transition matrix. For example, taking 15 different size classes and 3 environmental compartments leads to a transition matrix of size . Further details are given in the supplementary material (section S2).
Environmental transition probabilities are based on previous findings from literature, and are discussed in the next paragraphs. A set of baseline parameters are varied in the box model to investigate their influence on the modelled PSDs. Where possible, box model parameters are calibrated for the Mediterranean sea, for which plastic sources and transport estimates are available (Kaandorp et al., 2020). For fragmentation we have two unknown parameters: in (2), and a fragmentation rate relating to time in the environment. These are estimated by comparing the model to experimental weathering data from Song et al. (2017), presented in the results section.
We assume that new plastic objects are introduced on the beach, and assume an initial length of 200 mm based on typical dimensions of municipal plastic waste, see the supplementary material (section S4). We use as the baseline, i.e. cubical-shaped objects. The model time step is set to one week.
Ocean Transport
A Lagrangian simulation of floating plastic in the Mediterranean, see Kaandorp et al. (2020), is used to determine transition probabilities within and between the ocean and coast (, , , and ). The coast is defined as the ocean within 15 kilometers of the coastline.
The baseline transition probabilities are set to a uniform value for all particle sizes, assuming they reside at the ocean surface where they experience the maximum Stokes drift. We will then evaluate the influence of size-selective lateral transport, induced by vertical mixing of particles and differences in Stokes drift over depth, see Isobe et al. (2014) and Iwasaki et al. (2017) for similar approaches. Vertical mixing of particles is estimated using the approach from Poulain et al. (2019): for given particle sizes, the rise velocity is estimated by assuming ellipsoid particles with a density of . From this rise velocity we estimate the median particle depth, using the particle density profiles from Kukulka et al. (2012). The Stokes drift is estimated at this depth, assuming a Stokes profile based on the Phillips wave spectrum, see Breivik et al. (2016). For this Stokes drift, the transition probabilities are estimated using Lagrangian model simulations (Kaandorp et al., 2020) with different Stokes drift factors. See the supplementary material (section S3) for more information.
Beaching and resuspension
Using the same approach as in Kaandorp et al. (2020), we estimate by analysing drifter buoy data: from a set of 1682 drifters in the Mediterranean (Menna et al., 2017), we calculate how much time these drifters spend near the coast before beaching. For drifter buoys within 15 kilometers of the coastline, the beaching rate is estimated to be about day-1 (corresponding to an e-folding time-scale of 149 days). In Kaandorp et al. (2020) it was estimated that for plastic particles is about 3 times lower than that for drifter buoys. We will therefore use = 50 days as the baseline estimate here.
In Hinata et al. (2017), tagged litter on beaches was tracked over 1–2 years, to estimate their residence times . As a baseline estimate we use days, reported for small plastic floats (corresponding to day-1). We will also look at the effect of size-selective resuspension, for which the empirical relation from Hinata et al. (2017) is used, i.e.,
| (5) |
where is given in days, and in m s-1.
Sinks
The box model also requires transition probabilities for removal of particles: , , . We assume these are the same in all compartments, denoted by . A given value for yields a certain amount of steady-state mass in the system. We take the estimated input of waste into the Mediterranean from Kaandorp et al. (2020) (2,500 metric tonnes for the year 2015), and the estimated total floating mass from Cózar et al. (2015) (2,000 metric tonnes). The value for is iterated until this mass balance is satisfied, see the supplementary material (section S2) for more information.
3 Results
3.1 Calibration with laboratory experiments
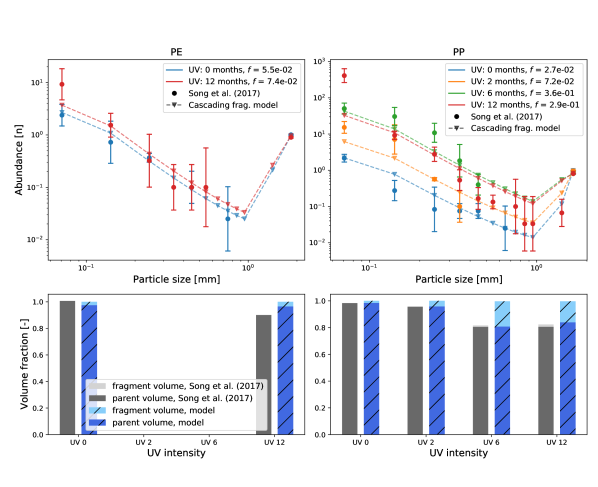
In Song et al. (2017), plastic pellets were subjected to different levels of UV exposure and to 2 months of mechanical abrasion with sand, simulating a beach environment. We use these data to calibrate the cascading fragmentation model. The data for polyethylene (PE) and polypropylene (PP) pellets (26 mm3 and 19 mm3 respectively) are used, as these are the most abundant polymers in surface ocean (Bond et al., 2018).
We assume a single value per material, and . The fragmentation index is allowed to vary between the different levels of UV exposure when fitting the data. By fixing and varying , we get a robust estimate for the unknown parameter for which we need a plausible value in the box model. We can expect that is larger for particles subjected to longer periods of UV exposure, since embrittlement will make it easier for the mechanical abrasion to wear down the particles.
Resulting NSD fits using weighted least squares are presented in figure 5, top row, fitted values for are presented in the legend. For PE particles, the best fit results in = 0.39, for PP particles = 0.45. The experimental data are still at the early stage of fragmentation (), with few fragments per parent pellet, except for small fragment sizes.
There is a good fit for the PE data, with almost all simulations within the data errorbars (one relative standard deviation). For PP there is a good fit for 0, 2 and 6 months of UV exposure. At 12 months of UV exposure there is more mismatch for the smallest size class (0.05–0.10 mm). This is also the only case where the estimated is lower than for the previous level of UV exposure.
The bottom row of figure 5 compares the estimated volume fractions of the parent pellets and the fragments. Generally, the modelled volume fraction of the parent pellet is estimated well, although there is some overprediction for PE with 12 months of UV exposure. The modelled fragment volumes are higher than the ones estimated in Song et al. (2017). A possible explanation is that some of the larger fragments, which contribute to most of the volume when (see figure 3), could have been missed in the experimental setting since there are very few of these per parent object (e.g. tenths or hundredths).
Following this analysis, we set to 0.4 in the box model, within the range of fitted for PE and PP. A fragmentation rate needs to be chosen, specifying how much increases per unit time. Following Song et al. (2017) we assume that 12 months of laboratory UV exposure is roughly related to 4.2 years of environmental exposure. Taking our estimated fragmentation indices for PE and PP results in fragmentation rates of year-1 to year-1. The value for PE is used as the baseline here, given it is the most common environmental polymer (Bond et al., 2018). We acknowledge that this fragmentation rate is still very uncertain, and might vary non-linearly with time in reality.
3.2 Modelled environmental particle size distributions
Now that we have estimates for the transition probabilities in the box model and estimates for the fragmentation parameters, we can simulate PSDs in the environment. We will quantify the power law slope of the results by numerically maximizing the log-likelihood of the data (Virkar and Clauset, 2014):
| (6) |
where are the bin boundaries used to discretize the data, containing samples in the bin with index , and . In some cases, not the entire particle size range adheres to a power law. The lower bound of the power law domain is estimated by minimizing the Kolmogorov-Smirnov statistic between the modelled NSD and the theoretical power law NSD (Virkar and Clauset, 2014).
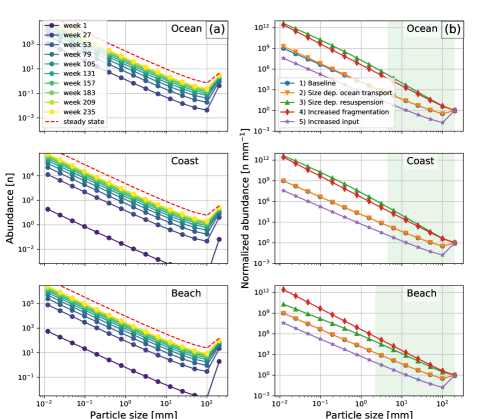
NSDs resulting from the box model are shown in figure 6, corresponding MSDs and a table with parameter settings can be found in the supplementary material (section S1). Fragmentation is expected to increase the fraction of small particles, increasing over time (see figure 3). However, environmental sinks limit the magnitude of : assuming a constant removal rate of plastic particles, smaller fragments, which tend to be older, have a higher probability of being removed from the environment. This combination of fragmentation and environmental sinks eventually leads to an equilibrium, or statistical steady state. This is illustrated in figure 6a using the box model with the baseline parameters described in section 2.2. As time progresses, the relative proportion of fragments to parent objects increases. In this scenario, it takes on the order of years for the NSD to resemble the steady state (red dashed line). The magnitude of the environmental sinks is high enough to avoid long persistence of fragmented particles: there are still relatively many parent objects, and is still below the value derived from the fractal dimension of from (4).
Steady state NSDs for different scenarios are presented in figure 6b. Results for the baseline parameters (blue lines) almost overlap with the results where size-selective lateral transport is added to the box model, induced by vertical mixing and Stokes drift (orange lines). In the baseline scenario for all three NSDs. When adding size-selective ocean transport, larger particles tend to move more frequently from the ocean to the coast. This results in slightly more small particles in the ocean box, increasing the power law slope here to . Adding size-selective resuspension of particles (Hinata et al., 2017) has a strong effect (green lines). Bigger objects have longer residence times on the beach, and therefore undergo more fragmentation. This produces a large number of smaller fragments with shorter residence times, which therefore move more rapidly to the coastal and ocean cells. This near-shore trapping of larger plastic objects was already hypothesized in e.g. Isobe et al. (2014). The empirical resuspension relation (5) causes the model to deviate from a power law, the domain over which is calculated is shaded in green in figure 6. The model yields on the beach, which is lower than in the coastal and ocean cells (both ). A scenario where the fragmentation rate is based on polypropylene instead of polyethylene is presented (red lines). Fragmentation breaks down the particles more quickly: a monotonic relation between particle size and abundance is observed, with . Finally, a scenario is presented (purple lines) where the input of plastic waste into the Mediterranean is 100,000 tonnes per year (Liubartseva et al., 2018; Jambeck et al., 2015), instead of the aforementioned 2,500 tonnes per year (Kaandorp et al. (2020)). The magnitude of the sinks needs to be much larger now to attain a mass balance based on 2,000 tonnes of floating plastics (Cózar et al., 2015). Fragmentation has little time to break down the particles, resulting in relatively few fragments per parent object.
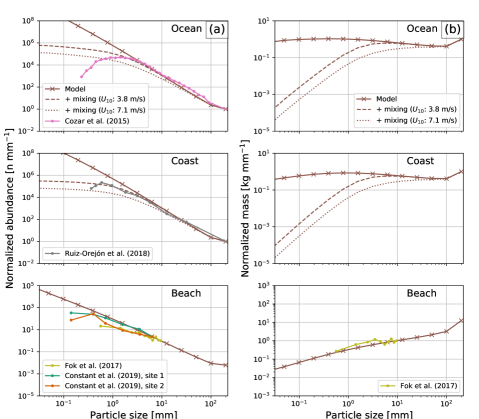
In figure 7, we compare PSDs resulting from the box model with observed ones. In the model results we include both size dependent ocean transport and resuspension. Fragmentation parameters are set to week-1, and , resulting in good agreement with the observed PSDs. The effect of vertical turbulent mixing of fragments using the model from Poulain et al. (2019) is shown as well (calm, m/s, and above average, m/s conditions based on the 30% and 70% quantile of Mediterranean sea weather conditions (Hersbach et al., 2020), see supplementary material section S3), assuming a submerged net depth of 25 centimeters. Figure 7a presents the resulting NSDs. Under calm wind and wave conditions there is good agreement between the modelled and observed NSDs. Vertical mixing causes the NSD to deviate from the power law around 3 milimeters, similar to the NSDs measured by Cózar et al. (2015) and Ruiz-Orejón et al. (2018). Many of the smaller fragments are expected to be mixed below the net depth, resulting in measuring only a fraction of small fragments. This, combined with a size detection limit effect where elongated particles escape from meshes smaller than their maximum length (Abeynayaka et al., 2020), could explain a part of the underabundance of sub-milimeter fragments in observations. Measurement campaigns with much smaller size-detection limits than the standard neuston nets (see e.g. Kooi and Koelmans (2019)) show increasing abundances for sub-milimeter fragments. It is therefore unlikely that the underabundance of sub-milimeter fragments is explained by an increased loss of these particles, suggested in some studies (Cózar et al., 2014; Pedrotti et al., 2016).
Resulting power law slopes are presented in table 1, as well as the estimated power law size range. The model predicts a slightly larger in the ocean compared to the coast. A similar difference is seen between the chosen sets of measurements near the coast (Ruiz-Orejón et al., 2018) and further away from the coast (Cózar et al., 2015), although this difference is not significant. Including vertical mixing has a strong effect on the estimated .
Few PSD measurements are available for beaches. Two examples are shown in figure 7a: one from the Mediterranean (Constant et al., 2019), and one for which both the NSD and MSD were available (Fok et al., 2017). The measurements on beaches have much lower values for compared to measurements in the water. This is also captured by the model, meaning size-selective resuspension indeed seems to play an important role. At the beach the modelled values are higher than the measured ones, which might indicate that size-selective beaching should be taken in account as well.
Figure 7b presents the modelled MSDs. Vertical mixing has a large influence on the measured mass for small particle sizes: even under calm conditions, the measured mass for particles of 0.1 mm is almost three orders of magnitude lower than without mixing. Unfortunately, there is very limited observational data reporting MSDs, so the comparison to data is more limited than for the NSDs in figure 7a. On beaches, the model matches the set of measurement well, but more data are necessary to further verify this. Large fragments are expected to dominate in terms of mass on beaches. In the water, seems to be approximately zero on average. This would mean that the mass contribution would scale roughly quadratically for an increasing size class , i.e. large fragments also dominate in terms of mass here.
| Domain | Minimum size | |
|---|---|---|
| Ocean | 2.73 | mm |
| Ocean + mixing ( m/s) | 2.63 | mm |
| Ocean + mixing ( m/s) | 2.37 | mm |
| Cózar et al. (2015) | mm | |
| Coast | 2.69 | mm |
| Coast + mixing ( m/s) | 2.60 | mm |
| Coast + mixing ( m/s) | 2.34 | mm |
| Ruiz-Orejón et al. (2018) | mm | |
| Beach | 2.02 | mm |
| Fok et al. (2017) | mm | |
| Constant et al. (2019) | , | mm |
The environmental box model used to model the PSDs is a useful tool for future mass balance studies. The steady-state with the model settings used for figure 7, gives that about 98% of the mass in the system is on the beach, about 2% in the coastal surface water, and about 0.2% in the surface open ocean. This large fraction of plastics stranding is in good agreement with previous mass balance estimates (Lebreton et al., 2019). It should be noted that other environmental regions, like the ocean floor, are not included in these numbers as these are part of the sinks in the box model (), which continuously take up more mass over time. Secondary microplastics generation can be estimated: for the same model settings, about of the macroplastic ( mm) mass breaks down into microplastics per week, about of microplastics become smaller than 0.1 mm. This is orders of magnitude smaller than the estimated sinks, taking up about of the plastic mass per week. Longevity of plastics can be estimated: taking a sudden stop of new plastics, it would take about 176 years for 99% of the plastic mass to disappear from the surface water and beaches. This is a much longer time scale than given by the conceptual model in Koelmans et al. (2017), where for a similar stop of new plastics, almost all plastic mass was removed from the ocean surface layer within three years.
4 Conclusions and discussion
Modelling size distributions of marine plastics under the influence of continuous cascading fragmentationrtical mixing in the water column has a strong impact on measured PSDs.
Understanding the nature of PSDs and how they differ in environmental regions can help close the marine plastic mass budget. It can be estimated which particle sizes contribute to most of the mass, as well as how persistent these are. The environmental box model is highly idealized using e.g. the assumption that the removal rate is the same in all compartments. Combined with more data and complex models (Kaandorp et al., 2020), this type of box model can be very valuable because different input and fragmentation scenarios can quickly be evaluated to assess whether these lead to realistic PSDs.
The environmental box model was calibrated to Mediterranean sea data as much as possible. However, resuspension probabilities from Hinata et al. (2017) were estimated on beaches in Japan, and in Song et al. (2017) the experimental weathering was related to environmental time in South Korea. Further studies are necessary on how the parameters might vary globally.
The fragmentation model introduced in Cózar et al. (2014) focused mainly on spatial dimensionality: in the NSD was related to three-dimensional fragmentation, i.e. a cube splitting into 8 smaller cubes. Care should be taken in future studies that when working with logarithmic binning, the normalized NSD (units: n mm-1) slope decreases by one compared to the discrete NSD (units: n), see figure 3. This was overlooked in Cózar et al. (2014): would correspond to two-dimensional fragmentation with their model, see the supplementary material (section S5) for further explanation. Normalization is also important to take in account when describing plastic particle size in terms of a probability density function (Kooi and Koelmans, 2019), specifying the probability per unit length (units: mm-1). Finally, estimating is not trivial: fitting straight lines on log-log transformed data induces large biases, maximum likelihood approaches are more suitable, see e.g. Newman (2005) and Virkar and Clauset (2014).
The cascading fragmentation model by Charalambous (2015) used in this work, is able to model many small chips breaking away from a parent object, and showed good correspondence with experimental data from Song et al. (2017) (figure 5). In the cascading fragmentation model, the fraction of small particles keeps increasing over time, increasing . We hypothesise that the value of in the environment remains limited, due to the fact that smaller particles tend to be older, and hence are more likely to be removed by environmental sinks.
Future studies should further validate the cascading fragmentation model. We assumed that and time are directly proportional here, which does not necessarily needs to be the case. In e.g. Charalambous (2015), it was shown that grinding can become less efficient as particles become smaller, which might lead to a logarithmic relation instead. Fragmentation of plastics is interesting in this sense: oxidation of plastics causes a brittle surface layer with microcracks (Andrady, 2011), perhaps increasing the fragmentation rate below a certain length scale, dependent on how far UV radiation penetrates the polymer.
MSD data is currently lacking: more data would help us to verify whether the larger size classes indeed make up most of the environmental plastic mass. More PSD data from beaches would allow for better constraining residence times of plastic particles on beaches and in coastal waters, and more data from marine sediment might give insight in the role of size-selective sinking, induced by e.g. biofouling (Kooi et al., 2017).
Acknowledgements
This work was supported through funding from the European Research Council (ERC) under the European Union Horizon 2020 research and innovation programme (grant agreement No 715386). This work was carried out on the Dutch national e-infrastructure with the support of SURF Cooperative (project no. 16371). We would like to thank Dr. Wonjoon Shim and Dr. Young Kyoung Song for their data on plastic fragmentation, Marie Poulain for providing data on particle sizes and vertical mixing, Dr. Andrés Cózar and Dr. Atsuhiko Isobe for providing raw particle size distribution data.
References
- Abeynayaka et al. (2020) Amila Abeynayaka, Fujio Kojima, Yoshikazu Miwa, Nobuhiro Ito, Yasuo Nihei, Yu Fukunaga, Yuga Yashima, and Norihiro Itsubo. Rapid sampling of suspended and floating microplastics in challenging riverine and coastal water environments in Japan. Water, 12(1903), 2020. ISSN 20734441. doi: 10.3390/w12071903.
- Andrady (2011) Anthony L. Andrady. Microplastics in the marine environment. Marine Pollution Bulletin, 62(8):1596–1605, 2011. ISSN 0025326X. doi: 10.1016/j.marpolbul.2011.05.030. URL http://dx.doi.org/10.1016/j.marpolbul.2011.05.030.
- Bird et al. (2009) N R A Bird, A M Tarquis, and A P Whitmore. Modeling Dynamic Fragmentation of Soil. Vadose Zone Journal, 8(1):197–201, 2009. doi: 10.2136/vzj2008.0046.
- Bond et al. (2018) Tom Bond, Veronica Ferrandiz-mas, Mónica Felipe-sotelo, and Erik Van Sebille. The occurrence and degradation of aquatic plastic litter based on polymer physicochemical properties : A review. Critical Reviews in Environmental Science and Technology, 48(7-9):685–722, 2018. doi: 10.1080/10643389.2018.1483155.
- Breivik et al. (2016) Øyvind Breivik, Jean Raymond Bidlot, and Peter A.E.M. Janssen. A Stokes drift approximation based on the Phillips spectrum. Ocean Modelling, 100:49–56, 2016. ISSN 14635003. doi: 10.1016/j.ocemod.2016.01.005.
- Bremer and Breivik (2017) T S Van Den Bremer and Ø Breivik. Stokes drift Subject Areas :. Philosophical Transactions A, 376(20170104), 2017.
- Charalambous (2015) Constantinos Charalambous. On the Evolution of Particle Fragmentation With Applications to Planetary Surfaces. PhD thesis, Imperial College London, 2015.
- Chor et al. (2018) Tomas Chor, Di Yang, Charles Meneveau, and Marcelo Chamecki. A Turbulence Velocity Scale for Predicting the Fate of Buoyant Materials in the Oceanic Mixed Layer. Geophysical Research Letters, 45, 2018. ISSN 19448007. doi: 10.1029/2018GL080296.
- Constant et al. (2019) Mel Constant, Philippe Kerhervé, Morgan Mino-Vercellio-Verollet, Marc Dumontier, Anna Sànchez Vidal, Miquel Canals, and Serge Heussner. Beached microplastics in the Northwestern Mediterranean Sea. Marine Pollution Bulletin, 142(March):263–273, 2019. ISSN 18793363. doi: 10.1016/j.marpolbul.2019.03.032. URL https://doi.org/10.1016/j.marpolbul.2019.03.032.
- Cózar et al. (2014) Andrés Cózar, Fidel Echevarría, J Ignacio González-Gordillo, Xabier Irigoien, Bárbara Ubeda, Santiago Hernández-León, Alvaro T Palma, Sandra Navarro, Juan García-de Lomas, Andrea Ruiz, María L Fernández-de Puelles, and Carlos M Duarte. Plastic debris in the open ocean. Proceedings of the National Academy of Sciences of the United States of America, 111(28):10239–44, 2014. ISSN 1091-6490. doi: 10.1073/pnas.1314705111. URL http://www.ncbi.nlm.nih.gov/pubmed/24982135%0Ahttp://www.pubmedcentral.nih.gov/articlerender.fcgi?artid=PMC4104848.
- Cózar et al. (2015) Andrés Cózar, Marina Sanz-Martín, Elisa Martí, J. Ignacio González-Gordillo, Bárbara Ubeda, José Á.gálvez, Xabier Irigoien, and Carlos M. Duarte. Plastic accumulation in the mediterranean sea. PLoS ONE, 10(4):1–12, 2015. ISSN 19326203. doi: 10.1371/journal.pone.0121762.
- Delandmeter and Sebille (2019) Philippe Delandmeter and Erik Van Sebille. The Parcels v2 . 0 Lagrangian framework : new field interpolation schemes. Geoscientific Model Development, 12:3571–3584, 2019. doi: doi.org/10.5194/gmd-12-3571-2019.
- Efimova et al. (2018) Irina Efimova, Margarita Bagaeva, Andrei Bagaev, Alexander Kileso, and Irina P Chubarenko. Secondary Microplastics Generation in the Sea Swash Zone With Coarse Bottom Sediments : Laboratory Experiments. Frontiers in Marine Science, 5(313), 2018. doi: 10.3389/fmars.2018.00313.
- Fazey and Ryan (2016) Francesca M.C. Fazey and Peter G. Ryan. Biofouling on buoyant marine plastics: An experimental study into the effect of size on surface longevity. Environmental Pollution, 210:354–360, 2016. ISSN 18736424. doi: 10.1016/j.envpol.2016.01.026. URL http://dx.doi.org/10.1016/j.envpol.2016.01.026.
- Fok et al. (2017) Lincoln Fok, Pui Kwan Cheung, Guangda Tang, and Wai Chin Li. Size distribution of stranded small plastic debris on the coast of Guangdong, South China. Environmental Pollution, 220:407–412, 2017. ISSN 18736424. doi: 10.1016/j.envpol.2016.09.079.
- Gregory et al. (2012) A S Gregory, N R A Bird, C W Watts, and A P Whitmore. An assessment of a new model of dynamic fragmentation of soil with test data. Soil and Tillage Research, 120(April):61–68, 2012. doi: 10.2136/vzj2008.0046.
- Hersbach et al. (2020) Hans Hersbach, Bill Bell, Paul Berrisford, Shoji Hirahara, András Horányi, Joaquín Muñoz‐Sabater, Julien Nicolas, Carole Peubey, Raluca Radu, Dinand Schepers, Adrian Simmons, Cornel Soci, Saleh Abdalla, Xavier Abellan, Gianpaolo Balsamo, Peter Bechtold, Gionata Biavati, Jean Bidlot, Massimo Bonavita, Giovanna Chiara, Per Dahlgren, Dick Dee, Michail Diamantakis, Rossana Dragani, Johannes Flemming, Richard Forbes, Manuel Fuentes, Alan Geer, Leo Haimberger, Sean Healy, Robin J. Hogan, Elías Hólm, Marta Janisková, Sarah Keeley, Patrick Laloyaux, Philippe Lopez, Cristina Lupu, Gabor Radnoti, Patricia Rosnay, Iryna Rozum, Freja Vamborg, Sebastien Villaume, and Jean‐Noël Thépaut. The ERA5 global reanalysis. Quarterly Journal of the Royal Meteorological Society, 146:1999–2049, jul 2020. ISSN 0035-9009. doi: 10.1002/qj.3803. URL https://onlinelibrary.wiley.com/doi/abs/10.1002/qj.3803.
- Hinata et al. (2017) Hirofumi Hinata, Keita Mori, Kazuki Ohno, Yasuyuki Miyao, and Tomoya Kataoka. An estimation of the average residence times and onshore-offshore diffusivities of beached microplastics based on the population decay of tagged meso- and macrolitter. Marine Pollution Bulletin, 122(1-2):17–26, 2017. ISSN 0025-326X. doi: 10.1016/j.marpolbul.2017.05.012. URL http://dx.doi.org/10.1016/j.marpolbul.2017.05.012.
- Hinata et al. (2020) Hirofumi Hinata, Nao Sagawa, Tomoya Kataoka, and Hidetaka Takeoka. Numerical modeling of the beach process of marine plastics : A probabilistic and diagnostic approach with a particle tracking method. Marine Pollution Bulletin, 152(October 2019):110910, 2020. ISSN 0025-326X. doi: 10.1016/j.marpolbul.2020.110910. URL https://doi.org/10.1016/j.marpolbul.2020.110910.
- Isobe et al. (2014) Atsuhiko Isobe, Kenta Kubo, Yuka Tamura, Etsuko Nakashima, and Naoki Fujii. Selective transport of microplastics and mesoplastics by drifting in coastal waters. Marine Pollution Bulletin, 89(1-2):324–330, 2014. ISSN 0025-326X. doi: 10.1016/j.marpolbul.2014.09.041. URL http://dx.doi.org/10.1016/j.marpolbul.2014.09.041.
- Isobe et al. (2015) Atsuhiko Isobe, Keiichi Uchida, Tadashi Tokai, and Shinsuke Iwasaki. East Asian seas : A hot spot of pelagic microplastics East Asian seas : A hot spot of pelagic microplastics. Marine Pollution Bulletin, 101(2):618–623, 2015. ISSN 0025-326X. doi: 10.1016/j.marpolbul.2015.10.042. URL http://dx.doi.org/10.1016/j.marpolbul.2015.10.042.
- Iwasaki et al. (2017) Shinsuke Iwasaki, Atsuhiko Isobe, Shin’ichiro Kako, Keiichi Uchida, and Tadashi Tokai. Fate of microplastics and mesoplastics carried by surface currents and wind waves: A numerical model approach in the Sea of Japan. Marine Pollution Bulletin, 121(1-2):85–96, 2017. ISSN 18793363. doi: 10.1016/j.marpolbul.2017.05.057.
- Jambeck et al. (2015) Jenna R. Jambeck, Roland Geyer, Chris Wilcox, Theodore R. Siegler, Miriam Perryman, Anthony Andrady, Ramani Narayan, and Kara Lavender Law. Plastic waste inputs from land into the ocean. Science, 347(6223):768–771, 2015. ISSN 10959203. doi: 10.1126/science.1260352.
- Kaandorp et al. (2020) Mikael L A Kaandorp, Henk A Dijkstra, and Erik van Sebille. Closing the Mediterranean Marine Floating Plastic Mass Budget : Inverse Modelling of Sources and Sinks. Preprint, 2020.
- Kalogerakis et al. (2017) Nicolas Kalogerakis, Katerina Karkanorachaki, G Calypso Kalogerakis, Elisavet I Triantafyllidi, Alexandros D Gotsis, Panagiotis Partsinevelos, and Fabio Fava. Microplastics Generation : Onset of Fragmentation of Polyethylene Films in Marine Environment Mesocosms. Frontiers in Marine Science, 4(84), 2017. doi: 10.3389/fmars.2017.00084.
- Koelmans et al. (2017) Albert A. Koelmans, Merel Kooi, Kara Lavender Law, and Erik Van Sebille. All is not lost: Deriving a top-down mass budget of plastic at sea. Environmental Research Letters, 12(11), 2017. ISSN 17489326. doi: 10.1088/1748-9326/aa9500.
- Kooi and Koelmans (2019) Merel Kooi and Albert A Koelmans. Simplifying Microplastic via Continuous Probability Distributions for Size, Shape, and Density. Environmental Science and Technology Letters, 6:551–557, 2019. doi: 10.1021/acs.estlett.9b00379.
- Kooi et al. (2017) Merel Kooi, Egbert H. Van Nes, Marten Scheffer, and Albert A. Koelmans. Ups and Downs in the Ocean: Effects of Biofouling on Vertical Transport of Microplastics. Environmental Science and Technology, 51(14):7963–7971, 2017. ISSN 15205851. doi: 10.1021/acs.est.6b04702.
- Kukulka et al. (2012) T. Kukulka, G. Proskurowski, S. Morét-Ferguson, D. W. Meyer, and K. L. Law. The effect of wind mixing on the vertical distribution of buoyant plastic debris. Geophysical Research Letters, 39(7):1–6, 2012. ISSN 00948276. doi: 10.1029/2012GL051116.
- Lebreton et al. (2019) Laurent Lebreton, Matthias Egger, and Boyan Slat. A global mass budget for positively buoyant macroplastic debris in the ocean. Scientific Reports, 9:12922, 2019. ISSN 2045-2322. doi: 10.1038/s41598-019-49413-5. URL http://dx.doi.org/10.1038/s41598-019-49413-5.
- Liubartseva et al. (2018) S Liubartseva, G Coppini, R Lecci, and E Clementi. Tracking plastics in the Mediterranean : 2D Lagrangian model. Marine Pollution Bulletin, 129(February):151–162, 2018. doi: 10.1016/j.marpolbul.2018.02.019.
- Menna et al. (2017) Milena Menna, Riccardo Gerin, Antonio Bussani, and Pierre-marie Poulain. The OGS Mediterranean Drifter Dataset: 1986-2016. Technical report, 2017.
- Newman (2005) M. E.J. Newman. Power laws, Pareto distributions and Zipf’s law. Contemporary Physics, 46(5):323–351, 2005. ISSN 00107514. doi: 10.1080/00107510500052444.
- Onink et al. (2019) Victor Onink, David Wichmann, Philippe Delandmeter, and Erik van Sebille. The Role of Ekman Currents, Geostrophy, and Stokes Drift in the Accumulation of Floating Microplastic. Journal of Geophysical Research: Oceans, 124(3):1474–1490, 2019. ISSN 21699291. doi: 10.1029/2018JC014547. URL https://doi.org/10.1029/2018JC014547.
- Pedrotti et al. (2016) Maria Luiza Pedrotti, Stéphanie Petit, Amanda Elineau, Stéphane Bruzaud, Jean Claude Crebassa, Bruno Dumontet, Elisa Martí, Gabriel Gorsky, and Andrés Cózar. Changes in the floating plastic pollution of the mediterranean sea in relation to the distance to land. PLoS ONE, 11:1–14, 2016. ISSN 19326203. doi: 10.1371/journal.pone.0161581.
- Poulain et al. (2019) Marie Poulain, Matthieu J Mercier, Laurent Brach, Marion Martignac, Corinne Routaboul, Emile Perez, Marie Christine Desjean, and Alexandra Halle. Small Microplastics As a Main Contributor to Plastic Mass Balance in the North Atlantic Subtropical Gyre. Environmental Science & Technology, 53:1157–1164, 2019. ISSN 0013-936X. doi: 10.1021/acs.est.8b05458.
- Reisser et al. (2015) J. Reisser, B. Slat, K. Noble, K. Du Plessis, M. Epp, M. Proietti, J. De Sonneville, T. Becker, and C. Pattiaratchi. The vertical distribution of buoyant plastics at sea: An observational study in the North Atlantic Gyre. Biogeosciences, 12(4):1249–1256, 2015. ISSN 17264189. doi: 10.5194/bg-12-1249-2015.
- Ruiz-Orejón et al. (2018) Luis F. Ruiz-Orejón, Rafael Sardá, and Juan Ramis-Pujol. Now, you see me: High concentrations of floating plastic debris in the coastal waters of the Balearic Islands (Spain). Marine Pollution Bulletin, 133(June):636–646, 2018. ISSN 18793363. doi: 10.1016/j.marpolbul.2018.06.010. URL https://doi.org/10.1016/j.marpolbul.2018.06.010.
- Ryan (2015) Peter G. Ryan. Does size and buoyancy affect the long-distance transport of floating debris? Environmental Research Letters, 10(8):84019, 2015. ISSN 17489326. doi: 10.1088/1748-9326/10/8/084019. URL http://dx.doi.org/10.1088/1748-9326/10/8/084019.
- Song et al. (2017) Young Kyoung Song, Sang Hee Hong, Mi Jang, Gi Myung Han, Seung Won Jung, and Won Joon Shim. Combined Effects of UV Exposure Duration and Mechanical Abrasion on Microplastic Fragmentation by Polymer Type. Environmental Science and Technology, 51(8):4368–4376, 2017. ISSN 15205851. doi: 10.1021/acs.est.6b06155.
- Stokes (1847) G. Stokes. On the theory of oscillatory waves. Transactions of the Cambridge Philosophical Society, 8(441):197–229, 1847. doi: 10.1057/9781137341280.0042.
- Suaria et al. (2016) Giuseppe Suaria, Carlo G. Avio, Annabella Mineo, Gwendolyn L. Lattin, Marcello G. Magaldi, Genuario Belmonte, Charles J. Moore, Francesco Regoli, and Stefano Aliani. The Mediterranean Plastic Soup: Synthetic polymers in Mediterranean surface waters. Scientific Reports, 6:1–10, 2016. ISSN 20452322. doi: 10.1038/srep37551. URL http://dx.doi.org/10.1038/srep37551.
- Turcotte (1986) D. L. Turcotte. Nr exp. Journal of Geophysical Research, 91(B2):1921–1926, 1986.
- van Sebille et al. (2020) Erik van Sebille, Stefano Aliani, Kara Lavender Law, Nikolai Maximenko, José M Alsina, Andrei Bagaev, Melanie Bergmann, Bertrand Chapron, Irina Chubarenko, and Andrés Cózar. The physical oceanography of the transport of floating marine debris. Environmental Research Letters, 15(2):023003, 2020. ISSN 1748-9326. doi: 10.1088/1748-9326/ab6d7d. URL http://dx.doi.org/10.1088/1748-9326/ab6d7d.
- Virkar and Clauset (2014) Yogesh Virkar and Aaron Clauset. Power-law distributions in binned empirical data. Annals of Applied Statistics, 8(1):89–119, 2014. ISSN 19417330. doi: 10.1214/13-AOAS710.