Characterisation of Laser Wakefield Acceleration Efficiency with Octave Spanning Near-IR Spectrum Measurements
Abstract
We report on experimental measurements of energy transfer efficiencies in a GeV-class laser wakefield accelerator. Both the transfer of energy from the laser to the plasma wakefield, and from the plasma to the accelerated electron beam were diagnosed by simultaneous measurement of the deceleration of laser photons and the acceleration of electrons as a function of plasma length. The extraction efficiency, which we define as the ratio of the energy gained by the electron beam to the energy lost by the self-guided laser mode, was maximised at % by tuning of the plasma density and length. The additional information provided by the octave-spanning laser spectrum measurement allows for independent optimisation of the plasma efficiency terms, which is required for the key goal of improving the overall efficiency of laser wakefield accelerators.
Intense laser pulses can drive compact plasma-based electron accelerators using a process known as Laser WakeField Acceleration (LWFA). As the laser pulse propagates through a plasma, it drives electron oscillations that produce large electrostatic fields, typically of order 100 GV/m. LWFA has been successfully used to accelerate electrons to GeV energy levels over interaction distances on the order of a centimeter Leemans et al. (2006); Kneip et al. (2009); Clayton et al. (2010); Wang et al. (2013); Leemans et al. (2014); Gonsalves et al. (2019). A crucial consideration for LWFAs is the efficiency of energy transfer from the laser to the accelerated particle bunch. In radio-frequency (RF) linear accelerators, efficient operation is achieved by storing the drive energy in a high quality-factor cavity, which is then extracted by multiple electron beams in a bunch train. In high-amplitude plasma-accelerators non-linearities eventually damp out the plasma oscillations and so high efficiency energy transfer must be achieved within a relatively small number of plasma oscillation periods.
In plasma accelerators, the driver energy is converted to the accelerating fields via the plasma response so that the total efficiency of the accelerator can be broken down as , where the last term, from here on abbreviated as , is the extraction efficiency. In beam-driven plasma wakefield acceleration (PWFA), the extraction efficiency is simply calculated as the ratio of the energy gained by the witness beam, to the energy lost by the driver. Using this measure, an efficiency of % has been observed experimentally Litos et al. (2014). In LWFA, energy transfer to the plasma wakefield occurs through redshifting of the driving laser pulse, and so can be determined from spectral measurement of the post-interaction laser pulse Esarey et al. (2009); Shiraishi et al. (2013). Combined with measurement of the accelerated electron beam spectrum, it is possible to simultaneously diagnose the efficiency with which the laser excites the plasma wakefield, and the efficiency with which the electron beam extracts that energy. Higher-order laser modes that are not guided in a central filament will not drive strong plasma waves and therefore do not transfer significant energy to the wake Vieira et al. (2012). Consequently, the extraction efficiency for LWFA only includes energy transfer from the guided, and therefore redshifted, laser mode.
Regardless of the nature of the driver, 100% extraction efficiency would require that the wake of the witness beam perfectly cancels the plasma wake generated by the driver. With a suitably chosen trapezoidal electron beam current profile Katsouleas et al. (1987), the accelerating field over the electron bunch can be kept constant at where is the location of the head of the electron bunch in the co-moving frame . Doing so allows for simultaneous high plasma wake extraction efficiency and low energy spread for the accelerated beam in linear Katsouleas et al. (1987) or non-linear blowout Gordienko and Pukhov (2005); Lu et al. (2007); Tzoufras et al. (2008) regimes. If dephasing occurs, then this ideal beam-loading condition can not be maintained, leading to increased energy spread and lower overall efficiency. Any modification to the wakefield amplitude, i.e. as the laser evolves, will affect both the ideal beam-loading condition and the dephasing rate.
In this letter, we present experimental measurements of the transfer of laser energy into a plasma wakefield and the efficiency with which that energy was extracted by an electron beam as it was accelerated to GeV. This required measurement of extended spectral range of the shifted laser pulse at the exit of the plasma, which in this regime extended up to 1600 nm. Studying the energy transfer between the laser, plasma and electron beam as a function of the plasma length was used to reveal the dynamics responsible for this optimum.
For the driving laser of a LWFA, assuming conservation of photon number (valid for and Bulanov et al. (1992); Oliveira e Silva and Mendonça (1998), and negligible levels of ionization or incoherent scattering), the energy loss per unit length is given by , where and are the initial laser pulse energy and frequency, respectively. The electron-beam energy-gain per-unit-length, , where is the number of accelerated electrons and is the average energy of the beam, can be inferred from measurements of the electron spectrum as a function of plasma length. Therefore, the instantaneous energy extraction efficiency for a LWFA can be written as,
| (1) |
Due to contributions by dephasing, drive laser evolution, beam injection and beam loss (changing ), the extraction efficiency is not a constant but changes along the accelerator length. For the results of this paper, we measure the accelerator averaged extraction efficiency , i.e. the ratio of the total energy gained by the electron beam to the energy lost by the laser pulse over the full acceleration length.
An experiment was performed (setup as shown in supplemental materials) with the Gemini laser at the Central Laser Facility. Each pulse contained J in a pulse length of fs, with a peak power of TW. The pulse had a positive chirp of 500 fs2 compared to the shortest pulse length of 45 fs. The pulse was focused to a spot width of m m ( FWHM) using an parabolic mirror and was linearly polarised along the -axis. A deformable mirror was used to optimize the wavefront, giving a peak intensity in vacuum of W cm-2 and a peak normalised vector potential at focus.
The laser pulse was focused into a 3D printed two-stage gas cell Hussein et al. (2019), filled with a 2%/98% nitrogen/helium mix for the first ‘injector’ stage and pure helium in the second ‘accelerator’ stage. The cell walls had 1 mm wide vertical slits to allow for the gas cell to be translated vertically. This enabled the accelerator length to be adjusted continuously as the exit wall was angled at 45 ∘ to the vertical plane. The injector stage has an internal length of 3 mm and the accelerator length was variable over 8-21 mm, giving a total gas cell length 14-27 mm (including the cell boundaries). The electron density in the gas cells was varied in the range cm-3, which was diagnosed by observing the spectrum of Raman side-scattering from plasma waves generated by low intensity (), long duration ( fs) laser pulses Matsuoka et al. (2010).
After interaction with the plasma, the transmitted laser pulse was reflected from two glass plates into a fiber coupler, sampling a 1 cm diameter region (1/10 of the full beam diameter at this point). A fiber splitter directed the signal onto two spectrometers, one measuring 350–840 nm (Andor Shamrock) and one measuring 900–1700 nm (Ocean Optics NIRQuest 512). The relative spectral sensitivities of the laser spectrometers was calibrated using a pre-calibrated white light source. The electron beam spectrum was measured using a magnetic dipole with integrated field strength Tm, which dispersed electrons in the energy range 385–3000 MeV onto a Lanex scintillator.
In order to determine the optimal conditions for electron generation, the gas cell was positioned at its longest length and the plasma density and longitudinal gas cell position were independently scanned. The results of the gas cell density scan, for an accelerator length of 21 mm (total plasma length 27 mm), are plotted in figure 1a-b.
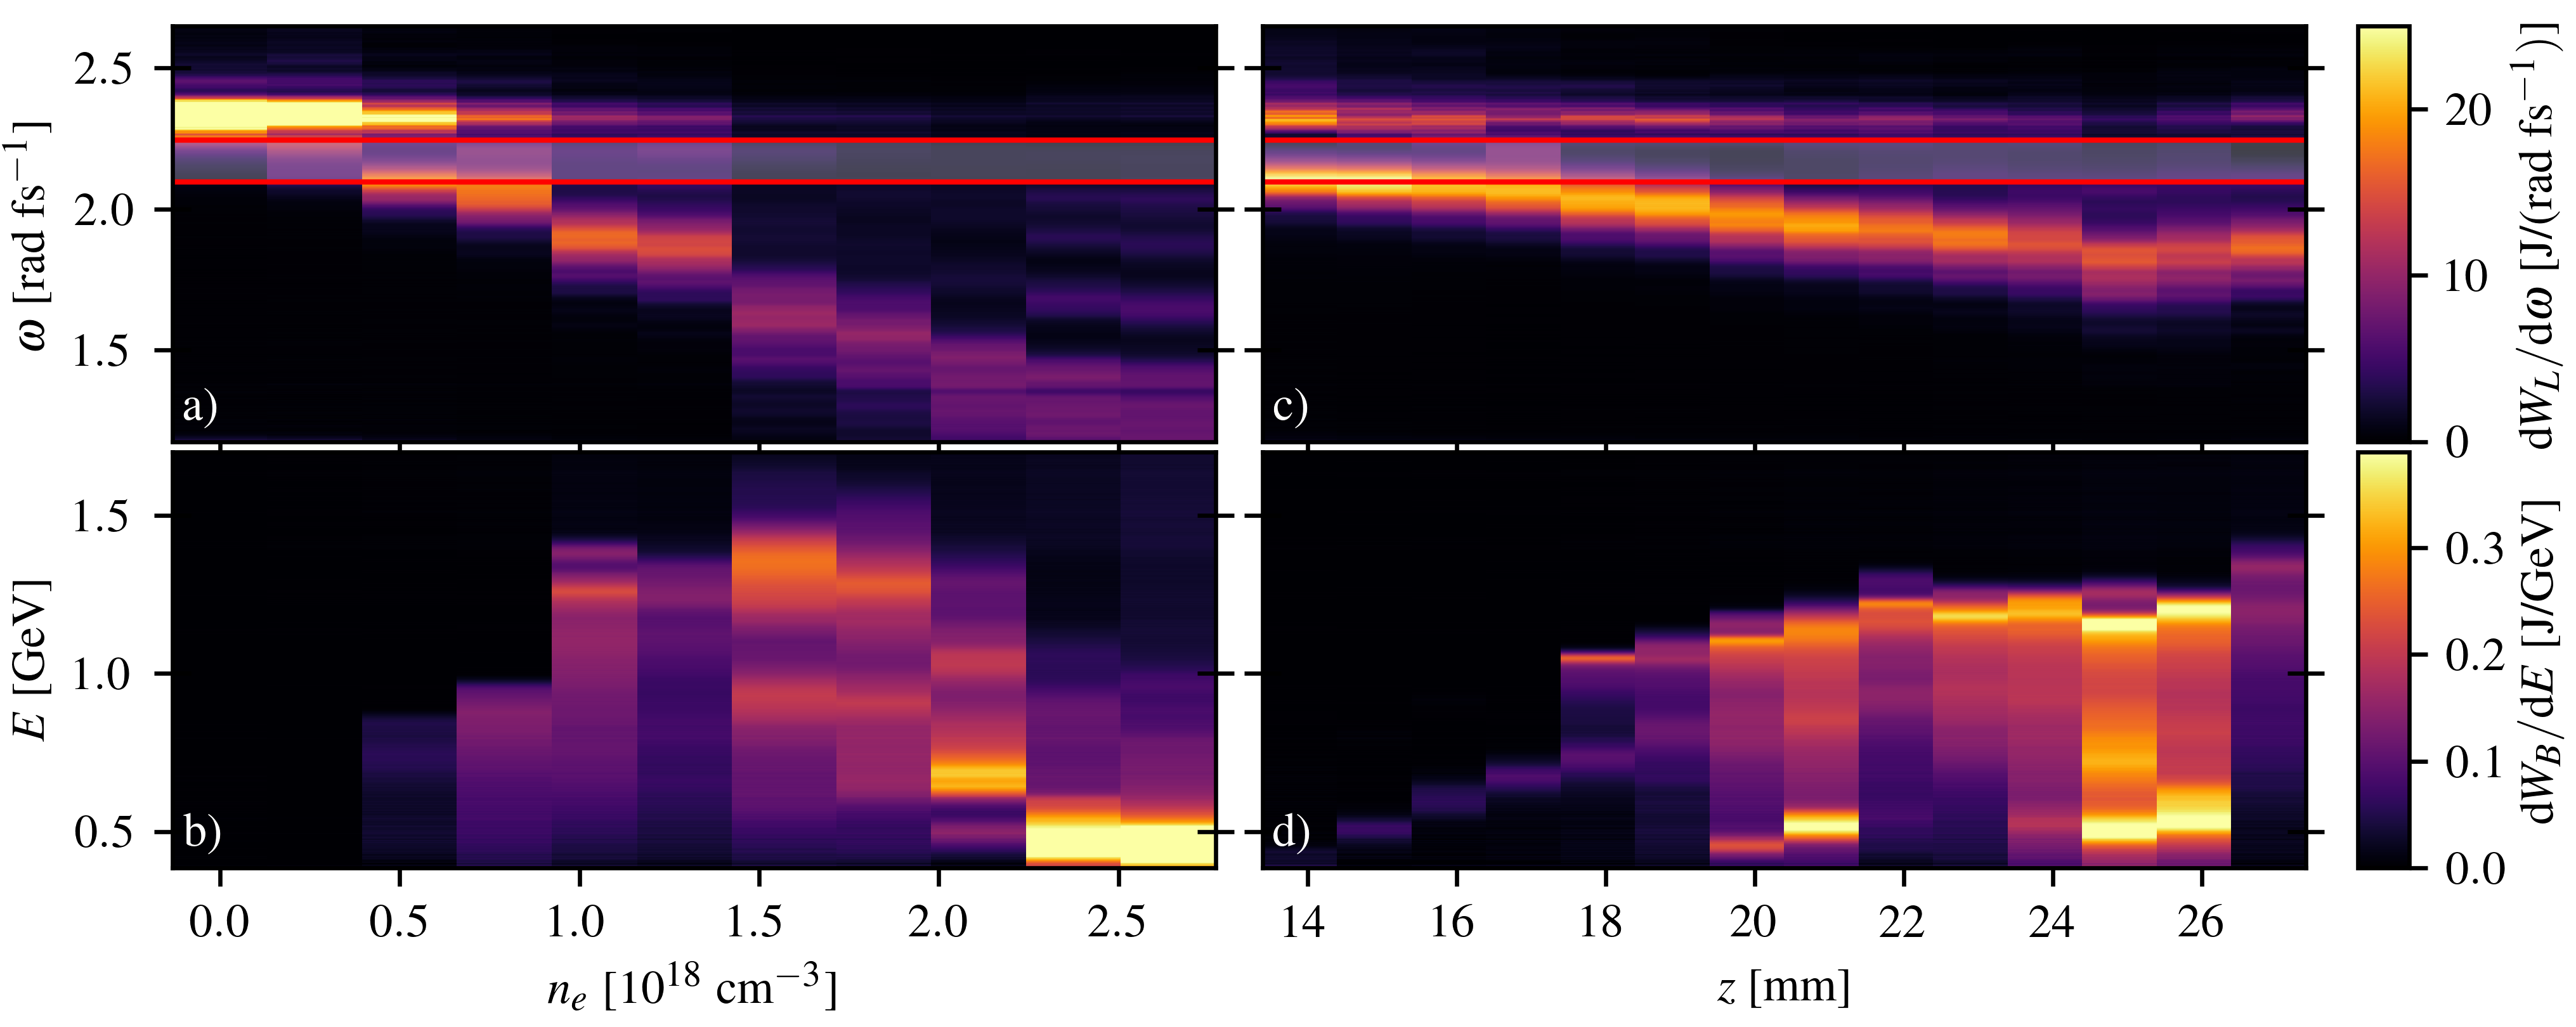
The laser spectrum, shown in figure 1a, was increasingly redshifted and broadened at higher plasma density. For the highest plasma density cm-3, the laser spectrum extended to the limit of the spectrometer with a peak occurring at 1600 nm. Comparatively little laser energy was blueshifted for the full density range demonstrating that ionization blueshift or photon acceleration at the rear of the plasma wave were not significant Schreiber et al. (2010).
As shown in figure 1b, the highest electron energy occurred for cm-3, where a peak in the spectrum was observed at GeV. At higher densities, the maximum electron energies decreased, while the total measured charge remained approximately constant at pC. The increasing laser redshift indicates that a strong plasma wave continued to be driven at these high densities, but the injected electrons experienced less acceleration.
Figure 1c-d show the result of scanning the accelerator length for a fixed density of of cm-3. The laser (figure 1c redshifted at an approximately linear rate as the acceleration length was increased. The electron spectra (figure 1d, shows two distinctive electron bunches were accelerated, with the higher energy component reaching 1.2 GeV. For plasma length mm (acceleration cell length mm) the charge in the higher energy component was much reduced, indicating that injection was sensitive to small changes in the plasma profile as the cell was translated vertically. Also for the longest plasma lengths ( mm), the laser redshift was reduced, indicating that less energy was coupled into the plasma. This was likely due to obstructions to the laser path at the top of the gas cell slits.
Both the laser and electron beam energies were calculated by integrating the measurements in figure 1 over the spectral axes. For the laser spectrum, there was a small gap between the ranges of the two spectrometers. In order to determine the interacting laser energy, Gaussian process regression (GPR) was used to fit the observed signal and interpolate over this region. The relative error of the interacting laser energy measurement introduced by this procedure was calculated from the GPR model uncertainties as less than % (standard deviation). Furthermore, the spectra were corrected to account for frequency dependent divergence of the source, using the assumption that all frequencies were emitted from a constant spot size. With this assumption, the divergence is inversely proportional to frequency and so the collection efficiency for an on-axis sample scales as and so the corrected spectrum was obtained by dividing the measured spectrum by , i.e. . Analysis of transmitted laser spectra from the PIC simulations (described later in this paper) indicate that this assumption leads to the laser depletion being underestimated by %. Finally, it was assumed that the total photon number of the driving laser pulse () was conserved throughout the interaction Esarey et al. (2009), such that the energy loss can be calculated from the change in average laser frequency as in equation 1.
The laser pulse energy loss and electron energy gain are plotted as functions of plasma density in figure 2a & b. The laser lost more energy for increasing plasma density until reaching a plateau for cm-3. The electron beam total energy reached a maximum of J at cm-3 and was lower for both higher and lower plasma densities. The extraction efficiency , plotted in figure 2c, reached a maximum of % at cm-3. Increasing the plasma density beyond this point resulted in a lower extraction efficiency, even though the electron beam energy increased.
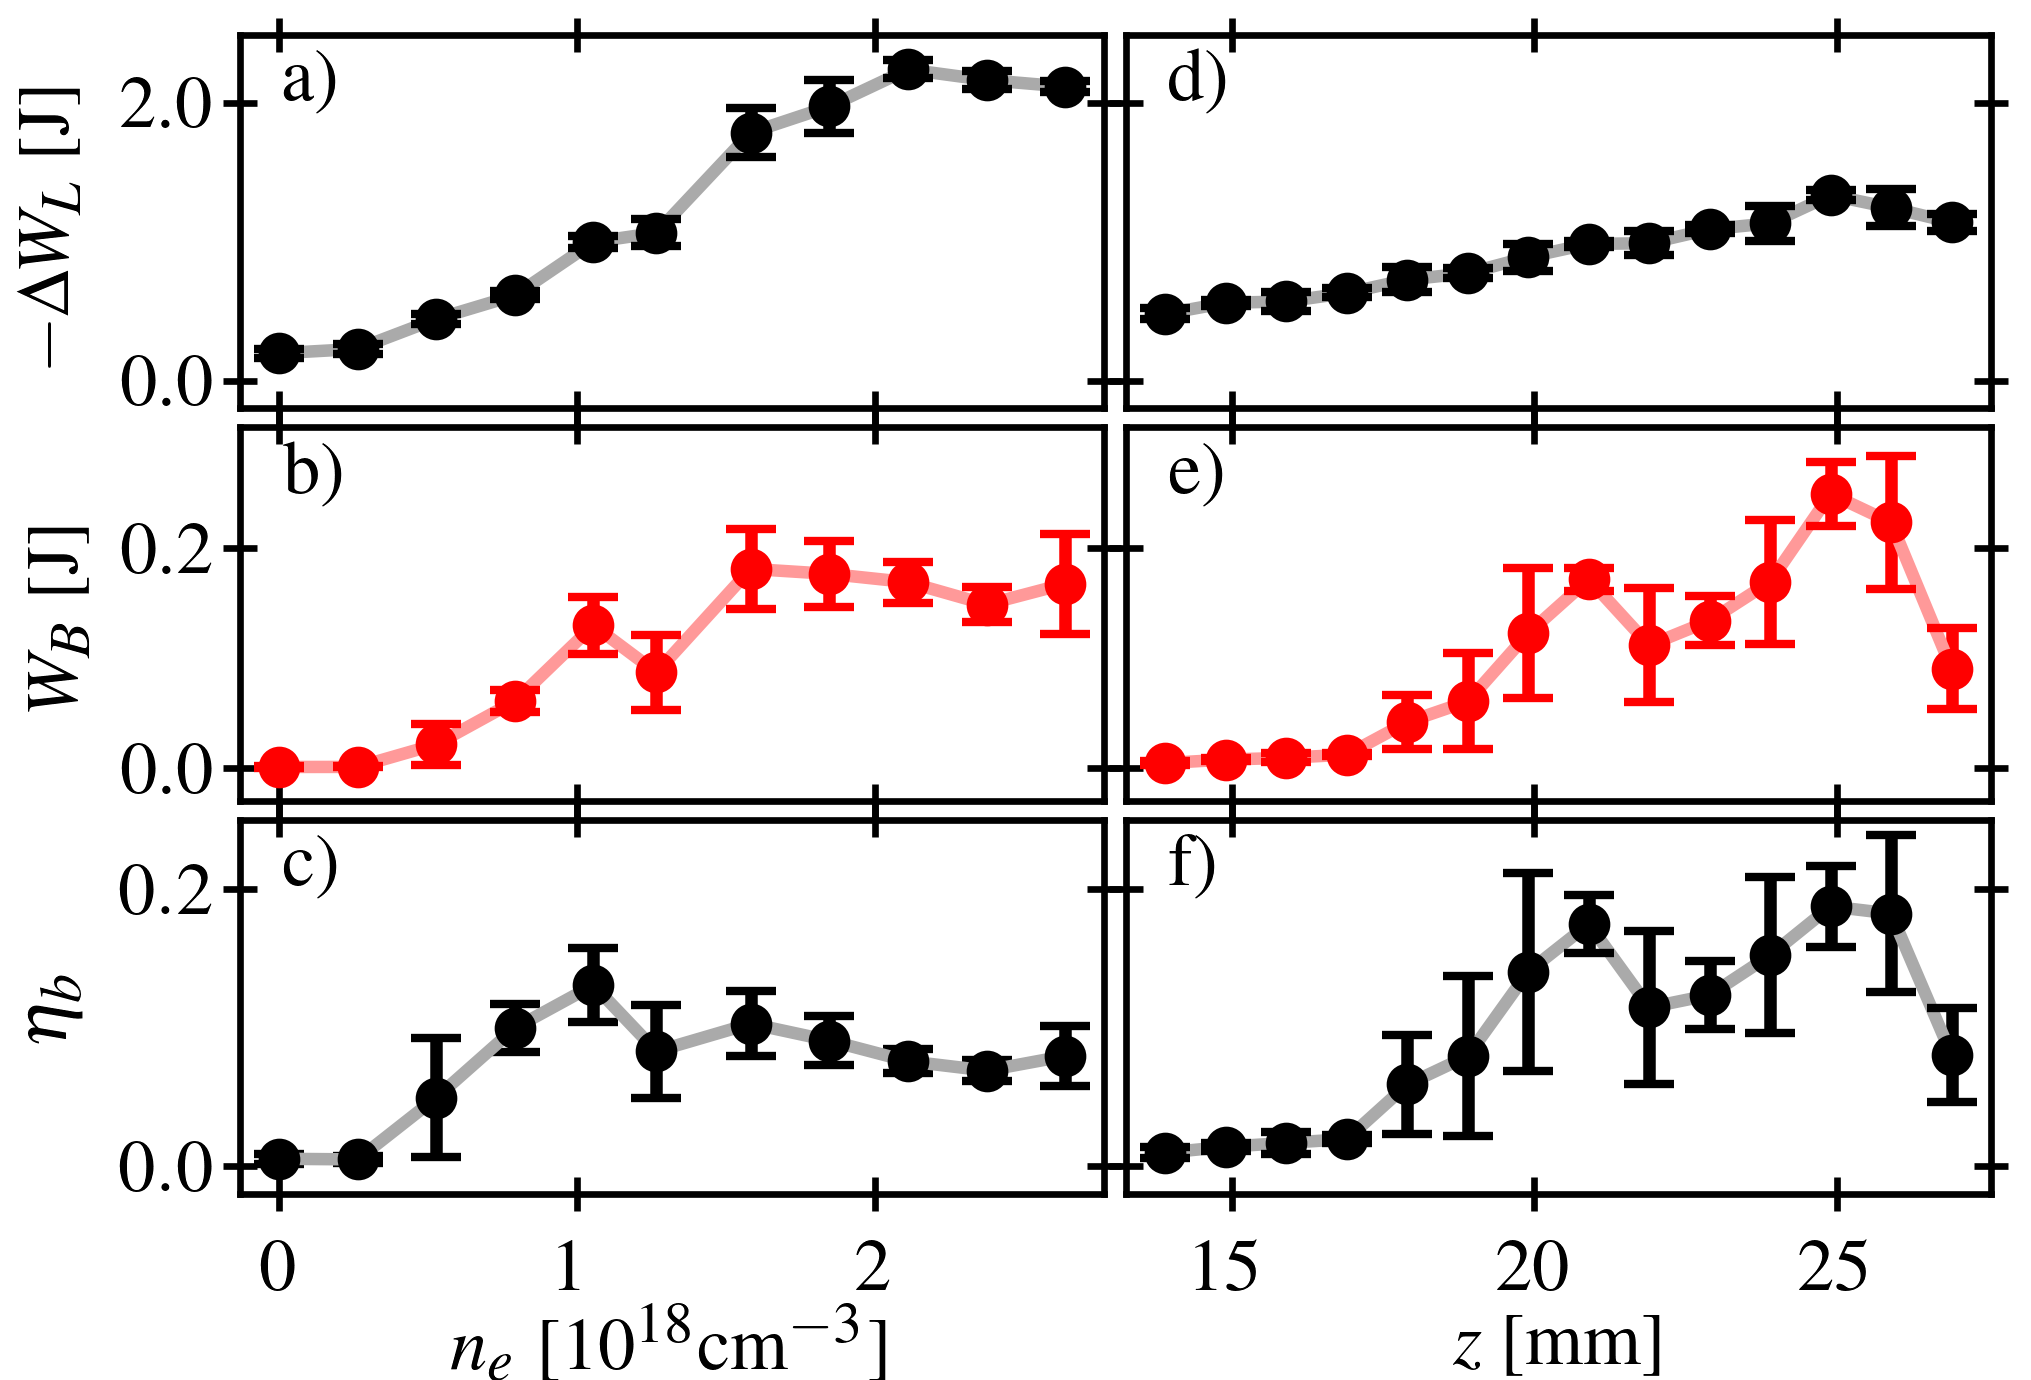
The laser energy loss and electron beam energy for the length scan are shown in figure 2d & e. The laser energy loss was approximately linearly proportional to the plasma length up to mm. The electron beam total energy increased suddenly with the appearance of the higher energy feature in the electron spectrum (visible in figure 1d), at mm. Over the range mm, the electron charge had an average of pC, while the electron beam total energy increased with . The extraction efficiency, shown in figure 2f), also increased with length for mm as more charge was injected, before stabilizing at an average of % for mm with a maximum of %. The maximum electron beam total energy was J, giving a total LWFA efficiency .
In order to explore the dynamics of the experiment, we performed quasi-3D PIC simulations using FBPIC Lehe et al. (2016), using 4 azimuthal modes (see details in supplemental material). The laser pulse was initialised using the experimentally measured temporal profile, and a Gaussian approximation to the measured focal spot energy distribution with an . The simulation results matched the experimentally observed maximum electron energy and laser redshift, with relative differences of 5% and 0.1% respectively. However, the simulated idealised laser pulse contained only 4.2 J of energy ( % of the laser energy in the experiment), indicating that the combination of laser pulse and target imperfections resulted in a lower proportion of the laser energy being guided than for a pure Gaussian mode, in line with previous observations Mangles et al. (2012); Vieira et al. (2012).
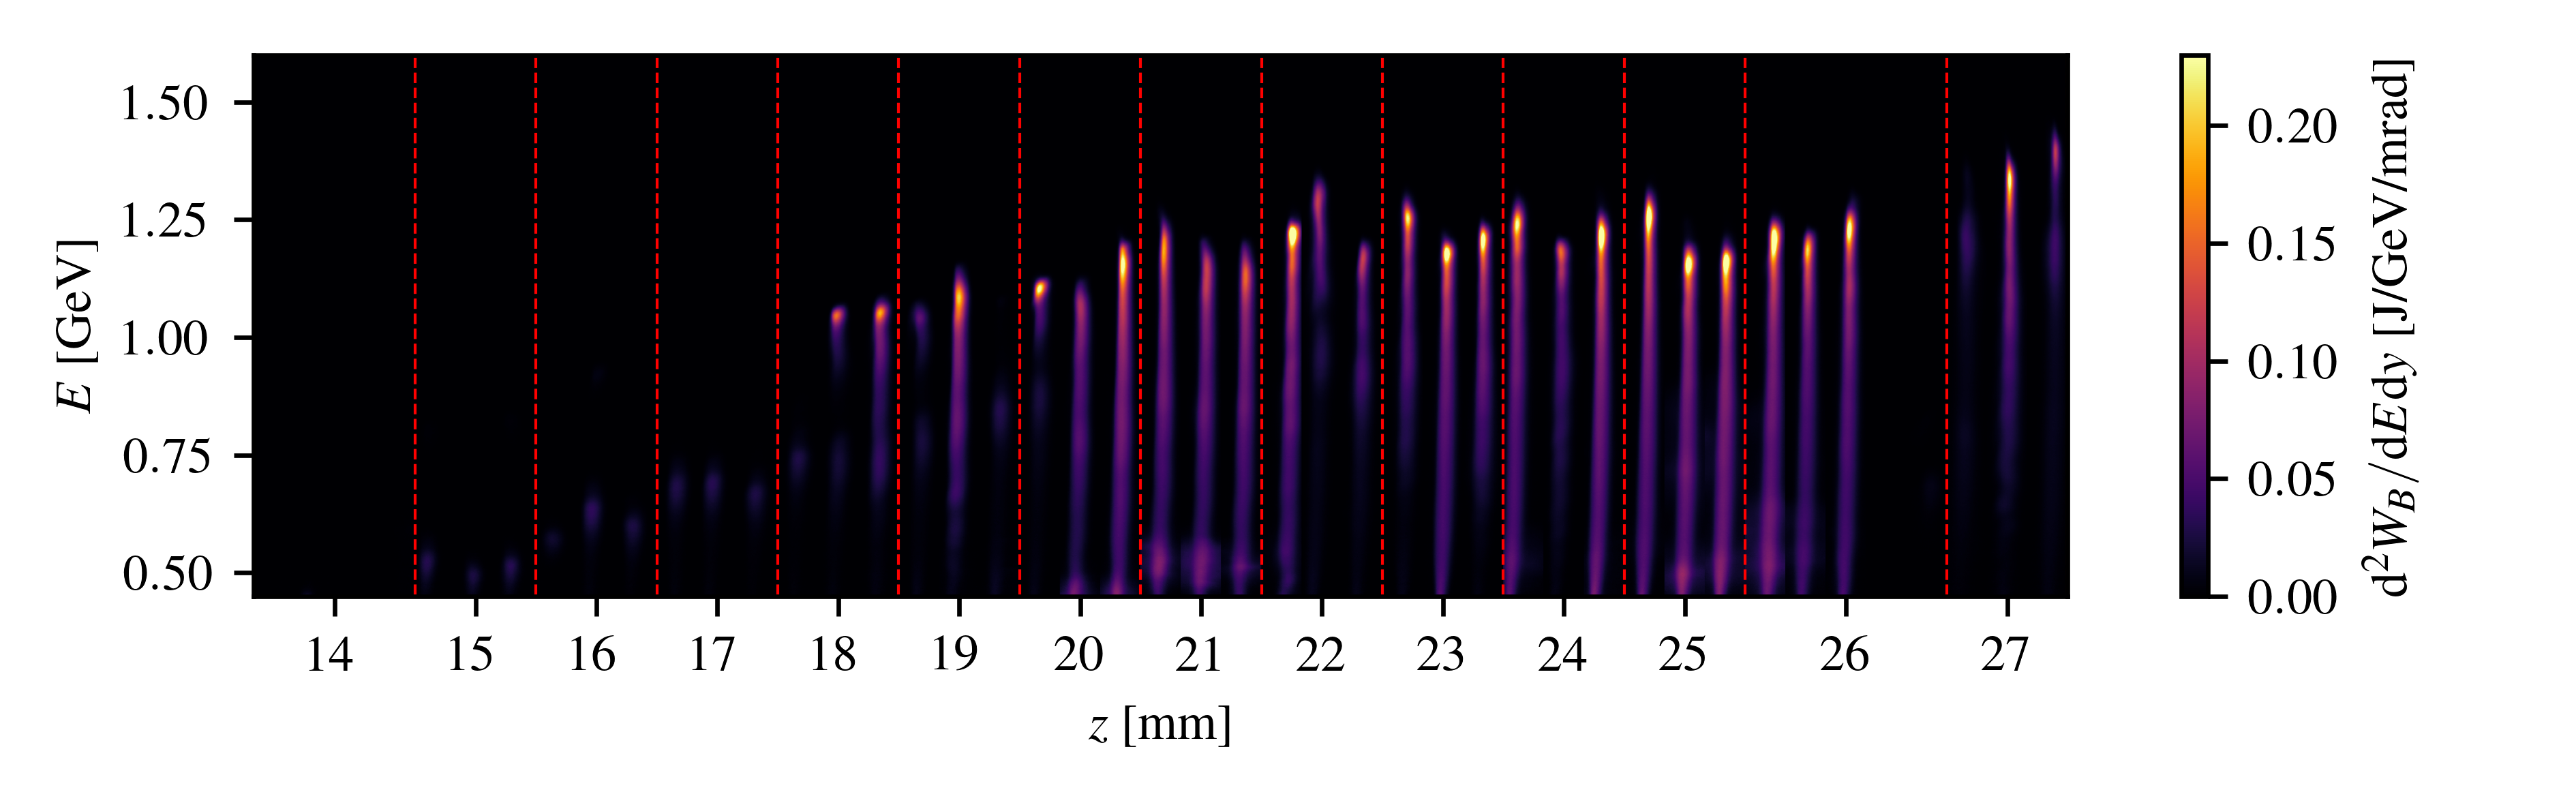
The laser and electron spectra, as functions of propagation distance within the PIC simulation, are shown in figure 3a and b. The laser spectrum was seen to redshift and broaden by the same amount as the experimental measurements of figure 1c, with a redshifted peak at rad fs-1. The laser reached a peak normalised vector potential of at mm, due to the effects of self-focusing and self-compression. For the rest of the accelerator, and no self-injection was observed. The accelerated electron beam resulted from trapping of inner shell electrons from nitrogen (ionisation injection Rowlands-Rees et al. (2008); Pak et al. (2010); McGuffey et al. (2010); Chen et al. (2012)) during the first 5 mm. A total beam charge of 255 pC was observed in the accelerated beam at the end of the simulation, with a peak in energy of 1.2 GeV. Approximately 16% of the electron beam energy at the end of the simulation lies below the 385 MeV detection threshold of the experimental spectrometer, indicating that the experimentally measured extraction efficiency is underestimated by a similar amount.
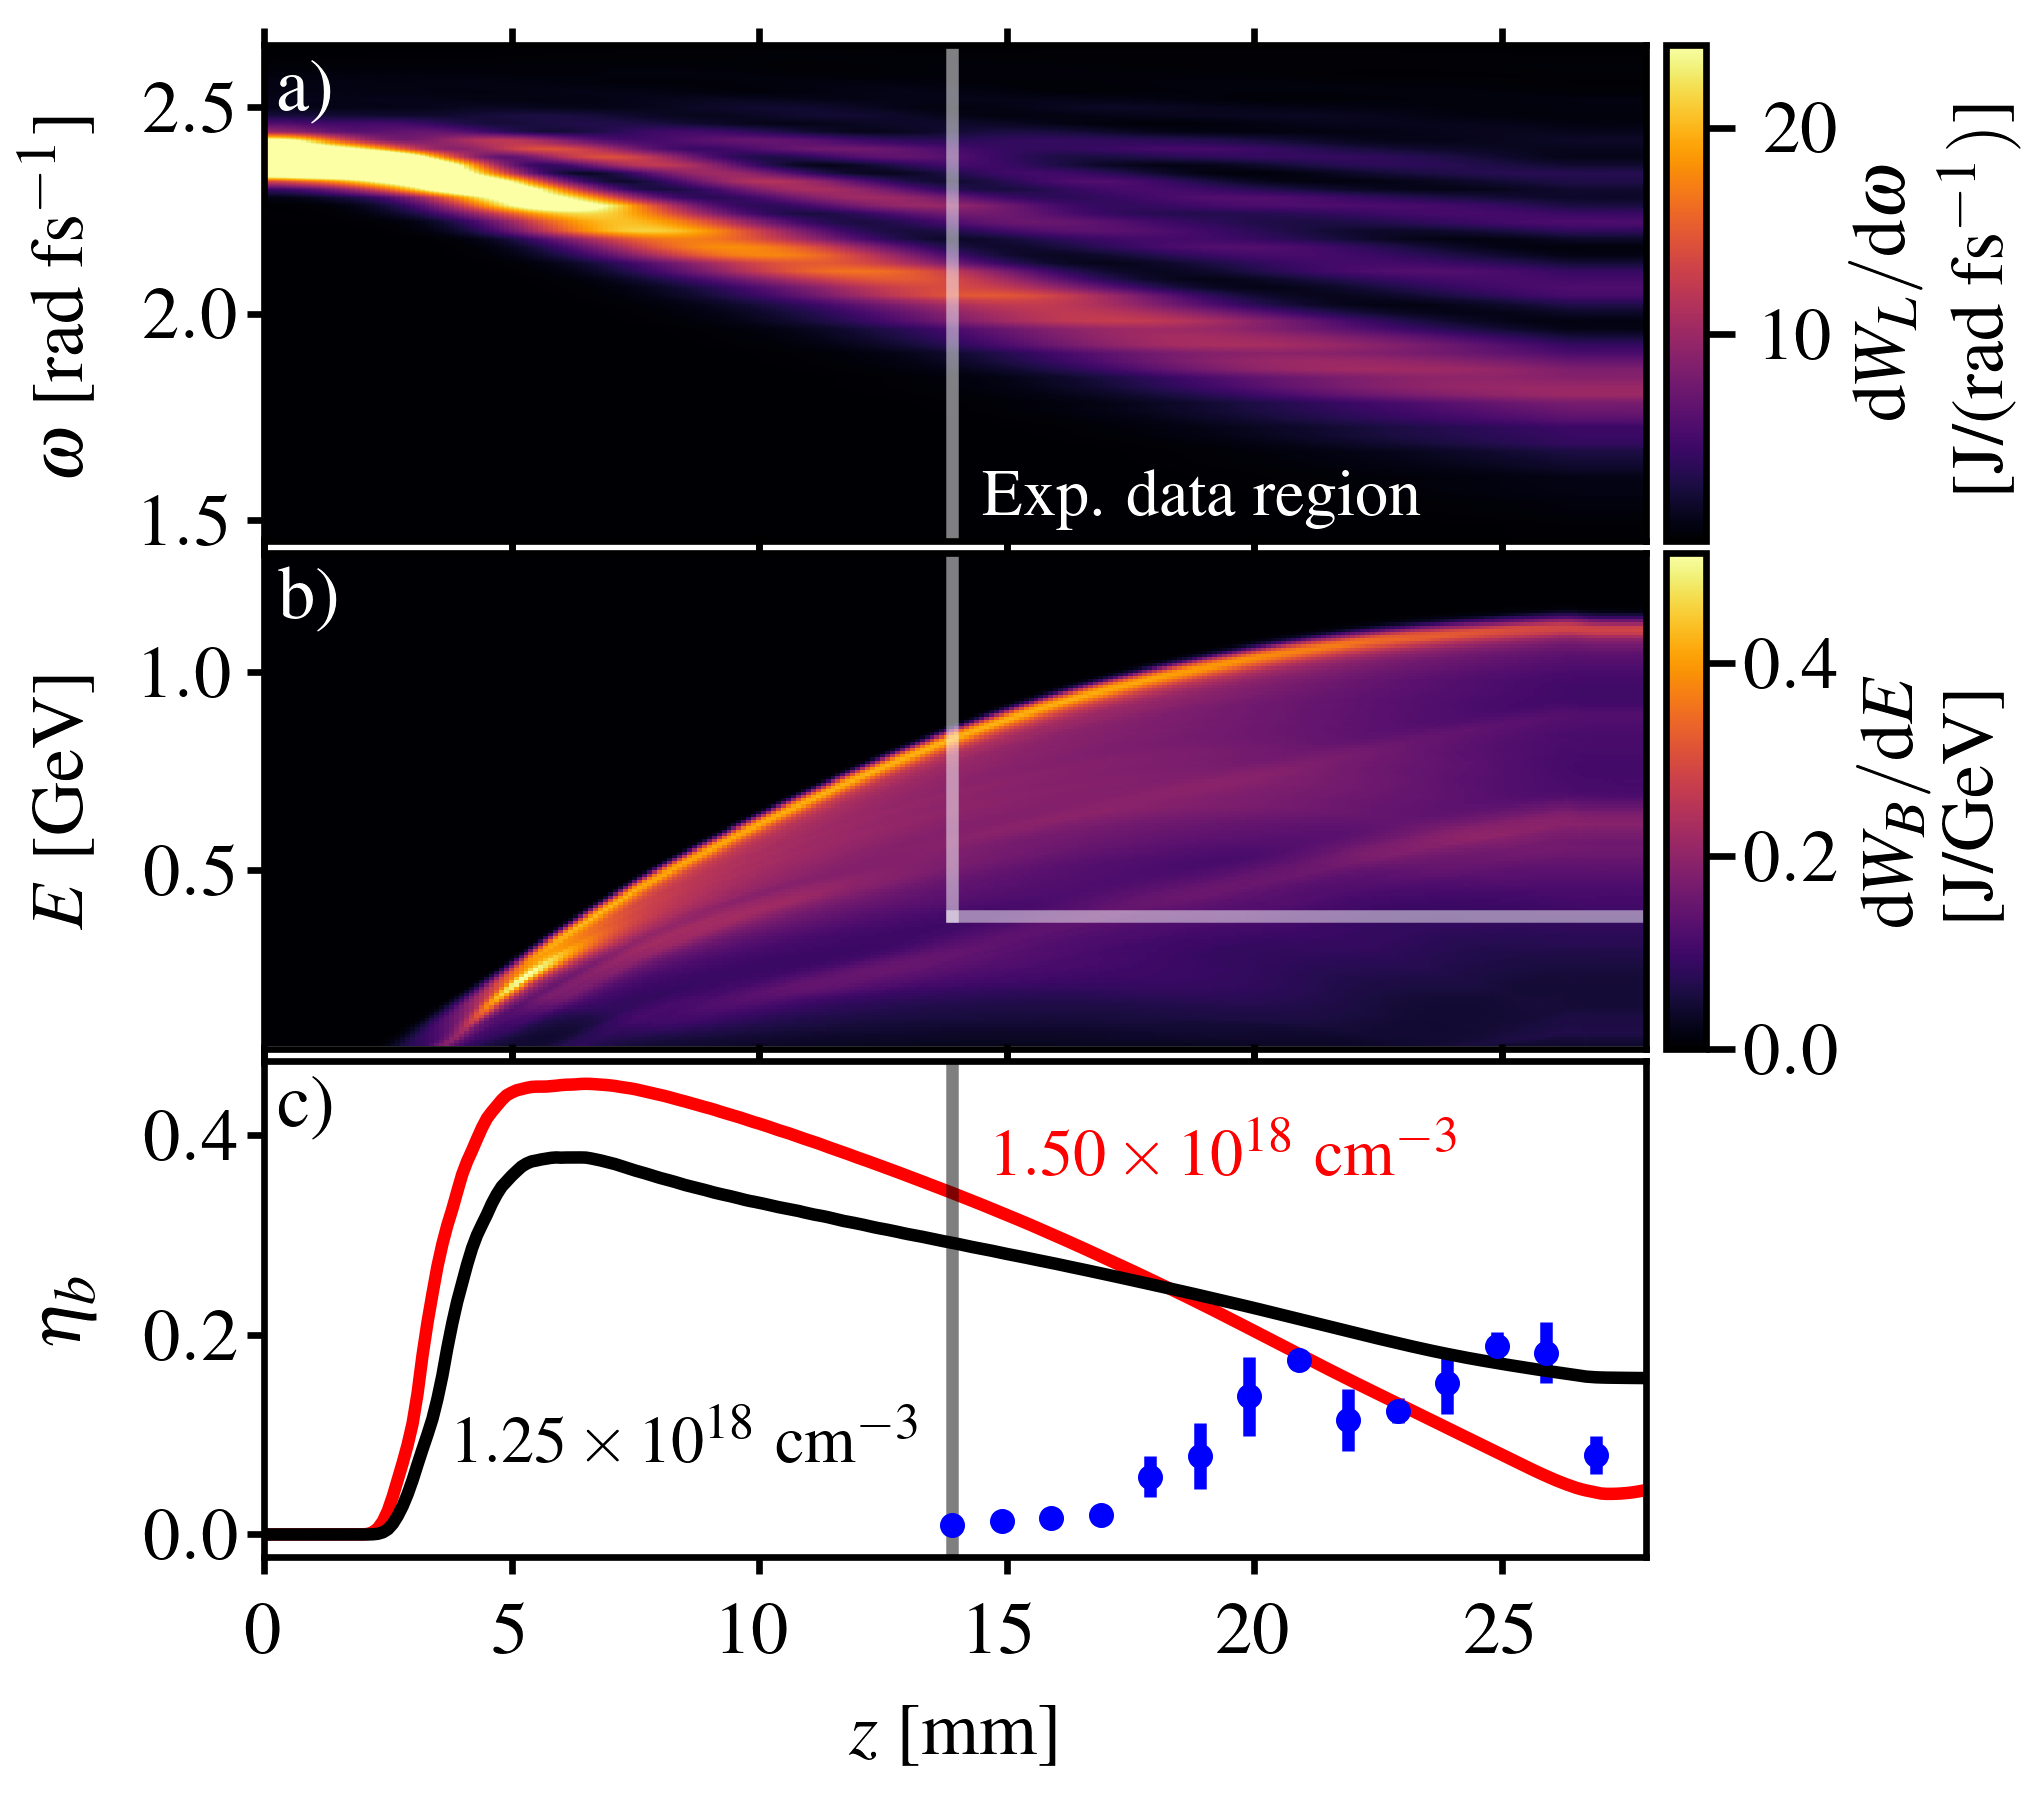
The extraction efficiency is shown in Figure 3c for cm-3 and for a slightly higher density cm-3. For the higher density case, the laser intensity reached a larger value during the initial self-focusing, resulting in the trapping of % more charge. Also for the higher density, the laser pulse maintained over the full acceleration distance, thereby driving a higher amplitude wake. As a result, beam-loading was less severe and so the extraction efficiency was initially higher than for the lower density case. However, for the higher density case the efficiency dropped significantly throughout the accelerator, as the electron beam dephased and started to decelerate for mm.
Simulations using the same plasma profile with plateau densities of cm-3, show that both the maximum final electron energy and extraction efficiencies were optimised for cm-3. Operating the LWFA at a higher density but over a shorter length allows for higher efficiency, but results in a lower maximum electron energy.
Figure 4 shows the electron beam position relative to the axial longitudinal electric field in the lab frame with a Galilean coordinate transform to the linear group velocity of the laser . The fields are shown both with (figure 4a) and without (figure 4b) the contribution of the trapped electron bunch. After the initial self-focusing phase, the laser pulse steadily dropped from to at mm, causing a gradual reduction in the wavelength of the wakefield . In addition, as the shape of the wakefield smoothly changed from the saw-tooth profile of the highly non-linear regime to a quasi-linear sinusoidal profile, which also had the effect of moving the position of peak accelerating field further forward. As shown in figure 4b, these effects combined to balance the subluminal group velocity of the driving laser pulse and so the trapped highly relativistic electrons closely tracked the position of highest field strength. Figure 4a, shows the effect of beam-loading, which reduced the accelerating field experienced by the rear of the bunch to % of the value at the head.
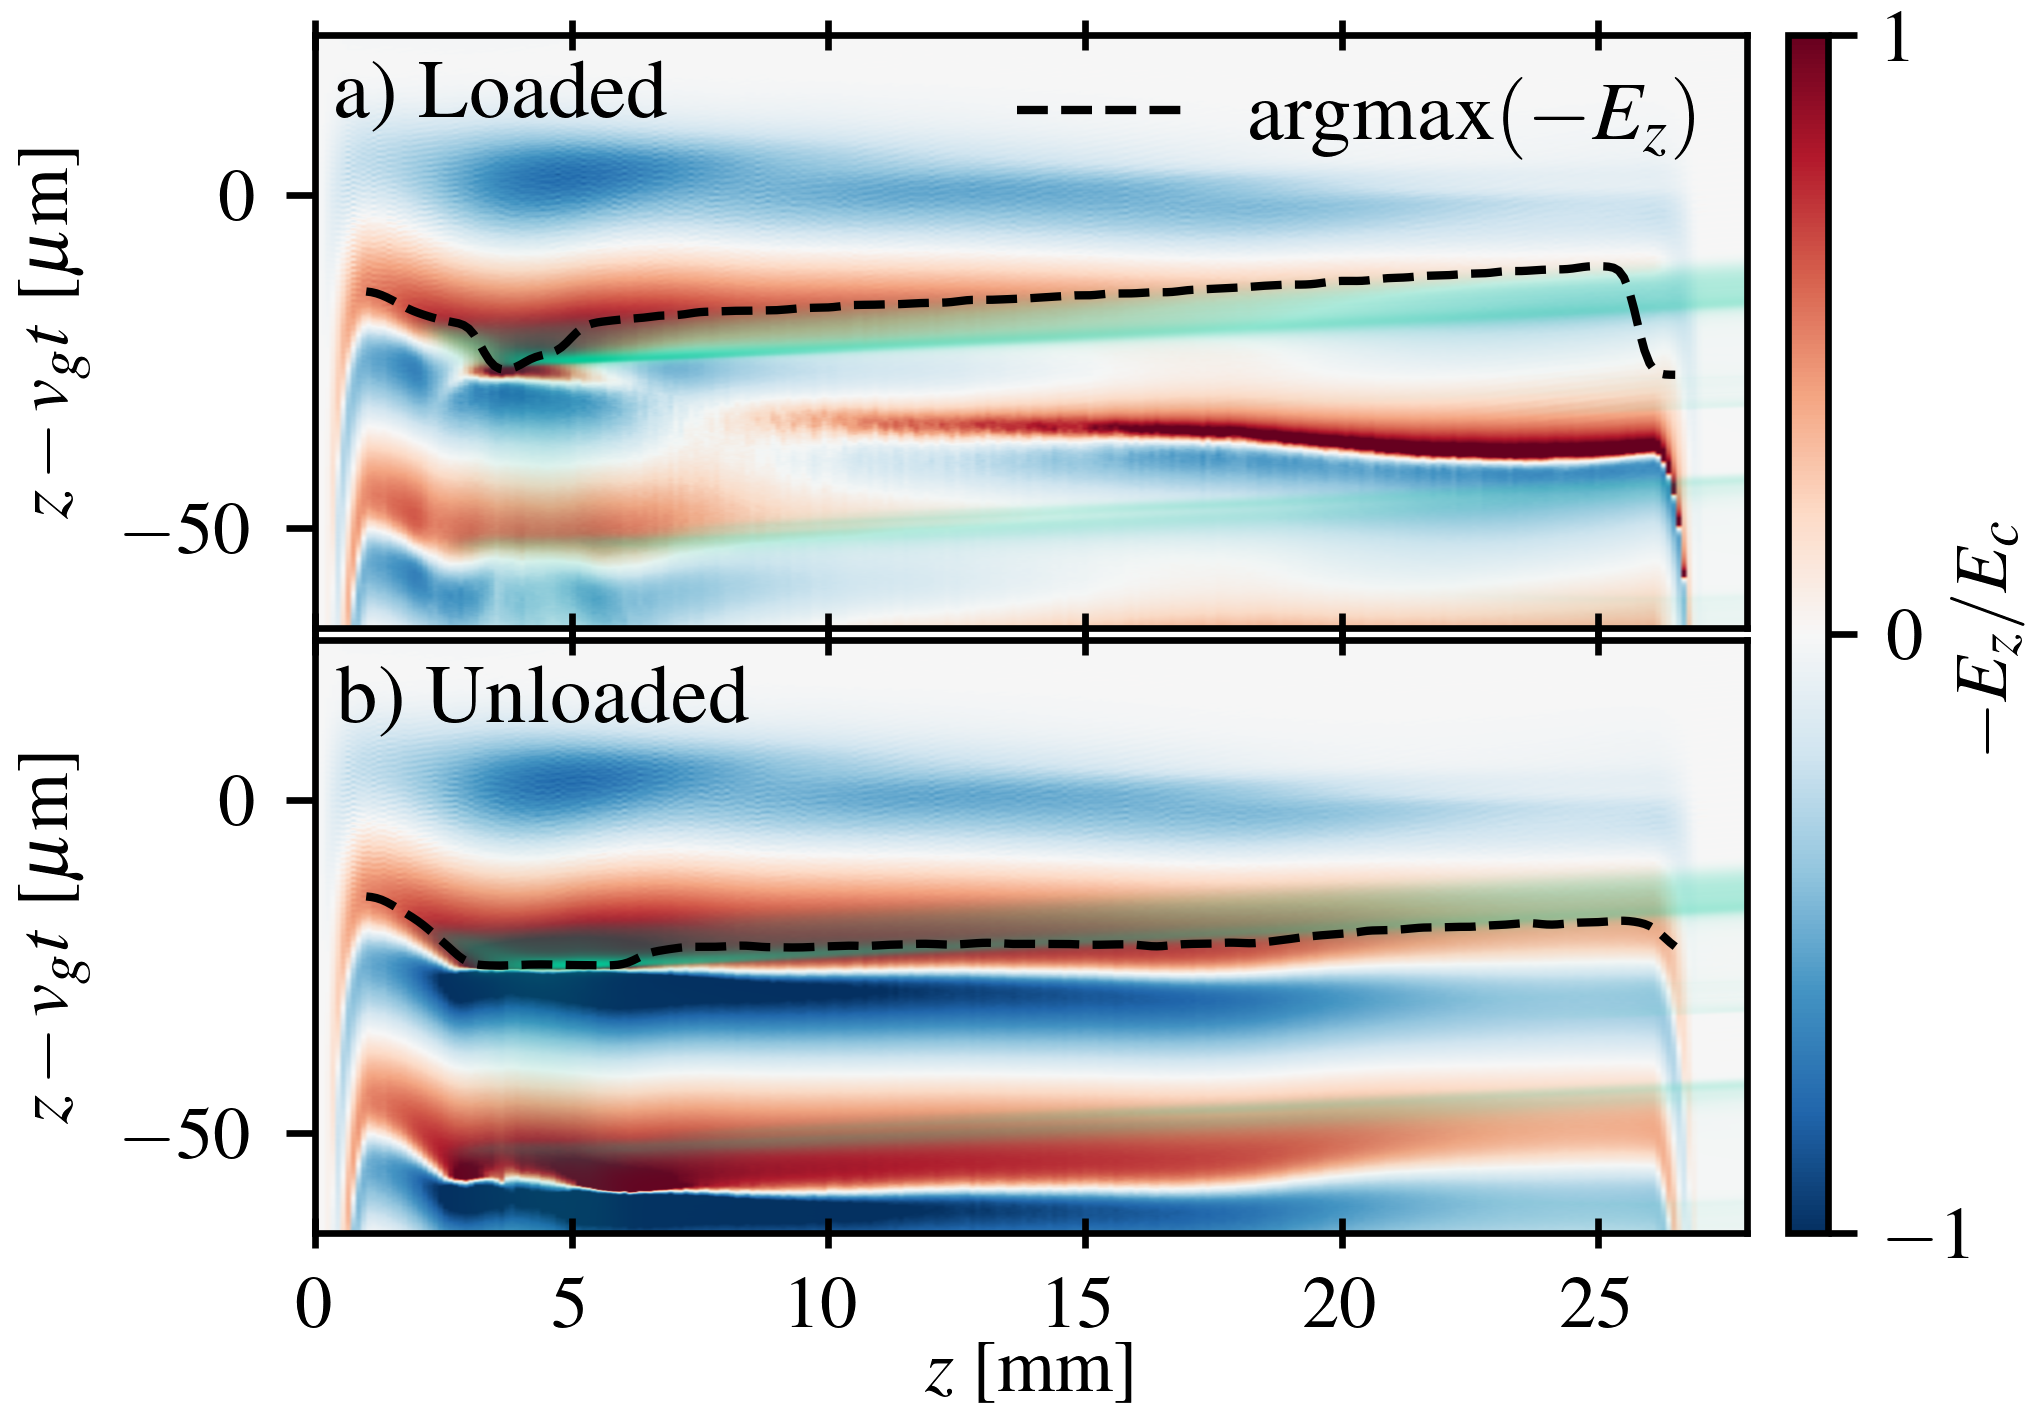
During injection, the normalised vector potential reached a peak value of , significantly above the threshold for ionisation injection. Electrons injected at this point were trapped on deep orbits Chen et al. (2012) in which electrons obtained the wakefield phase velocity significantly before the back of the wake, and so never experienced the maximum accelerating wakefield. From this point on, a non-evolving laser driver would have caused the electron beam to dephase at mm with a maximum energy of 800 MeV. However, the driver evolution acted to mitigate dephasing, resulting in the higher observed electron beam energy of 1.2 GeV.
Methods for accelerating electrons to energies beyond the dephasing limit have been explored, including non-uniform plasma profiles Pukhov and Kostyukov (2008); Guillaume et al. (2015); Ma et al. (2018); Sadler et al. (2020) or by using alternative laser focusing geometries with spatio-temporal couplings Debus et al. (2019); Palastro et al. (2020); Caizergues et al. (2020). Phase-locked LWFA dynamics in a constant density plasma have been observed in PIC simulations previously Li et al. (2014) although in that case it was attributed to pulse depletion. However, depletion increases the wakefield amplitude due to laser redshifting () and so this effect alone would actually increase the wakefield wavelength and cause the electron beam to dephase more rapidly. Here we show that through careful management of the laser evolution it is possible to mitigate dephasing, so that pulse depletion determines the electron energy limit for the accelerator.
In conclusion, we have measured the extraction efficiency for an LWFA, which reached a maximum of %, close to that previously observed in electron-beam-driven PWFA Litos et al. (2014). The measurements indicated that only approximately 20% of the laser pulse energy was transferred to the plasma wakefield, with approximately one third of the laser energy wasted due to a non-ideal focal spot. The overall efficiency could therefore be increased by improving the spatial distribution of the laser pulse, as indicated by PIC simulations with a Gaussian distribution as well as previous studies on the effects of non-Gaussian focal spots Vieira et al. (2012). Laser energy that remains after the interaction could possibly be recovered to further improve the total efficiency of a LWFA facility. For the highest plasma densities and longest interaction length, the laser pulse spectrum was observed to span a complete octave from 800–1600 nm. Further harnessing of these effects may open up a route to relativistic intensity single cycled mid-IR laser pulses Streeter et al. (2018); Nie et al. (2018, 2020).
The data and analysis scripts are available at the online repository zenodo.org at Streeter (2022).
Acknowledgements.
We acknowledge support from the UK STFC core Grants No. ST/P002056/1 (Cockcroft Institute), No. ST/P000835/1, No. ST/P002021/1, and No. ST/V001639/1 (John Adams Institute), UK EPSRC (EP/J018171/1, EP/N028694/1), the European Union’s Horizon 2020 research and innovation programme under grant agreement Laserlab-Europe (871124), the National Science Foundation (Grant No. 1804463) and the Air Force Office of Scientific Research (Grant No. FA9550-16-1-0121). F. A. acknowledges funding from the DOE Early Career research program (Fusion Energy Sciences SCW1575-1).References
- Leemans et al. (2006) W. P. Leemans, B. Nagler, A. J. Gonsalves, C. Tóth, K. Nakamura, C. G. R. Geddes, E. Esarey, C. B. Schroeder, and S. M. Hooker, Nature Physics 2, 696 (2006).
- Kneip et al. (2009) S. Kneip, S. R. Nagel, S. F. Martins, S. P. D. Mangles, C. Bellei, O. Chekhlov, R. J. Clarke, N. Delerue, E. J. Divall, G. Doucas, K. Ertel, F. Fiuza, R. Fonseca, P. Foster, S. J. Hawkes, C. J. Hooker, K. Krushelnick, W. B. Mori, C. A. J. Palmer, K. T. Phuoc, P. P. Rajeev, J. Schreiber, M. J. V. Streeter, D. Urner, J. Vieira, L. O. Silva, and Z. Najmudin, Physical Review Letters 103, 035002 (2009).
- Clayton et al. (2010) C. E. Clayton, J. E. Ralph, F. Albert, R. A. Fonseca, S. H. Glenzer, C. Joshi, W. Lu, K. A. Marsh, S. F. Martins, W. B. Mori, A. Pak, F. S. Tsung, B. B. Pollock, J. S. Ross, L. O. Silva, and D. H. Froula, Physical Review Letters 105, 105003 (2010).
- Wang et al. (2013) X. Wang, R. Zgadzaj, N. Fazel, Z. Li, S. A. Yi, X. Zhang, W. Henderson, Y.-Y. Chang, R. Korzekwa, H.-E. Tsai, C.-H. Pai, H. Quevedo, G. Dyer, E. Gaul, M. Martinez, A. C. Bernstein, T. Borger, M. Spinks, M. Donovan, V. Khudik, G. Shvets, T. Ditmire, and M. C. Downer, Nature Communications 4, 1988 (2013).
- Leemans et al. (2014) W. P. Leemans, A. J. Gonsalves, H.-S. Mao, K. Nakamura, C. Benedetti, C. B. Schroeder, C. Toth, J. Daniels, D. E. Mittelberger, S. S. Bulanov, J.-L. Vay, C. G. R. Geddes, and E. Esarey, Physical Review Letters 113, 245002 (2014).
- Gonsalves et al. (2019) A. J. Gonsalves, K. Nakamura, J. Daniels, C. Benedetti, C. Pieronek, T. C. H. de Raadt, S. Steinke, J. H. Bin, S. S. Bulanov, J. van Tilborg, C. G. R. Geddes, C. B. Schroeder, C. Tóth, E. Esarey, K. Swanson, L. Fan-Chiang, G. Bagdasarov, N. Bobrova, V. Gasilov, G. Korn, P. Sasorov, and W. P. Leemans, Physical Review Letters 122, 084801 (2019).
- Litos et al. (2014) M. Litos, E. Adli, W. An, C. I. Clarke, C. E. Clayton, S. Corde, J. P. Delahaye, R. J. England, A. S. Fisher, J. Frederico, S. Gessner, S. Z. Green, M. J. Hogan, C. Joshi, W. Lu, K. A. Marsh, W. B. Mori, P. Muggli, N. Vafaei-Najafabadi, D. Walz, G. White, Z. Wu, V. Yakimenko, and G. Yocky, Nature 515, 92 (2014).
- Esarey et al. (2009) E. Esarey, C. B. Schroeder, and W. P. Leemans, Reviews of Modern Physics 81, 1229 (2009).
- Shiraishi et al. (2013) S. Shiraishi, C. Benedetti, A. J. Gonsalves, K. Nakamura, B. H. Shaw, T. Sokollik, J. van Tilborg, C. G. R. Geddes, C. B. Schroeder, C. Tóth, E. Esarey, and W. P. Leemans, Physics of Plasmas 20, 063103 (2013).
- Vieira et al. (2012) J. Vieira, S. F. Martins, F. Fiúza, C. K. Huang, W. B. Mori, S. P. D. Mangles, S. Kneip, S. Nagel, Z. Najmudin, and L. O. Silva, Plasma Physics and Controlled Fusion 54, 55010 (2012).
- Katsouleas et al. (1987) T. Katsouleas, S. Wilks, P. Chen, J. M. Dawson, and J. J. Su, Particle Accelerators 22, 81 (1987).
- Gordienko and Pukhov (2005) S. Gordienko and A. Pukhov, Physics of Plasmas 12, 043109 (2005).
- Lu et al. (2007) W. Lu, M. Tzoufras, C. Joshi, F. Tsung, W. Mori, J. Vieira, R. Fonseca, and L. Silva, Physical Review Special Topics - Accelerators and Beams 10, 061301 (2007).
- Tzoufras et al. (2008) M. Tzoufras, W. Lu, F. S. Tsung, C. Huang, W. B. Mori, T. Katsouleas, J. Vieira, R. A. Fonseca, and L. O. Silva, Physical Review Letters 101, 145002 (2008).
- Bulanov et al. (1992) S. V. Bulanov, I. N. Inovenkov, V. I. Kirsanov, N. M. Naumova, and A. S. Sakharov, Physics of Fluids B: Plasma Physics 4, 1935 (1992).
- Oliveira e Silva and Mendonça (1998) L. Oliveira e Silva and J. T. Mendonça, Physical Review E 57, 3423 (1998).
- Hussein et al. (2019) A. E. Hussein, N. Senabulya, Y. Ma, M. J. V. Streeter, B. Kettle, S. J. D. Dann, F. Albert, N. Bourgeois, S. Cipiccia, J. M. Cole, O. Finlay, E. Gerstmayr, I. G. González, A. Higginbotham, D. A. Jaroszynski, K. Falk, K. Krushelnick, N. Lemos, N. C. Lopes, C. Lumsdon, O. Lundh, S. P. D. Mangles, Z. Najmudin, P. P. Rajeev, C. M. Schlepütz, M. Shahzad, M. Smid, R. Spesyvtsev, D. R. Symes, G. Vieux, L. Willingale, J. C. Wood, A. J. Shahani, and A. G. R. Thomas, Scientific Reports 9, 3249 (2019).
- Matsuoka et al. (2010) T. Matsuoka, C. McGuffey, P. G. Cummings, Y. Horovitz, F. Dollar, V. Chvykov, G. Kalintchenko, P. Rousseau, V. Yanovsky, S. S. Bulanov, A. G. R. Thomas, A. Maksimchuk, and K. Krushelnick, Physical Review Letters 105, 034801 (2010).
- Schreiber et al. (2010) J. Schreiber, C. Bellei, S. P. D. Mangles, C. Kamperidis, S. Kneip, S. R. Nagel, C. A. J. Palmer, P. P. Rajeev, M. J. V. Streeter, and Z. Najmudin, Physical Review Letters 105, 235003 (2010).
- Lehe et al. (2016) R. Lehe, M. Kirchen, I. A. Andriyash, B. B. Godfrey, and J.-L. Vay, Computer Physics Communications 203, 66 (2016).
- Mangles et al. (2012) S. P. D. Mangles, G. Genoud, M. S. Bloom, M. Burza, Z. Najmudin, A. Persson, K. Svensson, A. G. R. Thomas, and C.-G. Wahlström, Physical Review Special Topics - Accelerators and Beams 15, 11302 (2012).
- Rowlands-Rees et al. (2008) T. P. Rowlands-Rees, C. Kamperidis, S. Kneip, A. J. Gonsalves, S. P. D. Mangles, J. G. Gallacher, E. Brunetti, T. Ibbotson, C. D. Murphy, P. S. Foster, M. J. V. Streeter, F. Budde, P. A. Norreys, D. A. Jaroszynski, K. Krushelnick, Z. Najmudin, and S. M. Hooker, Physical Review Letters 100, 105005 (2008).
- Pak et al. (2010) A. Pak, K. A. Marsh, S. F. Martins, W. Lu, W. B. Mori, and C. Joshi, Physical Review Letters 104, 025003 (2010).
- McGuffey et al. (2010) C. McGuffey, A. G. R. Thomas, W. Schumaker, T. Matsuoka, V. Chvykov, F. J. Dollar, G. Kalintchenko, V. Yanovsky, A. Maksimchuk, K. Krushelnick, V. Y. Bychenkov, I. V. Glazyrin, and a. V. Karpeev, Physical Review Letters 104, 025004 (2010).
- Chen et al. (2012) M. Chen, E. Esarey, C. B. Schroeder, C. G. R. Geddes, and W. P. Leemans, Physics of Plasmas 19, 033101 (2012).
- Pukhov and Kostyukov (2008) A. Pukhov and I. Kostyukov, Physical Review E 77, 025401(R) (2008).
- Guillaume et al. (2015) E. Guillaume, A. Döpp, C. Thaury, K. Ta Phuoc, A. Lifschitz, G. Grittani, J. P. Goddet, A. Tafzi, S. W. Chou, L. Veisz, and V. Malka, Physical Review Letters 115, 155002 (2015).
- Ma et al. (2018) Y. Ma, D. Seipt, S. J. D. Dann, M. J. V. Streeter, C. A. J. Palmer, L. Willingale, and A. G. R. Thomas, Physics of Plasmas 25, 113105 (2018).
- Sadler et al. (2020) J. D. Sadler, C. Arran, H. Li, and K. A. Flippo, Physical Review Accelerators and Beams 23, 021303 (2020).
- Debus et al. (2019) A. Debus, R. Pausch, A. Huebl, K. Steiniger, R. Widera, T. E. Cowan, U. Schramm, and M. Bussmann, Physical Review X 9, 031044 (2019).
- Palastro et al. (2020) J. P. Palastro, J. L. Shaw, P. Franke, D. Ramsey, T. T. Simpson, and D. H. Froula, Physical Review Letters 124, 134802 (2020).
- Caizergues et al. (2020) C. Caizergues, S. Smartsev, V. Malka, and C. Thaury, Nature Photonics 14, 475 (2020).
- Li et al. (2014) W. Li, J. Liu, W. Wang, Z. Zhang, Q. Chen, Y. Tian, R. Qi, C. Yu, C. Wang, T. Tajima, R. Li, and Z. Xu, Applied Physics Letters 104, 093510 (2014).
- Streeter et al. (2018) M. J. V. Streeter, S. Kneip, M. S. Bloom, R. A. Bendoyro, O. Chekhlov, A. E. Dangor, A. Döpp, C. J. Hooker, J. Holloway, J. Jiang, N. C. Lopes, H. Nakamura, P. A. Norreys, C. A. J. Palmer, P. P. Rajeev, J. Schreiber, D. R. Symes, M. Wing, S. P. D. Mangles, and Z. Najmudin, Physical Review Letters 120, 254801 (2018).
- Nie et al. (2018) Z. Nie, C. H. Pai, J. Hua, C. Zhang, Y. Wu, Y. Wan, F. Li, J. Zhang, Z. Cheng, Q. Su, S. Liu, Y. Ma, X. Ning, Y. He, W. Lu, H. H. Chu, J. Wang, W. B. Mori, and C. Joshi, Nature Photonics 12, 489 (2018).
- Nie et al. (2020) Z. Nie, C.-H. Pai, J. Zhang, X. Ning, J. Hua, Y. He, Y. Wu, Q. Su, S. Liu, Y. Ma, Z. Cheng, W. Lu, H.-H. Chu, J. Wang, C. Zhang, W. B. Mori, and C. Joshi, Nature Communications 11, 2787 (2020).
- Streeter (2022) M. J. V. Streeter, (2022), 10.5281/zenodo.7188057.
Supplemental
Experimental Setup
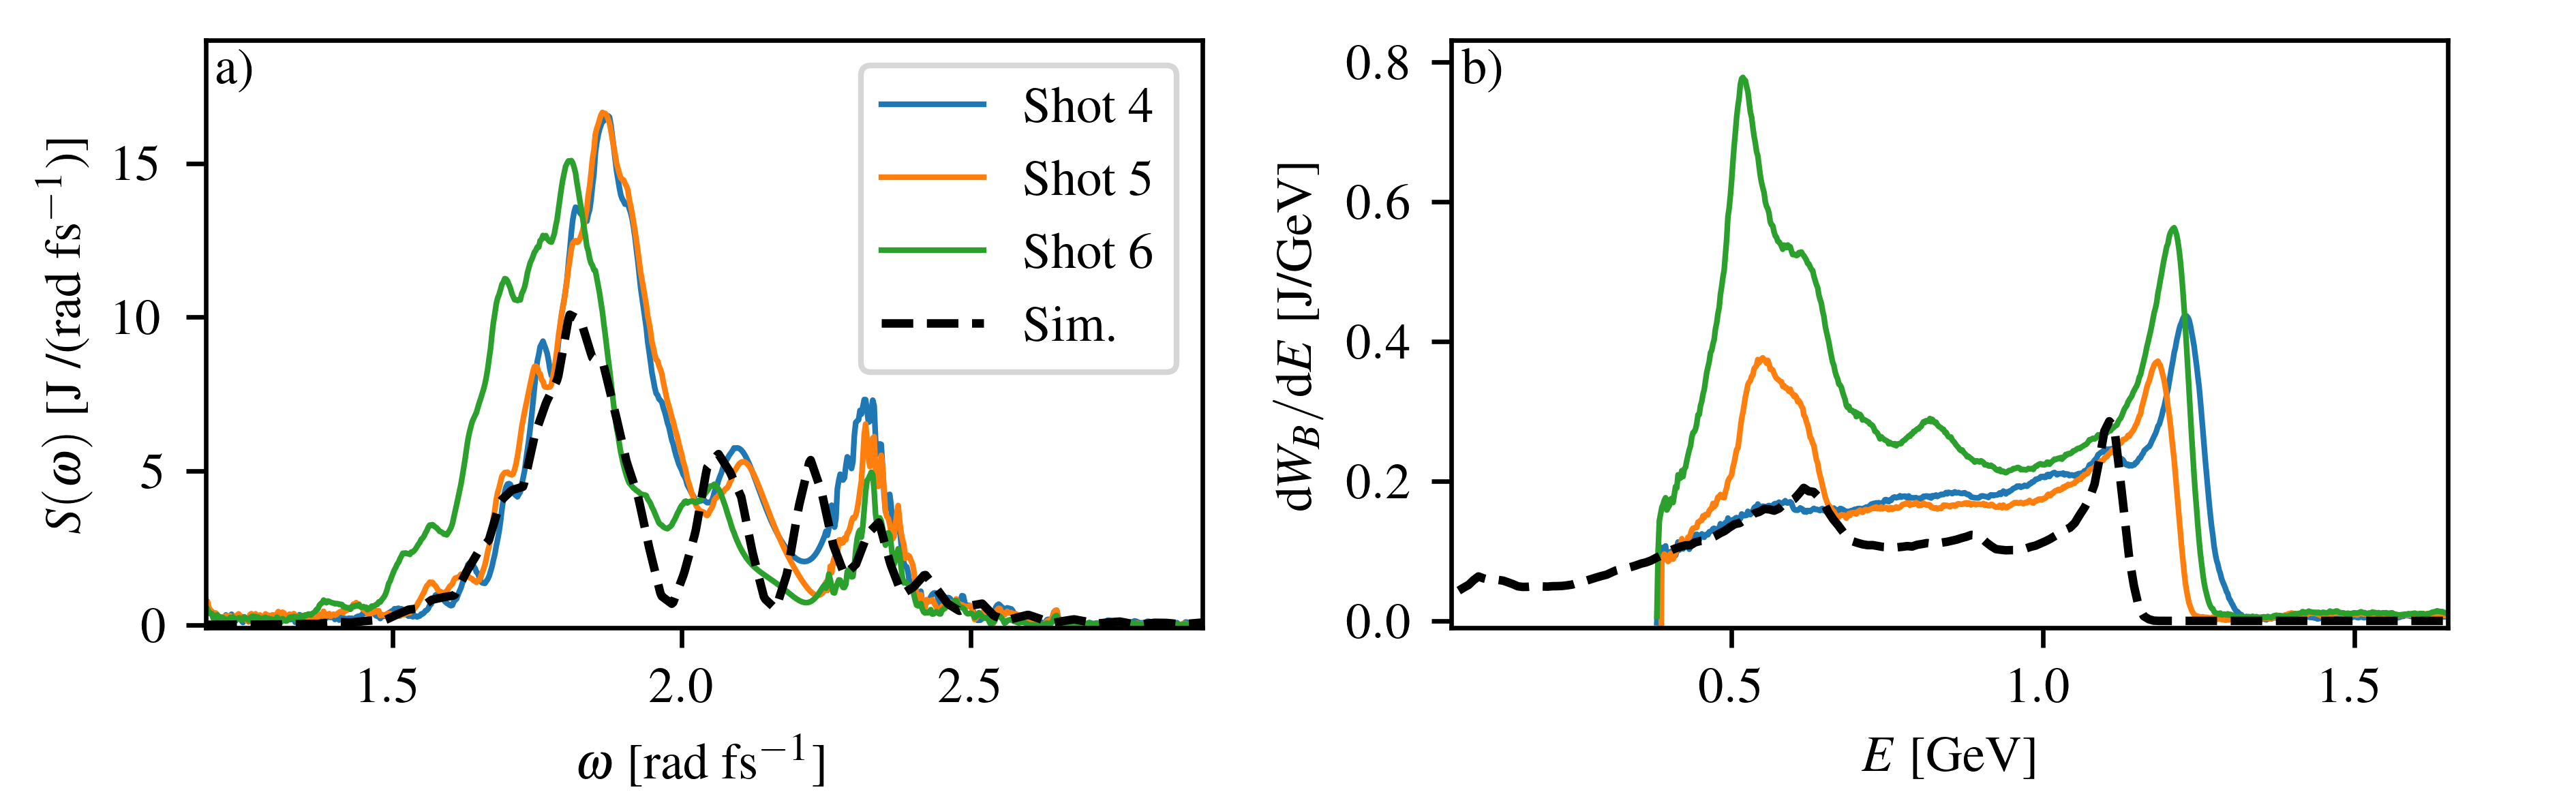
Figure 5 shows a conceptual sketch of the experimental setup. The the length of the acceleration stage of the gas cell was varied by translating the gas cell vertically. The longest gas cell (27 mm total length) was achieved by aligning the laser to the top of the entrance and exit slits. A dividing wall with a vertical slit was used to confine gas to the two compartments of the gas cell. Scattered laser light was imaged through the glass slides at the two sides of the gas cell.
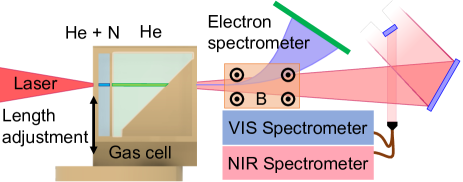
The laser focus was measured with a microscope objective which imaged the focal plane onto a CCD. A 2D Gaussian fit was performed to obtain an analytical approximation to the laser for particle-in-cell simulations. Figure 6 shows an example measured and fitted focal spot image.
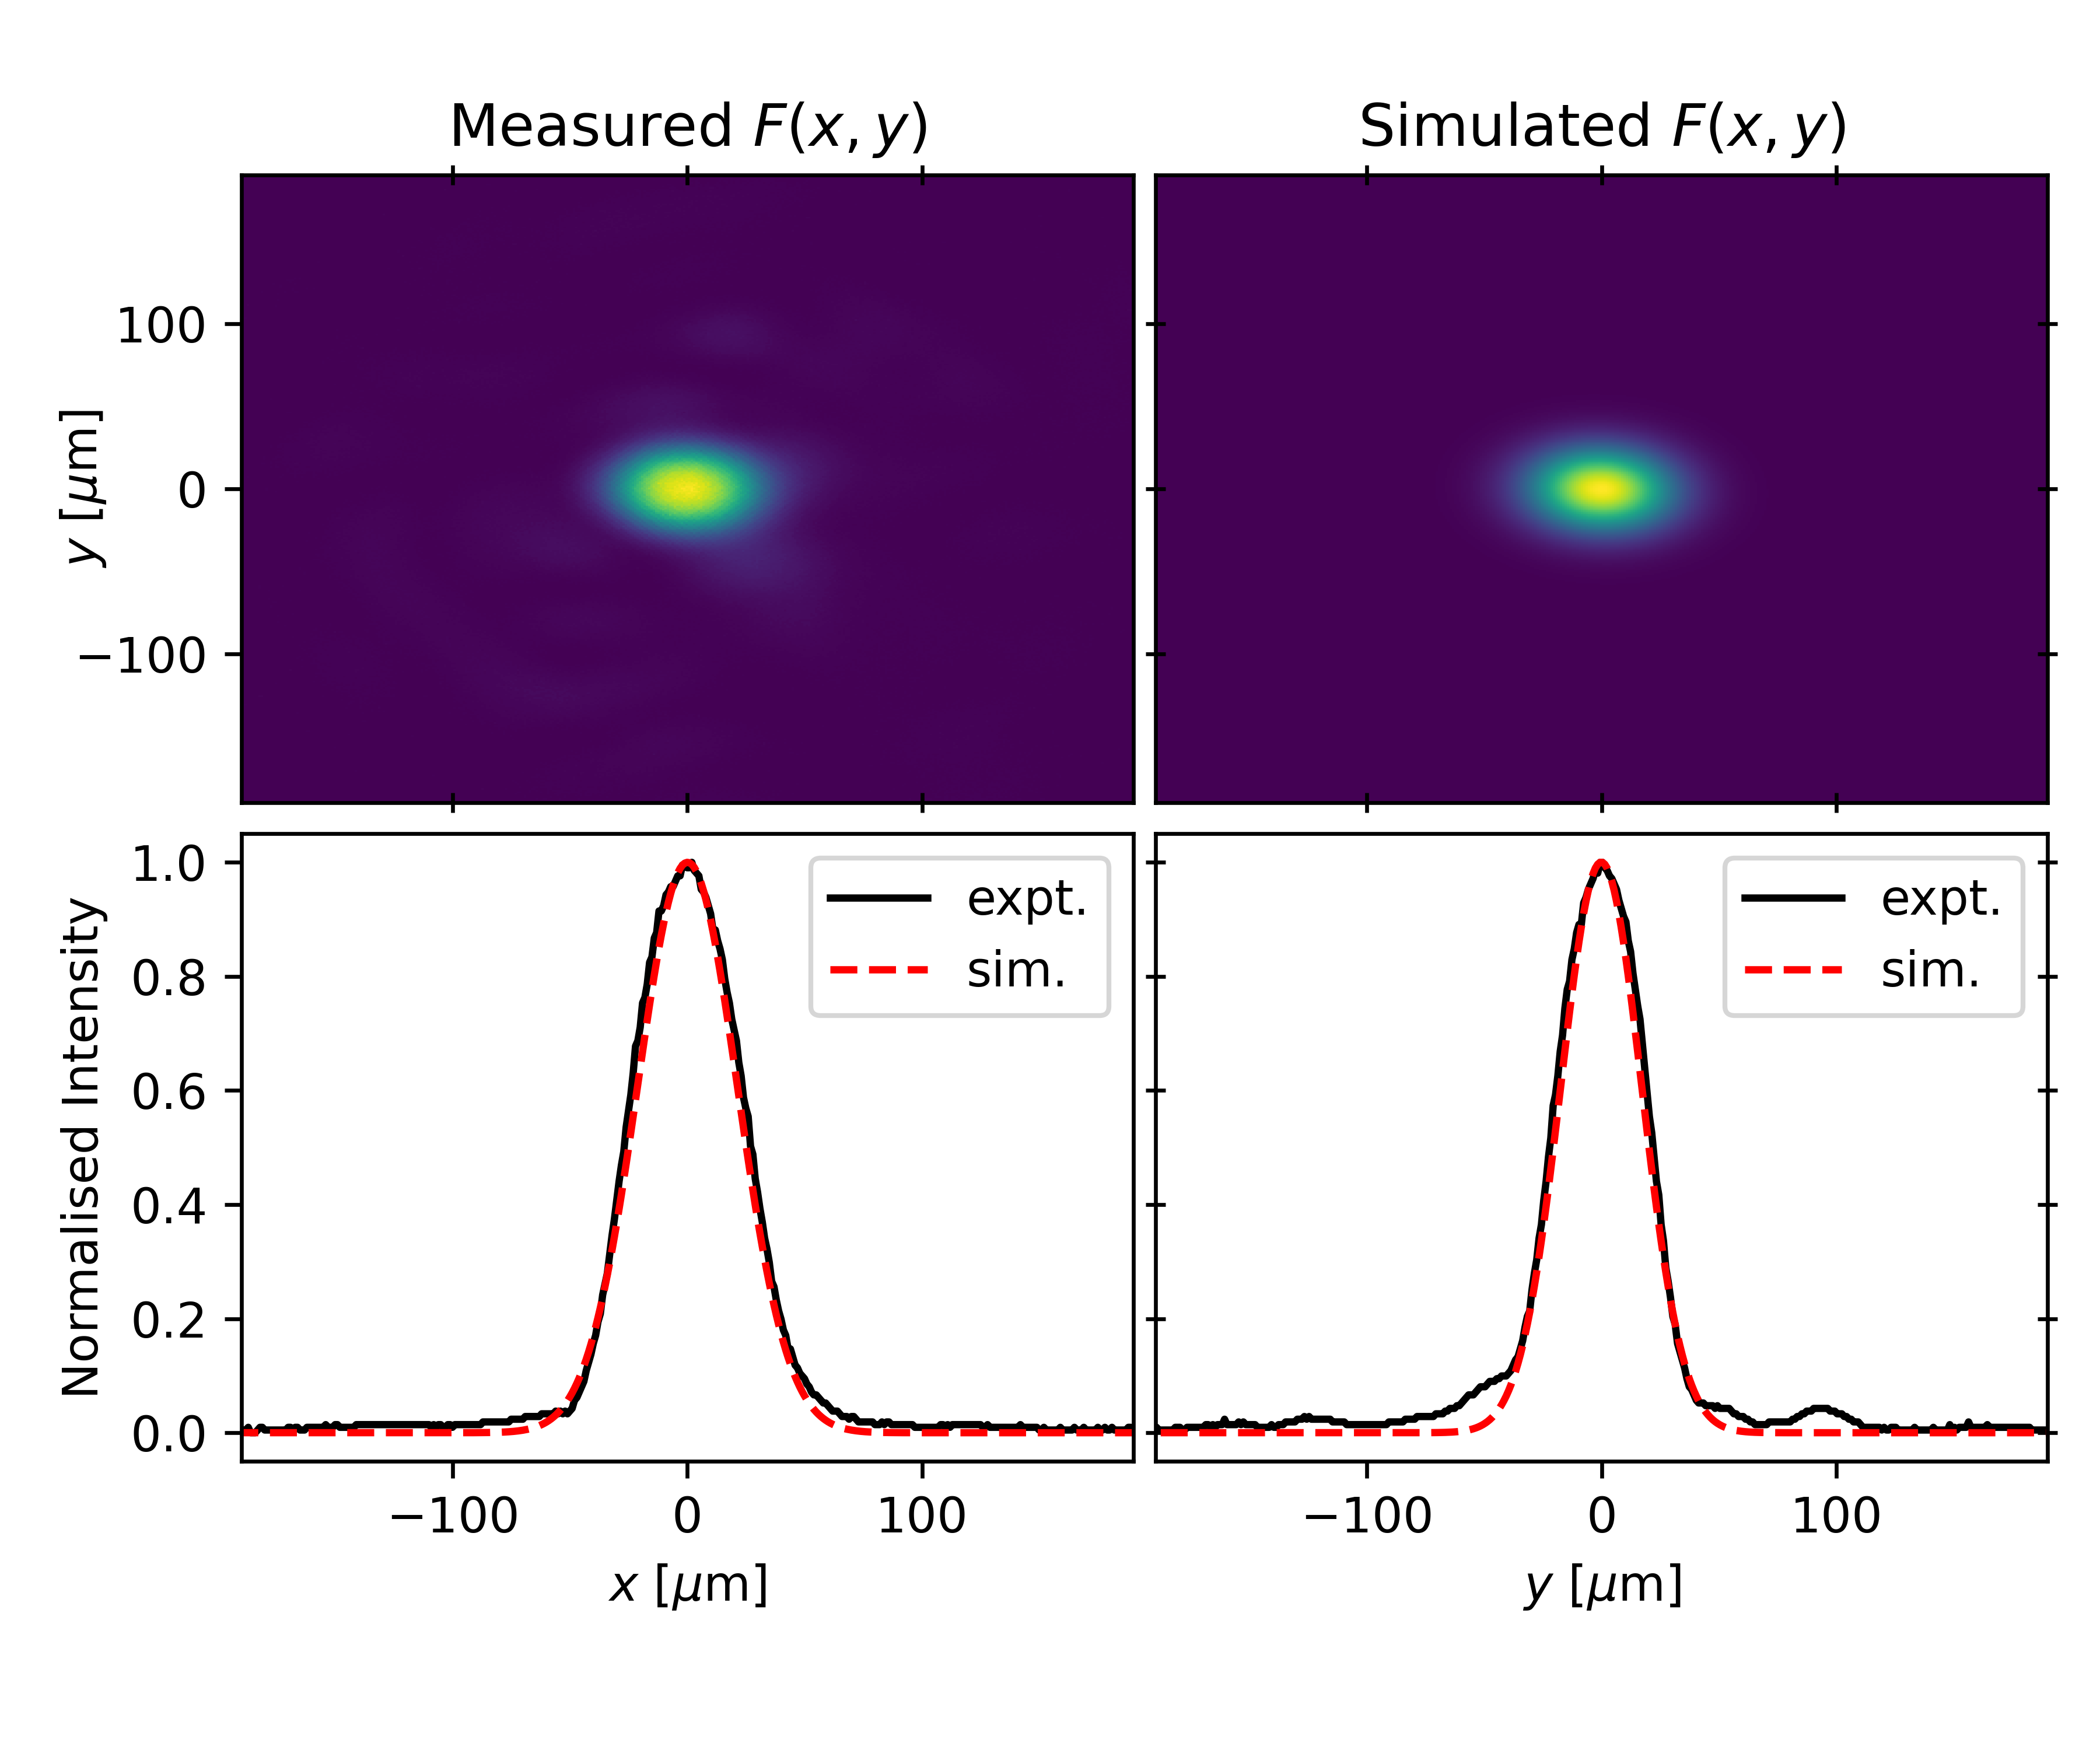
The temporal profile of the laser pulse, as measured by a second harmonic generation frequency resolved optical gating (SHG-FROG) is show in figure 7. The sample profile was using in the particle-in-cell simulations.
Experimental data
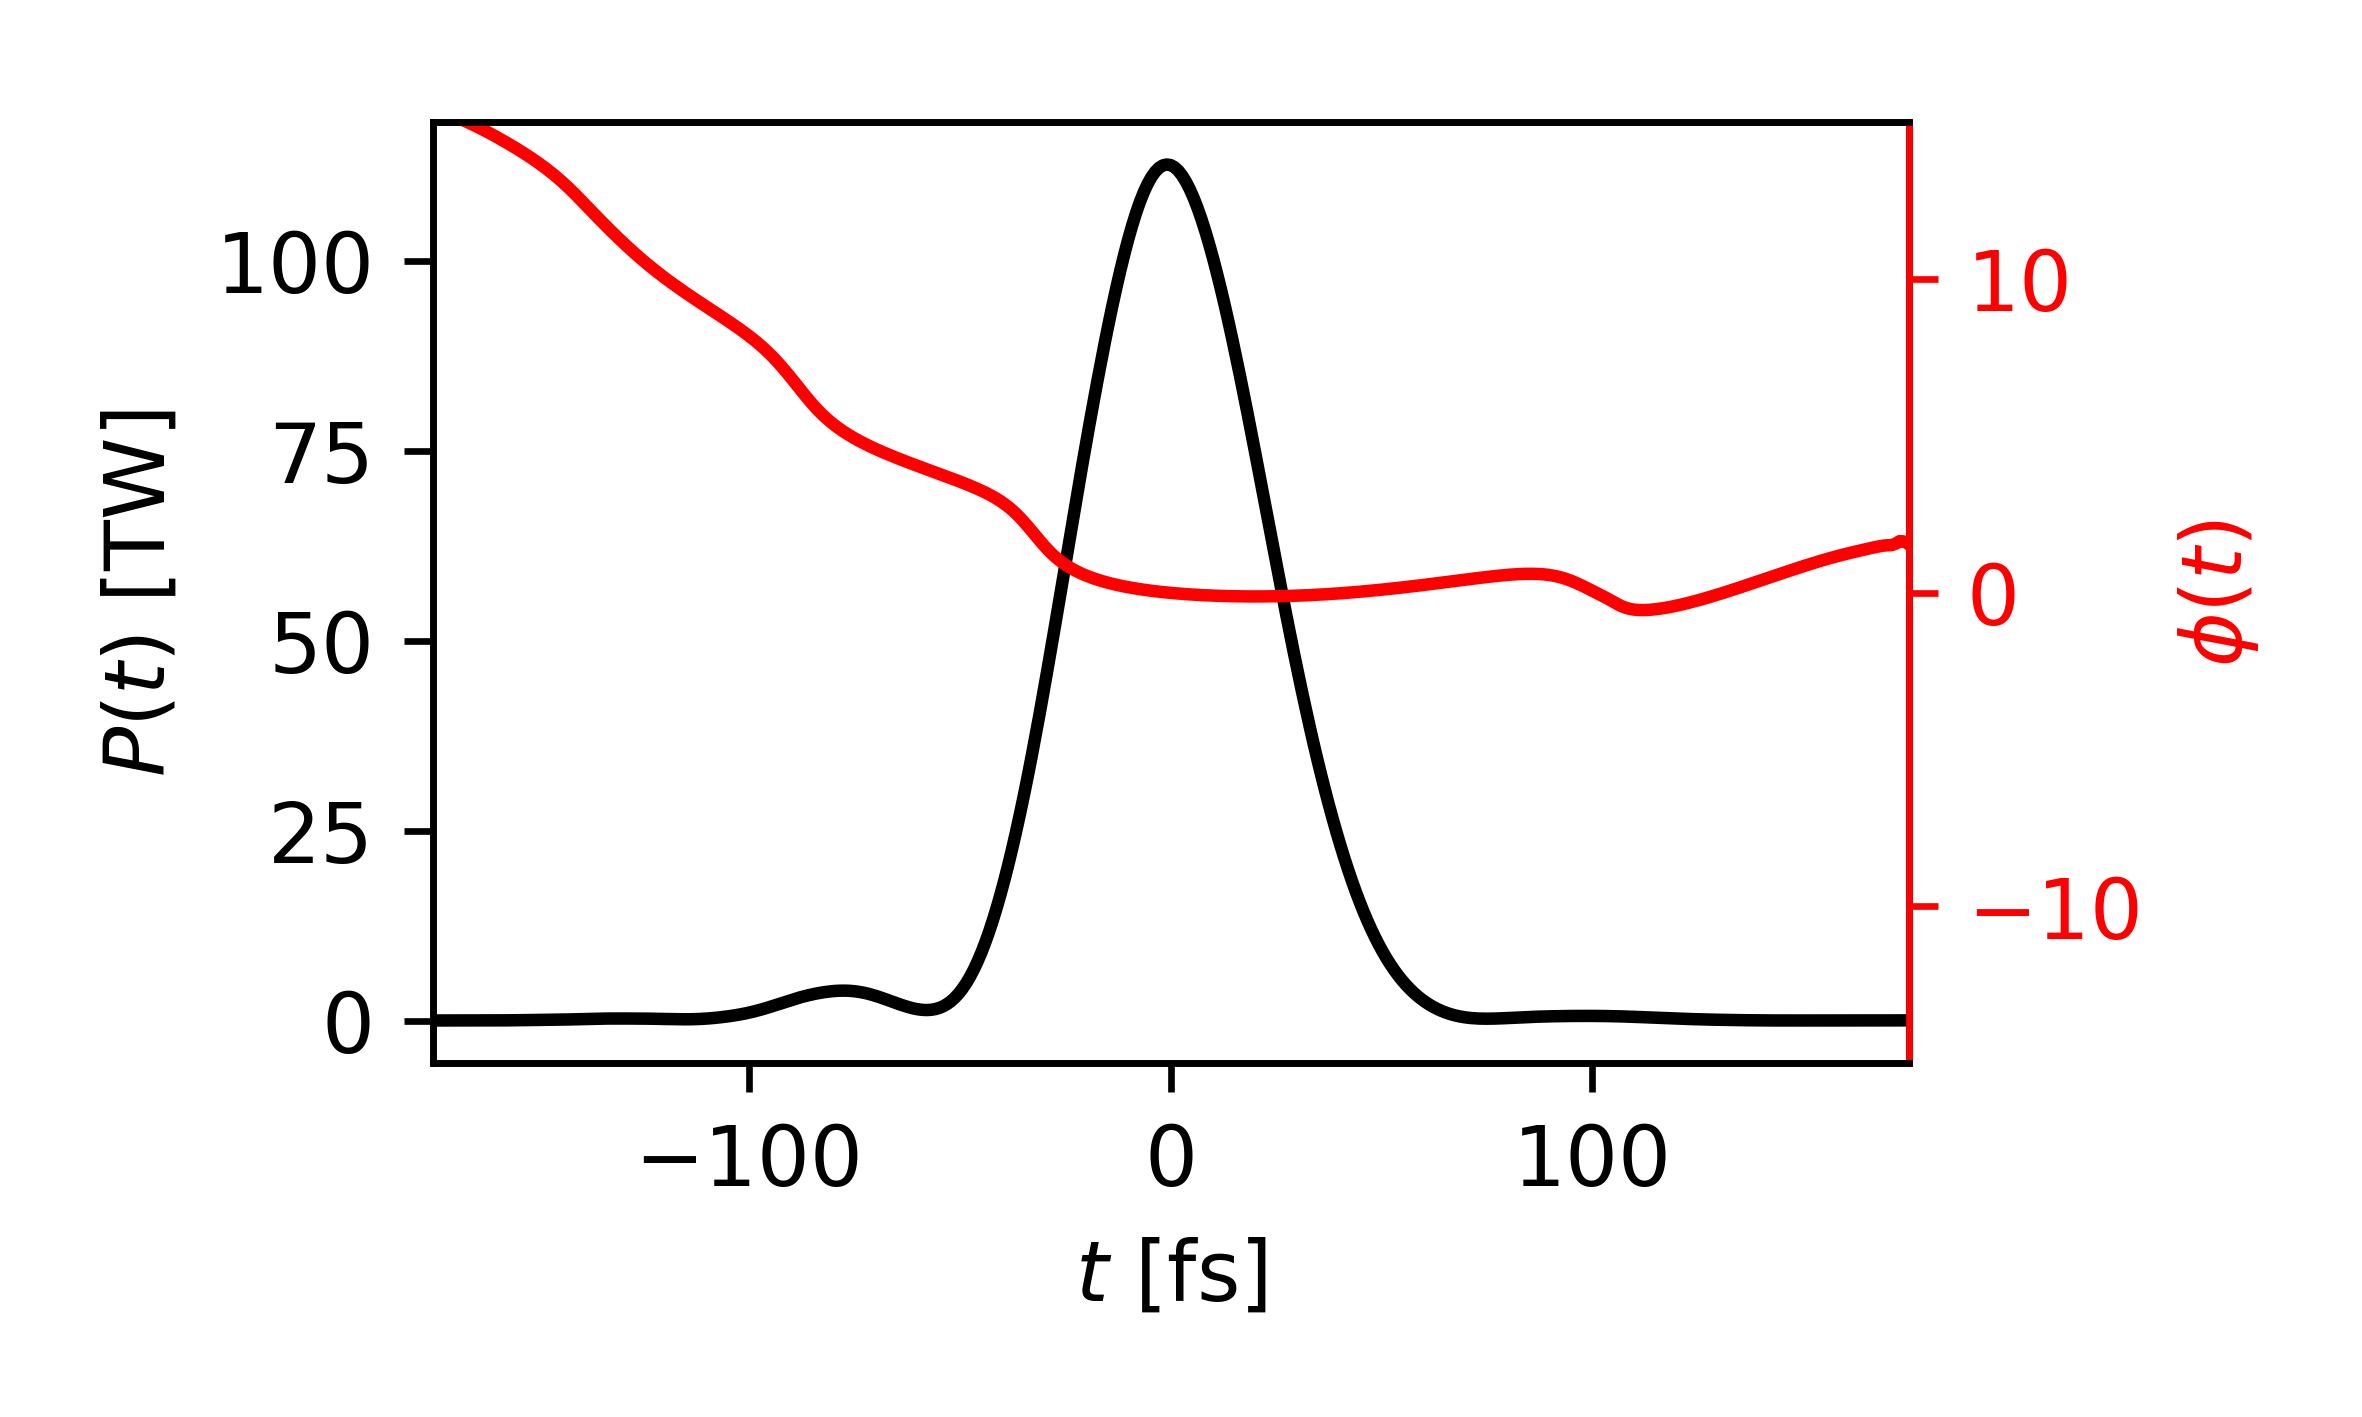
Example electron and laser spectra from three shots with identical conditions are are shown in figure 8. Also shown in figure 9 is a montage of electron beams produced in the length-scan at cm-3.
Interpolation across gap in laser spectrum measurement
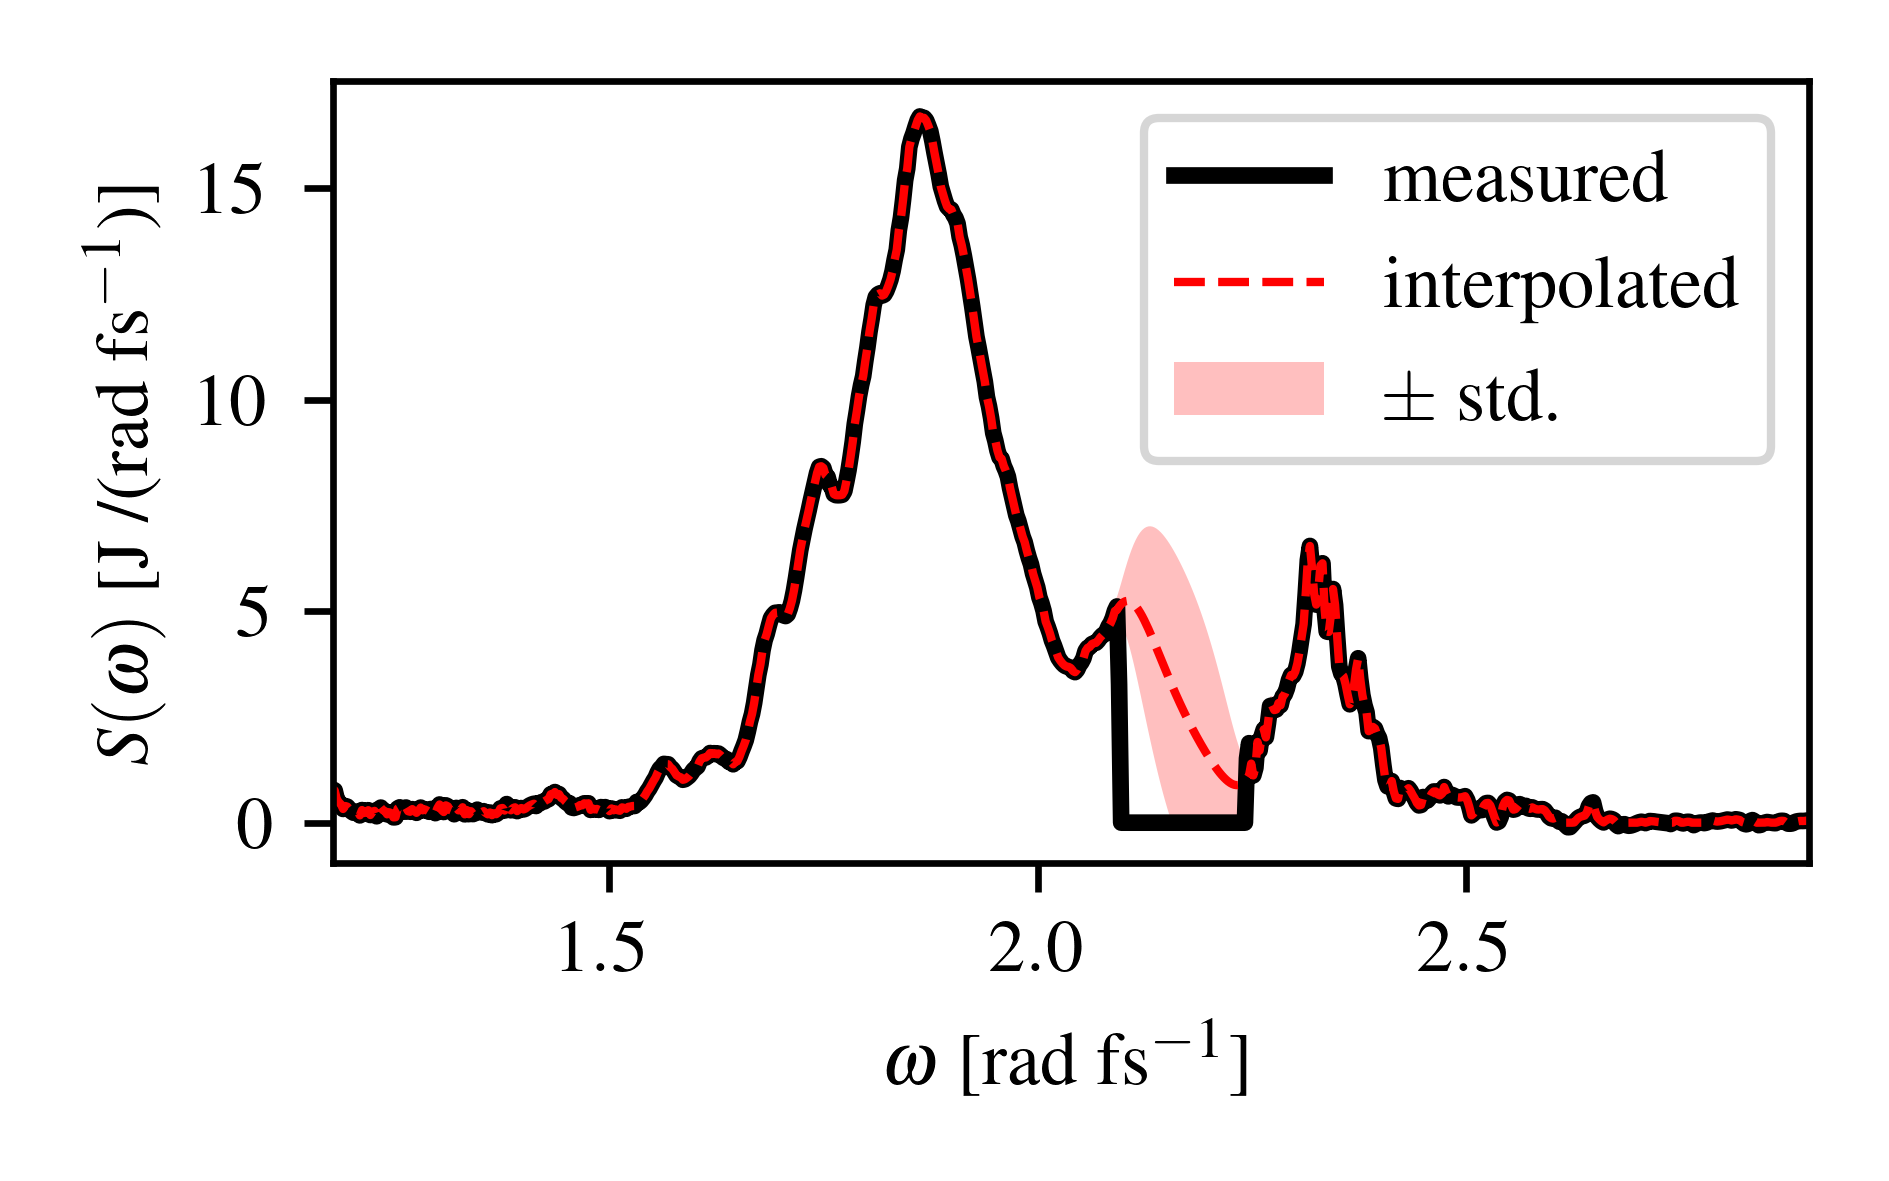
Due to the gap in the laser spectrum measurement, interpolation was required to more accurately measure the average frequency of the transmitted laser pulse. This was performed by training a Gaussian-process regression model on the measured region of the spectrum and using it to predict the signal in the measurement gap. A new model was trained for each shot, using 200 randomly selected points from the measured spectrum and a Matern kernel with a fixed scale length of 0.05 rad fs-1. The relative error on the inferred laser energy due the uncertainty of this interpolation was estimated by taking the standard deviation of the laser energy using 100 random samples from the Gaussian process model. Figure 10 shows the results of an interpolation.
Measured photon number vs plasma length
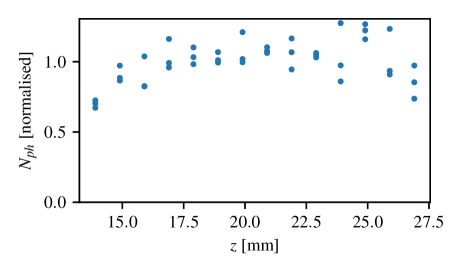
The measurement of the laser energy from the average frequency relies on the assumption that the number of photons is constant. This assumption has a strong justification based on the fundamentals of the forward Raman-scattering process that drives the plasma wave in laser-wakefield acceleration. The average frequency measurement is much more robust to changes in collection efficiency and allows for on-axis sampling to give an accurate measurement of the transmitted laser energy. An approximate test of this assumption can be performed by measuring the photon number of the measured laser spectrum, under the assumption that the sampling collection efficiency scales with . This is plotted as a function of the plasma cell length in figure 11.
Simulations
Simulations were performed using the quasi-3D Particle-In-Cell (PIC) code FBPIC (https://fbpic.github.io/index.html) using cylindrical symmetry with azimuthal mode decomposition. The simulation domain was m in the propagation () and radial axes, which were divided into cells with four azimuthal modes (). The simulation window co-propagated with the laser, with the window velocity set equal to the linear group velocity of the laser . The simulation time-step was 0.167 fs. The plasma electrons, helium ions and nitrogen ions were each represented by macro-particles per cell in the , and directions. Open boundary conditions were used for both the and directions.
The plasma was initialized with a density of mm-3 (once the helium was fully ionised), with m linear ramps either side of a 26 mm plateau. The helium ions were initalised as singly ionised and nitrogen was initially ionised up the the 5th level. The ionisation thresholds were calculated using the Ammosov-Delone-Krainov (ADK) model. The temporal profile of the laser pulse was taken from FROG measurements of the input laser pulses during the experiment. Measurements of the laser focal spot were used to fit a 2D Gaussian transverse profile as with m and m. The laser was linearly polarized in the -direction.
Convergence testing was performed to examine the effects of the transverse resolution, by varying the number of transverse cells and the number of azimuthal modes . Otherwise identical simulations were performed for and . No appreciable difference was seen in the laser spectrum, electron beam energy, transfer efficiency or the longitudinal electric field as these parameters were changed, indicating that they were not significantly affected by numerical noise.