PRF-18-002
PRF-18-002
The very forward CASTOR calorimeter
of the CMS experiment
Abstract
The physics motivation, detector design, triggers, calibration, alignment, simulation, and overall performance of the very forward CASTOR calorimeter of the CMS experiment are reviewed. The CASTOR Cherenkov sampling calorimeter is located very close to the LHC beam line, at a radial distance of about 1\unitcm from the beam pipe, and at 14.4\unitm from the CMS interaction point, covering the pseudorapidity range of . It was designed to withstand high ambient radiation and strong magnetic fields. The performance of the detector in measurements of forward energy density, jets, and processes characterized by rapidity gaps, is reviewed using data collected in proton and nuclear collisions at the LHC.
0.1 Introduction
The CASTOR (Centauro And STrange Object Research) calorimeter was proposed [1, 2], built [3, 4, 5, 6, 7], and installed in the CMS experiment [8] with the purpose of studying very forward particle production in heavy ion (HI) and proton-proton (\Pp\Pp) collisions at the CERN LHC. The calorimeter extends the CMS acceptance to the very forward pseudorapidity range, .
The location and design of CASTOR are optimized for the study of the longitudinal development of electromagnetic and hadronic showers produced by particles emitted at very small polar angles (between 0.16∘ and 0.64∘) with respect to the beam direction. This prime detector motivation—focused on searches for deeply penetrating particles, such as strangelets [1, 2], connected to exotic events observed in high-energy cosmic ray (CR) interactions [9, 10, 11]—was extended also to measurements of generic properties of particle production at forward rapidities in inelastic proton and nuclear collisions, as well as to identify rapidity gaps (regions in the detector devoid of any particle production) in diffractive and exclusive processes [12, 13]. The physics program and reach of the multipurpose CASTOR calorimeter are broad and unique, because no comparable instrumentation exists in this range at any other interaction point (IP) of the LHC.
The installation of a calorimeter at the forward rapidities covered by CASTOR involves significant challenges. The beam pipe is just 1\unitcm away from the detector and must be carefully protected. The calorimeter is immersed in the forward shielding of CMS, which channels the strong magnetic field from the central region of the apparatus. Small gaps in the shielding produce strong local variations in the magnetic field structure. The field has a magnitude of about in the vicinity of the detector and has an impact on the shower development inside the calorimeter and also, more importantly, on the gain of the photomultiplier tubes (PMTs) used to record the signals. Because of the enormous Lorentz boost of the particles produced at rapidities approaching the beam direction, the energy absorbed by the calorimeter reaches hundreds of \TeVper collision event [14], and thus the radioactive activation of the calorimeter itself, as well as of the surrounding shielding, is one of the largest at the LHC per unit of integrated luminosity. Because of the lack of precise vertex-pointing capabilities of the calorimeter, it is not possible to distinguish particles produced in different proton or nucleus collisions occurring simultaneously at the IP (pileup), within the default 25\unitns readout integration time of the detector. Thus, operation of the CASTOR calorimeter is most useful for LHC luminosities corresponding to a maximum average number of collisions around one per bunch crossing. Lower luminosities are often required for physics analyses that are very sensitive to pileup backgrounds.
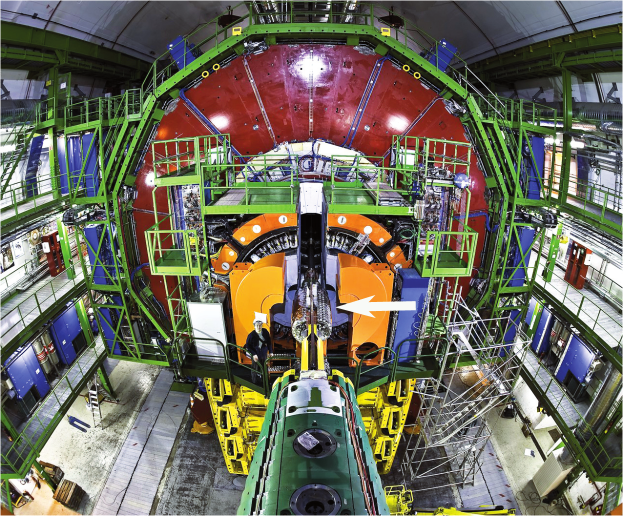
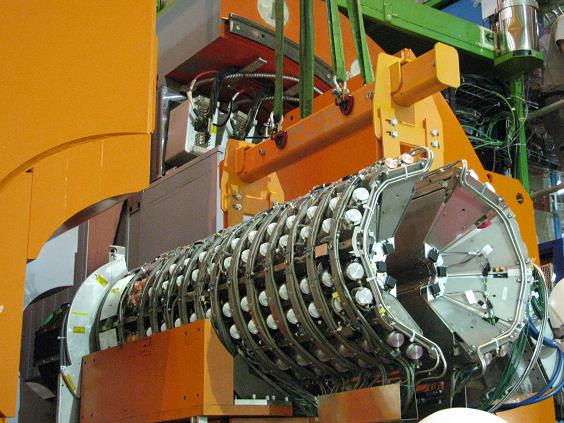
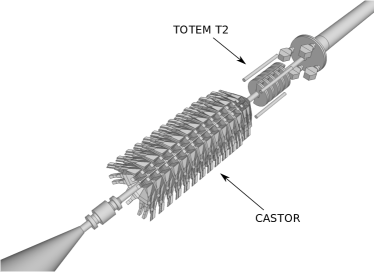
Figure 1 shows the CASTOR calorimeter installed around the beam pipe in front of the central part of the CMS detector, and Fig. 2 (left) displays a closeup view of the calorimeter surrounded by the open collar shielding. A visualization of the calorimeter integration around the beam pipe is shown in Fig. 2 (right).
Many of the results discussed in this work are based on the various CASTOR measurements carried out so far in \Pp\Pp [15, 16, 17, 18, 19, 20, 21, 22], proton-lead (\PpPb) [23, 24, 25], and lead-lead (PbPb) [26] collisions at the LHC. The calorimeter took data during LHC Runs 1 (2009–13) and 2 (2015–2018). It was decommissioned in 2019–20, since a redesign of the beam pipe renders the detector mechanically incompatible with LHC Run 3 operation (expected to start in 2022). The CASTOR data are being made publicly available via the CERN open data initiative [27, 28]. The data are accompanied with all tools, calibration, and running conditions as described and summarized here.
The paper is organized as follows. Section 0.2 reviews the main physics motivations of the CASTOR calorimeter project. The detector design is summarized in Section 0.3, whereas the CASTOR operation and triggers are described in Section 0.4. The event reconstruction, including the calorimeter calibration, and the detector geometry and alignment are discussed in Sections 0.5 and 0.6, respectively. The CASTOR simulation and its validation are presented in Section 0.7. The summary of the paper is provided in Section 0.8.
0.2 Physics motivation
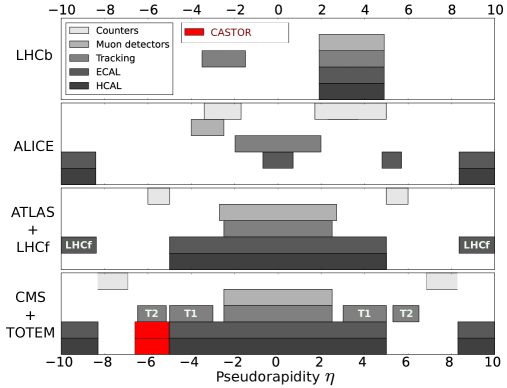
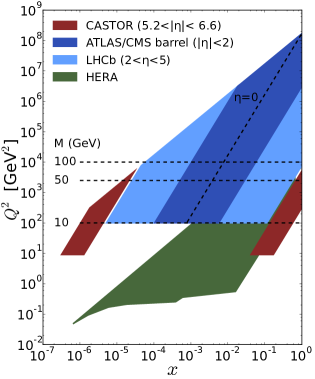
The CASTOR detector closes to a large extent the gap in the calorimetric coverage between the central detector () and the zero-degree calorimeter ( for neutral particles) [29] on one side of the CMS experiment. The addition of the CASTOR calorimeter provides the CMS detector with the most complete geometric coverage a the LHC (Fig. 3, left), thereby opening up unique possibilities for physics measurements in \Pp\Pp, \PpPb, and PbPb collisions. This section summarizes the main research topics accessible with the CASTOR detector.
0.2.1 Forward physics in proton-proton collisions
The physics program of the CASTOR calorimeter includes typical “forward physics” studies [12, 13, 37], such as those connected with low- parton dynamics, underlying event (UE), multiparton interactions (MPI), as well as with diffractive, photon-induced, and central exclusive processes. Key measurements in the investigation of these different topics are very forward energy densities, single-particle (muon, electron) spectra, very forward jets, as well as soft- and hard-diffractive and exclusive processes with a large rapidity gap. Measurements of diffractive, photon-induced, and central exclusive production benefit from the possibility to tag events with large gaps devoid of particle production that are typical of processes with color-singlet (pomeron and/or photon) exchanges, over a broad range of rapidities in the forward acceptance.
By measuring the very forward energy density deposited in the CASTOR acceptance, the characteristics of the UE can be studied in a rapidity region far away from the central hard scattering processes. The impact of CASTOR has been particularly important for underlying event studies [16, 19, 22], and has helped to constrain and tune models used to describe MPI, which are responsible of a large fraction of the UE activity, in Monte Carlo event generators [21].
For the study of processes characterized by rapidity gaps, CASTOR further extends the accessible range in terms of , the fractional momentum loss of the proton, from about for the central part of the CMS experiment alone, down to [20]. The low noise level of the CASTOR calorimeter, equivalent to a few hundred \MeVof energy, allows the reduction in the rate of misidentified rapidity gaps, and improves the rapidity gap tagging efficiency. The use of the CASTOR detector not only extends the kinematic range in which diffraction can be observed, but also helps to disentangle single- and double-diffractive dissociation processes [17].
Measurements of very forward jets in the CASTOR acceptance [38, 23] have opened up the possibility to study parton dynamics in a region of very small parton fractional momenta, (Fig. 3, right), which has never been accessible before. In this low- regime, where the standard Dokshitzer–Gribov–Lipatov–Altarelli–Parisi (DGLAP) parton evolution equations [39, 40, 41] are expected to fail, alternative evolutions described by the Balitsky–Fadeev–Kuraev–Lipatov (BFKL) [42, 43, 44, 45] or gluon saturation [46] dynamics should become important. Forward (di)jets, as proxies of the underlying low- parton scatterings [47, 48], have long been identified as useful probes of beyond-DGLAP phenomena. When one jet is measured in CASTOR and the other in the central CMS region, unique dijet rapidity separations of up to can be reached. Such Mueller–Navelet dijet topologies [49] are sensitive probes of the BFKL parton dynamics [50].
0.2.2 Ultrahigh-energy cosmic ray air showers
Improvements in our understanding of particle production in collisions of ultrahigh-energy cosmic rays (mostly protons, with energies in the range –) with air nuclei in the upper atmosphere, are among the top motivations of the CASTOR research program. Such CRs lead to collisions at nucleon-nucleon center-of-mass energies of –450\TeV, which are around or well above those reachable at the LHC. The subsequent shower of secondary particles generated in the atmosphere, called extensive air shower (EAS), needs to be well-reproduced by the hadronic Monte Carlo (MC) models to determine the nature and energy of the incoming cosmic particle. The description of semihard and diffractive processes, which dominate multiparticle production in hadronic collisions within the EAS, is based on phenomenological approaches whose parameters are tuned to particle accelerator data [51, 52]. Since in hadronic collisions most of the primary energy is transported along the forward direction, collider data at the highest accessible energies, and in particular in the poorly known forward region, are needed for tuning and refinement of the MC models used in CR physics [51, 52]. The importance of CASTOR to cosmic ray research is driven by its very forward location that allows detailed studies of particle production in a region not covered so far by collider experiments. The highest nucleon-nucleon center-of-mass energy of 13\TeVreached at the LHC corresponds to that of a fixed-target collision of a primary cosmic ray proton of lab energy against a nucleus at rest in the upper atmosphere.
The highest energy particles of an EAS drive the peak of the shower activity deeper into the atmosphere and determine the most important features of EAS, such as the position of its shower maximum, used to identify the CR energy and identity. In this context, the CASTOR measurement of the forward-directed energy flow up to 13\TeVcenter-of-mass energies [15, 53] provides a powerful benchmark for air-shower modeling. In addition, the muon component in air showers remains poorly described by the current MC models [54], clearly pointing to an insufficient understanding of the underlying hadronic processes in the core of the shower. The fraction of collision energy going into neutral pions does not contribute to the production of muons in the downstream air shower processes and, thus, by independently measuring hadronic (mostly charged pions) and electromagnetic (mostly neutral pions) energy densities in the CASTOR detector, the production mechanisms that influence muon production in air showers can be directly studied [18]. The understanding of the development of extensive air showers also depends on nuclear effects, since EAS develop via hadronic collisions with nitrogen and oxygen nuclei in the atmosphere. Thus, measurements in proton-nucleus collisions are also of high interest (in particular with lighter nuclei in the near future [55]), as discussed next.
0.2.3 Proton-nucleus and nucleus-nucleus collisions
The menu of heavy ion physics studies in the very forward region is very rich and mostly theoretically and experimentally unexplored [14]. The original motivation for the CASTOR calorimeter construction was the search for new phenomena in HI collisions [56, 1], such as strangelets [57] and disoriented chiral condensates (DCCs) [58]. The exotic Centauro events observed in CR collisions in the upper atmosphere [10, 11] have been interpreted in terms of deconfined quark matter in the forward fragmentation region [9], where the net baryon number (baryochemical potential) is very high due to nuclear transparency. Strangelets require a similar environment for strangeness distillation. The DCCs are theoretical states of low \ptand can therefore be best found in the forward region. The CASTOR calorimeter occupies the peak of the net baryon distribution in HI collisions and is thus well suited for all these searches. To identify irregular longitudinal shower developments in the calorimeter, CASTOR is equipped with a 14-fold longitudinal segmentation.
Besides its potential for the discovery of exotic phenomena, CASTOR is particularly well suited to distinguish hadronic, photon-nucleus, and purely electromagnetic (photon-photon) processes in HI collisions [59]. Because of the large charge of the colliding nuclei, photons are directly involved as an exchange particle in a significant fraction of the ion-ion interactions. The absence of activity in CASTOR leading to large rapidity gaps, spanning over an increasingly larger fraction of the central detectors, can be combined with signals from the zero-degree calorimeters, to separate hadronic and electromagnetic interactions. This is a powerful tool in particular to study photon-pomeron scattering, as for example, in exclusive vector meson production that is sensitive to the nuclear parton distribution functions [25]. As aforementioned, the distribution of energy emitted in the forward direction in \PpPb and PbPb collisions provides constraints on CR physics models [26, 24]. The energy transport in the forward phase space [60], as well as forward jets in \PpPb collisions [23], can be used to study saturation effects in the nuclear parton densities. Last but not least, the fine segmentation of the calorimeter allows the measurement of elliptic flow in HI collisions, a signal of final-state parton collective effects, far away in rapidity from the hard scattering [14].
0.3 Detector design
The CASTOR detector is a Cherenkov sampling calorimeter constructed from two half-cylinders with an outer radius of 40\unitcm and a length of 160\unitcm, placed around the beam pipe at a distance of 14.4\unitm in the negative direction from the CMS interaction point. The acceptance of the calorimeter is , and in azimuth . The whole calorimeter is made of nonmagnetic materials, where the bulk of the mass is tungsten used as absorber, and the active material is quartz in which Cherenkov photons are produced. The integration in CMS is described in Ref. [8].
The CASTOR calorimeter has an electromagnetic section of 20 radiation lengths () and a total depth of 10 interaction lengths (). The segmentation is 16-fold in and 14-fold in depth, resulting in 224 individual channels. The sum of all channels in one -segment form one calorimeter tower that is, thus, constructed from 14 layers in depth, which are called modules. The first two modules of a tower correspond to the electromagnetic section, where the tungsten (quartz) plates have a thickness of 5\mm(2\mm), while the remaining 12 modules form the hadronic section, where the thickness of tungsten (quartz) plates is 10\mm(4\mm). Thus, the material depth of a hadronic module is twice that of the electromagnetic one.
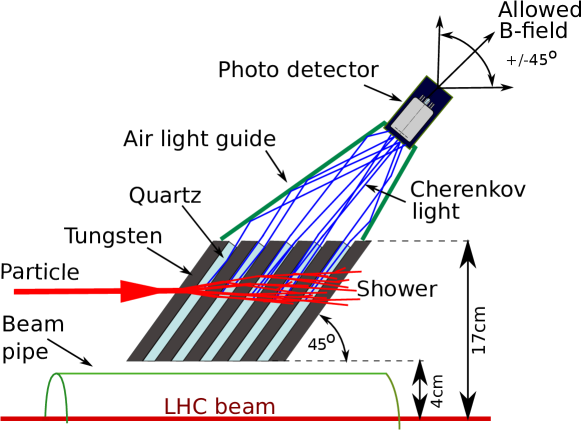
The schematics of one readout module is depicted in Fig. 4. The signal is generated in radiation-hard quartz plates in which Cherenkov photons are produced. Interleaved with the quartz plates are tungsten plates as absorber material to generate and contain the electromagnetic and hadronic particle showers. The quartz plates are tilted at 45∘ to coincide with the Cherenkov light emission angle in quartz, and to obtain the best photon transport efficiency. The photosensors are mechanically coupled to the body of the calorimeter, and photons are transported from the quartz to the photocathodes via air-core light guides. Five tungsten and five quartz plates are grouped together and read out by a single PMT to form one readout module. The inner surface of the light guides is covered with Dupont polyester film reflector coated with AlO and a reflection enhancing SiO2+TiO2 dielectric layer stack, which is both very hard against exposure to radiation and an extremely good specular reflector of ultraviolet light [61]. The reflectivity of the foil has a low-wavelength cutoff of 400\unitnm that suppresses the wavelength region where the Cherenkov yield from quartz becomes significantly dependent on radiation exposure.
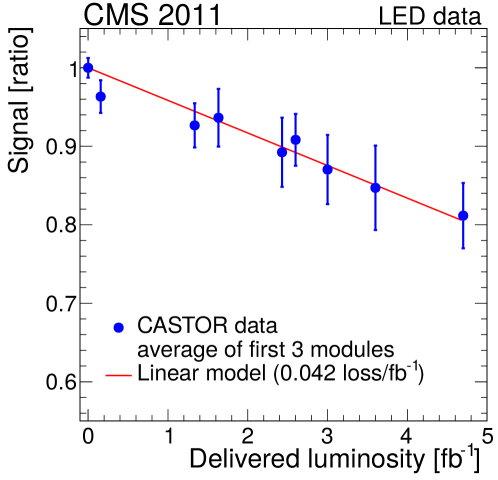
Because of severe space restrictions, as well as stringent demands on radiation hardness and magnetic field resistance, the photosensors must meet special requirements. Photomultiplier tubes with fine-mesh dynodes were selected after extensive test-beam studies [3, 4, 7]. The original set of Hamamatsu R5505 [62] photosensors was provided from the decommissioned H1 calorimeter SpaCal [63] at the DESY HERA collider. However, their photocathode window, made of borosilicate glass, was observed to degrade noticeably under exposure to intense radiation during the higher luminosity LHC data-taking period of 2011, as shown in Fig. 5. To prepare for the LHC Run 2 and data taking at 13\TeV, these original PMTs were replaced by R7494 PMTs from Hamamatsu during 2012. These new PMTs have a fused silica entrance window, which is very radiation tolerant. The PMTs are driven by a passive base. The last dynode with the largest current is powered by a dedicated low-voltage power supply of typically 100\unitV. The rest of the dynodes and the cathode are powered by a high-voltage (HV) supply in the range 800 to 1800\unitV, depending on the physics measurement. The separation of the last dynode from the HV supply allows the safe powering of four PMTs by a single HV channel. The response of all new and exchanged PMTs has been characterized in a dedicated external calibration setup as a function of the HV for several light-emitting diode (LED) wavelengths.
An in-situ monitoring system is available for the evaluation of the performance of all channels of the detector at all times during data taking. This is done using an LED pulser system that can illuminate the entrance window of the PMTs when CASTOR is installed inside CMS. The light pulse of wavelength 470\unitnm and pulse duration 20\unitns is generated by a dedicated pulser in the electronics crate and is transported through an optical fiber to the calorimeter, where it is distributed via optical splitters to all 224 channels. The fibers are positioned so that they illuminate roughly the entire photocathode area. The LED signals are used to study the response of the electronics while there are no collisions at the IP. In this way, dead channels are identified, and the PMT gain is measured. Gain correction factors are obtained for various high-voltage operation modes, as well as magnetic field environment situations. Since the LED signals are neither absolutely calibrated, nor are identical during different installation periods, they are mainly useful for characterizing the time-dependence and stability of single channels. However, assuming small PMT gain variances, the gain can be estimated approximately from the signal and variance , according to (Section 0.5.2).
The PMTs are read out by fast charge integrating circuits (QIEs) [64] in time samples of 25\unitns duration. Before digitization, the analog signals are stored in a cyclic buffer consisting of four capacitors. This is also relevant for the calibration and event reconstruction, since each capacitor has slightly different properties. One recorded event consists of ten (before 2012) or six (after 2012) time samples. The pulse shape of CASTOR is distributed over more than one time slice, which is essentially a consequence of the dispersion in the long cables from the PMTs to the digitizers. For this reason, CASTOR is not optimized to operate at LHC bunch spacings smaller than 50\unitns (two time slices). CASTOR only recorded data with bunch spacings of 50\unitns, with typically separations being much larger. Typical running conditions, \eg, during HI runs, have much larger bunch spacings. However, the finite pulse width is exploited during the reconstruction to retrieve the signal size for events where the signal in one of the time slices is saturated, as explained below.
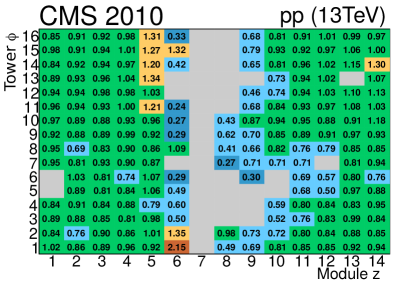
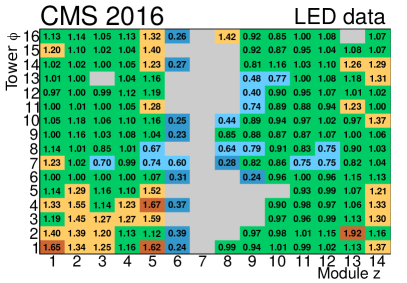
While the Hamamatsu fine-mesh PMTs are very tolerant to ambient magnetic fields of the magnitude observed in the vicinity of CASTOR, there is a well known dependence of the PMT performance on the relative field direction with respect to the PMT axis. Unfortunately, because of the massive shielding around the calorimeter, the direction of the magnetic field varies considerably. This has, for some channels, a very strong and complex impact on the PMTs, as shown in Fig. 6. The left panel illustrates the impact of the field on the PMT response measured with \Pp\Pp data in 2010, and the right plot is the result from LED data taken in 2016. Some general features, as the insensitivity in the range of the modules 6–9, are visible in both years, but there are also important differences clearly asking for a careful time-dependent calibration. There were major modifications to CMS between 2010 and 2018, \eg, the installation of an additional 125-ton yoke endcap shielding disc. Details of the shieldings directly around CASTOR (rotating and collar shields) were also changed, and finally the exact positioning and geometry of CASTOR is slightly different in each installation period. For data taking with the nominal CMS magnetic field, the recordings by most channels in modules 7 and 8 are significantly less useful, and modules 6, 9 and 10 are also compromised. Furthermore, in 2016 there appears to be a general larger impact on the first towers (numbers 1 to 5), which are located in the top part of the calorimeter, where displacements of the PMTs caused by the ramp-up of the CMS magnet are the largest. These observations clearly show the importance of properly calibrating the CASTOR channels during physics data taking with a stable magnetic field.
The insensitivity in the central parts of CASTOR, induced by the magnetic field channeling through the massive radiation shielding of CMS, was discovered after the first data taking in 2009, and could not be mitigated without a major redesign of the shielding and/or the detector. However, the impact on almost all typical physics applications remains limited: the front modules 1 to 5 are sufficient to detect 100% of the electromagnetic showers, as well as 75% of the hadronic showers in the calorimeter. Furthermore, also the tails of hadronic showers (and through-going muons) are seen in the back modules 10 to 14.
0.4 Triggers and operation
Overview of the running periods of the CASTOR detector, with indication of the year, colliding system, nucleon-nucleon center-of-mass energy, and the triggers provided to the CMS L1 global trigger system. Year Colliding system CASTOR trigger(s) 2009 0.9\TeV proton-proton 2010 0.9\TeV proton-proton halo muon 2.76\TeV proton-proton halo muon 7\TeV proton-proton halo muon 2.76\TeV lead-lead halo muon 2011 7\TeV proton-proton halo muon 2.76\TeV lead-lead halo muon 2013 5.02\TeV proton-lead halo muon & e.m. cluster 2.76\TeV proton-proton halo muon & e.m. cluster 2015 13\TeV proton-proton halo muon & jet 5.02\TeV proton-proton halo muon & jet 5.02\TeV lead-lead halo muon & jet 2016 5.02\TeV proton-lead halo muon & jet 8.16\TeV proton-lead halo muon & jet 2018 5.02\TeV lead-lead halo muon & jet
Together with the data recorded during the various run periods, CASTOR delivered signals to the CMS level-1 (L1) trigger system [65]. These triggers, listed in Table 0.4, were able to calibrate the detector (halo muon trigger), as well as to carry out dedicated physics analyses (jet trigger, electromagnetic (e.m.) cluster trigger). Depending on the physics goals, the triggers varied during the various running periods. During all listed years, CASTOR recorded a total luminosity of about 5\fbinvof data with a large variety of colliding systems and center-of-mass energies. These samples have been partly analysed for various physics measurements, and further studies are still ongoing or planned in the future with the collected data [27, 28].
The CASTOR electronics chain provides four simultaneous hardware trigger outputs using the standard CMS hadron calorimeter trigger readout (HTR) boards. There are eight HTR boards; each analyzing the data of one octant (two towers) of the calorimeter. Since one HTR board can handle 24 front-end channels, the last two modules per tower are not included in the trigger system. The output of all octants is further processed in the “trigger timing control” (TTC) board to form four trigger output signals for the whole CASTOR calorimeter. These are sent to the CMS L1 global trigger system.
In terms of operation, the CASTOR detector was installed in CMS prior to the first LHC beams and took data continuously during years 2009–2011. Over this period, \Pp\Pp collisions were recorded at , 2.76, and 7\TeV. The CASTOR calorimeter was removed at the end of 2011, before the high-intensity LHC operations in 2012, because data recorded at high luminosities are significantly less useful for physics analyses since the calorimeter is unable to distinguish particles originating from different pileup vertices because of its location, geometry, timing capabilities, and granularity. The CASTOR detector was then reinstalled in 2013 for the \PpPb run at , and for the \Pp\Pp run at . During LHC Run 2, CASTOR was never installed in high-luminosity \Pp\Pp data taking to avoid needless radiation damage, but it was installed in all HI runs and in a few special low-luminosity \Pp\Pp runs. In 2015, after the first long shutdown of the LHC, the detector was operated during the low-luminosity phase of the first weeks of \Pp\Pp collisions at 13\TeVand during the PbPb run at the end of the year. In 2016, the \PpPb runs at and 8.16\TeVwere recorded, as well as the PbPb runs at in 2018. A detailed summary of all running periods is shown in Table 0.4.
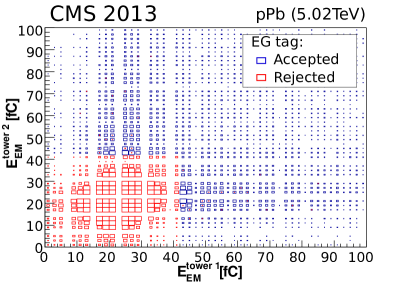
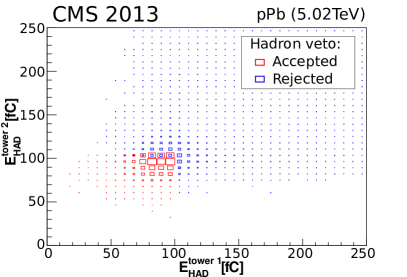
In 2013, the CASTOR calorimeter had an active trigger for isolated electron/photon objects. The calorimeter trigger was combined during part of the data taking with a TOTEM T2 tracker low-multiplicity tag at the L1 trigger. The resulting data set contains a very large and clean sample of isolated electron candidates. The validation of the calorimeter trigger for each octant is shown in Fig. 7. Since the trigger is generated from the combination of two adjacent towers of one octant, the trigger validation corresponds to a two-dimensional analysis. The trigger requires a single tower in one octant in which the first two (electromagnetic) modules are above a charge threshold of 40\unitfC (corresponding to 0.6\GeVenergy), and applies an additional veto on any hadronic activity in the modules at depths 4 to 6 in this octant. No more than 100\unitfC (corresponding to 1.6\GeV) of hadronic energy is allowed.
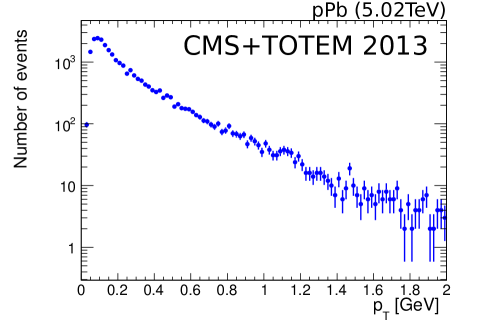
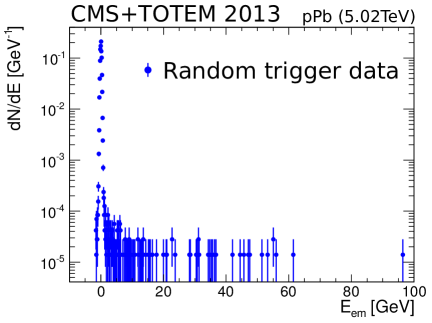
The data recorded with this trigger during the \PpPb run leads to the \pt distribution of candidate electrons shown in Fig. 8. Events are only shown if they have an isolated electromagnetic energy cluster in CASTOR that was associated to one isolated track in T2 during offline analysis. Thus, the energy of the electron candidate is measured with CASTOR and its trajectory with T2 (no acceptance corrections are applied in the plot). This combination of the two detectors provides a unique case where individual charged particles can be fully reconstructed in the very forward direction at the LHC. It is interesting to note that the lower threshold for the observation of electron candidates, , is similar to the performance of the CMS pixel tracking detector at central pseudorapidities [67].
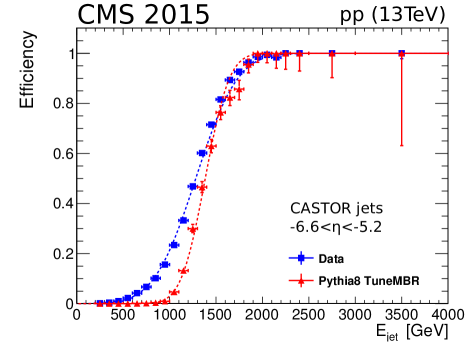
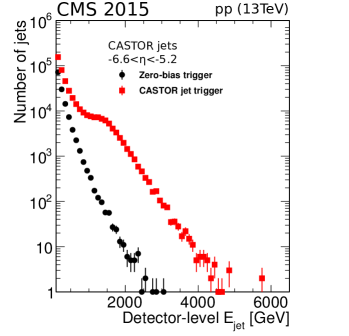
During the 2015, 2016, and 2018 runs, CASTOR provided a jet trigger with the simple requirement of at least one tower with energy above a given threshold. The jet trigger has a well defined turn-on curve, high efficiency and is sufficiently well reproduced by the detector simulations as shown in Fig. 9 (left). The slightly slower rise of the turn-on seen below 2\TeVin the data with respect to the simulations is a consequence of the nominal MC reconstructed jet resolution that is better than the actual one, since not all detector misalignment and miscalibration uncertainties are propagated into the simulation. The trigger is used only in the range of above 2\TeV, where the efficiency reaches a plateau in both data and simulations. This assures that the efficiency corrections remain minimal and that the predictions of the detector simulation in this region are well compatible with the data. In Fig. 9 (right), the impact on the size of the event sample is illustrated by comparing the jet spectra collected with the CMS zero-bias and CASTOR jet triggers.
0.5 Event reconstruction and calibration
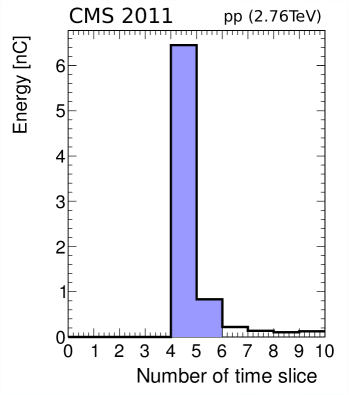
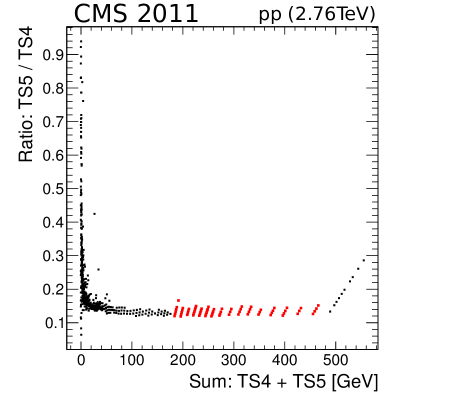
The fundamental quantity measured by the CASTOR calorimeter is the charge per channel. Here, the procedure for obtaining a measurement of the energy per channel from the signals digitized by the detector is described. One signal pulse is distributed over several time slices (TSs) of 25\unitns duration, as shown in Fig. 10 (left). The timing is adjusted so that the time sample with the maximum energy sits at the TS number 4. The channel energy is estimated from the sum of the energies in time samples 4 and 5. Although the fourth time sample saturates at around 400\GeVof energy per channel, for the high-voltage settings applied during \Pp\Pp collisions, particle energies of up to almost a factor of 10 higher can be reconstructed from the energy in the TS number 5, since the ratio between the energies in these time slices is constant at high channel energies, as shown in Fig. 10 (right). Saturation is not a common problem in CASTOR, but can affect particularly interesting events, such as those with high-energy electrons, high-energy jets, or from central PbPb collisions. Considering the normal HV settings during PbPb collisions, where the PMT gain is reduced by a factor of 20 with respect to \Pp\Pp, and using the fifth time slice to estimate the energy when saturation occurs, signals can be measured up to a maximum of around per single channel.
The fourteen channels belonging to one -segment of CASTOR are grouped into one tower during offline event reconstruction. The energy of a tower is the sum of its two electromagnetic and twelve hadronic channels. Channels are nonactive only if they have been flagged as bad channels during detector commissioning. The signals from the towers are zero suppressed, to remove noise, using a typical threshold of (, where is the number of active channels in this tower. This threshold has shown to yield very consistent results for data and simulations in many different data analysis applications.
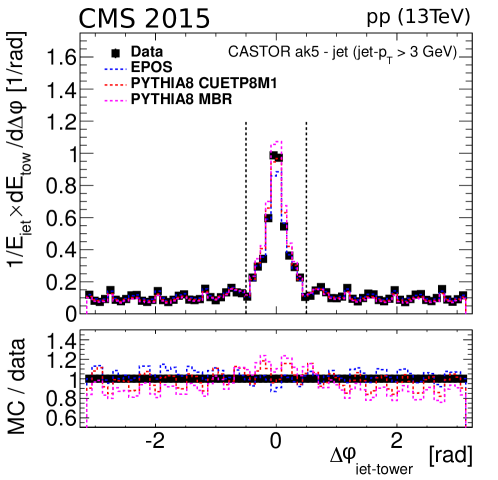
Energy-momentum vectors are constructed from the towers using the measured energies and the geometry of the detector. Those four-vectors are then clustered into jet objects using the anti-\ktclustering algorithm [70] with a distance parameter of , a value optimized taking into account the given detector segmentation and matching the typical size of jets at very forward rapidities [23]. The distribution of azimuthal separations of the towers to the reconstructed jet axis for data and MC simulations, generated with \PYTHIA 8 (MBR and CUETP8M1 [71] tunes) and Epos-LHC [72] models, are compared in Fig. 11.
0.5.1 Noise and baseline
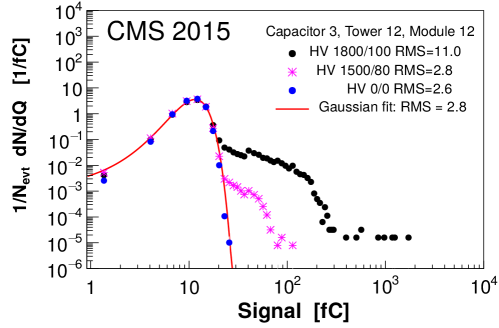
The baseline (pedestal) and noise levels are estimated for each channel by analyzing a large set of events recorded in-situ in the absence of beams in the LHC. These data samples typically comprise around one million events, and take less than one hour to be collected. The charge spectrum for one of the noisiest analog buffer capacitors is shown in Fig. 12. This noise spectrum is depicted for HV off (blue), 1500\unitV (magenta), and 1800\unitV (black). During data taking, the high voltage typically corresponds to 1500\unitV where, even for this noisy capacitor, the random noise probability per event is much below 1% for signals in the high tail of the charge distribution (20\unitfC in this example).
The measurement without high voltage represents the purely electronic noise from the cables, the amplification, and the digitization chain. After applying a voltage to the PMT, additional noise components start to contribute. The first shoulder in Fig. 12 corresponds to the thermal emission of single electrons from the PMT cathode. For CASTOR’s fine-mesh PMTs, single photoelectrons produce a smooth spectrum instead of a clear peak. Signals of ion feedback (also known as afterpulses) start to become visible at very high voltages, but with a tiny noise rate of per event. The maximum noise signal observed here is 2000\unitfC corresponding to about 10 to 100\GeVof energy depending on the gain setting.
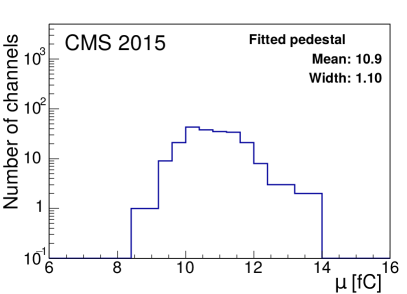
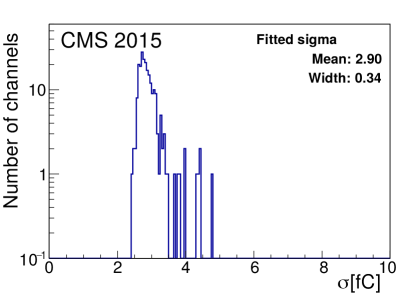
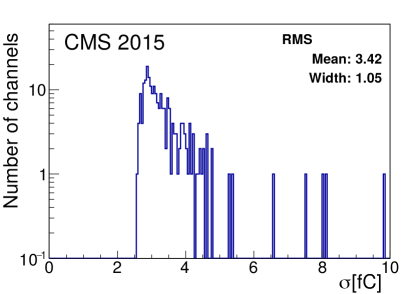
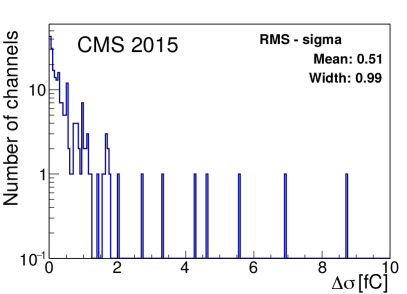
The mean of the Gaussian fit of the charge distribution for zero HV is used as an estimate of the pedestal value, and subtracted from all subsequent measurements. The width of the Gaussian fit is used to monitor the response of a given channel. In Fig. 13 (upper left), the distribution of the fitted charge value of the pedestal is shown, which is 11\unitfC on average. The fitted width of the Gaussian is displayed in the upper right plot, and the root-mean-square (RMS) value of the data in the lower left plot. On average, the RMS is larger by 10% than the width obtained from the Gaussian fit, because of the aforementioned rare non-Gaussian tails. Comparing the RMS to the Gaussian width has proven to be a useful method for identifying noisy or malfunctioning channels. In the lower right plot, the distribution of the difference between the RMS and the Gaussian width per channel is displayed. A channel with a difference in excess of 2\unitfC is considered noisy, and is subject to additional inspection. Channels that cannot be reliably reconstructed are masked in the online trigger and excluded from physics analyses. The number of such channels is kept to a minimum by repairing PMTs, cables, and HV supplies, where needed. This was the case, \eg, for eleven CASTOR channels in 2015, of which none were located in the first three modules, where most of the energy is deposited.
0.5.2 Gain correction factors
The CASTOR high-voltage settings are adapted to the varying LHC operation configurations, depending on the instantaneous luminosity and bunch spacing, and physics goals, with the heavy ion running being a particular case. In central lead-lead collisions, the energy that is deposited within the CASTOR acceptance can be enormous—the total energy stored in a Pb nucleus at the LHC can be up to (0.2\unitmJ). Since the PMTs are always operated at gains in the range with an optimal signal-to-noise ratio, the difference in gain settings between \Pp\Pp and PbPb collisions is about a factor of twenty. Furthermore, in physics data taking, the PMTs close to the shower maximum are configured with lower gains compared to the ones measuring the shower tails in the back of the calorimeter. On the other hand, the signals from LHC beam halo muons are close to the noise levels and very high amplification can be advantageous.
Correction factors are used to adjust the signals for these different high-voltage settings. Three different methods are used, and they are cross-checked against each other. In this section, we compare and contrast the different methods and their results. These methods have different performances depending on the presence of magnetic fields. Thus, we compare the results obtained with the CMS magnet on and off.
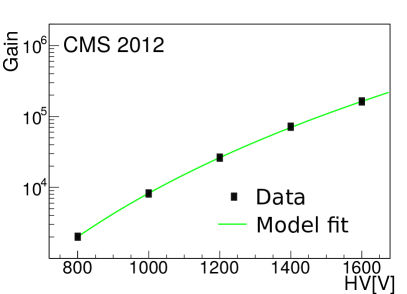
One option is to rely on the PMT characterization measurements performed in the laboratory prior to their installation in the experiment. In Fig. 14 (left), the measured dependence of the gain on the high-voltage value is depicted for one channel. Very precise data exist for almost all PMTs. However, potential aging effects are not included. The use of the results is also limited since they are not performed under exact data-taking conditions, and this restricts its usage to data sets recorded without magnetic field.
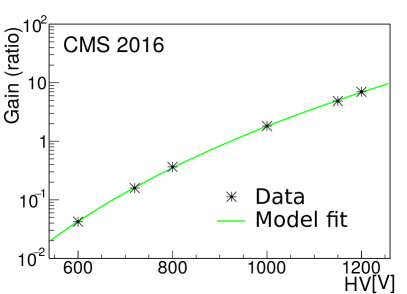
A second option is to use LHC collision data to perform a direct in-situ measurement of the dependence of the PMT gain on the high voltage (Fig. 14, right). This is restricted to special situations where stable collisions are recorded that are not useful for most physics analyses. The ideal scenario is to use higher-pileup data that generate very strong signals and, at the same time, are not used for physics analyses with CASTOR. In 2016, a dedicated voltage scan was performed in such optimal conditions. The average pileup in this data sample was 5, and a CMS minimum-bias trigger that used coincidences of towers in the hadron-forward (HF) calorimeters within was employed to select the events. To account for the slowly changing LHC beam intensity, the CASTOR data were also normalized by the measured average energy in the HF detector.
Finally, a third method relies on a statistical gain estimate performed using LED pulses after the PMTs are installed in CMS. Such a statistical method evaluates the fluctuations observed in each channel as a response to the illumination of the cathode with LED pulses. The signal seen by a PMT for a LED pulse, , is related to the PMT gain, , and the number of photoelectrons, , according to . Thus, the relative variance of consists of a contribution from the gain fluctuations () and from the Poisson fluctuations of the conversion of photons to photoelectrons (), and is given by
| (1) |
where it is assumed that the relative fluctuations of are much smaller than the relative conversion fluctuations, and all effects of bandwidth limitations on the fluctuations are neglected. The gain is then estimated using .
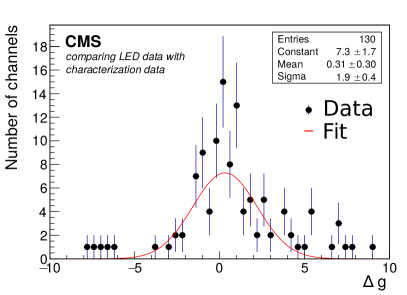
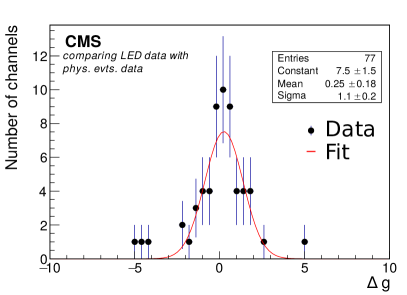
For a final set of high-precision gain correction factors, usually the results of at least two of the methods described above are combined. In Fig. 15 (left), the distribution of weighted differences between the gain correction factors obtained with the PMT characterization and LED methods during \Pp\Pp operation at is displayed. The width of this pull distribution is consistent with unity only at the level of 2 standard deviations (). The corresponding distribution for heavy ion collisions at is shown in Fig. 15 (right) comparing correction factors obtained with physics events and LED measurements. This latter pull distribution reveals a better statistical consistency between the two methods. From those results, it seems that the uncertainties obtained during the PMT characterization setup are slightly underestimated, although not in a significant way. Furthermore, since all these measurements have in general very high statistical precision, of the order of 1%, the absolute impact on calibration and data analyses are negligible. We conclude that the statistical method using LED data, which has the broadest range of applicability, is well suited for gain correction factors whether or not a magnetic field is present.
0.5.3 Channel-by-channel intercalibration
The relative channel-by-channel intercalibration is carried out with recorded beam halo muons originating from the LHC beam. These muons traverse the CASTOR towers longitudinally, and lose only about 10\GeVof energy traversing the calorimeter. For the high-energy muons of the beam halo, with energies in the hundreds of \GeVor above, such energy loss is to a very good approximation insignificant. Radiative muon energy losses above the critical energy are an important contribution at such high energies, but on average they contribute equally to all channels of the calorimeter. Almost all halo muons used for the calibration were taken during the period when the LHC is filled with new protons at a constant beam energy of 450\GeV. Halo muons are an excellent and stable probe for the relative calibration over the entire lifetime of CASTOR.
Beam halo muons are recorded during regular CMS data taking in the periods when the LHC is in interfill and circulating beam modes. A dedicated CASTOR hardware trigger is activated for these runs to record events that are sent to the L1 CMS trigger. For this trigger, each tower is split into four groups of three consecutive modules. Because of the hardware design of the trigger, only the front 12 channels in each tower are included in the trigger logic, excluding the two channels in the rear. This may lead to a small bias for these last rear channels that must be addressed by the subsequent event reconstruction and data analysis. The trigger requires one channel (two channels in 2015/2016) above noise level in at least three of these groups, and that there be no other channel with energy above the noise level anywhere else in the calorimeter. The typical trigger rate of this configuration is around 10 to 100\unitHz, depending on the number of protons in the LHC. The separation of signal from noise during triggering is challenging since the signal corresponds to just about one observed photoelectron per channel, requiring very precise channel-by-channel estimates of the noise level and baseline. To reliably detect muons, the high voltage is typically increased to 1800\unitV during the dedicated halo muon runs. However, during LHC Run 2, muon data were partly taken at the specific physics HV setting for cross-checks, and to avoid any additional corrections due to changing PMT gains and detector noise.
A detailed offline event analysis is required to prepare the collected data for intercalibration. For this purpose, for each of the 224 channels, the no-beam noise thresholds must be accurately determined. Using this information, an offline zero suppression of the data is applied, using a threshold of above the noise. A high-quality exclusive muon candidate is defined as a single tower with at least 4 non-zero-suppressed channels () in an event with at most 6 additional non-zero-suppressed channels () in the rest of CASTOR. Furthermore, the tower containing the muon candidate must have at least two non-zero-suppressed channels in three of these four longitudinal regions: modules 1 to 3, modules 4 to 7, modules 8 to 11, and modules 12 to 14. This requirement is sensitive to the penetrating nature of muons and rejects low-energy pions that do not reach the back of the calorimeter.
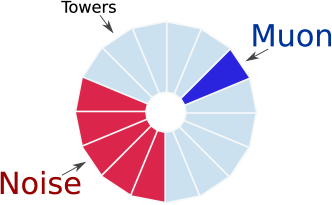
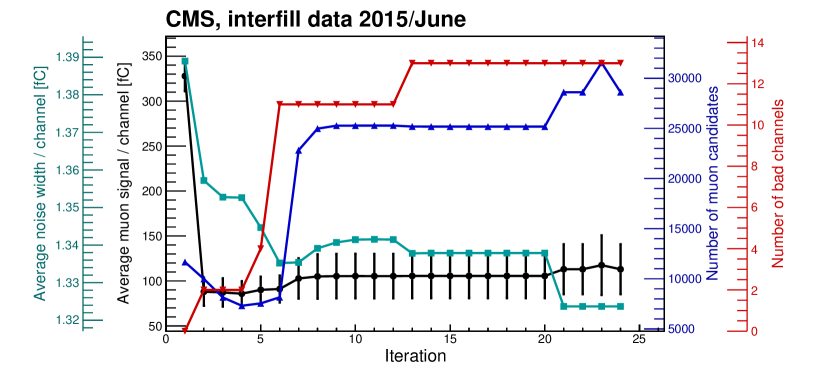
Since the muon event selection uses energies very close to the pedestals, a precise determination of the noise levels is of paramount importance. We found that only an iterative procedure, where the noise is measured from the same events as those from the actual muon candidates, provides the required accuracy. For this purpose, when a muon candidate is found, the calorimeter noise levels for the channels in the five towers most distant from the muon candidate (opposite in the transverse direction) are updated. Thus, the data are used simultaneously to measure the muon response and the calorimeter noise levels. This procedure is illustrated in Fig. 16. The threshold levels for zero suppression are determined from Gaussian fits to these data. If no statistically significant improvement of the noise levels can be determined in any of the channels of the calorimeter, the procedure has converged and is stopped. Convergence typically occurs after 10 to 20 iterations, as demonstrated in Fig. 17 for data recorded in June 2015. For this run, the noise levels quickly converge after about five iterations. It is crucial to closely supervise this process and to identify noisy channels that have a big impact on the selection process. The list of bad channels is revised by excluding the most noisy channels in several steps until no further impact on the muon response is found. In the last four points shown in Fig. 17, the average noise and the number of muon candidates converges to slightly different values, because of a fine tuning of the parameters and . The fine tuning is performed considering all data from 2011 to 2016 simultaneously. This yields a slightly better global noise level, increased muon data samples, and no significant change in the measured muon response.
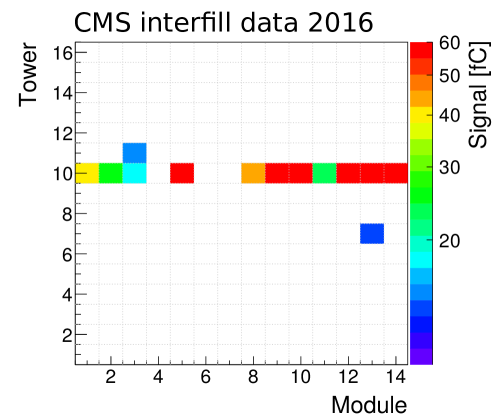
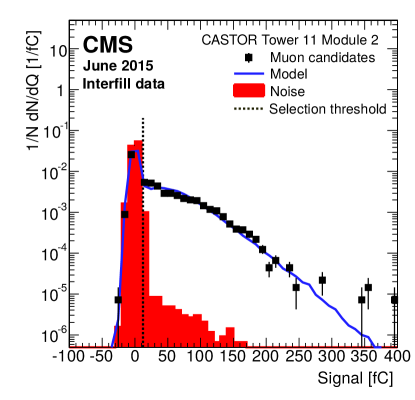
In Fig. 18, an example of the result of the online and offline muon selections can be seen. These data were taken with the CMS magnet at 3.8\unitT, which is why many of the modules at depth 7 to 9 yield less signal. In Fig. 19, the signal and noise spectrum after offline selection are displayed for a typical channel together with a prediction based on a simplified model of a fine-mesh PMT, tuned to the data. The model assumes constant amplification per dynode including Poissonian fluctuations. For the used fine-mesh PMT, it is important to consider the probability of electrons missing a particular dynode, . This leads to a nonideal low-energy resolution that is of concern to understand the recorded muon data: while the muons are clearly seen above noise level, there is no obvious muon peak produced.
Since there is a large overlap of muon signal with noise levels, the average recorded signal is not an ideal estimator of the muon response. We found that the RMS is a much better estimator instead. Since there are very rare spurious high-signal noise hits also present in the recorded muon data, we exclude the 2% highest energy deposits for each channel. In most channels this has no visible effect, but it helps to remove abnormal fluctuations in a few channels. Thus, the muon response is defined to be the truncated RMS per channel after rejecting the 2% highest energy events.
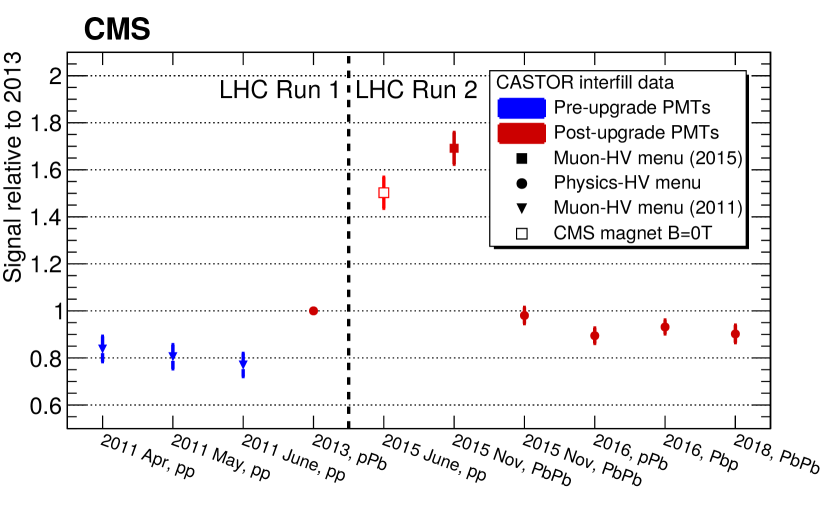
These muon data provide a very powerful probe of the stability of the calorimeter over time. The time dependence of the gain for each channel is studied using the average from muons collected during 2013 (Run 1) as a reference. This is also of paramount importance for maintaining a stable energy scale over the time span of the various runs, from 2011 to 2018. In Fig. 20, the relative change of the muon response during all data-taking periods is shown. This is done by normalizing the average channel-by-channel ratio of the muon response to that from the 2013 data. In the 2011 data, the loss of sensitivity due to radiation damage is visible. The step between 2011 and 2013 coincides with the upgrade of the calorimeter with new PMTs, which obviously had a positive effect on the sensitivity. June 2015 is the only period where the halo muon data were recorded with 0\unitT magnetic field in CMS. It is particularly interesting to compare the data collected in 2013 with those in 2016, since they were all recorded with nominal magnetic field and almost the same (physics) HV settings. The stability is better than 10% over three years. The change in response is thought to be related to residual differences in the magnetic field structure, detector aging, geometry, and HV settings. Contrary to other components of the CMS experiment, the CASTOR calorimeter did not experience any significant aging effects in Run 2. The spread of the channel gains can be well described by Gaussian distributions. The observed differences are corrected with the described calibration procedure. The response to muons is used as an absolute reference scale. Using a bootstrapping method (case resampling) to estimate the statistical uncertainties of the intercalibration constants indicates an uncertainty of 15% in each channel.
0.5.4 Absolute energy scale
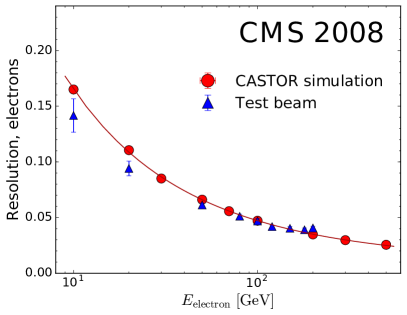
The initial fundamental calibration of CASTOR was done with test-beam measurements at the CERN SPS using electrons, charged pions, and muons of well defined energies ranging from 10 to 300\GeV. The corresponding results are published in Ref. [7]. Good energy linearity as well as resolution were found for electron beams, and the ratio between charged pion and electron responses at the same particle energy was measured. The latter is a fundamental property of any calorimeter and is linked to noncompensation of energy losses in hadronic showers due to nuclear breakup, and production of neutrons, muons, etc.
However, it is not sufficient to determine the energy scale in the test-beam environment. The conditions when installed in CMS are quite different from those of the test-beam measurement. For example, the presence of magnetic fields changes the PMT gains in a nontrivial way. Correction factors have been determined for the difference in gain, yielding an estimated energy scale in Run 1 of 0.016\unit\GeV/fC for the proton physics high-voltage settings used in 2010.
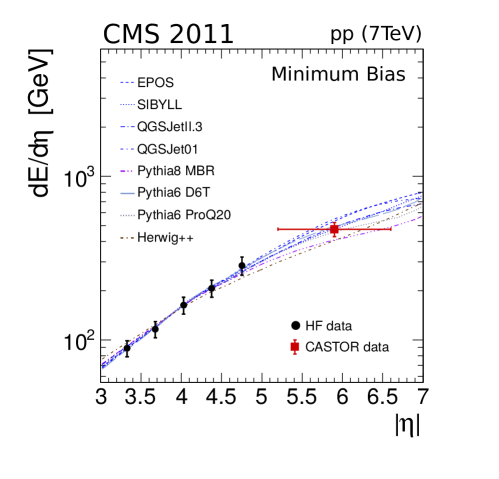
An independent and more realistic calibration is performed from collision data recorded when CASTOR was installed in CMS by cross-calibrating its response to that of the HF calorimeter (). The pseudorapidity dependence of the energy deposited in the HF calorimeter in minimum-bias events (defined as \Pp\Pp collisions at generator level with at least one stable particle produced in both HF sides over ) studied in Ref. [15], has been used for this task. In Fig. 21, we show the measured HF data extrapolated to the CASTOR region together with different MC predictions from \PYTHIA 6.424 [73] (D6T [74] and ProQ20 [75] tunes), \PYTHIA 8.145 MBR, \HERWIG++ [76], and commonly used models in cosmic ray physics: QGSJet01 [77], QGSJetII [78], Sibyll2.1 [79], and Epos-LHC. The \PYTHIA 6 D6T tune is derived from charged particle multiplicities measured by the UA5 experiment at the CERN SS-collider. The ProQ20 tune describes the CDF data at and 1.8\TeV, using LEP results to tune the parton-to-hadron fragmentation. The \PYTHIA 8 generator includes a new MPI model interleaved with parton showering. In the \PYTHIA 8 generator, the treatment of diffraction is improved compared to \PYTHIA 6. The \HERWIG++ generator uses a different parton fragmentation model than \PYTHIA. All cosmic ray MC models share the underlying Gribov’s Reggeon field theory framework [80], but different implementations of perturbative parton scatterings and diffraction [52]. The full set of models chosen provides thereby a very comprehensive range of predictions for minimum-bias \Pp\Pp collisions at the LHC.
The measured dependence of energy deposits in HF is extrapolated to the CASTOR range. The model predictions are scaled to best reproduce the measured dependence in HF for this purpose. All model predictions are calculated with the generator-level definition using the online and offline event selections defined by the HF measurement: at least one charged particle on both sides of CMS over , and a minimal lifetime of particles of c, excluding muons and neutrinos. The spread of the model predictions in the CASTOR acceptance provides an estimate of the model dependence of this extrapolation. The extrapolated average energy deposit in the CASTOR acceptance found by this procedure is with an RMS of 60\GeV(10%) for the 7\TeVminimum-bias proton-proton data. The uncertainties in the absolute calibration of the HF as well as in the HF generator-level correction are 10%, and the total uncertainty in the energy estimate in CASTOR is thus . The average charge signal recorded in the five frontmost modules for this minimum-bias data is . Since only these front modules of the calorimeter are used, about 75% of the energy of hadronic showers are contained. Furthermore, two channels of these front modules (module 1 in towers 5 and 6) are not included in the measurement due to stringent quality criteria on noise. The calorimeter response factor is obtained from a \GEANTfour-based [81] simulation of CASTOR using minimum-bias events generated using \PYTHIA 6 (tune Z2), where the simulated detector configuration and conditions were matched to those used during data taking. Here, is the total energy from \PYTHIAin the acceptance range and is the corresponding energy from the simulation. The calibrated energy measured by CASTOR for any type of collisions, with either protons and/or lead ions, at any center-of-mass energy, is then given by
| (2) |
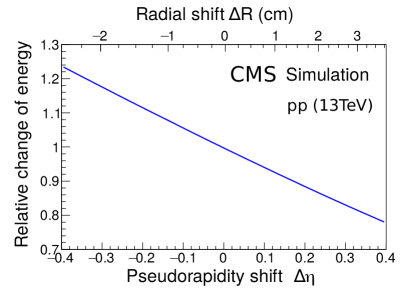
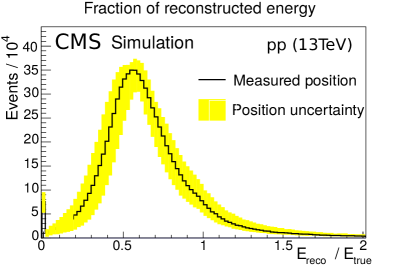
where is the measured signal of CASTOR, is the corresponding calorimeter response factor, and are the gain changes due to any difference in high-voltage settings. Regarding the uncertainties in this assignment: the measurements of , , and have negligible statistical uncertainties, the estimation of is based on HF and has a 14% uncertainty. It is important to note that the numerator and denominator of the / ratio have uncertainties that are highly correlated. The individual absolute model-dependent uncertainties of and are not relevant, but rather the uncertainty in the ratio of the two. Since these uncertainties are not dominant, and their concrete evaluation requires detailed studies for any new data-taking scenario, we assume that the fractional uncertainty in is equal to that of the fully uncorrelated uncertainties in . This neglects the existing correlations and, thus, the resulting uncertainty is slightly conservative. From extensive detector simulation studies, the CASTOR response has an uncertainty of 5% arising from the noncompensation in the energy response of the detector and the predicted relative composition of hadrons and electromagnetic particles in minimum-bias events for all colliding systems at the LHC (combination of protons and lead nuclei) and different nucleon-nucleon center-of-mass energies (2.76, 5.02, 7, and 13\TeV). The effect of the geometry and alignment of CASTOR with respect to the LHC luminous region can have an important impact on , as discussed also in the next section. This is the largest source of uncertainty for the determination of . For example, the uncertainty due to imperfections in the detector alignment during the 13\TeVproton-proton collisions in June 2015 is 6.5% (Fig. 22, right). Also the number and location of dead channels in the calorimeter can, in principle, have a large effect on . However, once they are incorporated into the simulation of the detector, their effect is negligible.
Thus, the absolute energy scale in CASTOR is determined by the energy measured in the HF detector, combined with a model-dependent extrapolation using the shape of event generator predictions and assumptions on the stability of the determination of , with a total precision of about . The approach leading to Eq. (2) can also be used for the absolute calibration factor corresponding to the scenario of a pure electron beam
| (3) |
which is consistent with the corresponding test-beam measurement.
0.6 Geometry and alignment
Because of the very forward location of CASTOR, even small movements of the calorimeter can significantly affect its acceptance. A (10\mm) radial shift affects the inner acceptance of by (0.3) and the outer acceptance of by (0.07). Since CASTOR is located in a region where the energy deposition per collision depends strongly on , even small changes in the acceptance can have a large effect on the expected energy deposit (Fig. 22, left). The position of the calorimeter must be known with a precision of a few mm for a precise interpretation of the measurements. Fig. 22 (right) illustrates the impact on the energy response of the measured position uncertainty during the data taking in June 2015. This leads to uncertainties for reconstructed energies on hadron level of up to 6.5%.
The precise determination of the location of CASTOR is difficult since the whole structure of the forward region of CMS moves by several centimeters when the CMS magnet is ramped up. This also leads to nonnegligible movements of the otherwise nonmagnetic calorimeter, which are probed with different infrared (Excelitas VTR24F1H) and potentiometer (Active Sensors CLS1313) positioning sensors. Such probes are particularly critical to keep a safe distance between the CASTOR and the fragile beam pipe.
The position of CASTOR is measured after final installation, when there is negligible magnetic field, by a survey team with laser targets to a precision of 1\mm. Movements of the calorimeter during the magnetic field ramp-up are observed with the positioning sensors. An absolute position at full magnetic field is therefore determined with information from the positioning sensors and the laser measurements.
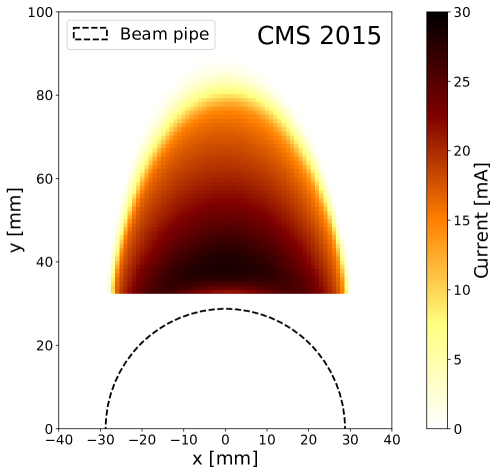
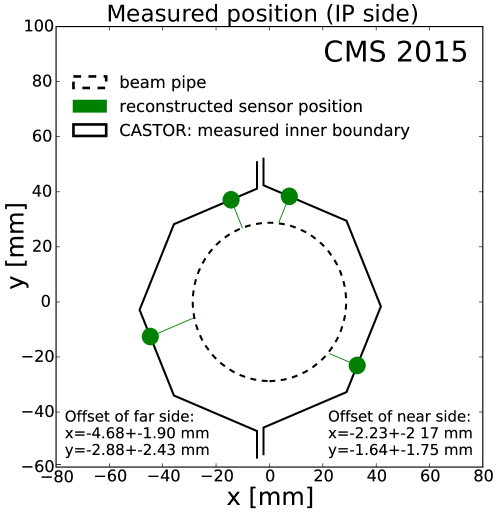
On the side facing the interaction point, two infrared sensors are mounted on each half that measure the distance to the beam pipe. Two potentiometer sensors measure the opening between the two halves of CASTOR at . On the other side, there are three infrared sensors and three potentiometer sensors that measure relative , , and movements. All sensor measurements are combined in a global goodness-of-fit minimization for which the - and -positions of the two halves are free parameters. The output voltage of the sensors is calibrated to absolute distances with a custom setup, which yields an uncertainty of about 1\mmfor both sensor types. This is achieved with an automated procedure on a two-dimensional (2D) positioning table for the infrared sensors, and by measuring the distance with the fully contracted potentiometer sensor. In Fig. 23, the measured response of one infrared sensor in the 2D scan is shown. The surface of the beam pipe mockup is shown as dashed line. The uncertainties propagated to the position found with the minimization procedure are lower when the infrared sensors are pointing perpendicular to the beam pipe. Figure 24 shows the result of this procedure for the position of CASTOR after a magnet cycle in April 2015. A position with an uncertainty in and of about 2\mmis found.
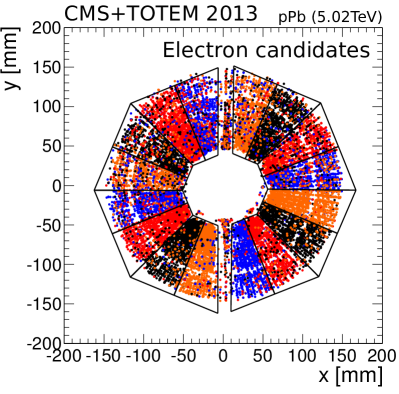
At the same time, other independent methods to determine the position of the calorimeter with LHC collision data have been implemented and cross-checked with the above procedure. Firstly, during 2013 a special trigger was developed to record single electrons in CASTOR during the \PpPb data taking. The trigger made use of the TOTEM T2 tracking station [82] in front of CASTOR (see Fig. 2). The trigger decision requires a very small track multiplicity in T2 and an isolated electromagnetic cluster in the calorimeter. The offline event selection requires a single e.m. cluster above 10\GeVwith all other towers being below 5\GeVin total energy, representing a very strong isolation criterion as well as a very efficient hadron veto. The analysis of these data yielded a very accurate picture of the alignment relative to the T2 detector. The measured geometric correlation of T2 tracks with electromagnetic energy clusters in CASTOR is shown in Fig. 25 (right). The ring with reduced track density corresponds to the shadowing induced by the conical beam pipe in front of T2 and CASTOR. The number of background events in this plot becomes visually enhanced since the background is uniformly distributed, whereas the signal is highly clustered on top of each of the CASTOR towers. The main source of this background is calorimeter noise, since the energy threshold to select these electron events is 10\GeVper tower, whereas the calorimeter noise tails contribute at the level of 10-4 per event (Fig. 25, left). It can also be seen that the acceptance of T2 is slightly smaller than that of CASTOR. The geometric correlation between track and energy cluster is then used for an alignment fit of CASTOR. From this alignment fit, we find that both detector halves are separated by 22\mm, a situation that was not exactly known prior to this measurement.
Furthermore, minimum-bias collision data at , 2.76, and 7\TeVhave been compared to corresponding detailed detector simulations. The energy distributions in depth and azimuth depend on the position and tilts of the two calorimeter halves. The position of CASTOR in simulations was therefore optimized to best describe the distribution found in data. There is agreement within the experimental uncertainties among the different approaches.
0.7 Detector simulation and validation
Typical particle physics measurements need detector simulations to calculate the acceptance, correction factors, and bin migration effects. Having at hand a precise simulation and validation of the CASTOR detector response is thereby of fundamental importance for physics analyses. Both topics are discussed next.
0.7.1 Simulation
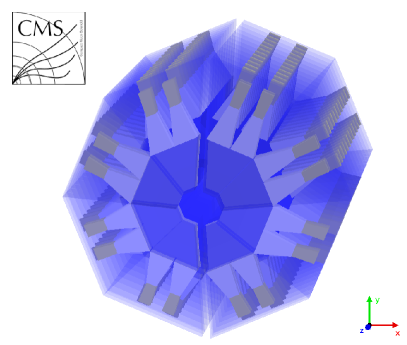
The detector simulation is fully integrated into the offline software package of the CMS experiment CMSSW [83]. The particles produced by the event generator are transported to the CASTOR detector using the \GEANTfourframework [81]. Hereby, interactions with detector materials and the beam pipe in front of the calorimeter, as well as the magnetic field produced by the CMS solenoid that extends into the very forward region, are simulated. The geometry implementation of CASTOR is shown in Fig. 26. The two halves of the calorimeter are shown in the geometry corresponding to the 2013 \PpPb data-taking period. Electromagnetic and/or hadronic particle showers are detected in the sensitive volumes of the detector. The quartz and tungsten plates that define the volume of the CASTOR detector are accurately and separately modeled for each detector-half to allow the description of tilts and movements of the individual halves. Various physics settings have been compared to SPS beam data [7]. For the test-beam data, the best agreement with full \GEANTfoursimulations of the detector is obtained with the “QGSP_FTFP_BERT_EML” physics setting [84], which gives a good description of the longitudinal shower profiles. However, it underestimates the effect of noncompensation for hadronic particles. Thus, a further residual scaling factor of about 0.8, applied solely to the response generated by incoming hadrons, is implemented in the simulation to match the measured test-beam data.
The number of Cherenkov photons, , produced by charged particles traversing the quartz plates is estimated by considering Poissonian fluctuations and a conversion of of emitted energy per unit distance, in the relevant wavelength interval from 400 to 700\unitnm. The photons are converted into charge by a simplified analytical model of the photon transport in the quartz, light guides, and PMTs. The first energy emission is described by an incident-angle-dependent probability to reach the light guides, . Combined with the quantum efficiency of the PMT, , and the PMT response factor, , necessary to obtain a simulated signal for electrons in agreement with the SPS beam measurement, one obtains the number of photoelectrons as
| (4) |
The number of photoelectrons is then converted to charge according to
| (5) |
with assuming an instantaneous signal processing (no pulse shape) and, thus, only detected over one 25\unitns readout bin. Since data taking with the CASTOR detector is performed with low-intensity beams and large spacing between filled bunches, this assumption is sufficient. With these values for the factors and the simulated response of CASTOR is consistent with the measured energy of incoming individual electrons in beam tests.
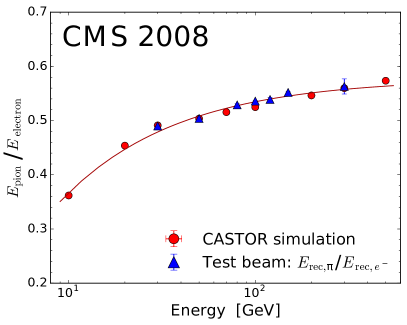
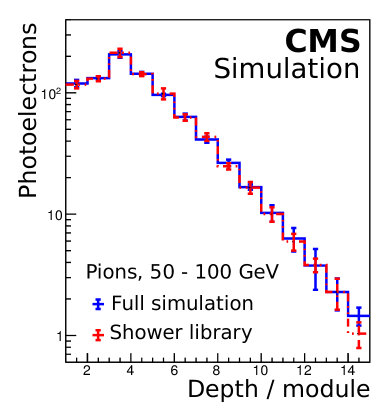
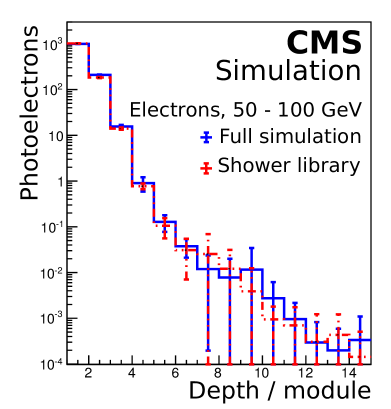
In Fig. 27, the simulation of the CASTOR standalone detector is compared to test-beam data for electrons (left) and charged pions (right), illustrating the good agreement between data and simulations. In CMS detector simulations, the required time per generated event is an important factor, since the available computing resources are limited. For CASTOR, such computing constraints are important since particles and jets with very high energies, close to that of the beam, need to be simulated. The subsequent large and complex hadronic showers developing in the calorimeter require significant computing time to be simulated in full detail. To increase the performance, a fast version of the simulations has been implemented using a tabulated shower library. Instead of tracking each individual particle, the energy deposit of particles in each readout channel is tabulated in 37 inequally spaced bins in energy (), five equally spaced bins in azimuth angle (), and seven equally spaced bins in pseudorapidity. About 50 events are tabulated per phase space bin. In Fig. 28 the validation of the shower library with respect to full simulations for the energy bins from 50 to 100\GeVis shown. When a particle that is tracked in \GEANTfouris found to enter the CASTOR volume and fulfills basic requirements, such as a minimum energy of 1\GeVor a limited incident angle, it is replaced by a randomly chosen tabulated shower of its corresponding phase space bin. This results in a faster simulation time by factors of 3 to 25 (2 to 16) for charged pions (electrons) at energies from 1.0 to 1.5\TeV. A disadvantage of the shower library is that the geometry of CASTOR cannot be changed or shifted for systematic studies, since this would require new shower libraries. Thus, for dedicated systematic studies the full simulations are required.
0.7.2 Validation
The quality of the simulations of proton and nuclear collisions in the very forward direction at the LHC, dominated by semihard and nonperturbative dynamics (MPI, beam remnants, \etc), cannot be cross-checked with first-principles calculations. The event generator predictions in this phase space region are purely phenomenological in nature, and the description of the measurements depends on MC parameter tuning, which in the very forward direction essentially corresponds to data extrapolations. Different simulated event characteristics need to be consistently compared to the measured data to cross-check their validity. The simulations can be obtained from a variety of MC generator predictions to determine which ones provide a better description of the data in the relevant phase space. The observed discrepancies in detailed comparisons between simulated and real detector responses can be used to estimate the uncertainty related to the understanding of the detector response. Also, the level of model dependence of a specific process can be used to estimate the related systematic uncertainties in physics measurements. The integration of CASTOR inside CMS has a further impact on the response of the calorimeter, due to the additional scattering of particles in the materials of the CMS detector around it. The simulated response to single electrons as a function of pseudorapidity, is shown in Fig. 29. The dip around is due to the projection of the conical beam pipe towards the interaction point.
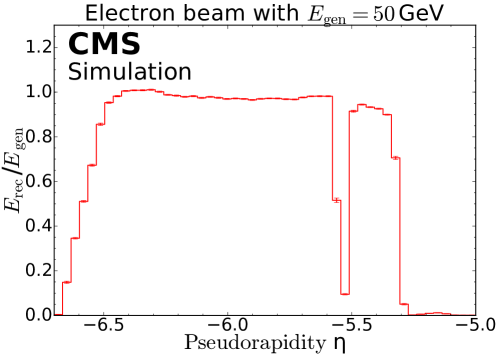
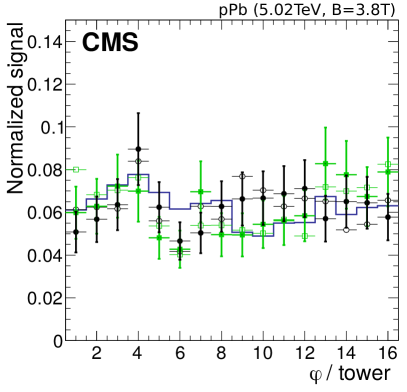
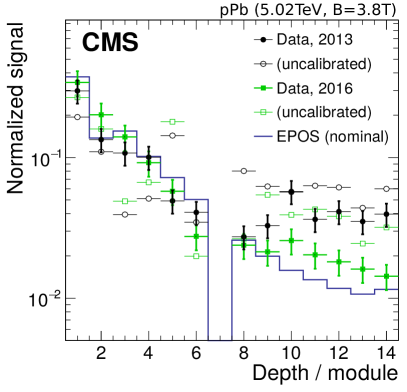
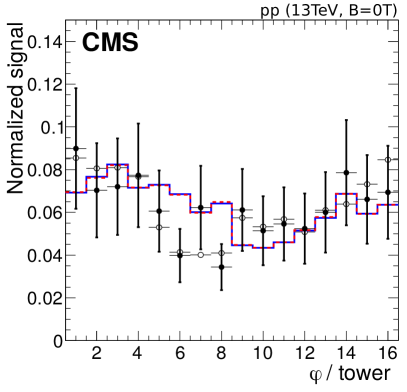
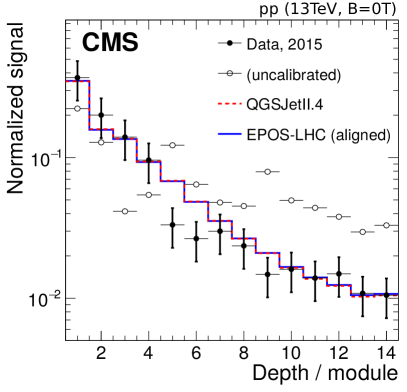
Figure 30 presents several comparisons of minimum-bias data, collected in \PpPb (upper panels) and \Pp\Pp (lower panels) collisions at the LHC, to detector simulations. Minimum-bias events are selected that have at least one HF tower with more than 10\GeVof energy on both sides of CMS, and exactly one reconstructed collision vertex. The open symbols show the data before calibration, while the filled symbols show them after normalization to the beam halo muon response. Bad channels are removed in data as well as in simulations. The data and MC distributions are absolutely normalized in order to perform a shape-sensitive comparison with the aim to study the performance of the intercalibration procedure. This is done since the average energy per collision is a highly model-dependent quantity and is not necessary for the understanding of the intercalibration. Furthermore, we exploit that the underlying physics at the LHC is, on average, symmetric in the azimuth angle. However, a small sinus-shaped modulation in is seen in the simulations in Fig. 30 (left) that is due to the known relative alignment of the LHC luminous region (“beam spot”) to the CASTOR calorimeter. Some parts of the detector are a bit closer in the transverse plane to the luminous region than others. In the very forward region, this represents a sizable effect on the detector acceptance. Such a modulation is also observed in the data. After the full calibration of collision data with beam halo muons, the statistical agreement of the azimuthal distributions between data and realistic simulations of the detector response is only fair. This suggests that the point-to-point uncertainties are underestimated, possibly because of additional unspecified sources of statistical and systematic uncertainties. This is corrected by scaling the error bars to yield (where are the number of degrees of freedom) in the azimuthal shape distributions with respect to the realistic full detector simulations (with events generated with the Epos-LHC model). We determine a residual additional calibration uncertainty at the tower level of about 25%, corresponding to the shown vertical bars. This uncertainty on the tower level translates into a possible impact on the energy scale normalization of the full CASTOR of the order of 25%/, consistent with alignment-related uncertainties in the absolute energy scale. Reasons for such residual mismatches can be numerous and cannot be disentangled from the available data. Possible reasons include differences in the signal generation between beam halo muons (as used for the calibration) and minimum-bias collisions, statistical fluctuations, geometrical as well as mechanical effects, etc. For any specific physics analysis of the data, these effects must be studied and quantified explicitly.
The projection in the longitudinal direction indicates a very good calibration from the front towards the rear of the calorimeter over almost two orders of magnitude in signal strength, showing that the calibration with the beam halo muon response yields a good measurement of the shower shape. The uncertainties shown in the shape of the longitudinal projected data are scaled with the same factor as described in the previous paragraph.
In the proton-lead data, there is some data-MC discrepancy in the rear part of the calorimeter, which is due to known alignment issues in 2013 relative to the LHC beam pipe, affecting the rear part of CASTOR. Thus, the data in modules 8 to 14 recorded in 2013 must be treated with special care. Dedicated detector simulation studies are needed to yield the required accuracy for physics analysis.
It is also important to realize that the detailed shower development in the CASTOR calorimeter is very sensitive to the underlying physics processes under study and cannot be assumed to be well known at such high energies. Thus, the comparisons in depth are only indicative and a test would not be a good measure of the detector performance. For physics measurements that use CASTOR data, the uncertainties in the calibration procedure must be specifically studied and quantified.
0.7.3 Analysis backgrounds and noise levels
There are two typical applications where the CASTOR detector is used for event classification measurements. First, tag events with forward particle production to provide the best possible acceptance for inelastic collisions [20]. Second, tag events with no activity that are related to processes with large rapidity gaps [17]. The ability to identify these conditions are both related to the noise levels in the calorimeter. Noise levels were already discussed at the level of single readout capacitors per channel as a tool of data quality control in Section 0.5.1. For physics analysis, this study must be extended (in units of energy) to account for noise effects in the reconstruction of calibrated physics objects.
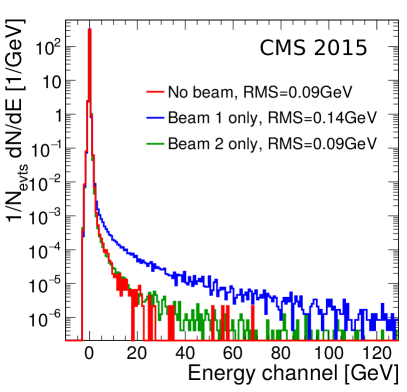
Noise studies are best performed with data taken in periods without LHC collisions, or alternatively with dedicated triggers for event selection. In Fig. 31, we show the noise levels per channel (upper left), per tower (upper right), and total in CASTOR (lower left), as well as the rate of energy deposits misidentified as jets (lower right). These are examples obtained from data recorded in 2015 in proton-proton collisions at with a CMS trigger requiring the absence of at least one of the two LHC beams per recorded bunch crossing. Because of the length of the pulse shape, particles from immediately preceding collisions can produce signals in the bunch crossing of interest. Hence, to avoid noise from out-of-time pileup, the data from bunch crossings that are closer in time than 250\unitns to any bunch of the nominal LHC filling scheme are excluded. The leakage of signal just outside the nominally colliding bunches is important to consider for LHC operations with small bunch separations. Some CASTOR data were recorded with bunch separation as small as 50\unitns. Extra care must be taken in such scenarios, although the overall performance does not change in a significant way. Readout noise is seen in the no-beam data, while beam-related backgrounds can be studied with one of the beams present. Since CASTOR is installed in the negative- side of the CMS experiment, the noise and timing of backgrounds from each LHC beam is different. Only the LHC beam 1 has a direction that can contribute to backgrounds for physics analyses, since the beam background will arrive timed-in with the secondaries from actual collisions at the IP. Recording and studying such data is very important for many physics analyses that are sensitive to noise and background levels. The noise level in units of energy mainly depends on the PMT gain settings, the channel intercalibration, and the absolute energy scale calibration. However, the main contribution is electronics noise from the cables and the digitizers, and is very stable.
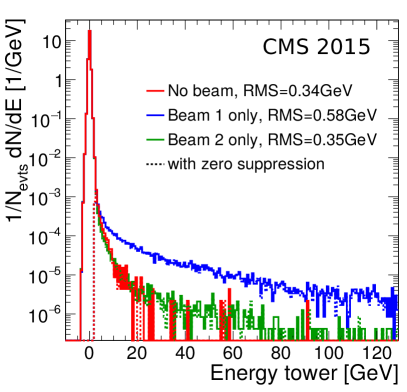
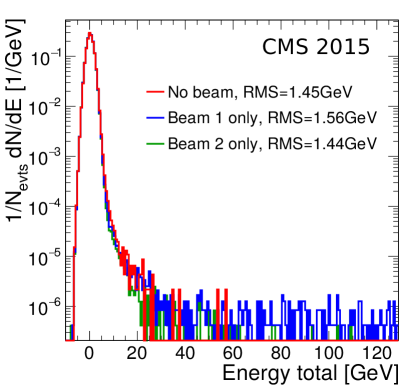
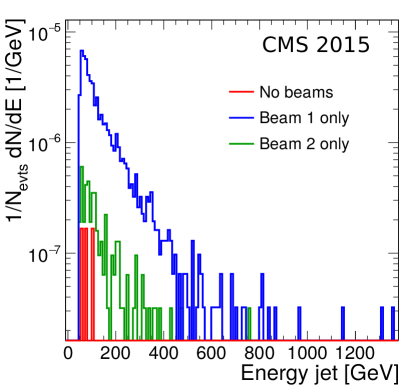
For \Pp\Pp collision HV settings, the typical analysis energy thresholds for physics measurements are about 0.4\GeVper channel, 1.5\GeVper tower, around 5\GeVfor the full CASTOR detector, and a few hundred \GeVfor jets. These values correspond roughly to the measured noise levels. The noise probability per event drops significantly faster towards the higher energy thresholds than observed in the jet rates from particle collision data (as seen by comparing Fig. 31, lower right, with Fig. 9, right). Even at the lowest energy thresholds, the fraction of noise in the reconstructed jet sample never exceeds . The typical \ptof jets at the lower threshold of about 500\GeVis about . All these results confirm that the small noise levels in CASTOR make it a suitable detector for full cross section measurements, for event type classification, as well as for jet reconstruction studies.
0.8 Summary
The physics motivation, detector design, triggers, calibration, alignment, simulation, and overall performance of the CASTOR calorimeter project have been described. The detector, located in an extremely challenging environment at very forward rapidities in the CMS experiment, has proven to be a valuable apparatus for multiple physics measurements in proton and nuclear collisions at the CERN LHC. The physics motivations for the detector construction, as well as measurements carried out during the Run 1 and 2 operations at the LHC, have been outlined. The overall detector design has been reviewed, emphasizing the features that allow its operation under a significant radiation exposure, required fast optical response, high occupancy, magnetic fields, and severe space constraints.
The calibration of CASTOR is a major challenge. Three different methods (offbeam, onbeam, and LED pulsers) used to set the gain correction factors of the CASTOR photosensors have been reviewed. The absolute energy scale is determined with a total precision of about 17%, which represents the dominant source of systematic uncertainty for many measurements. Despite the difficulties to precisely determine the absolute energy scale of the calorimeter, beam halo muons have proven a valuable tool to intercalibrate all channels, to monitor the stability of the detector, and to determine the noise levels. The alignment of CASTOR, which has an important impact on the calorimeter energy scale, data-simulation agreement, and on the actual detector acceptance, has been surveyed with two types of sensors, and cross-checked with measurements taken concurrently with the TOTEM T2 tracker in front of CASTOR. An alignment precision of the order of 1\mmwas achieved.
Different comparisons of the data to Monte Carlo simulations confirm that the reconstructed objects can be used for various physics analyses, from event-type classification to more advanced measurements (jets, single-particle spectra, etc.). Since CASTOR covers a unique phase space at the LHC, and since there are no future plans for the installation of a detector with comparable performance, the exploitation of the recorded data can provide many opportunities for interesting measurements in proton and nuclear collisions at the LHC.
Acknowledgements.
We congratulate our colleagues in the CERN accelerator departments for the excellent performance of the LHC and thank the technical and administrative staffs at CERN and at other CMS institutes for their contributions to the success of the CMS effort. In addition, we gratefully acknowledge the computing centers and personnel of the Worldwide LHC Computing Grid for delivering so effectively the computing infrastructure essential to our analyses. Moreover, the CASTOR detector project received important support and explicit funding from the Helmholtz Association (Germany) via grants HN-NG-733 and the joint Helmholtz-Russian grant HRJRG-002, as well from the “A. G. Leventis” Foundation (Greece). We are also grateful to our Colleagues from the TOTEM Collaboration for the combined data taking and the fantastic work on the T2+CASTOR combined data analysis. Finally, we acknowledge the enduring support for the construction and operation of the LHC and the CMS detector provided by the following funding agencies: the Austrian Federal Ministry of Education, Science and Research and the Austrian Science Fund; the Belgian Fonds de la Recherche Scientifique, and Fonds voor Wetenschappelijk Onderzoek; the Brazilian Funding Agencies (CNPq, CAPES, FAPERJ, FAPERGS, and FAPESP); the Bulgarian Ministry of Education and Science; CERN; the Chinese Academy of Sciences, Ministry of Science and Technology, and National Natural Science Foundation of China; the Colombian Funding Agency (COLCIENCIAS); the Croatian Ministry of Science, Education and Sport, and the Croatian Science Foundation; the Research and Innovation Foundation, Cyprus; the Secretariat for Higher Education, Science, Technology and Innovation, Ecuador; the Ministry of Education and Research, Estonian Research Council via PRG780, PRG803 and PRG445 and European Regional Development Fund, Estonia; the Academy of Finland, Finnish Ministry of Education and Culture, and Helsinki Institute of Physics; the Institut National de Physique Nucléaire et de Physique des Particules / CNRS, and Commissariat à l’Énergie Atomique et aux Énergies Alternatives / CEA, France; the Bundesministerium für Bildung und Forschung, the Deutsche Forschungsgemeinschaft (DFG) under Germany’s Excellence Strategy – EXC 2121 “Quantum Universe” – 390833306, and Helmholtz-Gemeinschaft Deutscher Forschungszentren, Germany; the General Secretariat for Research and Technology, Greece; the National Research, Development and Innovation Fund, Hungary; the Department of Atomic Energy and the Department of Science and Technology, India; the Institute for Studies in Theoretical Physics and Mathematics, Iran; the Science Foundation, Ireland; the Istituto Nazionale di Fisica Nucleare, Italy; the Ministry of Science, ICT and Future Planning, and National Research Foundation (NRF), Republic of Korea; the Ministry of Education and Science of the Republic of Latvia; the Lithuanian Academy of Sciences; the Ministry of Education, and University of Malaya (Malaysia); the Ministry of Science of Montenegro; the Mexican Funding Agencies (BUAP, CINVESTAV, CONACYT, LNS, SEP, and UASLP-FAI); the Ministry of Business, Innovation and Employment, New Zealand; the Pakistan Atomic Energy Commission; the Ministry of Science and Higher Education and the National Science Centre, Poland; the Fundação para a Ciência e a Tecnologia, Portugal; JINR, Dubna; the Ministry of Education and Science of the Russian Federation, the Federal Agency of Atomic Energy of the Russian Federation, Russian Academy of Sciences, the Russian Foundation for Basic Research, and the National Research Center “Kurchatov Institute”; the Ministry of Education, Science and Technological Development of Serbia; the Secretaría de Estado de Investigación, Desarrollo e Innovación, Programa Consolider-Ingenio 2010, Plan Estatal de Investigación Científica y Técnica y de Innovación 2017–2020, research project IDI-2018-000174 del Principado de Asturias, and Fondo Europeo de Desarrollo Regional, Spain; the Ministry of Science, Technology and Research, Sri Lanka; the Swiss Funding Agencies (ETH Board, ETH Zurich, PSI, SNF, UniZH, Canton Zurich, and SER); the Ministry of Science and Technology, Taipei; the Thailand Center of Excellence in Physics, the Institute for the Promotion of Teaching Science and Technology of Thailand, Special Task Force for Activating Research and the National Science and Technology Development Agency of Thailand; the Scientific and Technical Research Council of Turkey, and Turkish Atomic Energy Authority; the National Academy of Sciences of Ukraine; the Science and Technology Facilities Council, UK; the US Department of Energy, and the US National Science Foundation. Individuals have received support from the Marie-Curie program and the European Research Council and Horizon 2020 Grant, contract Nos. 675440, 724704, 752730, and 765710 (European Union); the Leventis Foundation; the A.P. Sloan Foundation; the Alexander von Humboldt Foundation; the Belgian Federal Science Policy Office; the Fonds pour la Formation à la Recherche dans l’Industrie et dans l’Agriculture (FRIA-Belgium); the Agentschap voor Innovatie door Wetenschap en Technologie (IWT-Belgium); the F.R.S.-FNRS and FWO (Belgium) under the “Excellence of Science – EOS” – be.h project n. 30820817; the Beijing Municipal Science & Technology Commission, No. Z191100007219010; the Ministry of Education, Youth and Sports (MEYS) of the Czech Republic; the Lendület (“Momentum”) Program and the János Bolyai Research Scholarship of the Hungarian Academy of Sciences, the New National Excellence Program ÚNKP, the NKFIA research grants 123842, 123959, 124845, 124850, 125105, 128713, 128786, and 129058 (Hungary); the Council of Scientific and Industrial Research, India; the HOMING PLUS program of the Foundation for Polish Science, cofinanced from European Union, Regional Development Fund, the Mobility Plus program of the Ministry of Science and Higher Education, the National Science Center (Poland), contracts Harmonia 2014/14/M/ST2/00428, Opus 2014/13/B/ST2/02543, 2014/15/B/ST2/03998, and 2015/19/B/ST2/02861, Sonata-bis 2012/07/E/ST2/01406; the National Priorities Research Program by Qatar National Research Fund; the Ministry of Science and Higher Education, project no. 02.a03.21.0005 (Russia); the Tomsk Polytechnic University Competitiveness Enhancement Program; the Programa de Excelencia María de Maeztu, and the Programa Severo Ochoa del Principado de Asturias; the Thalis and Aristeia programs cofinanced by EU-ESF, and the Greek NSRF; the Rachadapisek Sompot Fund for Postdoctoral Fellowship, Chulalongkorn University, and the Chulalongkorn Academic into Its 2nd Century Project Advancement Project (Thailand); the Kavli Foundation; the Nvidia Corporation; the SuperMicro Corporation; the Welch Foundation, contract C-1845; and the Weston Havens Foundation (USA).References
- [1] A. L. S. Angelis and A. D. Panagiotou, “CASTOR: A dedicated detector for the detection of Centauros and strangelets at the LHC”, J. Phys. G 23 (1997) 2069, 10.1088/0954-3899/23/12/032.
- [2] A. Angelis et al., “CASTOR: Centauro and strange object research in nucleus-nucleus collisions at the LHC”, Nucl. Phys. Proc. Suppl. 97 (2001) 227, 10.1016/S0920-5632(01)01270-1.
- [3] X. Aslanoglou et al., “First performance studies of a prototype for the CASTOR forward calorimeter at the CMS experiment”, Acta Phys. Polon. B 39 (2008) 1429, arXiv:0706.2576.
- [4] X. Aslanoglou et al., “Performance studies of prototype II for the CASTOR forward calorimeter at the CMS experiment”, Eur. Phys. J. C 52 (2007) 495, 10.1140/epjc/s10052-007-0380-x, arXiv:0706.2641.
- [5] S. Basegmez et al., “Performance studies for the prototype III of the CASTOR forward calorimeter at the CMS experiment”, Indian J. Phys. 84 (2010) 1689, 10.1007/s12648-010-0158-0.
- [6] CMS CASTOR Collaboration, “Design and test beam studies for the CASTOR calorimeter of the CMS experiment”, Nucl. Instrum. Meth. A 623 (2010) 225, 10.1016/j.nima.2010.02.203.
- [7] V. Andreev et al., “Performance studies of a full-length prototype for the CASTOR forward calorimeter at the CMS experiment”, Eur. Phys. J. C 67 (2010) 601, 10.1140/epjc/s10052-010-1316-4.
- [8] CMS Collaboration, “The CMS experiment at the CERN LHC”, JINST 3 (2008) S08004, 10.1088/1748-0221/3/08/S08004.
- [9] J. D. Bjorken and L. D. McLerran, “Explosive quark matter and the Centauro event”, Phys. Rev. D 20 (1979) 2353, 10.1103/PhysRevD.20.2353.
- [10] Chacaltaya and Pamir Collaboration, “Observation of attenuation behavior of hadrons in extremely high-energy cosmic ray interactions: New hadronic state?”, Nucl. Phys. B 424 (1994) 241, 10.1016/0550-3213(94)90295-X.
- [11] J. Kempa et al., “Emulsion chamber observations of Centauros, aligned events and the long-flying component”, Central Eur. J. Phys. 10 (2012) 723, 10.2478/s11534-012-0072-5.
- [12] M. Albrow et al., “Prospects for diffractive and forward physics at the LHC”, technical report, 2006. CERN-LHCC-2006-039-G-124.
- [13] M. Deile, D. d’Enterria, and A. De Roeck, eds., “Elastic and diffractive scattering. Proceedings, 13th International Conference, Blois Workshop, CERN, Geneva, Switzerland, June 29-July 3, 2009”. (2010). arXiv:1002.3527.
- [14] CMS Collaboration, “CMS physics technical design report: Addendum on high density QCD with heavy ions”, J. Phys. G 34 (2007) 2307, 10.1088/0954-3899/34/11/008.
- [15] CMS Collaboration, “Measurement of energy flow at large pseudorapidities in pp collisions at and 7 TeV”, JHEP 11 (2011) 148, 10.1007/JHEP11(2011)148, arXiv:1110.0211. [Erratum: \DOI10.1007/JHEP02(2012)055].
- [16] CMS Collaboration, “Study of the underlying event at forward rapidity in pp collisions at = 0.9, 2.76, and 7 TeV”, JHEP 04 (2013) 072, 10.1007/JHEP04(2013)072, arXiv:1302.2394.
- [17] CMS Collaboration, “Measurement of diffraction dissociation cross sections in pp collisions at = 7 TeV”, Phys. Rev. D 92 (2015) 012003, 10.1103/PhysRevD.92.012003, arXiv:1503.08689.
- [18] CMS Collaboration, “Measurement of the inclusive energy spectrum in the very forward direction in proton-proton collisions at TeV”, JHEP 08 (2017) 046, 10.1007/JHEP08(2017)046, arXiv:1701.08695.
- [19] CMS Collaboration, “Measurement of the energy density as a function of pseudorapidity in proton-proton collisions at 13 TeV”, Eur. Phys. J. C 79 (2019) 391, 10.1140/epjc/s10052-019-6861-x, arXiv:1812.04095.
- [20] CMS Collaboration, “Measurement of the inelastic proton-proton cross section at TeV”, JHEP 07 (2018) 161, 10.1007/JHEP07(2018)161, arXiv:1802.02613.
- [21] CMS Collaboration, “Extraction and validation of a new set of CMS PYTHIA 8 tunes from underlying-event measurements”, Eur. Phys. J. C 80 (2020) 4, 10.1140/epjc/s10052-019-7499-4, arXiv:1903.12179.
- [22] CMS Collaboration, “Measurement of the average very forward energy as a function of the track multiplicity at central pseudorapidities in proton-proton collisions at 13 TeV”, Eur. Phys. J. C 79 (2019) 893, 10.1140/epjc/s10052-019-7402-3, arXiv:1908.01750.
- [23] CMS Collaboration, “Measurement of inclusive very forward jet cross sections in proton-lead collisions at = 5.02 TeV”, JHEP 05 (2019) 043, 10.1007/JHEP05(2019)043, arXiv:1812.01691.
- [24] CMS Collaboration, “Centrality and pseudorapidity dependence of the transverse energy density in pPb collisions at 5.02 TeV”, Phys. Rev. C 100 (2019) 024902, 10.1103/PhysRevC.100.024902, arXiv:1810.05745.
- [25] CMS Collaboration, “Measurement of exclusive photoproduction in ultraperipheral pPb collisions at 5.02 TeV”, Eur. Phys. J. C 79 (2019) 702, 10.1140/epjc/s10052-019-7202-9, arXiv:1902.01339.
- [26] CMS Collaboration, “Measurement of the pseudorapidity and centrality dependence of the very forward energy density in PbPb collisions at 2.76 ATeV”, CMS Physics Analysis Summary CMS-PAS-HIN-12-006, 2012.
- [27] “The CERN Open Data Portal”. http://opendata.cern.ch, 2020.
- [28] CMS Collaboration, “Open data at CMS: status and plans”, PoS LHCP2019 (2019) 260, 10.22323/1.350.0260.
- [29] CMS Collaboration, “Performance of the combined zero degree calorimeter for CMS”, J. Phys. Conf. Ser. 160 (2009) 012059, 10.1088/1742-6596/160/1/012059, arXiv:0807.0785.
- [30] ATLAS Collaboration, “The ATLAS experiment at the CERN Large Hadron Collider”, JINST 3 (2008) S08003, 10.1088/1748-0221/3/08/S08003.
- [31] ALICE Collaboration, “The ALICE experiment at the CERN LHC”, JINST 3 (2008) S08002, 10.1088/1748-0221/3/08/S08002.
- [32] LHCf Collaboration, “The LHCf detector at the CERN Large Hadron Collider”, JINST 3 (2008) S08006, 10.1088/1748-0221/3/08/S08006.
- [33] LHCb Collaboration, “The LHCb detector at the LHC”, JINST 3 (2008) S08005, 10.1088/1748-0221/3/08/S08005.
- [34] TOTEM Collaboration, “The TOTEM experiment at the CERN Large Hadron Collider”, JINST 3 (2008) S08007, 10.1088/1748-0221/3/08/S08007.
- [35] ZEUS Collaboration, “Measurement of the proton structure function in e-p scattering at HERA”, Phys. Lett. B 316 (1993) 412, 10.1016/0370-2693(93)90347-K.
- [36] H1 Collaboration, “Measurement of the proton structure function in the low region at HERA”, Nucl. Phys. B 407 (1993) 515, 10.1016/0550-3213(93)90090-C.
- [37] K. Akiba et al., “LHC forward physics”, J. Phys. G 43 (2016) 110201, 10.1088/0954-3899/43/11/110201, arXiv:1611.05079.
- [38] CMS Collaboration, “Jet production in the very forward direction at 13 TeV with CMS”, AIP Conf. Proc. 1815 (2017) 060021, 10.1063/1.4976417.
- [39] V. N. Gribov and L. N. Lipatov, “Deep inelastic e-p scattering in perturbation theory”, Sov. J. Nucl. Phys. 15 (1972) 438. [Yad. Fiz. 15 (1972) 781].
- [40] G. Altarelli and G. Parisi, “Asymptotic freedom in parton language”, Nucl. Phys. B 126 (1977) 298, 10.1016/0550-3213(77)90384-4.
- [41] Y. L. Dokshitzer, “Calculation of the structure functions for deep inelastic scattering and e+e- annihilation by perturbation theory in quantum chromodynamics”, Sov. Phys. JETP 46 (1977) 641. [Zh. Eksp. Teor. Fiz. 73 (1977) 1216].
- [42] E. A. Kuraev, L. N. Lipatov, and V. S. Fadin, “The Pomeranchuk singularity in nonabelian gauge theories”, Sov. Phys. JETP 45 (1977) 199. [Zh. Eksp. Teor. Fiz. 72 (1977) 377].
- [43] E. A. Kuraev, L. N. Lipatov, and V. S. Fadin, “Multi-reggeon processes in the Yang–Mills theory”, Sov. Phys. JETP 44 (1976) 443. [Zh. Eksp. Teor. Fiz. 71 (1976) 840].
- [44] I. I. Balitsky and L. N. Lipatov, “The Pomeranchuk singularity in quantum chromodynamics”, Sov. J. Nucl. Phys. 28 (1978) 822. [Yad. Fiz. 28 (1978) 1597].
- [45] L. N. Lipatov, “The bare pomeron in quantum chromodynamics”, Sov. Phys. JETP 63 (1986) 904. [Zh. Eksp. Teor. Fiz. 90 (1986) 1536].
- [46] E. Iancu, A. Leonidov, and L. McLerran, “The color glass condensate: an introduction”, QCD perspectives on hot and dense matter. Proceedings, NATO Advanced Study Institute, Summer School, Cargese, France, August 6-18, 2001 (2002) 73, arXiv:hep-ph/0202270.
- [47] CMS Collaboration, “Low-x QCD studies with forward jets in proton-proton collisions at = 14 TeV”, AIP Conf. Proc. 1105 (2009) 28, 10.1063/1.3122196, arXiv:0812.2665.
- [48] D. d’Enterria, “Forward jets physics in ATLAS, CMS and LHCb”, in Elastic and Diffractive Scattering. Proceedings, 13th International Conference, Blois Workshop, CERN, Geneva, Switzerland, June 29-July 3, 2009, p. 381. 2009. arXiv:0911.1273.
- [49] A. H. Mueller and H. Navelet, “An inclusive minijet cross-section and the bare pomeron in QCD”, Nucl. Phys. B 282 (1987) 727, 10.1016/0550-3213(87)90705-X.
- [50] CMS Collaboration, “Azimuthal decorrelation of jets widely separated in rapidity in pp collisions at TeV”, JHEP 08 (2016) 139, 10.1007/JHEP08(2016)139, arXiv:1601.06713.
- [51] R. Ulrich, R. Engel, and M. Unger, “Hadronic multiparticle production at ultra-high energies and extensive air showers”, Phys. Rev. D 83 (2011) 054026, 10.1103/PhysRevD.83.054026, arXiv:1010.4310.
- [52] D. d’Enterria et al., “Constraints from the first LHC data on hadronic event generators for ultra-high energy cosmic-ray physics”, Astropart. Phys. 35 (2011) 98, 10.1016/j.astropartphys.2011.05.002, arXiv:1101.5596.
- [53] CMS Collaboration, “Results of the CMS-CASTOR very-forward calorimeter in pp collisions at = 13 TeV”, PoS ICHEP2016 (2017) 1020, 10.22323/1.282.1020.
- [54] EAS-MSU, IceCube, KASCADE-Grande, NEVOD-DECOR, Pierre Auger, SUGAR, Telescope Array, Yakutsk EAS Array Collaboration, “Report on tests and measurements of hadronic interaction properties with air showers”, Eur. Phys. J. Web Conf. 210 (2019) 02004, 10.1051/epjconf/201921002004, arXiv:1902.08124.
- [55] Z. Citron et al., “Report from working group 5”, in Report on the physics at the HL-LHC, and perspectives for the HE-LHC, A. Dainese et al., eds., p. 1159. 2019. arXiv:1812.06772. 10.23731/CYRM-2019-007.1159.
- [56] E. Gladysz-Dziadus, “CASTOR: Centauro And STrange Object Research – exotic aspects of forward physics at the LHC”, Acta Phys. Polon. B 37 (2006) 153.
- [57] E. Farhi and R. L. Jaffe, “Strange matter”, Phys. Rev. D 30 (1984) 2379, 10.1103/PhysRevD.30.2379.
- [58] A. A. Anselm, “Classical states of the chiral field and nuclear collisions at very high-energy”, Phys. Lett. B 217 (1989) 169, 10.1016/0370-2693(89)91537-2.
- [59] A. J. Baltz, “The physics of ultraperipheral collisions at the LHC”, Phys. Rept. 458 (2008) 1, 10.1016/j.physrep.2007.12.001, arXiv:0706.3356.
- [60] CMS Collaboration, “Studies of the nuclear stopping power in PbPb collisions at 2.76 TeV with CMS”, Nucl. Phys. A 904 (2013) 787c, 10.1016/j.nuclphysa.2013.02.134.
- [61] G. Bayatian et al., “Design, performance and calibration of the CMS forward calorimeter wedges”, Eur. Phys. J. C 53 (2008) 139, 10.1140/epjc/s10052-007-0459-4.
- [62] H1 SpaCal Collaboration, “Series tests of fine mesh photomultiplier tubes in magnetic fields of up to 1.2-Tesla”, Nucl. Instrum. Meth. A 404 (1998) 265, 10.1016/S0168-9002(97)01092-9.
- [63] H1 SpaCal Collaboration, “The H1 lead / scintillating fiber calorimeter”, Nucl. Instrum. Meth. A 386 (1997) 397, 10.1016/S0168-9002(96)01171-0.
- [64] T. M. Shaw et al., “Front end readout electronics for the CMS hadron calorimeter”, in Nuclear Science Symposium Conference Record, 2002 IEEE, volume 1, p. 194. 2002. 10.1109/NSSMIC.2002.1239297.
- [65] CMS Collaboration, “The CMS trigger system”, JINST 12 (2017) P01020, 10.1088/1748-0221/12/01/P01020, arXiv:1609.02366.
- [66] CMS and TOTEM Collaboration, “Alignment of CASTOR with 2013 pA TOTEM-Data”, CMS Detector Performance Note CMS-DP-2014-014, 2014.
- [67] CMS Collaboration, “Description and performance of track and primary-vertex reconstruction with the CMS tracker”, JINST 9 (2014) P10009, 10.1088/1748-0221/9/10/P10009, arXiv:1405.6569.
- [68] T. Sjöstrand, S. Mrenna, and P. Z. Skands, “A brief introduction to PYTHIA 8.1”, Comput. Phys. Commun. 178 (2008) 852, 10.1016/j.cpc.2008.01.036, arXiv:0710.3820.
- [69] R. Ciesielski and K. Goulianos, “MBR Monte Carlo simulation in PYTHIA 8”, PoS ICHEP2012 (2013) 301, 10.22323/1.174.0301, arXiv:1205.1446.
- [70] M. Cacciari, G. P. Salam, and G. Soyez, “The anti-\ktjet clustering algorithm”, JHEP 04 (2008) 063, 10.1088/1126-6708/2008/04/063, arXiv:0802.1189.
- [71] CMS Collaboration, “Event generator tunes obtained from underlying event and multiparton scattering measurements”, Eur. Phys. J. C 76 (2016) 155, 10.1140/epjc/s10052-016-3988-x, arXiv:1512.00815.
- [72] K. Werner, F.-M. Liu, and T. Pierog, “Parton ladder splitting and the rapidity dependence of transverse momentum spectra in deuteron-gold collisions at RHIC”, Phys. Rev. C 74 (2006) 044902, 10.1103/PhysRevC.74.044902, arXiv:hep-ph/0506232.
- [73] T. Sjöstrand, S. Mrenna, and P. Z. Skands, “PYTHIA 6.4 physics and manual”, JHEP 05 (2006) 026, 10.1088/1126-6708/2006/05/026, arXiv:hep-ph/0603175.
- [74] R. Field, “Physics at the Tevatron”, Acta Phys. Polon. B 39 (2008) 2611.
- [75] A. Buckley et al., “Systematic event generator tuning for the LHC”, Eur. Phys. J. C 65 (2010) 331, 10.1140/epjc/s10052-009-1196-7, arXiv:0907.2973.
- [76] G. Corcella et al., “HERWIG 6: An event generator for hadron emission reactions with interfering gluons (including supersymmetric processes)”, JHEP 01 (2001) 010, 10.1088/1126-6708/2001/01/010, arXiv:hep-ph/0011363.
- [77] N. N. Kalmykov, S. S. Ostapchenko, and A. I. Pavlov, “EAS and a quark – gluon string model with jets”, Bull. Russ. Acad. Sci. Phys. 58 (1994) 1966. [Izv. Ross. Akad. Nauk Ser. Fiz. 58N12 (1994) 21].
- [78] S. Ostapchenko, “Nonlinear screening effects in high energy hadronic interactions”, Phys. Rev. D 74 (2006) 014026, 10.1103/PhysRevD.74.014026, arXiv:hep-ph/0505259.
- [79] E.-J. Ahn et al., “Cosmic ray interaction event generator SIBYLL 2.1”, Phys. Rev. D 80 (2009) 094003, 10.1103/PhysRevD.80.094003, arXiv:0906.4113.
- [80] V. N. Gribov, “A reggeon diagram technique”, Sov. Phys. JETP 26 (1968) 414. [Zh. Eksp. Teor. Fiz. 53 (1967) 654].
- [81] GEANT4 Collaboration, “\GEANTfour—a simulation toolkit”, Nucl. Instrum. Meth. A 506 (2003) 250, 10.1016/S0168-9002(03)01368-8.
- [82] TOTEM Collaboration, “The TOTEM T2 GEM detector assembly and quality assurance”, JINST 4 (2009) P11020, 10.1088/1748-0221/4/11/P11020.
- [83] V. Innocente, L. Silvestris, and D. Stickland, “CMS software architecture – software framework, services and persistency in high level trigger, reconstruction and analysis”, Comput. Phys. Commun. 140 (2001) 31, 10.1016/S0010-4655(01)00253-3.
- [84] HEP Software Foundation Collaboration, “HEP software foundation community white paper working group – detector simulation”, technical report, 2018. arXiv:1803.04165.
.9 The CMS Collaboration
Yerevan Physics Institute, Yerevan, Armenia
V. Khachatryan, A.M. Sirunyan, A. Tumasyan
\cmsinstskipInstitut für Hochenergiephysik, Wien, Austria
W. Adam, F. Ambrogi, T. Bergauer, M. Dragicevic, J. Erö, A. Escalante Del Valle, R. Frühwirth\cmsAuthorMark1, M. Jeitler\cmsAuthorMark1, N. Krammer, L. Lechner, D. Liko, T. Madlener, I. Mikulec, F.M. Pitters, N. Rad, J. Schieck\cmsAuthorMark1, R. Schöfbeck, M. Spanring, S. Templ, W. Waltenberger, C.-E. Wulz\cmsAuthorMark1, M. Zarucki
\cmsinstskipInstitute for Nuclear Problems, Minsk, Belarus
V. Chekhovsky, A. Litomin, V. Makarenko, J. Suarez Gonzalez
\cmsinstskipUniversiteit Antwerpen, Antwerpen, Belgium
W. Beaumont, M.R. Darwish\cmsAuthorMark2, E.A. De Wolf, D. Di Croce, X. Janssen, T. Kello\cmsAuthorMark3, A. Lelek, M. Pieters, H. Rejeb Sfar, H. Van Haevermaet, P. Van Mechelen, S. Van Putte, N. Van Remortel
\cmsinstskipVrije Universiteit Brussel, Brussel, Belgium
F. Blekman, E.S. Bols, S.S. Chhibra, J. D’Hondt, J. De Clercq, D. Lontkovskyi, S. Lowette, I. Marchesini, S. Moortgat, A. Morton, Q. Python, S. Tavernier, W. Van Doninck, P. Van Mulders
\cmsinstskipUniversité Libre de Bruxelles, Bruxelles, Belgium
D. Beghin, B. Bilin, B. Clerbaux, G. De Lentdecker, H. Delannoy, B. Dorney, L. Favart, A. Grebenyuk, A.K. Kalsi, I. Makarenko, L. Moureaux, L. Pétré, A. Popov, N. Postiau, E. Starling, L. Thomas, C. Vander Velde, P. Vanlaer, D. Vannerom, L. Wezenbeek
\cmsinstskipGhent University, Ghent, Belgium
T. Cornelis, D. Dobur, I. Khvastunov\cmsAuthorMark4, M. Niedziela, C. Roskas, K. Skovpen, M. Tytgat, W. Verbeke, B. Vermassen, M. Vit
\cmsinstskipUniversité Catholique de Louvain, Louvain-la-Neuve, Belgium
G. Bruno, F. Bury, C. Caputo, P. David, C. Delaere, M. Delcourt, I.S. Donertas, A. Giammanco, V. Lemaitre, K. Mondal, J. Prisciandaro, A. Taliercio, M. Teklishyn, P. Vischia, S. Wuyckens, J. Zobec
\cmsinstskipCentro Brasileiro de Pesquisas Fisicas, Rio de Janeiro, Brazil
G.A. Alves, G. Correia Silva, C. Hensel, A. Moraes
\cmsinstskipUniversidade do Estado do Rio de Janeiro, Rio de Janeiro, Brazil
W.L. Aldá Júnior, E. Belchior Batista Das Chagas, W. Carvalho, J. Chinellato\cmsAuthorMark5, E. Coelho, E.M. Da Costa, G.G. Da Silveira\cmsAuthorMark6, D. De Jesus Damiao, S. Fonseca De Souza, H. Malbouisson, J. Martins\cmsAuthorMark7, D. Matos Figueiredo, M. Medina Jaime\cmsAuthorMark8, M. Melo De Almeida, C. Mora Herrera, L. Mundim, H. Nogima, P. Rebello Teles, L.J. Sanchez Rosas, A. Santoro, S.M. Silva Do Amaral, A. Sznajder, M. Thiel, E.J. Tonelli Manganote\cmsAuthorMark5, F. Torres Da Silva De Araujo, A. Vilela Pereira
\cmsinstskipUniversidade Estadual Paulista a, Universidade Federal do ABC b, São Paulo, Brazil
C.A. Bernardesa, L. Calligarisa, T.R. Fernandez Perez Tomeia, E.M. Gregoresb, D.S. Lemosa, P.G. Mercadanteb, S.F. Novaesa, Sandra S. Padulaa
\cmsinstskipInstitute for Nuclear Research and Nuclear Energy, Bulgarian Academy of Sciences, Sofia, Bulgaria
A. Aleksandrov, G. Antchev, I. Atanasov, R. Hadjiiska, P. Iaydjiev, M. Misheva, M. Rodozov, M. Shopova, G. Sultanov
\cmsinstskipUniversity of Sofia, Sofia, Bulgaria
M. Bonchev, A. Dimitrov, T. Ivanov, L. Litov, B. Pavlov, P. Petkov, A. Petrov
\cmsinstskipBeihang University, Beijing, China
W. Fang\cmsAuthorMark3, Q. Guo, H. Wang, L. Yuan
\cmsinstskipDepartment of Physics, Tsinghua University, Beijing, China
M. Ahmad, Z. Hu, Y. Wang
\cmsinstskipInstitute of High Energy Physics, Beijing, China
E. Chapon, G.M. Chen\cmsAuthorMark9, H.S. Chen\cmsAuthorMark9, M. Chen, C.H. Jiang, D. Leggat, H. Liao, Z. Liu, R. Sharma, A. Spiezia, J. Tao, J. Thomas-wilsker, J. Wang, H. Zhang, S. Zhang\cmsAuthorMark9, J. Zhao
\cmsinstskipState Key Laboratory of Nuclear Physics and Technology, Peking University, Beijing, China
A. Agapitos, Y. Ban, C. Chen, G. Chen, A. Levin, L. Li, Q. Li, M. Lu, X. Lyu, Y. Mao, S.J. Qian, D. Wang, Q. Wang, J. Xiao, D. Yang
\cmsinstskipSun Yat-Sen University, Guangzhou, China
Z. You
\cmsinstskipInstitute of Modern Physics and Key Laboratory of Nuclear Physics and Ion-beam Application (MOE) - Fudan University, Shanghai, China
X. Gao\cmsAuthorMark3
\cmsinstskipZhejiang University, Hangzhou, China
M. Xiao
\cmsinstskipUniversidad de Los Andes, Bogota, Colombia
C. Avila, A. Cabrera, C. Florez, J. Fraga, A. Sarkar, M.A. Segura Delgado
\cmsinstskipUniversidad de Antioquia, Medellin, Colombia
J. Mejia Guisao, F. Ramirez, J.D. Ruiz Alvarez, C.A. Salazar González, N. Vanegas Arbelaez
\cmsinstskipUniversity of Split, Faculty of Electrical Engineering, Mechanical Engineering and Naval Architecture, Split, Croatia
D. Giljanovic, N. Godinovic, D. Lelas, I. Puljak, T. Sculac
\cmsinstskipUniversity of Split, Faculty of Science, Split, Croatia
Z. Antunovic, M. Kovac
\cmsinstskipInstitute Rudjer Boskovic, Zagreb, Croatia
V. Brigljevic, D. Ferencek, D. Majumder, B. Mesic, M. Roguljic, A. Starodumov\cmsAuthorMark10, T. Susa
\cmsinstskipUniversity of Cyprus, Nicosia, Cyprus
M.W. Ather, A. Attikis, E. Erodotou, A. Ioannou, G. Kole, M. Kolosova, S. Konstantinou, G. Mavromanolakis, J. Mousa, C. Nicolaou, F. Ptochos, P.A. Razis, H. Rykaczewski, H. Saka, D. Tsiakkouri
\cmsinstskipCharles University, Prague, Czech Republic
M. Finger\cmsAuthorMark11, M. Finger Jr.\cmsAuthorMark11, A. Kveton, J. Tomsa
\cmsinstskipEscuela Politecnica Nacional, Quito, Ecuador
E. Ayala
\cmsinstskipUniversidad San Francisco de Quito, Quito, Ecuador
E. Carrera Jarrin
\cmsinstskipAcademy of Scientific Research and Technology of the Arab Republic of Egypt, Egyptian Network of High Energy Physics, Cairo, Egypt
H. Abdalla\cmsAuthorMark12, A. Mohamed\cmsAuthorMark13, E. Salama\cmsAuthorMark14,\cmsAuthorMark15
\cmsinstskipCenter for High Energy Physics (CHEP-FU), Fayoum University, El-Fayoum, Egypt
M.A. Mahmoud, Y. Mohammed\cmsAuthorMark16
\cmsinstskipNational Institute of Chemical Physics and Biophysics, Tallinn, Estonia
S. Bhowmik, A. Carvalho Antunes De Oliveira, R.K. Dewanjee, K. Ehataht, M. Kadastik, M. Raidal, C. Veelken
\cmsinstskipDepartment of Physics, University of Helsinki, Helsinki, Finland
P. Eerola, L. Forthomme, H. Kirschenmann, K. Osterberg, M. Voutilainen
\cmsinstskipHelsinki Institute of Physics, Helsinki, Finland
E. Brücken, F. Garcia, J. Havukainen, V. Karimäki, M.S. Kim, R. Kinnunen, T. Lampén, K. Lassila-Perini, S. Laurila, S. Lehti, T. Lindén, H. Siikonen, E. Tuominen, J. Tuominiemi
\cmsinstskipLappeenranta University of Technology, Lappeenranta, Finland
P. Luukka, T. Tuuva
\cmsinstskipIRFU, CEA, Université Paris-Saclay, Gif-sur-Yvette, France
M. Besancon, F. Couderc, M. Dejardin, D. Denegri, J.L. Faure, F. Ferri, S. Ganjour, A. Givernaud, P. Gras, G. Hamel de Monchenault, P. Jarry, B. Lenzi, E. Locci, J. Malcles, J. Rander, A. Rosowsky, M.Ö. Sahin, A. Savoy-Navarro\cmsAuthorMark17, M. Titov, G.B. Yu
\cmsinstskipLaboratoire Leprince-Ringuet, CNRS/IN2P3, Ecole Polytechnique, Institut Polytechnique de Paris, Palaiseau, France
S. Ahuja, C. Amendola, F. Beaudette, M. Bonanomi, P. Busson, C. Charlot, O. Davignon, B. Diab, G. Falmagne, R. Granier de Cassagnac, I. Kucher, A. Lobanov, C. Martin Perez, M. Nguyen, C. Ochando, P. Paganini, J. Rembser, R. Salerno, J.B. Sauvan, Y. Sirois, A. Zabi, A. Zghiche
\cmsinstskipUniversité de Strasbourg, CNRS, IPHC UMR 7178, Strasbourg, France
J.-L. Agram\cmsAuthorMark18, J. Andrea, D. Bloch, G. Bourgatte, J.-M. Brom, E.C. Chabert, C. Collard, J.-C. Fontaine\cmsAuthorMark18, D. Gelé, U. Goerlach, C. Grimault, A.-C. Le Bihan, P. Van Hove
\cmsinstskipUniversité de Lyon, Université Claude Bernard Lyon 1, CNRS-IN2P3, Institut de Physique Nucléaire de Lyon, Villeurbanne, France
E. Asilar, S. Beauceron, C. Bernet, G. Boudoul, C. Camen, A. Carle, N. Chanon, D. Contardo, P. Depasse, H. El Mamouni, J. Fay, S. Gascon, M. Gouzevitch, B. Ille, Sa. Jain, I.B. Laktineh, H. Lattaud, A. Lesauvage, M. Lethuillier, L. Mirabito, L. Torterotot, G. Touquet, M. Vander Donckt, S. Viret
\cmsinstskipGeorgian Technical University, Tbilisi, Georgia
G. Adamov
\cmsinstskipTbilisi State University, Tbilisi, Georgia
Z. Tsamalaidze\cmsAuthorMark11
\cmsinstskipRWTH Aachen University, I. Physikalisches Institut, Aachen, Germany
L. Feld, K. Klein, M. Lipinski, D. Meuser, A. Pauls, M. Preuten, M.P. Rauch, J. Schulz, M. Teroerde
\cmsinstskipRWTH Aachen University, III. Physikalisches Institut A, Aachen, Germany
D. Eliseev, M. Erdmann, P. Fackeldey, B. Fischer, S. Ghosh, T. Hebbeker, K. Hoepfner, H. Keller, L. Mastrolorenzo, M. Merschmeyer, A. Meyer, P. Millet, G. Mocellin, S. Mondal, S. Mukherjee, D. Noll, A. Novak, T. Pook, A. Pozdnyakov, T. Quast, M. Radziej, Y. Rath, H. Reithler, J. Roemer, A. Schmidt, S.C. Schuler, A. Sharma, S. Wiedenbeck, S. Zaleski
\cmsinstskipRWTH Aachen University, III. Physikalisches Institut B, Aachen, Germany
C. Dziwok, G. Flügge, W. Haj Ahmad\cmsAuthorMark19, O. Hlushchenko, T. Kress, A. Nowack, C. Pistone, O. Pooth, D. Roy, H. Sert, A. Stahl\cmsAuthorMark20, T. Ziemons
\cmsinstskipDeutsches Elektronen-Synchrotron, Hamburg, Germany
H. Aarup Petersen, M. Aldaya Martin, P. Asmuss, I. Babounikau, S. Baxter, O. Behnke, A. Bermúdez Martínez, A.A. Bin Anuar, K. Borras\cmsAuthorMark21, V. Botta, D. Brunner, A. Campbell, A. Cardini, P. Connor, S. Consuegra Rodríguez, V. Danilov, A. De Wit, M.M. Defranchis, L. Didukh, D. Domínguez Damiani, G. Eckerlin, D. Eckstein, T. Eichhorn, A. Elwood, L.I. Estevez Banos, E. Gallo\cmsAuthorMark22, A. Geiser, A. Giraldi, P. Goettlicher, A. Grohsjean, M. Guthoff, M. Haranko, A. Harb, A. Jafari\cmsAuthorMark23, N.Z. Jomhari, H. Jung, A. Kasem\cmsAuthorMark21, M. Kasemann, P. Katsas, H. Kaveh, J. Keaveney, C. Kleinwort, J. Knolle, D. Krücker, W. Lange, T. Lenz, J. Lidrych, K. Lipka, W. Lohmann\cmsAuthorMark24, R. Mankel, H. Maser, I.-A. Melzer-Pellmann, J. Metwally, A.B. Meyer, M. Meyer, M. Missiroli, J. Mnich, C. Muhl, A. Mussgiller, V. Myronenko, Y. Otarid, D. Pérez Adán, S.K. Pflitsch, D. Pitzl, A. Raspereza, B. Roland, A. Saggio, A. Saibel, M. Savitskyi, V. Scheurer, P. Schütze, C. Schwanenberger, R. Shevchenko, A. Singh, R.E. Sosa Ricardo, H. Tholen, N. Tonon, O. Turkot, A. Vagnerini, M. Van De Klundert, R. Walsh, D. Walter, Y. Wen, K. Wichmann, C. Wissing, S. Wuchterl, O. Zenaiev, R. Zlebcik, A. Zuber
\cmsinstskipUniversity of Hamburg, Hamburg, Germany
R. Aggleton, S. Bein, L. Benato, A. Benecke, K. De Leo, T. Dreyer, A. Ebrahimi, F. Feindt, A. Fröhlich, C. Garbers, E. Garutti, D. Gonzalez, P. Gunnellini, J. Haller, A. Hinzmann, A. Karavdina, G. Kasieczka, R. Klanner, R. Kogler, S. Kurz, V. Kutzner, J. Lange, T. Lange, A. Malara, J. Multhaup, C.E.N. Niemeyer, A. Nigamova, K.J. Pena Rodriguez, O. Rieger, P. Schleper, S. Schumann, J. Schwandt, D. Schwarz, J. Sonneveld, H. Stadie, G. Steinbrück, B. Vormwald, I. Zoi
\cmsinstskipKarlsruher Institut fuer Technologie, Karlsruhe, Germany
M. Akbiyik, M. Baselga, S. Baur, C. Baus, J. Bechtel, T. Berger, E. Butz, R. Caspart, T. Chwalek, W. De Boer, A. Dierlamm, A. Droll, K. El Morabit, N. Faltermann, K. Flöh, M. Giffels, A. Gottmann, F. Hartmann\cmsAuthorMark20, C. Heidecker, U. Husemann, M.A. Iqbal, I. Katkov\cmsAuthorMark25, P. Keicher, R. Koppenhöfer, S. Kudella, S. Maier, M. Metzler, S. Mitra, M.U. Mozer, D. Müller, Th. Müller, M. Musich, G. Quast, K. Rabbertz, J. Rauser, D. Savoiu, D. Schäfer, M. Schnepf, M. Schröder, D. Seith, I. Shvetsov, H.J. Simonis, R. Ulrich, M. Wassmer, M. Weber, C. Wöhrmann, R. Wolf, S. Wozniewski
\cmsinstskipInstitute of Nuclear and Particle Physics (INPP), NCSR Demokritos, Aghia Paraskevi, Greece
G. Anagnostou, P. Asenov, G. Daskalakis, T. Geralis, A. Kyriakis, D. Loukas, G. Paspalaki, A. Stakia
\cmsinstskipNational and Kapodistrian University of Athens, Athens, Greece
M. Diamantopoulou, D. Karasavvas, G. Karathanasis, P. Kontaxakis, C.K. Koraka, A. Manousakis-katsikakis, T.J. Mertzimekis, A. Panagiotou, I. Papavergou, N. Saoulidou, K. Theofilatos, K. Vellidis, E. Vourliotis
\cmsinstskipNational Technical University of Athens, Athens, Greece
G. Bakas, K. Kousouris, I. Papakrivopoulos, G. Tsipolitis, A. Zacharopoulou
\cmsinstskipUniversity of Ioánnina, Ioánnina, Greece
X. Aslanoglou, I. Evangelou, C. Foudas, P. Gianneios, P. Katsoulis, P. Kokkas, S. Mallios, K. Manitara, N. Manthos, I. Papadopoulos, J. Strologas
\cmsinstskipMTA-ELTE Lendület CMS Particle and Nuclear Physics Group, Eötvös Loránd University, Budapest, Hungary
M. Bartók\cmsAuthorMark26, R. Chudasama, M. Csanad, M.M.A. Gadallah\cmsAuthorMark27, P. Major, K. Mandal, A. Mehta, G. Pasztor, O. Surányi, G.I. Veres
\cmsinstskipWigner Research Centre for Physics, Budapest, Hungary
G. Bencze, C. Hajdu, D. Horvath\cmsAuthorMark28, F. Sikler, V. Veszpremi, G. Vesztergombi
\cmsinstskipInstitute of Nuclear Research ATOMKI, Debrecen, Hungary
N. Beni, S. Czellar, J. Karancsi\cmsAuthorMark26, J. Molnar, Z. Szillasi, D. Teyssier
\cmsinstskipInstitute of Physics, University of Debrecen, Debrecen, Hungary
P. Raics, Z.L. Trocsanyi, B. Ujvari
\cmsinstskipEszterhazy Karoly University, Karoly Robert Campus, Gyongyos, Hungary
T. Csorgo, S. Lökös\cmsAuthorMark29, F. Nemes, T. Novak
\cmsinstskipIndian Institute of Science (IISc), Bangalore, India
S. Choudhury, J.R. Komaragiri, D. Kumar, L. Panwar, P.C. Tiwari
\cmsinstskipNational Institute of Science Education and Research, HBNI, Bhubaneswar, India
S. Bahinipati\cmsAuthorMark30, D. Dash, C. Kar, P. Mal, T. Mishra, V.K. Muraleedharan Nair Bindhu, A. Nayak\cmsAuthorMark31, D.K. Sahoo\cmsAuthorMark30, N. Sur, S.K. Swain
\cmsinstskipPanjab University, Chandigarh, India
S. Bansal, S.B. Beri, V. Bhatnagar, S. Chauhan, N. Dhingra\cmsAuthorMark32, R. Gupta, A. Kaur, A. Kaur, S. Kaur, P. Kumari, M. Lohan, M. Meena, K. Sandeep, S. Sharma, J.B. Singh, A.K. Virdi
\cmsinstskipUniversity of Delhi, Delhi, India
A. Ahmed, A. Bhardwaj, B.C. Choudhary, R.B. Garg, M. Gola, S. Keshri, A. Kumar, M. Naimuddin, P. Priyanka, K. Ranjan, A. Shah
\cmsinstskipSaha Institute of Nuclear Physics, HBNI, Kolkata, India
M. Bharti\cmsAuthorMark33, R. Bhattacharya, S. Bhattacharya, D. Bhowmik, S. Dutta, S. Ghosh, B. Gomber\cmsAuthorMark34, M. Maity\cmsAuthorMark35, S. Nandan, P. Palit, A. Purohit, P.K. Rout, G. Saha, S. Sarkar, M. Sharan, B. Singh\cmsAuthorMark33, S. Thakur\cmsAuthorMark33
\cmsinstskipIndian Institute of Technology Madras, Madras, India
P.K. Behera, S.C. Behera, P. Kalbhor, A. Muhammad, R. Pradhan, P.R. Pujahari, A. Sharma, A.K. Sikdar
\cmsinstskipBhabha Atomic Research Centre, Mumbai, India
D. Dutta, V. Jha, V. Kumar, D.K. Mishra, K. Naskar\cmsAuthorMark36, P.K. Netrakanti, L.M. Pant, P. Shukla
\cmsinstskipTata Institute of Fundamental Research-A, Mumbai, India
T. Aziz, M.A. Bhat, S. Dugad, R. Kumar Verma, U. Sarkar
\cmsinstskipTata Institute of Fundamental Research-B, Mumbai, India
S. Banerjee, S. Bhattacharya, S. Chatterjee, P. Das, M. Guchait, S. Karmakar, S. Kumar, G. Majumder, K. Mazumdar, S. Mukherjee, D. Roy, N. Sahoo
\cmsinstskipIndian Institute of Science Education and Research (IISER), Pune, India
S. Dube, B. Kansal, A. Kapoor, K. Kothekar, S. Pandey, A. Rane, A. Rastogi, S. Sharma
\cmsinstskipDepartment of Physics, Isfahan University of Technology, Isfahan, Iran
H. Bakhshiansohi\cmsAuthorMark37
\cmsinstskipInstitute for Research in Fundamental Sciences (IPM), Tehran, Iran
S. Chenarani\cmsAuthorMark38, S.M. Etesami, M. Khakzad, M. Mohammadi Najafabadi, M. Naseri
\cmsinstskipUniversity College Dublin, Dublin, Ireland
M. Felcini, M. Grunewald
\cmsinstskipINFN Sezione di Bari a, Università di Bari b, Politecnico di Bari c, Bari, Italy
M. Abbresciaa,b, R. Alya,b,\cmsAuthorMark39, C. Arutaa,b, A. Colaleoa, D. Creanzaa,c, N. De Filippisa,c, M. De Palmaa,b, A. Di Florioa,b, A. Di Pilatoa,b, W. Elmetenaweea,b, L. Fiorea, A. Gelmia,b, M. Gula, G. Iasellia,c, M. Incea,b, S. Lezkia,b, G. Maggia,c, M. Maggia, I. Margjekaa,b, J.A. Merlina, S. Mya,b, S. Nuzzoa,b, A. Pompilia,b, G. Pugliesea,c, A. Ranieria, G. Selvaggia,b, L. Silvestrisa, F.M. Simonea,b, R. Vendittia, P. Verwilligena
\cmsinstskipINFN Sezione di Bologna a, Università di Bologna b, Bologna, Italy
G. Abbiendia, C. Battilanaa,b, D. Bonacorsia,b, L. Borgonovia,b, S. Braibant-Giacomellia,b, R. Campaninia,b, P. Capiluppia,b, A. Castroa,b, F.R. Cavalloa, C. Cioccaa, M. Cuffiania,b, G.M. Dallavallea, T. Diotalevia,b, F. Fabbria, A. Fanfania,b, E. Fontanesia,b, P. Giacomellia, L. Giommia,b, C. Grandia, L. Guiduccia,b, F. Iemmia,b, S. Lo Meoa,\cmsAuthorMark40, S. Marcellinia, G. Masettia, F.L. Navarriaa,b, A. Perrottaa, F. Primaveraa,b, T. Rovellia,b, G.P. Sirolia,b, N. Tosia
\cmsinstskipINFN Sezione di Catania a, Università di Catania b, Catania, Italy
S. Albergoa,b,\cmsAuthorMark41, S. Costaa,b, A. Di Mattiaa, R. Potenzaa,b, A. Tricomia,b,\cmsAuthorMark41, C. Tuvea,b
\cmsinstskipINFN Sezione di Firenze a, Università di Firenze b, Firenze, Italy
G. Barbaglia, A. Cassesea, R. Ceccarellia,b, V. Ciullia,b, C. Civininia, R. D’Alessandroa,b, F. Fioria, E. Focardia,b, G. Latinoa,b, P. Lenzia,b, M. Lizzoa,b, M. Meschinia, S. Paolettia, R. Seiditaa,b, G. Sguazzonia, L. Viliania
\cmsinstskipINFN Laboratori Nazionali di Frascati, Frascati, Italy
L. Benussi, S. Bianco, D. Piccolo
\cmsinstskipINFN Sezione di Genova a, Università di Genova b, Genova, Italy
M. Bozzoa,b, F. Ferroa, R. Mulargiaa,b, E. Robuttia, S. Tosia,b
\cmsinstskipINFN Sezione di Milano-Bicocca a, Università di Milano-Bicocca b, Milano, Italy
A. Benagliaa, A. Beschia,b, F. Brivioa,b, F. Cetorellia,b, V. Cirioloa,b,\cmsAuthorMark20, F. De Guioa,b, M.E. Dinardoa,b, P. Dinia, S. Gennaia, A. Ghezzia,b, P. Govonia,b, L. Guzzia,b, M. Malbertia, S. Malvezzia, D. Menascea, F. Montia,b, L. Moronia, M. Paganonia,b, D. Pedrinia, S. Ragazzia,b, T. Tabarelli de Fatisa,b, D. Valsecchia,b,\cmsAuthorMark20, D. Zuoloa,b
\cmsinstskipINFN Sezione di Napoli a, Università di Napoli ’Federico II’ b, Napoli, Italy, Università della Basilicata c, Potenza, Italy, Università G. Marconi d, Roma, Italy
S. Buontempoa, N. Cavalloa,c, A. De Iorioa,b, F. Fabozzia,c, F. Fiengaa, A.O.M. Iorioa,b, L. Layera,b, L. Listaa,b, S. Meolaa,d,\cmsAuthorMark20, P. Paoluccia,\cmsAuthorMark20, B. Rossia, C. Sciaccaa,b, E. Voevodinaa,b
\cmsinstskipINFN Sezione di Padova a, Università di Padova b, Padova, Italy, Università di Trento c, Trento, Italy
P. Azzia, N. Bacchettaa, D. Biselloa,b, A. Bolettia,b, A. Bragagnoloa,b, R. Carlina,b, P. Checchiaa, P. De Castro Manzanoa, T. Dorigoa, U. Dossellia, F. Gasparinia,b, U. Gasparinia,b, S.Y. Hoha,b, M. Margonia,b, A.T. Meneguzzoa,b, M. Presillab, P. Ronchesea,b, R. Rossina,b, F. Simonettoa,b, G. Strong, A. Tikoa, M. Tosia,b, M. Zanettia,b, P. Zottoa,b, A. Zucchettaa,b, G. Zumerlea,b
\cmsinstskipINFN Sezione di Pavia a, Università di Pavia b, Pavia, Italy
A. Braghieria, S. Calzaferria,b, D. Fiorinaa,b, P. Montagnaa,b, S.P. Rattia,b, V. Rea, M. Ressegottia,b, C. Riccardia,b, P. Salvinia, I. Vaia, P. Vituloa,b
\cmsinstskipINFN Sezione di Perugia a, Università di Perugia b, Perugia, Italy
M. Biasinia,b, G.M. Bileia, D. Ciangottinia,b, L. Fanòa,b, P. Laricciaa,b, G. Mantovania,b, V. Mariania,b, M. Menichellia, F. Moscatellia, A. Rossia,b, A. Santocchiaa,b, D. Spigaa, T. Tedeschia,b
\cmsinstskipINFN Sezione di Pisa a, Università di Pisa b, Scuola Normale Superiore di Pisa c, Pisa, Italy
K. Androsova, P. Azzurria, G. Bagliesia, V. Bertacchia,c, L. Bianchinia, T. Boccalia, R. Castaldia, M.A. Cioccia,b, R. Dell’Orsoa, M.R. Di Domenicoa,b, S. Donatoa, L. Gianninia,c, A. Giassia, M.T. Grippoa, F. Ligabuea,c, E. Mancaa,c, G. Mandorlia,c, A. Messineoa,b, F. Pallaa, G. Ramirez-Sancheza,c, A. Rizzia,b, G. Rolandia,c, S. Roy Chowdhurya,c, A. Scribanoa, N. Shafieia,b, P. Spagnoloa, R. Tenchinia, G. Tonellia,b, N. Turinia, A. Venturia, P.G. Verdinia
\cmsinstskipINFN Sezione di Roma a, Sapienza Università di Roma b, Rome, Italy
F. Cavallaria, M. Cipriania,b, D. Del Rea,b, E. Di Marcoa, M. Diemoza, E. Longoa,b, P. Meridiania, G. Organtinia,b, F. Pandolfia, R. Paramattia,b, C. Quarantaa,b, S. Rahatloua,b, C. Rovellia, F. Santanastasioa,b, L. Soffia,b, R. Tramontanoa,b
\cmsinstskipINFN Sezione di Torino a, Università di Torino b, Torino, Italy, Università del Piemonte Orientale c, Novara, Italy
N. Amapanea,b, R. Arcidiaconoa,c, S. Argiroa,b, M. Arneodoa,c, N. Bartosika, R. Bellana,b, A. Belloraa,b, C. Biinoa, A. Cappatia,b, N. Cartigliaa, S. Comettia, M. Costaa,b, R. Covarellia,b, N. Demariaa, B. Kiania,b, F. Leggera, C. Mariottia, S. Masellia, E. Migliorea,b, V. Monacoa,b, E. Monteila,b, M. Montenoa, M.M. Obertinoa,b, G. Ortonaa, L. Pachera,b, N. Pastronea, M. Pelliccionia, G.L. Pinna Angionia,b, M. Ruspaa,c, R. Salvaticoa,b, F. Sivieroa,b, V. Solaa, A. Solanoa,b, D. Soldia,b, A. Staianoa, D. Trocinoa,b
\cmsinstskipINFN Sezione di Trieste a, Università di Trieste b, Trieste, Italy
S. Belfortea, V. Candelisea,b, M. Casarsaa, F. Cossuttia, A. Da Rolda,b, G. Della Riccaa,b, F. Vazzolera,b
\cmsinstskipKyungpook National University, Daegu, Korea
S. Dogra, C. Huh, B. Kim, D.H. Kim, G.N. Kim, J. Lee, S.W. Lee, C.S. Moon, Y.D. Oh, S.I. Pak, S. Sekmen, Y.C. Yang
\cmsinstskipChonnam National University, Institute for Universe and Elementary Particles, Kwangju, Korea
H. Kim, D.H. Moon
\cmsinstskipHanyang University, Seoul, Korea
B. Francois, T.J. Kim, J. Park
\cmsinstskipKorea University, Seoul, Korea
S. Cho, S. Choi, Y. Go, S. Ha, B. Hong, K. Lee, K.S. Lee, J. Lim, J. Park, S.K. Park, J. Yoo
\cmsinstskipKyung Hee University, Department of Physics, Seoul, Republic of Korea
J. Goh, A. Gurtu
\cmsinstskipSejong University, Seoul, Korea
H.S. Kim, Y. Kim
\cmsinstskipSeoul National University, Seoul, Korea
J. Almond, J.H. Bhyun, J. Choi, S. Jeon, J. Kim, J.S. Kim, S. Ko, H. Kwon, H. Lee, K. Lee, S. Lee, K. Nam, B.H. Oh, M. Oh, S.B. Oh, B.C. Radburn-Smith, H. Seo, U.K. Yang, I. Yoon
\cmsinstskipUniversity of Seoul, Seoul, Korea
D. Jeon, J.H. Kim, B. Ko, J.S.H. Lee, I.C. Park, Y. Roh, I.J. Watson
\cmsinstskipYonsei University, Department of Physics, Seoul, Korea
H.D. Yoo
\cmsinstskipSungkyunkwan University, Suwon, Korea
Y. Choi, C. Hwang, Y. Jeong, H. Lee, J. Lee, Y. Lee, I. Yu
\cmsinstskipCollege of Engineering and Technology, American University of the Middle East (AUM), Kuwait
Y. Maghrbi
\cmsinstskipRiga Technical University, Riga, Latvia
V. Veckalns\cmsAuthorMark42
\cmsinstskipVilnius University, Vilnius, Lithuania
A. Juodagalvis, A. Rinkevicius, G. Tamulaitis
\cmsinstskipNational Centre for Particle Physics, Universiti Malaya, Kuala Lumpur, Malaysia
W.A.T. Wan Abdullah, M.N. Yusli, Z. Zolkapli
\cmsinstskipUniversidad de Sonora (UNISON), Hermosillo, Mexico
J.F. Benitez, A. Castaneda Hernandez, J.A. Murillo Quijada, L. Valencia Palomo
\cmsinstskipCentro de Investigacion y de Estudios Avanzados del IPN, Mexico City, Mexico
H. Castilla-Valdez, E. De La Cruz-Burelo, I. Heredia-De La Cruz\cmsAuthorMark43, R. Lopez-Fernandez, A. Sanchez-Hernandez
\cmsinstskipUniversidad Iberoamericana, Mexico City, Mexico
S. Carrillo Moreno, C. Oropeza Barrera, M. Ramirez-Garcia, F. Vazquez Valencia
\cmsinstskipBenemerita Universidad Autonoma de Puebla, Puebla, Mexico
J. Eysermans, I. Pedraza, H.A. Salazar Ibarguen, C. Uribe Estrada
\cmsinstskipUniversidad Autónoma de San Luis Potosí, San Luis Potosí, Mexico
A. Morelos Pineda
\cmsinstskipUniversity of Montenegro, Podgorica, Montenegro
J. Mijuskovic\cmsAuthorMark4, N. Raicevic
\cmsinstskipUniversity of Auckland, Auckland, New Zealand
D. Krofcheck
\cmsinstskipUniversity of Canterbury, Christchurch, New Zealand
S. Bheesette, P.H. Butler
\cmsinstskipNational Centre for Physics, Quaid-I-Azam University, Islamabad, Pakistan
A. Ahmad, M.I. Asghar, M.I.M. Awan, Q. Hassan, H.R. Hoorani, W.A. Khan, M.A. Shah, M. Shoaib, M. Waqas
\cmsinstskipJan Kochanowski University, Kielce, Poland
M. Rybczyński, Z. Włodarczyk
\cmsinstskipAGH University of Science and Technology Faculty of Computer Science, Electronics and Telecommunications, Krakow, Poland
V. Avati, L. Grzanka, M. Malawski
\cmsinstskipHenryk Niewodniczański Institute of Nuclear Physics Polish Academy of Sciences, Krakow, Poland
J. Błocki, A. Cyz, E. Gładysz-Dziaduś, P. Żychowski
\cmsinstskipNational Centre for Nuclear Research, Swierk, Poland
H. Bialkowska, M. Bluj, B. Boimska, T. Frueboes, M. Górski, M. Kazana, M. Szleper, P. Traczyk, P. Zalewski
\cmsinstskipInstitute of Experimental Physics, Faculty of Physics, University of Warsaw, Warsaw, Poland
K. Bunkowski, A. Byszuk\cmsAuthorMark44, K. Doroba, A. Kalinowski, M. Konecki, J. Krolikowski, M. Olszewski, M. Walczak
\cmsinstskipLaboratório de Instrumentação e Física Experimental de Partículas, Lisboa, Portugal
M. Araujo, P. Bargassa, D. Bastos, A. Di Francesco, P. Faccioli, B. Galinhas, M. Gallinaro, J. Hollar, N. Leonardo, T. Niknejad, J. Seixas, K. Shchelina, O. Toldaiev, J. Varela
\cmsinstskipJoint Institute for Nuclear Research, Dubna, Russia
S. Afanasiev, P. Bunin, Y. Ershov, M. Gavrilenko, I. Golutvin, I. Gorbunov,A. Kamenev, V. Karjavine, A. Lanev, A. Malakhov, V. Matveev\cmsAuthorMark45,\cmsAuthorMark46, P. Moisenz, V. Palichik, V. Perelygin, M. Savina, D. Seitova, V. Shalaev, S. Shmatov, S. Shulha, V. Smirnov, O. Teryaev, N. Voytishin, A. Zarubin, I. Zhizhin
\cmsinstskipPetersburg Nuclear Physics Institute, Gatchina (St. Petersburg), Russia
G. Gavrilov, V. Golovtcov, Y. Ivanov, V. Kim\cmsAuthorMark47, E. Kuznetsova\cmsAuthorMark48, V. Murzin, V. Oreshkin, I. Smirnov, D. Sosnov, V. Sulimov, L. Uvarov, S. Volkov, A. Vorobyev
\cmsinstskipInstitute for Nuclear Research, Moscow, Russia
Yu. Andreev, A. Dermenev, F. Guber, S. Gninenko, N. Golubev, A. Karneyeu, M. Kirsanov, N. Krasnikov, A.B. Kurepin, A.I. Maevskaya, A. Pashenkov, G. Pivovarov, D. Tlisov, A. Toropin
\cmsinstskipInstitute for Theoretical and Experimental Physics named by A.I. Alikhanov of NRC ‘Kurchatov Institute’, Moscow, Russia
V. Epshteyn, S.N. Filippov, V. Gavrilov, N. Lychkovskaya, A. Nikitenko\cmsAuthorMark49, V. Popov, I. Pozdnyakov, G. Safronov, A. Spiridonov, A. Stepennov, M. Toms, E. Vlasov, A. Zhokin
\cmsinstskipMoscow Institute of Physics and Technology, Moscow, Russia
T. Aushev
\cmsinstskipNational Research Nuclear University ’Moscow Engineering Physics Institute’ (MEPhI), Moscow, Russia
O. Bychkova, M. Chadeeva\cmsAuthorMark50, D. Philippov, E. Popova, V. Rusinov
\cmsinstskipP.N. Lebedev Physical Institute, Moscow, Russia
V. Andreev, M. Azarkin, I. Dremin, M. Kirakosyan, A. Terkulov
\cmsinstskipSkobeltsyn Institute of Nuclear Physics, Lomonosov Moscow State University, Moscow, Russia
A. Belyaev, G. Bogdanova, E. Boos, M. Dubinin\cmsAuthorMark51, L. Dudko, A. Ershov, A. Gribushin, L. Khein, V. Klyukhin, O. Kodolova, I. Lokhtin, O. Lukina, S. Obraztsov, S. Petrushanko, V. Savrin, A. Snigirev, P. Volkov, V. Volkov
\cmsinstskipNovosibirsk State University (NSU), Novosibirsk, Russia
V. Blinov\cmsAuthorMark52, T. Dimova\cmsAuthorMark52, L. Kardapoltsev\cmsAuthorMark52, I. Ovtin\cmsAuthorMark52, Y. Skovpen\cmsAuthorMark52
\cmsinstskipInstitute for High Energy Physics of National Research Centre ‘Kurchatov Institute’, Protvino, Russia
I. Azhgirey, I. Bayshev, V. Kachanov, A. Kalinin, Y. Kharlov, D. Konstantinov, V. Petrov, R. Ryutin, S.A. Sadovsky, A. Sobol, S. Troshin, N. Tyurin, A. Uzunian, A. Volkov
\cmsinstskipNational Research Tomsk Polytechnic University, Tomsk, Russia
A. Babaev, A. Iuzhakov, V. Okhotnikov, L. Sukhikh
\cmsinstskipTomsk State University, Tomsk, Russia
V. Borchsh, V. Ivanchenko, E. Tcherniaev
\cmsinstskipUniversity of Belgrade: Faculty of Physics and VINCA Institute of Nuclear Sciences, Belgrade, Serbia
P. Adzic\cmsAuthorMark53, P. Cirkovic, M. Dordevic, P. Milenovic, J. Milosevic, M. Stojanovic
\cmsinstskipCentro de Investigaciones Energéticas Medioambientales y Tecnológicas (CIEMAT), Madrid, Spain
M. Aguilar-Benitez, J. Alcaraz Maestre, A. Álvarez Fernández, I. Bachiller, M. Barrio Luna, Cristina F. Bedoya, J.A. Brochero Cifuentes, C.A. Carrillo Montoya, M. Cepeda, M. Cerrada, N. Colino, B. De La Cruz, A. Delgado Peris, J.P. Fernández Ramos, J. Flix, M.C. Fouz, O. Gonzalez Lopez, S. Goy Lopez, J.M. Hernandez, M.I. Josa, D. Moran, Á. Navarro Tobar, A. Pérez-Calero Yzquierdo, J. Puerta Pelayo, I. Redondo, L. Romero, S. Sánchez Navas, M.S. Soares, A. Triossi, C. Willmott
\cmsinstskipUniversidad Autónoma de Madrid, Madrid, Spain
C. Albajar, J.F. de Trocóniz, R. Reyes-Almanza
\cmsinstskipUniversidad de Oviedo, Instituto Universitario de Ciencias y Tecnologías Espaciales de Asturias (ICTEA), Oviedo, Spain
B. Alvarez Gonzalez, J. Cuevas, C. Erice, J. Fernandez Menendez, S. Folgueras, I. Gonzalez Caballero, E. Palencia Cortezon, C. Ramón Álvarez, V. Rodríguez Bouza, S. Sanchez Cruz
\cmsinstskipInstituto de Física de Cantabria (IFCA), CSIC-Universidad de Cantabria, Santander, Spain
I.J. Cabrillo, A. Calderon, B. Chazin Quero, J. Duarte Campderros, M. Fernandez, P.J. Fernández Manteca, A. García Alonso, G. Gomez, C. Martinez Rivero, P. Martinez Ruiz del Arbol, F. Matorras, J. Piedra Gomez, C. Prieels, F. Ricci-Tam, T. Rodrigo, A. Ruiz-Jimeno, L. Russo\cmsAuthorMark54, L. Scodellaro, I. Vila, J.M. Vizan Garcia
\cmsinstskipUniversity of Colombo, Colombo, Sri Lanka
MK Jayananda, B. Kailasapathy\cmsAuthorMark55, D.U.J. Sonnadara, DDC Wickramarathna
\cmsinstskipUniversity of Ruhuna, Department of Physics, Matara, Sri Lanka
W.G.D. Dharmaratna, K. Liyanage, N. Perera, N. Wickramage
\cmsinstskipCERN, European Organization for Nuclear Research, Geneva, Switzerland
T.K. Aarrestad, D. Abbaneo, B. Akgun, E. Auffray, G. Auzinger, J. Baechler, P. Baillon, A.H. Ball, D. Barney, J. Bendavid, M. Bianco, A. Bocci, P. Bortignon, E. Bossini, E. Brondolin, T. Camporesi, G. Cerminara, L. Cristella, D. d’Enterria, A. Dabrowski, N. Daci, V. Daponte, A. David, A. De Roeck, M. Deile, R. Di Maria, M. Dobson, M. Dünser, N. Dupont, A. Elliott-Peisert, N. Emriskova, F. Fallavollita\cmsAuthorMark56, D. Fasanella, S. Fiorendi, G. Franzoni, J. Fulcher, W. Funk, S. Giani, D. Gigi, K. Gill, F. Glege, L. Gouskos, M. Gruchala, M. Guilbaud, D. Gulhan, J. Hegeman, Y. Iiyama, V. Innocente, T. James, P. Janot, J. Kaspar, J. Kieseler, M. Komm, N. Kratochwil, C. Lange, P. Lecoq, K. Long, C. Lourenço, L. Malgeri, M. Mannelli, A. Massironi, F. Meijers, S. Mersi, E. Meschi, F. Moortgat, M. Mulders, J. Ngadiuba, J. Niedziela, S. Orfanelli, L. Orsini, F. Pantaleo\cmsAuthorMark20, L. Pape, E. Perez, M. Peruzzi, A. Petrilli, G. Petrucciani, A. Pfeiffer, M. Pierini, D. Rabady, A. Racz, M. Rieger, M. Rovere, H. Sakulin, J. Salfeld-Nebgen, S. Scarfi, C. Schäfer, C. Schwick, M. Selvaggi, A. Sharma, P. Silva, W. Snoeys, P. Sphicas\cmsAuthorMark57, J. Steggemann, S. Summers, V.R. Tavolaro, D. Treille, A. Tsirou, G.P. Van Onsem, A. Vartak, M. Verzetti, K.A. Wozniak, W.D. Zeuner
\cmsinstskipPaul Scherrer Institut, Villigen, Switzerland
L. Caminada\cmsAuthorMark58, W. Erdmann, R. Horisberger, Q. Ingram, H.C. Kaestli, D. Kotlinski, U. Langenegger, T. Rohe
\cmsinstskipETH Zurich - Institute for Particle Physics and Astrophysics (IPA), Zurich, Switzerland
M. Backhaus, P. Berger, A. Calandri, N. Chernyavskaya, G. Dissertori, M. Dittmar, M. Donegà, C. Dorfer, T. Gadek, T.A. Gómez Espinosa, C. Grab, D. Hits, W. Lustermann, A.-M. Lyon, R.A. Manzoni, M.T. Meinhard, F. Micheli, P. Musella, F. Nessi-Tedaldi, F. Pauss, V. Perovic, G. Perrin, L. Perrozzi, S. Pigazzini, M.G. Ratti, M. Reichmann, C. Reissel, T. Reitenspiess, B. Ristic, D. Ruini, D.A. Sanz Becerra, M. Schönenberger, L. Shchutska, V. Stampf, M.L. Vesterbacka Olsson, R. Wallny, D.H. Zhu
\cmsinstskipUniversität Zürich, Zurich, Switzerland
C. Amsler\cmsAuthorMark59, C. Botta, D. Brzhechko, M.F. Canelli, A. De Cosa, R. Del Burgo, J.K. Heikkilä, M. Huwiler, A. Jofrehei, B. Kilminster, S. Leontsinis, A. Macchiolo, P. Meiring, V.M. Mikuni, U. Molinatti, I. Neutelings, G. Rauco, A. Reimers, P. Robmann, K. Schweiger, Y. Takahashi, S. Wertz
\cmsinstskipNational Central University, Chung-Li, Taiwan
C. Adloff\cmsAuthorMark60, C.M. Kuo, W. Lin, A. Roy, T. Sarkar\cmsAuthorMark35, S.S. Yu
\cmsinstskipNational Taiwan University (NTU), Taipei, Taiwan
L. Ceard, P. Chang, Y. Chao, K.F. Chen, P.H. Chen, W.-S. Hou, Y.y. Li, R.-S. Lu, E. Paganis, A. Psallidas, A. Steen, E. Yazgan
\cmsinstskipChulalongkorn University, Faculty of Science, Department of Physics, Bangkok, Thailand
B. Asavapibhop, C. Asawatangtrakuldee, N. Srimanobhas
\cmsinstskipÇukurova University, Physics Department, Science and Art Faculty, Adana, Turkey
D. Agyel, S. Anagul, M.N. Bakirci\cmsAuthorMark61, F. Bilican, F. Boran, A. Celik\cmsAuthorMark62, S. Damarseckin\cmsAuthorMark63, Z.S. Demiroglu, F. Dolek, C. Dozen\cmsAuthorMark64, I. Dumanoglu\cmsAuthorMark65, E. Eskut, G. Gokbulut, Y. Guler, E. Gurpinar Guler\cmsAuthorMark66, I. Hos\cmsAuthorMark67, C. Isik, E.E. Kangal\cmsAuthorMark68, O. Kara, A. Kayis Topaksu, U. Kiminsu, G. Onengut, K. Ozdemir\cmsAuthorMark69, E. Pinar, A. Polatoz, A.E. Simsek, Ü. Sözbilir, B. Tali\cmsAuthorMark70, U.G. Tok, H. Topakli\cmsAuthorMark71, S. Turkcapar, E. Uslan, I.S. Zorbakir, C. Zorbilmez
\cmsinstskipMiddle East Technical University, Physics Department, Ankara, Turkey
B. Isildak\cmsAuthorMark72, G. Karapinar\cmsAuthorMark73, K. Ocalan\cmsAuthorMark74, M. Yalvac\cmsAuthorMark75
\cmsinstskipBogazici University, Istanbul, Turkey
I.O. Atakisi, E. Gülmez, M. Kaya\cmsAuthorMark76, O. Kaya\cmsAuthorMark77, Ö. Özçelik, S. Tekten\cmsAuthorMark78, E.A. Yetkin\cmsAuthorMark79
\cmsinstskipIstanbul Technical University, Istanbul, Turkey
A. Cakir, K. Cankocak\cmsAuthorMark65, Y. Komurcu, S. Sen\cmsAuthorMark80
\cmsinstskipIstanbul University, Istanbul, Turkey
F. Aydogmus Sen, S. Cerci\cmsAuthorMark70, B. Kaynak, S. Ozkorucuklu, D. Sunar Cerci\cmsAuthorMark70
\cmsinstskipInstitute for Scintillation Materials of National Academy of Science of Ukraine, Kharkov, Ukraine
B. Grynyov
\cmsinstskipNational Scientific Center, Kharkov Institute of Physics and Technology, Kharkov, Ukraine
L. Levchuk
\cmsinstskipUniversity of Bristol, Bristol, United Kingdom
E. Bhal, S. Bologna, J.J. Brooke, D. Burns\cmsAuthorMark81, E. Clement, D. Cussans, H. Flacher, J. Goldstein, G.P. Heath, H.F. Heath, L. Kreczko, B. Krikler, S. Paramesvaran, T. Sakuma, S. Seif El Nasr-Storey, V.J. Smith, J. Taylor, A. Titterton
\cmsinstskipRutherford Appleton Laboratory, Didcot, United Kingdom
K.W. Bell, A. Belyaev\cmsAuthorMark82, C. Brew, R.M. Brown, D.J.A. Cockerill, K.V. Ellis, K. Harder, S. Harper, J. Linacre, K. Manolopoulos, D.M. Newbold, E. Olaiya, D. Petyt, T. Reis, T. Schuh, C.H. Shepherd-Themistocleous, A. Thea, I.R. Tomalin, T. Williams
\cmsinstskipImperial College, London, United Kingdom
R. Bainbridge, P. Bloch, S. Bonomally, J. Borg, S. Breeze, O. Buchmuller, A. Bundock, V. Cepaitis, G.S. Chahal\cmsAuthorMark83, D. Colling, P. Dauncey, G. Davies, M. Della Negra, P. Everaerts, G. Fedi, G. Hall, G. Iles, J. Langford, L. Lyons, A.-M. Magnan, S. Malik, A. Martelli, V. Milosevic, J. Nash\cmsAuthorMark84, V. Palladino, M. Pesaresi, D.M. Raymond, A. Richards, A. Rose, E. Scott, C. Seez, A. Shtipliyski, M. Stoye, A. Tapper, K. Uchida, T. Virdee\cmsAuthorMark20, N. Wardle, S.N. Webb, D. Winterbottom, A.G. Zecchinelli, S.C. Zenz
\cmsinstskipBrunel University, Uxbridge, United Kingdom
J.E. Cole, P.R. Hobson, A. Khan, P. Kyberd, C.K. Mackay, I.D. Reid, L. Teodorescu, S. Zahid
\cmsinstskipBaylor University, Waco, USA
A. Brinkerhoff, K. Call, B. Caraway, J. Dittmann, K. Hatakeyama, A.R. Kanuganti, C. Madrid, B. McMaster, N. Pastika, C. Smith
\cmsinstskipCatholic University of America, Washington, DC, USA
R. Bartek, A. Dominguez, R. Uniyal, A.M. Vargas Hernandez
\cmsinstskipThe University of Alabama, Tuscaloosa, USA
A. Buccilli, O. Charaf, S.I. Cooper, S.V. Gleyzer, C. Henderson, P. Rumerio, C. West
\cmsinstskipBoston University, Boston, USA
A. Akpinar, A. Albert, D. Arcaro, C. Cosby, Z. Demiragli, D. Gastler, C. Richardson, J. Rohlf, K. Salyer, D. Sperka, D. Spitzbart, I. Suarez, S. Yuan, D. Zou
\cmsinstskipBrown University, Providence, USA
G. Benelli, B. Burkle, X. Coubez\cmsAuthorMark21, D. Cutts, Y.t. Duh, M. Hadley, U. Heintz, J.M. Hogan\cmsAuthorMark85, K.H.M. Kwok, E. Laird, G. Landsberg, K.T. Lau, J. Lee, M. Narain, S. Sagir\cmsAuthorMark86, R. Syarif, E. Usai, W.Y. Wong, D. Yu, W. Zhang
\cmsinstskipUniversity of California, Davis, Davis, USA
R. Band, C. Brainerd, R. Breedon, M. Calderon De La Barca Sanchez, M. Chertok, J. Conway, R. Conway, P.T. Cox, R. Erbacher, C. Flores, G. Funk, F. Jensen, W. Ko, O. Kukral, R. Lander, M. Mulhearn, D. Pellett, J. Pilot, M. Shi, D. Taylor, K. Tos, M. Tripathi, Y. Yao, F. Zhang
\cmsinstskipUniversity of California, Los Angeles, USA
M. Bachtis, C. Bravo, R. Cousins, A. Dasgupta, A. Florent, D. Hamilton, J. Hauser, M. Ignatenko, T. Lam, N. Mccoll, W.A. Nash, S. Regnard, D. Saltzberg, C. Schnaible, B. Stone, V. Valuev
\cmsinstskipUniversity of California, Riverside, Riverside, USA
K. Burt, Y. Chen, R. Clare, J.W. Gary, S.M.A. Ghiasi Shirazi, G. Hanson, G. Karapostoli, O.R. Long, N. Manganelli, M. Olmedo Negrete, M.I. Paneva, W. Si, S. Wimpenny, Y. Zhang
\cmsinstskipUniversity of California, San Diego, La Jolla, USA
J.G. Branson, P. Chang, S. Cittolin, S. Cooperstein, N. Deelen, M. Derdzinski, J. Duarte, R. Gerosa, D. Gilbert, B. Hashemi, D. Klein, V. Krutelyov, J. Letts, M. Masciovecchio, S. May, S. Padhi, M. Pieri, V. Sharma, M. Tadel, F. Würthwein, A. Yagil
\cmsinstskipUniversity of California, Santa Barbara - Department of Physics, Santa Barbara, USA
N. Amin, R. Bhandari, C. Campagnari, M. Citron, A. Dorsett, V. Dutta, J. Incandela, B. Marsh, H. Mei, A. Ovcharova, H. Qu, M. Quinnan, J. Richman, U. Sarica, D. Stuart, S. Wang
\cmsinstskipCalifornia Institute of Technology, Pasadena, USA
D. Anderson, A. Bornheim, O. Cerri, I. Dutta, J.M. Lawhorn, N. Lu, J. Mao, H.B. Newman, T.Q. Nguyen, J. Pata, M. Spiropulu, J.R. Vlimant, S. Xie, Z. Zhang, R.Y. Zhu
\cmsinstskipCarnegie Mellon University, Pittsburgh, USA
J. Alison, M.B. Andrews, T. Ferguson, T. Mudholkar, M. Paulini, M. Sun, I. Vorobiev, M. Weinberg
\cmsinstskipUniversity of Colorado Boulder, Boulder, USA
J.P. Cumalat, W.T. Ford, E. MacDonald, T. Mulholland, R. Patel, A. Perloff, K. Stenson, K.A. Ulmer, S.R. Wagner
\cmsinstskipCornell University, Ithaca, USA
J. Alexander, Y. Cheng, J. Chu, D.J. Cranshaw, A. Datta, A. Frankenthal, K. Mcdermott, J. Monroy, J.R. Patterson, D. Quach, A. Ryd, W. Sun, S.M. Tan, Z. Tao, J. Thom, P. Wittich, M. Zientek
\cmsinstskipFermi National Accelerator Laboratory, Batavia, USA
S. Abdullin, M. Albrow, M. Alyari, G. Apollinari, A. Apresyan, A. Apyan, S. Banerjee, L.A.T. Bauerdick, A. Beretvas, D. Berry, J. Berryhill, P.C. Bhat, K. Burkett, J.N. Butler, A. Canepa, G.B. Cerati, H.W.K. Cheung, F. Chlebana, M. Cremonesi, V.D. Elvira, J. Freeman, Z. Gecse, E. Gottschalk, L. Gray, D. Green, S. Grünendahl, O. Gutsche, R.M. Harris, S. Hasegawa, R. Heller, T.C. Herwig, J. Hirschauer, B. Jayatilaka, S. Jindariani, M. Johnson, U. Joshi, T. Klijnsma, B. Klima, M.J. Kortelainen, S. Lammel, J. Lewis, D. Lincoln, R. Lipton, M. Liu, T. Liu, J. Lykken, K. Maeshima, D. Mason, P. McBride, P. Merkel, S. Mrenna, S. Nahn, V. O’Dell, V. Papadimitriou, K. Pedro, C. Pena\cmsAuthorMark51, O. Prokofyev, F. Ravera, A. Reinsvold Hall, L. Ristori, B. Schneider, E. Sexton-Kennedy, N. Smith, A. Soha, W.J. Spalding, L. Spiegel, S. Stoynev, J. Strait, L. Taylor, S. Tkaczyk, N.V. Tran, L. Uplegger, E.W. Vaandering, M. Wang, H.A. Weber, A. Woodard
\cmsinstskipUniversity of Florida, Gainesville, USA
D. Acosta, P. Avery, D. Bourilkov, L. Cadamuro, V. Cherepanov, F. Errico, R.D. Field, D. Guerrero, B.M. Joshi, M. Kim, J. Konigsberg, A. Korytov, K.H. Lo, K. Matchev, N. Menendez, G. Mitselmakher, D. Rosenzweig, K. Shi, J. Wang, S. Wang, X. Zuo
\cmsinstskipFlorida International University, Miami, USA
Y.R. Joshi
\cmsinstskipFlorida State University, Tallahassee, USA
T. Adams, A. Askew, D. Diaz, R. Habibullah, S. Hagopian, V. Hagopian, K.F. Johnson, R. Khurana, T. Kolberg, G. Martinez, H. Prosper, C. Schiber, R. Yohay, J. Zhang
\cmsinstskipFlorida Institute of Technology, Melbourne, USA
M.M. Baarmand, S. Butalla, T. Elkafrawy\cmsAuthorMark15, M. Hohlmann, D. Noonan, M. Rahmani, M. Saunders, F. Yumiceva
\cmsinstskipUniversity of Illinois at Chicago (UIC), Chicago, USA
M.R. Adams, L. Apanasevich, H. Becerril Gonzalez, R. Cavanaugh, X. Chen, S. Dittmer, O. Evdokimov, C.E. Gerber, D.A. Hangal, D.J. Hofman, C. Mills, G. Oh, T. Roy, M.B. Tonjes, N. Varelas, J. Viinikainen, H. Wang, X. Wang, Z. Wu
\cmsinstskipThe University of Iowa, Iowa City, USA
M. Alhusseini, B. Bilki\cmsAuthorMark66, P. Debbins, K. Dilsiz\cmsAuthorMark87, S. Durgut, R.P. Gandrajula, M. Haytmyradov, V. Khristenko, O.K. Köseyan, J.-P. Merlo, A. Mestvirishvili\cmsAuthorMark88, A. Moeller, J. Nachtman, H. Ogul\cmsAuthorMark89, Y. Onel, F. Ozok\cmsAuthorMark90, A. Penzo, I. Schmidt, C. Snyder, E. Tiras, J. Wetzel, K. Yi\cmsAuthorMark91
\cmsinstskipJohns Hopkins University, Baltimore, USA
O. Amram, B. Blumenfeld, L. Corcodilos, M. Eminizer, A.V. Gritsan, S. Kyriacou, P. Maksimovic, C. Mantilla, J. Roskes, M. Swartz, T.Á. Vámi
\cmsinstskipThe University of Kansas, Lawrence, USA
A. Al-bataineh, C. Baldenegro Barrera, P. Baringer, A. Bean, J. Bowen, A. Bylinkin, T. Isidori, S. Khalil, J. King, G. Krintiras, A. Kropivnitskaya, C. Lindsey, N. Minafra, M. Murray, C. Rogan, C. Royon, S. Sanders, E. Schmitz, J.D. Tapia Takaki, Q. Wang, J. Williams, G. Wilson
\cmsinstskipKansas State University, Manhattan, USA
S. Duric, A. Ivanov, K. Kaadze, D. Kim, Y. Maravin, D.R. Mendis, T. Mitchell, A. Modak, A. Mohammadi
\cmsinstskipLawrence Livermore National Laboratory, Livermore, USA
F. Rebassoo, D. Wright
\cmsinstskipUniversity of Maryland, College Park, USA
E. Adams, A. Baden, O. Baron, A. Belloni, S.C. Eno, Y. Feng, N.J. Hadley, S. Jabeen, G.Y. Jeng, R.G. Kellogg, T. Koeth, A.C. Mignerey, S. Nabili, M. Seidel, A. Skuja, S.C. Tonwar, L. Wang, K. Wong
\cmsinstskipMassachusetts Institute of Technology, Cambridge, USA
D. Abercrombie, B. Allen, R. Bi, S. Brandt, W. Busza, I.A. Cali, Y. Chen, M. D’Alfonso, G. Gomez Ceballos, M. Goncharov, P. Harris, D. Hsu, M. Hu, M. Klute, D. Kovalskyi, J. Krupa, Y.-J. Lee, P.D. Luckey, B. Maier, A.C. Marini, C. Mcginn, C. Mironov, S. Narayanan, X. Niu, C. Paus, D. Rankin, C. Roland, G. Roland, Z. Shi, G.S.F. Stephans, K. Sumorok, K. Tatar, D. Velicanu, J. Wang, T.W. Wang, Z. Wang, B. Wyslouch
\cmsinstskipUniversity of Minnesota, Minneapolis, USA
R.M. Chatterjee, A. Evans, S. Guts, P. Hansen, J. Hiltbrand, Sh. Jain, M. Krohn, Y. Kubota, Z. Lesko, J. Mans, M. Revering, R. Rusack, R. Saradhy, N. Schroeder, N. Strobbe, M.A. Wadud
\cmsinstskipUniversity of Mississippi, Oxford, USA
J.G. Acosta, S. Oliveros
\cmsinstskipUniversity of Nebraska-Lincoln, Lincoln, USA
K. Bloom, S. Chauhan, D.R. Claes, C. Fangmeier, L. Finco, F. Golf, J.R. González Fernández, I. Kravchenko, J.E. Siado, G.R. Snow, B. Stieger, W. Tabb
\cmsinstskipState University of New York at Buffalo, Buffalo, USA
G. Agarwal, C. Harrington, L. Hay, I. Iashvili, A. Kharchilava, C. McLean, D. Nguyen, A. Parker, J. Pekkanen, S. Rappoccio, B. Roozbahani
\cmsinstskipNortheastern University, Boston, USA
G. Alverson, E. Barberis, C. Freer, Y. Haddad, A. Hortiangtham, G. Madigan, B. Marzocchi, D.M. Morse, V. Nguyen, T. Orimoto, L. Skinnari, A. Tishelman-Charny, T. Wamorkar, B. Wang, A. Wisecarver, D. Wood
\cmsinstskipNorthwestern University, Evanston, USA
S. Bhattacharya, J. Bueghly, Z. Chen, A. Gilbert, T. Gunter, K.A. Hahn, N. Odell, M.H. Schmitt, K. Sung, M. Velasco
\cmsinstskipUniversity of Notre Dame, Notre Dame, USA
R. Bucci, N. Dev, R. Goldouzian, M. Hildreth, K. Hurtado Anampa, C. Jessop, D.J. Karmgard, K. Lannon, W. Li, N. Loukas, N. Marinelli, I. Mcalister, T. McCauley, F. Meng, K. Mohrman, Y. Musienko\cmsAuthorMark45, R. Ruchti, P. Siddireddy, S. Taroni, M. Wayne, A. Wightman, M. Wolf, L. Zygala
\cmsinstskipThe Ohio State University, Columbus, USA
J. Alimena, B. Bylsma, B. Cardwell, L.S. Durkin, B. Francis, C. Hill, W. Ji, A. Lefeld, B.L. Winer, B.R. Yates
\cmsinstskipPrinceton University, Princeton, USA
G. Dezoort, P. Elmer, B. Greenberg, N. Haubrich, S. Higginbotham, A. Kalogeropoulos, G. Kopp, S. Kwan, D. Lange, M.T. Lucchini, J. Luo, D. Marlow, K. Mei, I. Ojalvo, J. Olsen, C. Palmer, P. Piroué, D. Stickland, C. Tully
\cmsinstskipUniversity of Puerto Rico, Mayaguez, USA
S. Malik, S. Norberg
\cmsinstskipPurdue University, West Lafayette, USA
V.E. Barnes, R. Chawla, S. Das, L. Gutay, M. Jones, A.W. Jung, B. Mahakud, G. Negro, N. Neumeister, C.C. Peng, S. Piperov, H. Qiu, J.F. Schulte, N. Trevisani, F. Wang, R. Xiao, W. Xie
\cmsinstskipPurdue University Northwest, Hammond, USA
T. Cheng, J. Dolen, N. Parashar
\cmsinstskipRice University, Houston, USA
A. Baty, U. Behrens, S. Dildick, K.M. Ecklund, S. Freed, F.J.M. Geurts, M. Kilpatrick, A. Kumar, W. Li, B.P. Padley, R. Redjimi, J. Roberts, J. Rorie, W. Shi, A.G. Stahl Leiton, Z. Tu, A. Zhang
\cmsinstskipUniversity of Rochester, Rochester, USA
A. Bodek, P. de Barbaro, R. Demina, J.L. Dulemba, C. Fallon, T. Ferbel, M. Galanti, A. Garcia-Bellido, O. Hindrichs, A. Khukhunaishvili, E. Ranken, R. Taus
\cmsinstskipRutgers, The State University of New Jersey, Piscataway, USA
B. Chiarito, J.P. Chou, A. Gandrakota, Y. Gershtein, E. Halkiadakis, A. Hart, M. Heindl, E. Hughes, S. Kaplan, O. Karacheban\cmsAuthorMark24, I. Laflotte, A. Lath, R. Montalvo, K. Nash, M. Osherson, S. Salur, S. Schnetzer, S. Somalwar, R. Stone, S.A. Thayil, S. Thomas
\cmsinstskipUniversity of Tennessee, Knoxville, USA
H. Acharya, A.G. Delannoy, S. Spanier
\cmsinstskipTexas A&M University, College Station, USA
O. Bouhali\cmsAuthorMark92, M. Dalchenko, A. Delgado, R. Eusebi, J. Gilmore, T. Huang, T. Kamon\cmsAuthorMark93, H. Kim, S. Luo, S. Malhotra, R. Mueller, D. Overton, L. Perniè, D. Rathjens, A. Safonov
\cmsinstskipTexas Tech University, Lubbock, USA
N. Akchurin, J. Damgov, V. Hegde, S. Kunori, K. Lamichhane, S.W. Lee, T. Mengke, S. Muthumuni, T. Peltola, S. Undleeb, I. Volobouev, Z. Wang, A. Whitbeck
\cmsinstskipVanderbilt University, Nashville, USA
E. Appelt, S. Greene, A. Gurrola, R. Janjam, W. Johns, C. Maguire, A. Melo, H. Ni, K. Padeken, F. Romeo, P. Sheldon, S. Tuo, J. Velkovska, M. Verweij
\cmsinstskipUniversity of Virginia, Charlottesville, USA
L. Ang, M.W. Arenton, B. Cox, G. Cummings, J. Hakala, R. Hirosky, M. Joyce, A. Ledovskoy, C. Neu, B. Tannenwald, Y. Wang, E. Wolfe, F. Xia
\cmsinstskipWayne State University, Detroit, USA
P.E. Karchin, N. Poudyal, J. Sturdy, P. Thapa
\cmsinstskipUniversity of Wisconsin - Madison, Madison, WI, USA
K. Black, T. Bose, J. Buchanan, C. Caillol, S. Dasu, I. De Bruyn, L. Dodd, C. Galloni, H. He, M. Herndon, A. Hervé, U. Hussain, A. Lanaro, A. Loeliger, R. Loveless, J. Madhusudanan Sreekala, A. Mallampalli, D. Pinna, T. Ruggles, A. Savin, V. Shang, V. Sharma, W.H. Smith, D. Teague, S. Trembath-reichert, W. Vetens
\cmsinstskip†: Deceased
1: Also at Vienna University of Technology, Vienna, Austria
2: Also at Institute of Basic and Applied Sciences, Faculty of Engineering, Arab Academy for Science, Technology and Maritime Transport, Alexandria, Egypt, Alexandria, Egypt
3: Also at Université Libre de Bruxelles, Bruxelles, Belgium
4: Also at IRFU, CEA, Université Paris-Saclay, Gif-sur-Yvette, France
5: Also at Universidade Estadual de Campinas, Campinas, Brazil
6: Also at Federal University of Rio Grande do Sul, Porto Alegre, Brazil
7: Also at UFMS, Nova Andradina, Brazil
8: Also at Universidade Federal de Pelotas, Pelotas, Brazil
9: Also at University of Chinese Academy of Sciences, Beijing, China
10: Also at Institute for Theoretical and Experimental Physics named by A.I. Alikhanov of NRC ‘Kurchatov Institute’, Moscow, Russia
11: Also at Joint Institute for Nuclear Research, Dubna, Russia
12: Also at Cairo University, Cairo, Egypt
13: Also at Zewail City of Science and Technology, Zewail, Egypt
14: Also at British University in Egypt, Cairo, Egypt
15: Now at Ain Shams University, Cairo, Egypt
16: Now at Fayoum University, El-Fayoum, Egypt
17: Also at Purdue University, West Lafayette, USA
18: Also at Université de Haute Alsace, Mulhouse, France
19: Also at Erzincan Binali Yildirim University, Erzincan, Turkey
20: Also at CERN, European Organization for Nuclear Research, Geneva, Switzerland
21: Also at RWTH Aachen University, III. Physikalisches Institut A, Aachen, Germany
22: Also at University of Hamburg, Hamburg, Germany
23: Also at Department of Physics, Isfahan University of Technology, Isfahan, Iran, Isfahan, Iran
24: Also at Brandenburg University of Technology, Cottbus, Germany
25: Also at Skobeltsyn Institute of Nuclear Physics, Lomonosov Moscow State University, Moscow, Russia
26: Also at Institute of Physics, University of Debrecen, Debrecen, Hungary, Debrecen, Hungary
27: Also at Physics Department, Faculty of Science, Assiut University, Assiut, Egypt
28: Also at Institute of Nuclear Research ATOMKI, Debrecen, Hungary
29: Also at MTA-ELTE Lendület CMS Particle and Nuclear Physics Group, Eötvös Loránd University, Budapest, Hungary, Budapest, Hungary
30: Also at IIT Bhubaneswar, Bhubaneswar, India, Bhubaneswar, India
31: Also at Institute of Physics, Bhubaneswar, India
32: Also at G.H.G. Khalsa College, Punjab, India
33: Also at Shoolini University, Solan, India
34: Also at University of Hyderabad, Hyderabad, India
35: Also at University of Visva-Bharati, Santiniketan, India
36: Also at Indian Institute of Technology (IIT), Mumbai, India
37: Also at Deutsches Elektronen-Synchrotron, Hamburg, Germany
38: Also at Department of Physics, University of Science and Technology of Mazandaran, Behshahr, Iran
39: Now at INFN Sezione di Bari a, Università di Bari b, Politecnico di Bari c, Bari, Italy
40: Also at Italian National Agency for New Technologies, Energy and Sustainable Economic Development, Bologna, Italy
41: Also at Centro Siciliano di Fisica Nucleare e di Struttura Della Materia, Catania, Italy
42: Also at Riga Technical University, Riga, Latvia, Riga, Latvia
43: Also at Consejo Nacional de Ciencia y Tecnología, Mexico City, Mexico
44: Also at Warsaw University of Technology, Institute of Electronic Systems, Warsaw, Poland
45: Also at Institute for Nuclear Research, Moscow, Russia
46: Now at National Research Nuclear University ’Moscow Engineering Physics Institute’ (MEPhI), Moscow, Russia
47: Also at St. Petersburg State Polytechnical University, St. Petersburg, Russia
48: Also at University of Florida, Gainesville, USA
49: Also at Imperial College, London, United Kingdom
50: Also at P.N. Lebedev Physical Institute, Moscow, Russia
51: Also at California Institute of Technology, Pasadena, USA
52: Also at Budker Institute of Nuclear Physics, Novosibirsk, Russia
53: Also at Faculty of Physics, University of Belgrade, Belgrade, Serbia
54: Also at Università degli Studi di Siena, Siena, Italy
55: Also at Trincomalee Campus, Eastern University, Sri Lanka, Nilaveli, Sri Lanka
56: Also at INFN Sezione di Pavia a, Università di Pavia b, Pavia, Italy, Pavia, Italy
57: Also at National and Kapodistrian University of Athens, Athens, Greece
58: Also at Universität Zürich, Zurich, Switzerland
59: Also at Stefan Meyer Institute for Subatomic Physics, Vienna, Austria, Vienna, Austria
60: Also at Laboratoire d’Annecy-le-Vieux de Physique des Particules, IN2P3-CNRS, Annecy-le-Vieux, France
61: Also at Gaziosmanpasa University, Tokat, Turkey
62: Also at Burdur Mehmet Akif Ersoy University, BURDUR, Turkey
63: Also at Şırnak University, Sirnak, Turkey
64: Also at Department of Physics, Tsinghua University, Beijing, China, Beijing, China
65: Also at Near East University, Research Center of Experimental Health Science, Nicosia, Turkey
66: Also at Beykent University, Istanbul, Turkey, Istanbul, Turkey
67: Also at Istanbul Aydin University, Application and Research Center for Advanced Studies (App. & Res. Cent. for Advanced Studies), Istanbul, Turkey
68: Also at Mersin University, Mersin, Turkey
69: Also at Piri Reis University, Istanbul, Turkey
70: Also at Adiyaman University, Adiyaman, Turkey
71: Also at Tarsus Uiversity, MERSIN, Turkey
72: Also at Ozyegin University, Istanbul, Turkey
73: Also at Izmir Institute of Technology, Izmir, Turkey
74: Also at Necmettin Erbakan University, Konya, Turkey
75: Also at Bozok Universitetesi Rektörlügü, Yozgat, Turkey, Yozgat, Turkey
76: Also at Marmara University, Istanbul, Turkey
77: Also at Milli Savunma University, Istanbul, Turkey
78: Also at Kafkas University, Kars, Turkey
79: Also at Istanbul Bilgi University, Istanbul, Turkey
80: Also at Hacettepe University, Ankara, Turkey
81: Also at Vrije Universiteit Brussel, Brussel, Belgium
82: Also at School of Physics and Astronomy, University of Southampton, Southampton, United Kingdom
83: Also at IPPP Durham University, Durham, United Kingdom
84: Also at Monash University, Faculty of Science, Clayton, Australia
85: Also at Bethel University, St. Paul, Minneapolis, USA, St. Paul, USA
86: Also at Karamanoğlu Mehmetbey University, Karaman, Turkey
87: Also at Bingol University, Bingol, Turkey
88: Also at Georgian Technical University, Tbilisi, Georgia
89: Also at Sinop University, Sinop, Turkey
90: Also at Mimar Sinan University, Istanbul, Istanbul, Turkey
91: Also at Nanjing Normal University Department of Physics, Nanjing, China
92: Also at Texas A&M University at Qatar, Doha, Qatar
93: Also at Kyungpook National University, Daegu, Korea, Daegu, Korea