:
\theoremsep
\jmlrvolumeML4H Extended Abstract Arxiv Index
\jmlryear2020
\jmlrsubmitted2020
\jmlrpublished
\jmlrworkshopMachine Learning for Health (ML4H) 2020
Assessing racial inequality in COVID-19 testing\titlebreakwith Bayesian threshold tests
Abstract
There are racial disparities in the COVID-19 test positivity rate, suggesting that minorities may be under-tested. Here, drawing on the literature on statistically assessing racial disparities in policing, we 1) illuminate a statistical flaw, known as infra-marginality, in using the positivity rate as a metric for assessing racial disparities in under-testing; 2) develop a new type of Bayesian threshold test to measure disparities in COVID-19 testing and 3) apply the test to measure racial disparities in testing thresholds in a real-world COVID-19 dataset.
keywords:
Racial disparities, COVID-19, Bayesian modeling1 Introduction
A widely used metric in monitoring COVID-19 outbreaks is the positivity rate, defined as the fraction of COVID-19 tests which are positive (Johns Hopkins Coronavirus Resource Center, 2020; World Health Organization, 2020). A low positivity rate suggests that an area has enough testing to properly monitor its outbreak; a high positivity rate suggests under-testing.
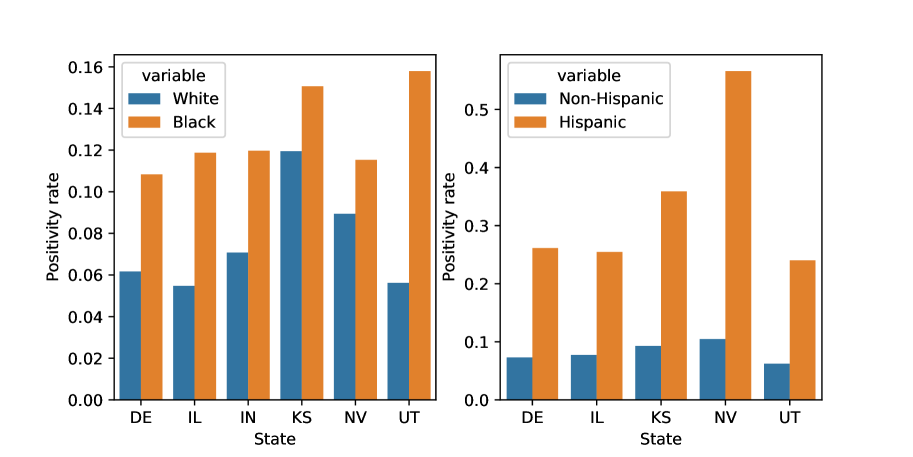
In the United States, there are large racial disparities in COVID-19 cases and deaths per capita (Oppel Jr. et al., 2020), prompting recommendations that the positivity rate be reported broken down by race (Wen and Sadeghi, 2020; Servick, 2020). While this data is not yet systematically available on a national level, the data that is available reveals large racial/ethnic disparities (Figure LABEL:fig:positivity_rate_by_state), consistent with prior work (Martinez et al., 2020; Cordes and Castro, 2020; Bilal et al., 2020). The Black positivity rate is higher in all states with data than the white positivity rate; similarly, the Hispanic positivity rate is higher in all states than the non-Hispanic positivity rate, suggesting under-testing of Black and Hispanic populations.
Motivated by these racial disparities in the positivity rate, in this work we make three contributions. First, we illuminate a statistical flaw, known as infra-marginality, in using the positivity rate as a metric for assessing racial disparities in under-testing, drawing on the literature on measuring racial disparities in policing. Second, we describe how a Bayesian threshold test approach, which has been used to measure racial disparities in policing, can be used to measure disparities in COVID-19 testing, and develop a version of the test suitable for the COVID-19 setting. Third, we use the test to measure racial disparities in testing thresholds in a real-world COVID-19 dataset. We conclude by discussing broader applications of threshold tests in medicine.
fig:positivity_rate_by_state
2 Infra-marginality
Breaking down the COVID-19 positivity rate by race is an example of an “outcome test”, a widely used technique for measuring racial bias in decision-making by examining the outcomes of decisions (Ayres, 2002; Becker, 1993; Carr and Megbolugbe, 1993). Outcome tests have been applied in diverse domains from policing to lending. In policing, a frequently used outcome is whether a police search finds contraband: if searches of white drivers find contraband 90% of the time, but searches of Black drivers find contraband only 10% of the time, it suggests that the police are searching white drivers only when they’re very likely to be carrying contraband, but searching Black drivers at a lower threshold of evidence. In lending, the outcome is whether someone granted a loan repays it: if white loan recipients pay back loans only 10% of the time, but Black loan recipients pay back loans 90% of the time, it suggests that Black applicants are receiving loans only when they are very likely to pay them back, at a higher threshold of evidence. In COVID-19 testing, the outcome is whether a COVID-19 test comes back positive; if tests of Black patients find COVID-19 90% of the time, but tests of white patients find COVID-19 only 10% of the time, it suggests that Black patients are being tested only when they are much more likely to have COVID-19, at a higher threshold of evidence. In all these examples, then, racial differences in outcomes are concerning because they suggest racial differences in the probability thresholds people face — to undergo a police search, to receive a loan, or to get a COVID-19 test.
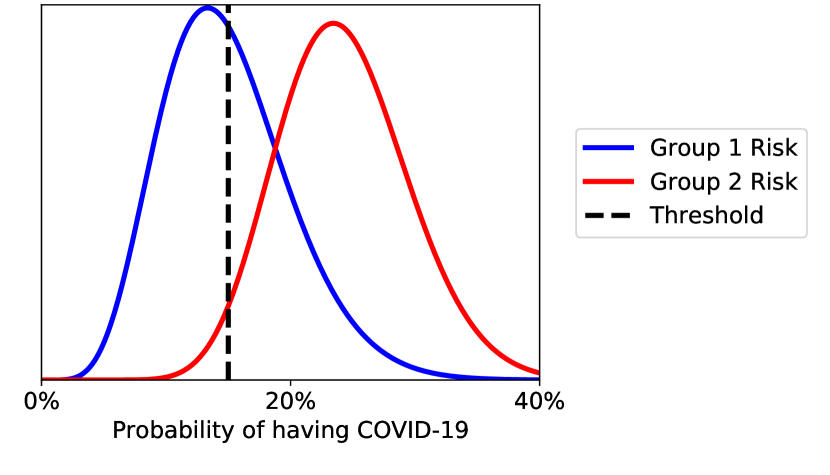
But the previous literature on outcome tests also illuminates a problem with simply examining the positivity rate, called infra-marginality (Ayres, 2002), which we explain by adapting an example from Simoiu et al. (2017). Imagine that there are two races — white and Black — and within each race there are two equally-sized groups — one who is very unlikely to have COVID-19, and one who is quite likely. Imagine these groups are easy to tell apart — one group is showing COVID-19 symptoms, for example, and one group is asymptomatic. 5% of the asymptomatic patients have COVID-19, regardless of their race. 50% of the white symptomatic patients have COVID-19, and 75% of the Black symptomatic patients have COVID-19. Finally, imagine there is no racial bias in who is tested: everyone who is more than 10% likely to have COVID-19 is tested, regardless of race, so the same probability threshold is applied to both races. All symptomatic patients will be tested, producing a positivity rate of 50% for white patients and 75% for Black patients. We will incorrectly conclude from the higher positivity rate among Black patients that they are being under-tested relative to whites — that is, tested only when they are more likely to have COVID-19. But in fact, in this hypothetical, everyone faces the same 10% testing threshold. We reach this misleading conclusion because the statistic we’re measuring — the positivity rate — is not the same as the probability threshold at which patients are being tested. (We note that positivity rate analysis can also yield a misleading result in the opposite direction, where it fails to show racial disparities even though there are disparities in testing thresholds.)
In general, if two race groups have very different risk distributions (in the hypothetical example above, the Black risk distribution is right-shifted) simply looking at the positivity rate may yield misleading conclusions. Figure LABEL:fig:hypothetical_risk_distributions illustrates this graphically for continuous risk distributions. In the case of COVID-19, infra-marginality is not a hypothetical concern: per capita infection rates are much higher in Black populations than white populations, so it is plausible that there might be dramatic differences in the risk distributions.
fig:hypothetical_risk_distributions
This threshold which people are tested is hard to measure — unlike the positivity rate, it’s not a simple fraction directly observable from the data, but a latent quantity that must be inferred. Threshold tests attempt to infer both the thresholds and risk distributions and thereby circumvent the problem of infra-marginality.
3 Threshold tests
Threshold tests for policing, proposed in Simoiu et al. (2017) and applied in Pierson et al. (2018, 2020), use a Bayesian model to simultaneously infer the race- and location-specific risk distributions and thresholds. For brevity, we refer the reader to Simoiu et al. (2017) for a description of the original threshold test in the context of policing, and here describe only our adapted generative model for the COVID-19 context; Appendix A.2 details further how the two models differ.
Observed data.
We assume that we observe three pieces of information for all race groups and counties : the population of the race group in the county, ; the cumulative number of COVID-19 tests for the race group in the county ; and the cumulative number of COVID-19 cases (positive tests) for the race group in the county, .
Generative model.
On each day, the probability that a person of race in county has COVID-19 is drawn from a race and county-specific risk distribution – a probability distribution on . represents the probability a person has COVID-19 given their relevant observable characteristics - for example, whether they are coughing and whether they have recently been to large gatherings. Each person gets tested if exceeds a race and county-specific testing threshold, .
We let denote the random variable corresponding to the risk distribution for each race and county. The probability a person of a given race in a given county will get tested, , is the proportion of the risk distribution that lies above the threshold, , that is, the complementary cumulative distribution function of the risk distribution. The probability a test will be positive, , is the expected value of the risk distribution conditional on being above the threshold: . The observed data are drawn as as follows:
| (1) | ||||
| (2) |
The latent parameters of the model are the thresholds and the parameters of the risk distributions. Following Pierson et al. (2018, 2020), we parameterize the risk distributions as discriminant distributions, which are two-parameter distributions on that facilitate fast inference in this setting. We allow the risk distributions to vary by race and by county to accommodate the fact that the true prevalence of COVID-19 can vary by race and county. To complete the Bayesian specification, we must place priors on the latent parameters, which we describe in our full model specification, available online.111https://github.com/epierson9/disease-testing-thresholds/blob/master/poisson_mixture_model_no_deltas.stan We infer posteriors over the latent parameters using Hamiltonian Monte Carlo (Neal, 1994), implemented in the probabilistic programming language Stan (Carpenter et al., 2017).
4 Results
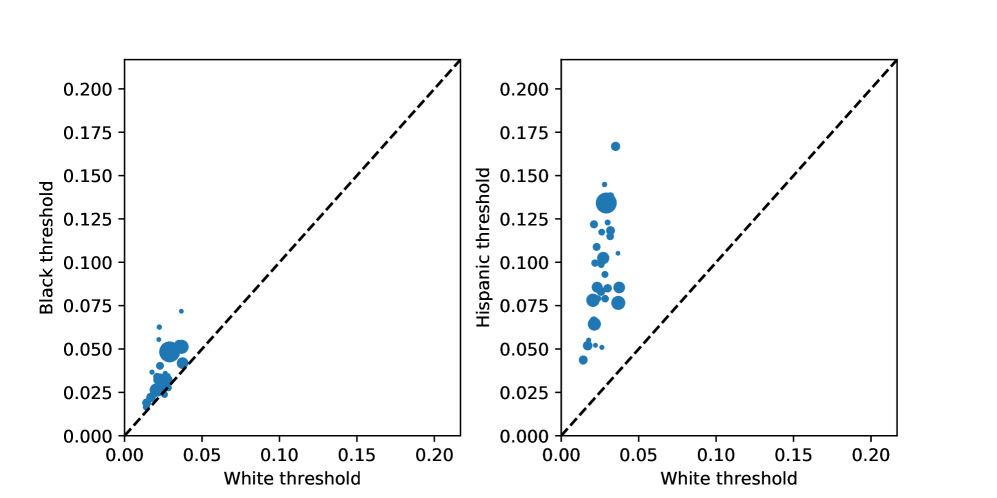
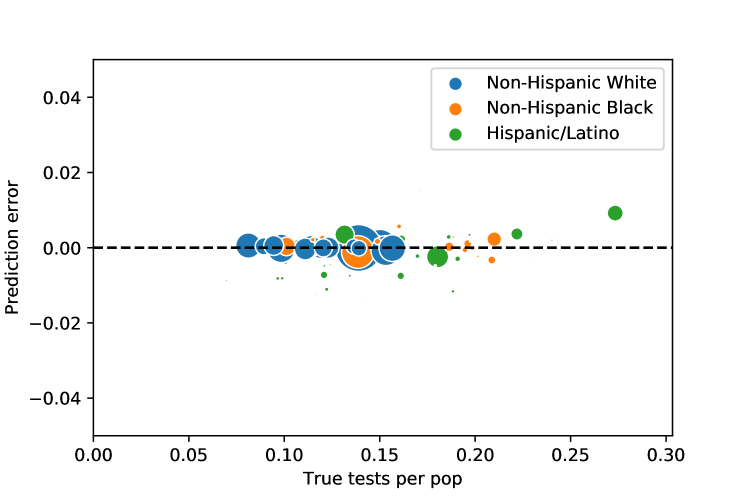
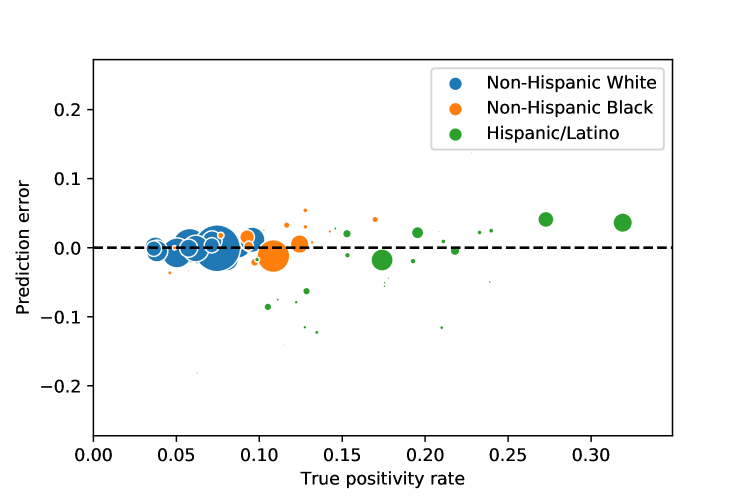
We fit the model to cumulative COVID-19 test and case count data through August 16, 2020 in the US state of Indiana, broken down by race and county (further data details in Appendix A). We infer testing thresholds for non-Hispanic Black, non-Hispanic white, and Hispanic populations. The primary latent parameters of interest are the inferred testing thresholds for each race and county; we plot these in Figure LABEL:fig:indiana_thresholds. Inferred thresholds for minorities are generally higher than those for whites in the same county, suggesting that minorities are under-tested relative to whites: that is, tested only when they have a higher probability of having COVID-19. Consistent with this, the raw positivity rates (Figure LABEL:fig:indiana_positivity_rate) also show racial disparities, but they are less consistent, and this analysis is not robust to infra-marginality. (Appendix A includes additional model results. Figure LABEL:fig:indiana_risk_distributions plots the inferred risk distributions, illustrating that there are indeed differences across race groups. Figure LABEL:fig:indiana_ppcs plots posterior predictive checks, a standard check in Bayesian inference; Table LABEL:tab:specification_robustness_checks shows that our main results remain robust across alternate specifications.)
fig:indiana_thresholds
5 Future Directions
There are broader potential applications of threshold tests both in COVID-19 and in other medical conditions. While we focus here on racial disparities in COVID-19, one could assess COVID-19 under-testing across locations or across other demographic dimensions like age. Beyond COVID-19, threshold tests could be used to measure racial disparities in under-testing and under-diagnosis in medicine more broadly, an issue of known concern in cardiac conditions Schulman et al. (1999), attention deficit disorder (Coker et al., 2016), chronic obstructive lung disease (Mamary et al., 2018), depression (Sorkin et al., 2011) and other psychiatric conditions (Kunen et al., 2005). Assessing racial disparities in medical testing with threshold tests thus offers a fruitful area for further research.
Thanks to Serina Chang, Irene Chen, Sam Corbett-Davies, Pang Wei Koh, Lester Mackey, Ziad Obermeyer, Nat Roth, Leah Pierson, Miriam Pierson, Jacob Steinhardt, and seminar attendees for helpful conversations, and to Jaline Gerardin, Alexis Madrigal, and Albert Sun for data assistance.
References
- Ayres (2002) Ian Ayres. Outcome tests of racial disparities in police practices. Justice research and Policy, 4(1-2):131–142, 2002.
- Becker (1993) Gary S Becker. Nobel lecture: The economic way of looking at behavior. Journal of political economy, 101(3):385–409, 1993.
- Bilal et al. (2020) Usama Bilal, Sharrelle Barber, and Ana V Diez-Roux. Spatial Inequities in COVID-19 outcomes in Three US Cities. medRxiv, 2020.
- Carpenter et al. (2017) Bob Carpenter, Andrew Gelman, Matthew D Hoffman, Daniel Lee, Ben Goodrich, Michael Betancourt, Marcus Brubaker, Jiqiang Guo, Peter Li, and Allen Riddell. Stan: A probabilistic programming language. Journal of statistical software, 76(1), 2017.
- Carr and Megbolugbe (1993) James H Carr and Isaac F Megbolugbe. The Federal Reserve Bank of Boston study on mortgage lending revisited. Journal of Housing Research, pages 277–313, 1993.
- Coker et al. (2016) Tumaini R Coker, Marc N Elliott, Sara L Toomey, David C Schwebel, Paula Cuccaro, Susan Tortolero Emery, Susan L Davies, Susanna N Visser, and Mark A Schuster. Racial and ethnic disparities in ADHD diagnosis and treatment. Pediatrics, 138(3), 2016.
- Cordes and Castro (2020) Jack Cordes and Marcia C Castro. Spatial analysis of COVID-19 clusters and contextual factors in New York City. Spatial and Spatio-temporal Epidemiology, 34:100355, 2020.
- Gardner et al. (1995) William Gardner, Edward P Mulvey, and Esther C Shaw. Regression analyses of counts and rates: Poisson, overdispersed poisson, and negative binomial models. Psychological bulletin, 118(3):392, 1995.
- Gelman et al. (1996) Andrew Gelman, Xiao-Li Meng, and Hal Stern. Posterior predictive assessment of model fitness via realized discrepancies. Statistica Sinica, pages 733–760, 1996.
- Johns Hopkins Coronavirus Resource Center (2020) Johns Hopkins Coronavirus Resource Center. Which U.S. States Meet WHO Recommended Testing Criteria? 2020. Available at https://coronavirus.jhu.edu/testing/testing-positivity.
- Kunen et al. (2005) Seth Kunen, Ronda Niederhauser, Patrick O Smith, Jerry A Morris, and Brian D Marx. Race disparities in psychiatric rates in emergency departments. Journal of Consulting and Clinical Psychology, 73(1):116, 2005.
- Mamary et al. (2018) A James Mamary, Jeffery I Stewart, Gregory L Kinney, John E Hokanson, Kartik Shenoy, Mark T Dransfield, Marilyn G Foreman, Gwendolyn B Vance, Gerard J Criner, COPDGene® Investigators, et al. Race and gender disparities are evident in COPD underdiagnoses across all severities of measured airflow obstruction. Chronic Obstructive Pulmonary Diseases: Journal of the COPD Foundation, 5(3):177, 2018.
- Martinez et al. (2020) Diego A Martinez, Jeremiah S Hinson, Eili Y Klein, Nathan A Irvin, Mustapha Saheed, Kathleen R Page, and Scott R Levin. SARS-CoV-2 positivity rate for Latinos in the Baltimore–Washington, DC Region. JAMA, 324(4):392–395, 2020.
- Neal (1994) Radford M Neal. An improved acceptance procedure for the hybrid Monte Carlo algorithm. Journal of Computational Physics, 111(1):194–203, 1994.
- Oppel Jr. et al. (2020) Richard A Oppel Jr., Robert Gebeloff, K.K. Rebecca Lai, Will Wright, and Mitch Smith. The Fullest Look Yet at the Racial Inequity of Coronavirus. The New York Times, 2020.
- Pierson et al. (2018) Emma Pierson, Sam Corbett-Davies, and Sharad Goel. Fast threshold tests for detecting discrimination. In International Conference on Artificial Intelligence and Statistics, pages 96–105, 2018.
- Pierson et al. (2020) Emma Pierson, Camelia Simoiu, Jan Overgoor, Sam Corbett-Davies, Daniel Jenson, Amy Shoemaker, Vignesh Ramachandran, Phoebe Barghouty, Cheryl Phillips, Ravi Shroff, et al. A large-scale analysis of racial disparities in police stops across the united states. Nature Human Behaviour, pages 1–10, 2020.
- Schulman et al. (1999) Kevin A Schulman, Jesse A Berlin, William Harless, Jon F Kerner, Shyrl Sistrunk, Bernard J Gersh, Ross Dube, Christopher K Taleghani, Jennifer E Burke, Sankey Williams, et al. The effect of race and sex on physicians’ recommendations for cardiac catheterization. New England Journal of Medicine, 340(8):618–626, 1999.
- Servick (2020) Kelly Servick. “Huge hole” in COVID-19 testing data makes it harder to study racial disparities. Science, 2020.
- Simoiu et al. (2017) Camelia Simoiu, Sam Corbett-Davies, Sharad Goel, et al. The problem of infra-marginality in outcome tests for discrimination. The Annals of Applied Statistics, 11(3):1193–1216, 2017.
- Sorkin et al. (2011) Dara H Sorkin, Quyen Ngo-Metzger, John Billimek, Kristin J August, Sheldon Greenfield, and Sherrie H Kaplan. Underdiagnosed and undertreated depression among racially/ethnically diverse patients with type 2 diabetes. Diabetes care, 34(3):598–600, 2011.
- The COVID Tracking Project (2020) The COVID Tracking Project. The COVID Racial Data Tracker. 2020. Available at https://covidtracking.com/.
- Wen and Sadeghi (2020) Leana S. Wen and Nakisa B. Sadeghi. Addressing Racial Health Disparities In The COVID-19 Pandemic: Immediate And Long-Term Policy Solutions. Health Affairs Blog, 2020.
- World Health Organization (2020) World Health Organization. Public health criteria to adjust public health and social measures in the context of COVID-19. 2020.
Appendix A
A.1 Data processing
We fit the model to cumulative COVID-19 test and case count data in Indiana through August 16, 2020 in the US state of Indiana, broken down by race and county.222We fit the model to cumulative case counts because daily case counts are not available. We note that, while the conceptual interpretation of the model makes sense even for cumulative case counts, since the sum of daily Poisson draws will itself be a Poisson draw, fitting the model to daily data (to infer time-varying thresholds and risk distributions) represents an interesting direction for future work. We chose Indiana because it was one of the few states which made the requisite data available.333https://www.coronavirus.in.gov/2393.htm
We infer county-specific COVID-19 testing thresholds for non-Hispanic white, non-Hispanic Black, and Hispanic populations. Indiana reports data (test and case counts) aggregated by race (eg, white or Black), and aggregated by ethnicity (Hispanic or non-Hispanic), but not data aggregated by both at once. A second caveat is that there is significant missing race/ethnicity data: the median county has ethnicity data for only about half of cases and tests, and race data for 80-90% of cases and tests. Due to these two caveats, there are multiple potential ways of processing the raw data to produce the data we use to actually fit the model. As a sensitivity analysis, we process the data three different ways, and verify that our main conclusion (that minorities face higher testing thresholds) remains robust across all three specifications (Table LABEL:tab:specification_robustness_checks).
-
1.
Original specification: We assume that race and ethnicity are independent – eg, the fraction of whites who are Hispanic is the same as the fraction of Blacks who are Hispanic. We define the number non-Hispanic white cases as
where is the number of white cases in the raw data, is the proportion of cases with known ethnicity which are Hispanic, and is the proportion of cases with known race. (All these quantities are reported in the raw data.) The definitions for tests rather than cases, and for non-Hispanic Blacks rather than non-Hispanic whites, are analogous. We define the Hispanic case count as , where is the total number of cases, and tests analogously. This constitutes our primary specification which we use to report our main results.
-
2.
Raw counts. We simply use the raw counts in the data for white, Black, and Hispanic cases. This method does not attempt to combine race and ethnicity or account for missing data.
-
3.
Subtract ethnicity. We use the raw counts for Black and Hispanic cases/tests, and for whites, subtract the number of Hispanic cases/tests. This method does not attempt to account for missing data.
We filter for counties with Black and Hispanic populations of at least 500 to ensure that they have large enough minority populations to be able to meaningfully assess disparities. This filter retains counties containing 87% of the Hispanic population and 98% of the Black population.
A.2 Model details
Our full model specification, which includes priors on all parameters and the parameterization of the thresholds and risk distributions, is available online, along all the code to reproduce our results.444https://github.com/epierson9/disease-testing-thresholds. Here, we briefly detail how our model differs from previous threshold models. The primary difference between the original threshold model for police searches detailed in Simoiu et al. (2017), and our threshold model for COVID-19 tests, is that the policing model measures disparities only among stopped drivers, whereas the COVID-19 model measures disparities in the entire population, and must therefore model and make use of population information (eg, from Census data). While the number of police searches cannot exceed the number of police stops (and the original authors therefore model the number of searches as a Binomial draw from the number of stops), the number of COVID-19 tests in a county can exceed the number of people in a location (since each person can be tested multiple times), so a Binomial model is unsuitable. Pierson et al. (2018) proposes a version of the threshold test which incorporates population information, but makes use of only the proportion rather than the absolute population of each race group in each location: eg, the population information provided to their model is that “in County X, 40% of people are Hispanic, 20% are white, and 40% are Black”. This is unsuitable for our setting, because intuitively our inferences about COVID-19 testing threshold and prevalence should be very different in a county with 100 people and 10 tests, compared to a county with 10,000 people and 10 tests, even if the relative fractions of each race group remain constant.
In the COVID-19 setting, we incorporate population information by modelling the number of tests for each race group in each county as a Poisson draw (whose rate parameter is proportional to the population of that race group in that county). Our use of a Poisson bears some similarity to the Poisson regression setting, in which a Poisson whose rate parameter depends on covariates is used to model rates in a population; a natural direction for future work is to extend our model to accommodate overdispersion via, eg, a quasi-Poisson or negative binomial model (Gardner et al., 1995). As a further robustness check (Table LABEL:tab:specification_robustness_checks), we ensure that our primary results remain robust when we replace the Poisson with a Binomial distribution (which is similar to the original specification in Simoiu et al. (2017)), even though the latter makes less sense conceptually.
fig:indiana_positivity_rate
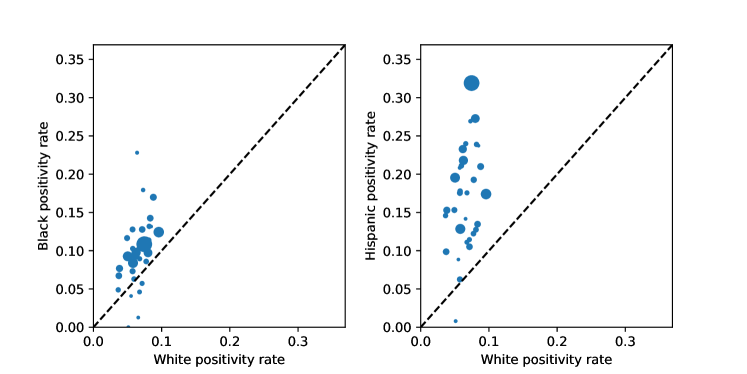
fig:indiana_risk_distributions

fig:indiana_ppcs
tab:specification_robustness_checks Data Processing Method Model Hispanic/Latino Non-Hispanic Black Non-Hispanic White Hispanic:white ratio Black:white ratio Original Poisson 0.10 (0.08, 0.11) 0.04 (0.03, 0.04) 0.03 (0.02, 0.03) 3.61 (3.50, 3.72) 1.42 (1.38, 1.46) Original Binomial 0.10 (0.09, 0.11) 0.04 (0.03, 0.05) 0.03 (0.02, 0.03) 3.59 (3.48, 3.71) 1.42 (1.38, 1.46) Subtract ethnicity Poisson 0.17 (0.15, 0.18) 0.07 (0.06, 0.08) 0.04 (0.03, 0.04) 4.35 (4.10, 4.64) 1.82 (1.77, 1.87) Subtract ethnicity Binomial 0.17 (0.15, 0.19) 0.07 (0.06, 0.08) 0.04 (0.03, 0.05) 4.33 (4.08, 4.60) 1.82 (1.78, 1.87) Raw numbers Poisson 0.13 (0.11, 0.15) 0.05 (0.04, 0.06) 0.03 (0.03, 0.04) 3.77 (3.51, 4.08) 1.45 (1.41, 1.49) Raw numbers Binomial 0.13 (0.11, 0.15) 0.05 (0.04, 0.06) 0.04 (0.03, 0.04) 3.75 (3.50, 4.04) 1.45 (1.41, 1.49)