Multi-Modal Active Learning for Automatic Liver Fibrosis Diagnosis based on Ultrasound Shear Wave Elastography
Abstract
With the development of radiomics, noninvasive diagnosis like ultrasound (US) imaging plays a very important role in automatic liver fibrosis diagnosis (ALFD). Due to the noisy data, expensive annotations of US images, the application of Artificial Intelligence (AI) assisting approaches encounters a bottleneck. Besides, the use of mono-modal US data limits the further improve of the classification results. In this work, we innovatively propose a multi-modal fusion network with active learning (MMFN-AL) for ALFD to exploit the information of multiple modalities, eliminate the noisy data and reduce the annotation cost. Four image modalities including US and three types of shear wave elastography (SWEs) are exploited. A new dataset containing these modalities from 214 candidates is well-collected and pre-processed, with the labels obtained from the liver biopsy results. Experimental results show that our proposed method outperforms the state-of-the-art performance using less than 30% data, and by using only around 80% data, the proposed fusion network achieves high AUC 89.27% and accuracy 70.59%.
Index Terms— Liver fibrosis diagnosis, Shear wave elastography, Active learning, Attention, Multi-modal fusion
1 Introduction
Liver fibrosis is a main prognostic factor in chronic liver disease (CLD) patients’ treatment [1]. To assess the severity of liver fibrosis [2] clinically, liver biopsy (LB) is employed as the gold standard to classify liver fibrosis into 5 stages under the METAVIR scoring system: no fibrosis (F0), mild fibrosis (F1), significant fibrosis (F2), severe fibrosis (F3) and cirrhosis (F4) [3]. However, LB is an invasive procedure with potential complications. To overcome its limitations, serum indexes and multiple imaging modalities, such as B-mode ultrasound (US), computed tomography (CT), magnetic resonance imaging (MRI), magnetic resonance elastography (MRE) and US-based elastography are used for noninvasive automatic liver fibrosis diagnosis (ALFD). However, using these techniques requires specialized equipment and well-trained professionals while there is a paucity of these resources in regions CLD is prevalent. Therefore, automatic and cost-effective AI based methods are supposed to be developed to improve the monitoring and treatment of CLD patients worldwide.
In the literature, some works [4, 5, 6] using CT and MRI for automatic assessment and some employ simple US images which are more convenient, harmless and cheaper [7]. However, all above systems fail to discriminate early stages of liver fibrosis. In contrast, using US-based elastography images exhibits great potential at assessing all stages of liver fibrosis. It can be performed with different techniques, including transient, point (STQ), and 2D-SWE (STE) [8]. Recently, several methods were designed based on STE. For instance, Wang et al. [9] constructed a four-layer convolutional network. A fully connected layer was used as a two-class classifier (F4 vs. F0-F3; F3-F4 vs. F0-F2; F2-F4 vs. F0-F1). In [10], a transfer learning radiomics model combining the information from grayscale and elastography images was proposed for liver fibrosis grading, achieving AUCs 95, 93.2, and 93 for classifying F4, F3, and F2, respectively. They are the state-of-the-art (SOTA) performance as far as we know.
However, there are several limitations with the previous methods. Firstly, they classified liver fibrosis into less than or equal to four stages, since two neighboring stages are hard to be discriminated. Secondly, in clinical workflow, the doctor’s diagnosis is usually based on more than one type of medical images or indicators rather than a single modality. Thirdly, the AI based methods suffer from the limited annotated noisy data, since it is expensive and tedious to collect, clean and annotate numerous images.
Active Learning (AL) has been successfully deployed into many applications [11, 12, 13], which indicates that AL is a good choice for reducing the annotation cost, removing the noisy data automatically, and improving the robustness of the model. There have been many popular selection strategies in the literature, mainly including query by committee, expected error reduction and uncertainty sampling.
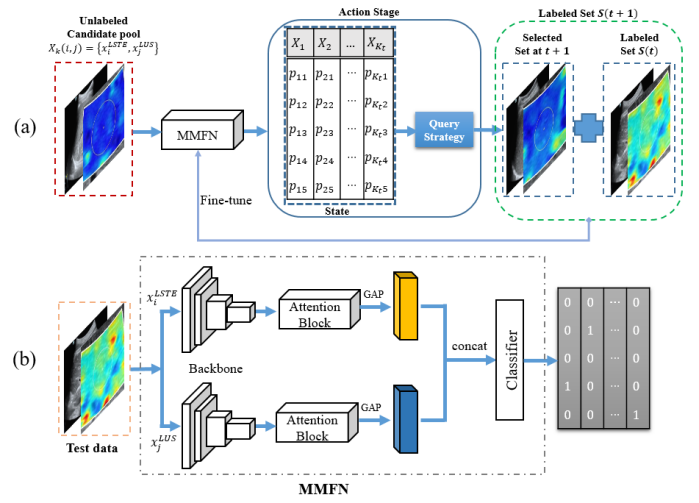
To this end, we aim to investigate the effectiveness of different modalities in deep neural network with AL, which aims to achieve effective performance given a limited amount of annotated data selected from a noisy data pool. A novel multi-modal fusion network with AL (MMFN-AL) to assess the degree of liver fibrosis is proposed. Specifically, we implement the AL to select the informative samples from the unlabeled dataset, and these samples are then used to fine-tune the MMFN, i.e. a pre-trained ResNet50 followed squeeze-excitation (SE) attention modules [14]. We first implement a mono-modal network as the baseline by transfer learning with ResNet-50 [15]. Then a feature-level fusion network with SE blocks is designed to effectively integrate complementary information from different modalities. Finally, the mono-modal and bi-modal networks with different modality combinations are evaluated.
Experimental results demonstrate our hypothesis that integrating multiple modalities into the network significantly improves the diagnosis accuracy and outperform the SOTA. Furthermore, the use of AL can eliminate certain noisy samples and further improve the performance using less than 30% labelled data. An overview of our proposed model is shown in Fig. 1. To conclude, this paper contains the following contributions:
-
•
To the best of our knowledge, this is the first work that build a novel large-scale US dataset containing four medical image modalities of liver for ALFD.
-
•
A novel multi-modal fusion network with AL is proposed, effectively reducing labelling efforts, eliminating the noisy data and improving the robustness of the model.
-
•
Experimental results show that our MMFN-AL achieves better AUCs with less than 30% data than the SOTA methods with 100% data.
2 Multi-Modal Dataset Construction
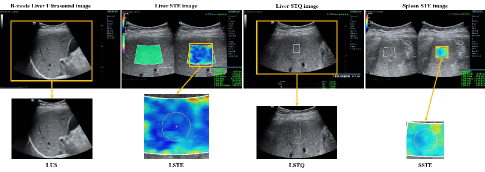
A dataset consisting of four modalities is constructed in this work. They were collected in the clinical examination of liver fibrosis, named by liver STE images (LSTE), spleen STE images (SSTE), liver STQ images (LSTQ) and liver ultrasound images (LUS), as illustrated in Fig. 2.
2.1 Clinical Flow
The data were collected from a hospital by one radiologist who was strictly trained for ultrasound examination with SWE measurement using the uniform procedure. The routine examination of a CLD patient includes blood sampling, physical examination, US examination and SWE measurement. The corresponding five-stage METAVIR score was given by the result of LB.
In the clinical examination of one patient, the doctor collected seven US images, five LSTE images, three to five LSTQ images and three to five SSTE images that reflect liver fibrosis to a certain extent. In addition, the doctor collected ultrasound videos from some patients. By video sampling, we obtain 2030 more LUS images for each patient with video data. The illustration of these four kinds of images was shown in the first line of Fig. 2. The regions inside the yellow box are taken as the final inputs.
2.2 Multi-Modal Dataset
We totally collect the samples for 214 candidates from a hospital, containing 213 LSTE candidates, 191 LUS candidates, 201 LSTQ candidates and 190 SSTE candidates. It should be noted that patients could have several modalities, but not necessary all modalities. To make the evaluation fair and reasonable, only the patients with four modalities were included into our final dataset, resulting in 168 such patients, where 41 are F0, 51 are F1, 31 are F2, 27 are F3 and 18 are F4. To augment the data pairs in the bi-modal experiments, we carry out pairwise combinations between every two modalities. A data summary of image amounts is listed in Table 1.
| Modal | LSTE | LUS | LSTQ | LSTELUS | LSTELSTQ | LSTESSTE |
|---|---|---|---|---|---|---|
| Total | 778 | 3572 | 683 | 16592 | 3232 | 3171 |
| F0 | 185 | 933 | 183 | 4195 | 859 | 827 |
| F1 | 235 | 1095 | 204 | 5077 | 958 | 938 |
| F2 | 142 | 604 | 117 | 2818 | 548 | 548 |
| F3 | 132 | 515 | 109 | 2509 | 535 | 526 |
| F4 | 84 | 425 | 70 | 1993 | 332 | 332 |
3 Methodology
3.1 Feature Extraction Networks
Considering the multi-modal inputs, we design the MMFNAL as illustrated in Fig. 1. Each stream consists of a feature extractor module and an attention block. To extract deeper and handle high-level features from medical images, we exploit the idea of the residual and adapt ResNet-50 [15] that was pretrained on ImageNet [16] as the feature extractor. Rather than the multi-stream network used in video action recognition [17] for spatially correlated data streams, we consider spatially uncorrelated characteristics of the multi-modal images in this task, and design our model to perform the fusion after the global average pooling (GAP) layer, which removes the spatial information by averaging each feature map into a single value.
3.2 Multi-Modal Active Learning Framework
3.2.1 Multi-Modal Fusion
For multi-modal inputs, we believe that the importance of each modal is different. With the goal of improving the feature quality of representations produced by each stream, we add a down-sampling layer and an SE attention block after feature extraction.
For each stream input , where and denote the number of channels, height and width of the image, respectively, we convert the medical images from other format to RGB. Let be the array of feature maps generated by the feature extractor in each branch. The value of channel numbers and down-sampling rate depend on the backbone we used, which are 2048 and 32 in ResNet-50. In order to reduce the redundant features, we exploit a point-wise convolution to reduce the dimensions to 256. Then we use an SE module to enhance the feature representations after feature extraction by the ResNet backbone. We aggregate the spatial information of each feature map by average pooling to generate a spatial feature . This spatial feature is forwarded to a multi-layer perceptron (MLP) ultimately to produce our channel attention map , and merge the output feature vectors using element-wise summation. In short, the attention block can be computed as:
where denotes the sigmoid function, and are the MLPs weights. Note that the ReLU activation function is followed by . And denotes element-wise multiplication.
Our fusion layer is implemented by separately feeding into a GAP layer to obtain several 256-dimensional vectors corresponding to different modalities, which are then concatenated to form a vector that contains information from modalities. For classification, the combined vector is fed into a fully connected (FC) layer to produce posterior probability for each class, which is predicted by selecting the class with the maximum posterior probability.
3.2.2 Query Strategy for Active Learning
At each AL iteration , the action stage in Fig.1(a) is to select unlabeled images from the candidate pool in order to form a new labeled set to fine-tune the MMFN model. Let denote the index set of modalily at iteration . For instance, taking LSTE and LUS as the input modalities, the unlabeled candidate pool is denoted as , where . Specifically, , where . Here, is the total amount of unlabeled data.
After one training iteration, the MMFN provides a prediction state for each input . If is selected as the labeled data according to and the query strategy, will be removed from the candidate pool . Random sampling strategy (RAND) abd the entropy sampling strategy (ES) are employed in this work for AL.
Information entropy of an input is calculated on the output probability of the classifier which is trained at the previous iteration. It is denoted as: where is the probability that the input image is predicted as label . Higher entropy value means that selected samples carry richer information. In the implementation, we take the average probability of prediction states to calculate the entropy for each input data and select data with the largest entropy values, named entropy sampling with dropout (ESD).
4 Experiments
4.1 Implementation Details
We first implemented mono-modal experiments using the ResNet-50 based neural network to investigate how each modal is performed. The input images of each modal were illustrated in the second row of Fig. 2. For LSTQ and LUS, the complete LUS image was selected. For LSTE (or SSTE), the square with the size of 224224 pixels including the entire ROI was selected as the input. For evaluation, of the patients in each stage was selected to constitute the training dataset and the rest for testing.
4.2 Evaluation Metrics
The area under the receiver operating characteristic curve (AUC) was used as the main index for performance evaluation. The average AUC for the five-category classification is used as an overall comparison. Accuracy (Acc) is also computed to evaluate the performance.
4.3 Results and Discussions
Diagnostic accuracies and five-class average AUCs of all mono-modal networks for three modalites are shown in Table 2 and Table 3. SSTE is not used for mono-modal network evaluation because it is not from the liver, mismatched with our task target. ResNet50-RAND and ResNet50-ESD represents the corresponding query strategies employed by AL. The proposed fusion model MMFN is evaluated on the bi-modal cases, i.e. fusing LSTE with LUS, LSTQ and SSTE, respectively. The effectiveness of combining MMFN with AL is further evaluated using RAND and ESD. The results relative with network fusion are illustrated in Table 4.
| Score (%) | DLRE[9] | IncepV3[10] | ResNet50 | |||
|---|---|---|---|---|---|---|
| Acc | AUC | Acc | AUC | Acc | AUC | |
| LSTE | 61.76 | 84.19 | 47.06 | 83.74 | 55.88 | 84.43 |
| LUS | 32.35 | 62.67 | 41.18 | 77.34 | 32.35 | 74.94 |
| LSTQ | 38.24 | 63.62 | 38.24 | 71.93 | 47.06 | 75.87 |
| Score (%) | ResNet50-RAND | ResNet50-ESD | ||
|---|---|---|---|---|
| Acc | AUC (d) | Acc | AUC(d) | |
| LSTE | 64.71 | 87.85 (26.9%) | 65.12 | 89.72(87.4%) |
| LUS | 35.29 | 68.75(65.0%) | 44.12 | 72.95(32.3%) |
| LSTQ | 47.6 | 72.6 (39.6%) | 52.94 | 72.86(89.2%) |
| MMFN | MMFN-RAND | MMFN-ESD | ||||
| LSTE | Acc | AUC | Acc | AUC (d) | Acc | AUC (d) |
| LUS | 58.82 | 88.84 | 61.76 | 86.78 (12.5%) | 64.71 | 88.08 (60.0%) |
| LSTQ | 64.71 | 87.50 | 70.59 | 89.12 (79.5%) | 64.71 | 89.27 (79.5%) |
| SSTE | 61.76 | 84.13 | 67.65 | 84.58 (79.7%) | 67.65 | 85.03 (54.8%) |
4.3.1 Comparison with the SOTA
As shown in the first six columns of Table 2, the best average AUCs of the mono-modal models using LSTE and LSTQ are achieved by the ResNet50 backbone. By comparing the SOTA results with the results in Table 3 and Table 4, it illustrates that our proposed MMFN-AL architecture outperforms the two previous methods.
4.3.2 Effectiveness of multi-modal fusion network
We train ResNet50-based transfer learning network as the baseline for our experiment. As shown in Table 2, LSTE image presents the best performance among three mono-modal experiments, among which DLRE provides the best diagnosis accuracy while ResNet50 gives the best AUC. This demonstrates that LSTE images carry more effective information for liver fibrosis grading. By fusing any other modality with LSTE, the performances are all improved significantly, and the fusion of LSTE and LSTQ gives the best diagnosis accuracy 70.59% and best average AUC 89.27% among the bi-modal experiments. The results justify the advantage of fusing multiple informative modalities in the DL systems for automatic diagnosis.
4.3.3 Effectiveness of active learning
Comparing the last two columns of Table 2 with Table 3, it shows that the LSTE mono-modal case most benefits from the AL. Both accuracy and AUC are improved significantly and it achieves a relatively high AUC with only 26.9% data. In terms of accuracy, the case of LSTQ also performs much better by applying AL. The accuracy is increased by more than five percentage using 89.2% data. For multi-modal cases, the effectiveness of AL is obvious as well. Specifcally, the best diagnosis accuracy among all experiments is achieved by LSTELSTQ using random AL strategy, by taking 79.5% data from the candidate pool. For LSTELUS, by taking only 12.5% data, it can achieve relatively high accuracy and AUC values.
5 Conclusion
In this work, a multi-modal fusion network with active learning is innovatively proposed for ALFD. As far as we know, it is the first time that a five-class classification model is developed and a dataset consisting of four modalities is constructed for this task. The proposed models are compared with two SOTA methods in the mono-modal case and demonstrate relatively better performances using different image modalities. Our experiment indicates that the MMFN-AL with the combination of two proper modalities reaches the best average AUC. In the future, query strategies are expected to be designed for the specific task, and the ability for accurately discerning stage F1 and F2 needs to be improved according to the clinical requirements.
6 Compliance with Ethical Standards
We claim that we do not have any compliance for this work.
7 Acknowledgments
We would like to thanks the hospital to offer the data, and the doctors for data collection and annotation.
References
- [1] Julien Vergniol, Juliette Foucher, Eric Terrebonne, Pierre-Henri Bernard, Brigitte le Bail, Wassil Merrouche, Patrice Couzigou, and Victor de Ledinghen, “Noninvasive tests for fibrosis and liver stiffness predict 5-year outcomes of patients with chronic hepatitis c,” Gastroenterology, vol. 140, no. 7, pp. 1970–1979, 2011.
- [2] Sukran Kose, Gursel Ersan, Bengu Tatar, Pelin Adar, and Buket Erturk Sengel, “Evaluation of percutaneous liver biopsy complications in patients with chronic viral hepatitis,” The Eurasian journal of medicine, vol. 47, no. 3, pp. 161, 2015.
- [3] Stanislas Pol, J Gennisson, Eric Bavu, Thomas Deffieux, Mathias Fink, Vincent Mallet, and Mickael Tanter, “Non-invasive staging of liver fibrosis with shearwave™ elastography imaging,” Aixplorer Multiwave White Paper, pp. 1–12, 2014.
- [4] Kyu Jin Choi, Jong Keon Jang, Seung Soo Lee, Yu Sub Sung, Woo Hyun Shim, Ho Sung Kim, Jessica Yun, Jin-Young Choi, Yedaun Lee, Bo-Kyeong Kang, et al., “Development and validation of a deep learning system for staging liver fibrosis by using contrast agent–enhanced ct images in the liver,” Radiology, vol. 289, no. 3, pp. 688–697, 2018.
- [5] Koichiro Yasaka, Hiroyuki Akai, Akira Kunimatsu, Osamu Abe, and Shigeru Kiryu, “Deep learning for staging liver fibrosis on ct: a pilot study,” European radiology, vol. 28, no. 11, pp. 4578–4585, 2018.
- [6] Koichiro Yasaka, Hiroyuki Akai, Akira Kunimatsu, Osamu Abe, and Shigeru Kiryu, “Liver fibrosis: deep convolutional neural network for staging by using gadoxetic acid–enhanced hepatobiliary phase mr images,” Radiology, vol. 287, no. 1, pp. 146–155, 2018.
- [7] Alexander Khvostikov, Andrey Krylov, Julius Kamalov, and Alina Megroyan, “Ultrasound despeckling by anisotropic diffusion and total variation methods for liver fibrosis diagnostics,” Signal Processing: Image Communication, vol. 59, pp. 3–11, 2017.
- [8] Rosa MS Sigrist, Joy Liau, Ahmed El Kaffas, Maria Cristina Chammas, and Juergen K Willmann, “Ultrasound elastography: review of techniques and clinical applications,” Theranostics, vol. 7, no. 5, pp. 1303, 2017.
- [9] Kun Wang, Xue Lu, Hui Zhou, Yongyan Gao, Jian Zheng, Minghui Tong, Changjun Wu, Changzhu Liu, Liping Huang, Tian’an Jiang, et al., “Deep learning radiomics of shear wave elastography significantly improved diagnostic performance for assessing liver fibrosis in chronic hepatitis b: a prospective multicentre study,” Gut, vol. 68, no. 4, pp. 729–741, 2019.
- [10] Li-Yun Xue, Zhuo-Yun Jiang, Tian-Tian Fu, Qing-Min Wang, Yu-Li Zhu, Meng Dai, Wen-Ping Wang, Jin-Hua Yu, and Hong Ding, “Transfer learning radiomics based on multimodal ultrasound imaging for staging liver fibrosis,” European radiology, pp. 1–11, 2020.
- [11] Qing Sun, Ankit Laddha, and Dhruv Batra, “Active learning for structured probabilistic models with histogram approximation,” in IEEE International Conference on computer vision and pattern recognition, 2015.
- [12] William H Beluch, Tim Genewein, Andreas Nürnberger, and Jan M Köhler, “The power of ensembles for active learning in image classification,” in IEEE International Conference on computer vision and pattern recognition, 2018.
- [13] Buyu Liu and Vittorio Ferrari, “Active learning for human pose estimation,” in Proceedings of the IEEE International Conference on Computer Vision, 2017, pp. 4363–4372.
- [14] Jie Hu, Li Shen, and Gang Sun, “Squeeze-and-excitation networks,” in Proceedings of the IEEE conference on computer vision and pattern recognition, 2018, pp. 7132–7141.
- [15] Kaiming He, Xiangyu Zhang, Shaoqing Ren, and Jian Sun, “Deep residual learning for image recognition,” in Proceedings of the IEEE conference on computer vision and pattern recognition, 2016, pp. 770–778.
- [16] Jia Deng, Wei Dong, Richard Socher, Li-Jia Li, Kai Li, and Li Fei-Fei, “Imagenet: A large-scale hierarchical image database,” in 2009 IEEE conference on computer vision and pattern recognition. Ieee, 2009, pp. 248–255.
- [17] Christoph Feichtenhofer, Axel Pinz, and Andrew Zisserman, “Convolutional two-stream network fusion for video action recognition,” 2016.