A kpc-scale resolved study of unobscured and obscured star-formation activity in normal galaxies at z = 1.5 and 2.2 from ALMA and HiZELS
Abstract
We present Atacama Large Millimeter/Submillimeter Array (ALMA) continuum observations of a sample of nine star-forming galaxies at redshifts 1.47 and 2.23 selected from the High- Emission Line Survey (HiZELS). Four galaxies in our sample are detected at high significance by ALMA at a resolution of at rest-frame 355 m. Together with the previously observed H emission, from adaptive optics-assisted integral-field-unit spectroscopy ( resolution), and F606W and F140W imaging from the Hubble Space Telescope ( resolution), we study the star-formation activity, stellar and dust mass in these high-redshift galaxies at kpc-scale resolution. We find that ALMA detection rates are higher for more massive galaxies ( M⊙) and higher [N ii]/H ratios (, a proxy for gas-phase metallicity). The dust extends out to a radius of 8 kpc, with a smooth structure, even for those galaxies presenting clumpy H morphologies. The half-light radii () derived for the detected galaxies are of the order 4.5 kpc, more than twice the size of submillimetre-selected galaxies at a similar redshift. Our global star-formation rate estimates — from far-IR and extinction-corrected H luminosities — are in good agreement. However, the different morphologies of the different phases of the interstellar medium suggest complex extinction properties of the high-redshift normal galaxies.
keywords:
galaxies: ISM – submillimetre: galaxies – galaxies: starburst – galaxies: star formation1 Introduction
Observations of star-formation activity are critically important to tackle open questions relating to galaxy formation and evolution. The most direct view of cosmic star-formation history comes from observing ultraviolet (UV) photons from the young massive stars. However, part of this radiation is absorbed by dust, and the higher UV-energy photons are absorbed by neutral hydrogen. Gas ionised by this radiation eventually recombines, producing emission lines such as Ly and H, which have been used historically to estimate the star-formation rate (SFR, e.g., Sobral & Matthee, 2019). Where the star-formation activity is shielded by gas and dust, the ionising photons may get absorbed and re-radiated at far-infrared (FIR) wavelengths by dust. Therefore, the rest-frame FIR emission is used to trace dust-obscured star formation in galaxies, and to derive total SFRs in combination with tracers of unobscured emission (e.g. Kennicutt, 1998; Kennicutt et al., 2012).
Different ways to estimate the SFR in galaxies have their own limitations and biases. For example, the H recombination line is generated originally by the photo-ionising radiation from massive stars ( M⊙), or AGN, and is therefore sensitive to recent star formation, within 10 Myr, and has modest sensitivity to dust obscuration. The UV flux ( Å), on the other hand, comes from young, massive stars but is also emitted by older 10–100 Myr stars (Kennicutt et al., 2012), and is very sensitive to dust obscuration. The FIR emission produced by heated dust grains comes from young star-forming regions but in lower luminosity sources, it can also arise from dust heated by older stellar populations. Spatially-resolved observations of local galaxies show that all of these SFR tracers are strongly correlated on kpc scales (e.g., Boquien et al., 2016).
Previous observations of high-redshift galaxies have shown that their star-formation activity — as traced by UV or H emission — presents bright, clumpy star-forming complexes that could be up to more massive than those seen in local galaxies (e.g., Genzel et al., 2006, 2008; Förster Schreiber et al., 2006, 2009, 2018; Shapiro et al., 2008; Swinbank et al., 2012a, b). However, it may be that regions with fainter H and UV emissions are affected by significant dust obscuration. Previous work has shown that dust attenuation causes the SFR derived from different indicators to be inconsistent (Swinbank et al., 2004; Katsianis et al., 2017), thus it is essential to have a spatially resolved view of the ionised gas and the dust content in order to characterise the total SFR (unobscured and obscured), especially for high-redshift galaxies.
| Source List | Project ID | Observation | Flux | Bandpass | Phase | P.W.V. | Number of | Band ( /GHz) | Time on |
| Date | Calibrator | Calibrator | Calibrator | (mm) | antennas | Target (min) | |||
| SHiZELS-8 | 2012.1.00402.S | 6 Nov. 2013 | Uranus | J2148+0657 | J0215-0222 | 3.9 | 29 | 7 (344) | 52 |
| 29 Nov. 2013 | Uranus | J0334-4008 | J0215-0222 | 1.3 | 26 | 43 | |||
| 29 Nov. 2013 | J0423-013 | J0334-4008 | J0215-0222 | 1.0 | 26 | 43 | |||
| SHIZELS-7 | 2013.1.01188.S | 11 Aug. 2015 | Ceres | J0006-0623 | J0208-0047 | 0.9 | 43 | 7 (344) | 28 |
| SHiZELS-21 | 29 Aug. 2015 | J0334-401 | J0006-0623 | J0219+0120 | 1.5 | 37 | 6 (261) | 30 | |
| SHiZELS-2 | 29 Aug. 2015 | J0238+166 | J0224+0659 | J0219+0120 | 1.4 | 37 | 6 (261) | 30 | |
| SHIZELS-3 | 2015.1.00026.S | 28 Jul. 2016 | J1058+0133 | J1058+0133 | J0948+0022 | 0.6 | 37 | 6 (261) | 26 |
| SHIZELS-9 | 16 Jul. 2016 | J0238+1636 | J0238+1636 | J0217+0144 | 0.4 | 38 | 7 (344) | 43 | |
| SHIZELS-10 | 26 Jul. 2016 | J0238+1636 | J0238+1636 | J0217+0144 | 0.4 | 38 | 7 (344) | 43 | |
| SHIZELS-11 | 26 Jul. 2016 | J0238+1636 | J0238+1636 | J0217+0144 | 0.6 | 45 | 7 (344) | 43 | |
| 10 Aug. 2016 | J0006-0623 | J0006-0623 | J0217+0144 | 0.2 | 42 | 43 | |||
| 10 Aug. 2016 | J0238+1636 | J0238+1636 | J0217+0144 | 0.2 | 39 | 43 | |||
| SHIZELS-14 | 2 Aug. 2016 | J1058+0133 | J1058+0133 | J0948+0022 | 0.7 | 39 | 6 (261) | 26 |
The High- Emission Line Survey (HiZELS, Sobral et al., 2012, 2013, 2015; Geach et al., 2008) was designed to study ‘normal’ star-forming galaxies selected in narrow redshift slices at 0.4, 0.84, 1.47 and 2.23 via the identification of H emission using near-infrared (near-IR) narrow-band filter imaging in extragalactic survey fields including the Subaru-XMM Deep Field / UKIDSS Ultra Deep Survey (UDS, Lawrence et al., 2007) and the Cosmological Evolution Survey (COSMOS, Scoville et al., 2007) fields. The HiZELS survey detects thousands of emission-line objects, samples the ‘typical’ galaxy population (Oteo et al., 2015; Cochrane et al., 2018), following the so-called ‘main sequence’ for star-forming galaxies at 1.47 and 2.23 (Gillman et al., 2019), and probing below the knee of the H luminosity function () at these redshifts ( at and at , Swinbank et al., 2012a; Cochrane et al., 2017). Over thirty galaxies from HiZELS have also been mapped in the follow-up near-IR using integral field unit (IFU) spectroscopy (the ‘SHIZELS’ sample) aided by adaptive optics (AO), with the Spectrograph for INtegral Field Observations in the Near Infrared (SINFONI) at the Very Large Telescope (VLT) or the Near-Infrared Integral Field Spectrometer (NIFS) at Gemini-North (Swinbank et al., 2012a, b; Molina et al., 2017; Gillman et al., 2019). These observations provide H IFU imaging at 1 kpc scales for galaxies at 1.47 or 2.23.
In this work, we make use of the available AO-aided IFU data and the Hubble Space Telescope (HST) F606W, F140W data, together with new Atacama Large Millimeter/submillimeter Array (ALMA) observations targeting the continuum emission at submillimetre wavelengths at similar spatial resolution (synthesised beam of full width half maximum), to characterise the spatial correlation between the the H/UV and dust emission of high-redshift 1.47 and 2.23 galaxies (the ‘ALMA-SHiZELS’ sample). The combination of the AO-aided IFU H data, HST data and the ALMA observations provides a unique opportunity to characterise the spatial correlation between the SFR tracers around the peak of cosmic star formation. We describe our observations, data reduction and analysis in Section 2. In Section 3, we present the results and discussion, and summarise in Section 4. Throughout this work, we assume a CDM cosmology with = 70 , , , where corresponds to a physical scale of 1.3 kpc at both and 2.23.
2 Observations and data reduction, and analysis
2.1 ALMA observations
Nine SHiZELS galaxies were observed with ALMA during Cycle 2, 3, 4 (projects 2012.1.00402.S, 2013.1.01188.S and 2015.1.00026.S; P.I.: E. Ibar) in Bands 6 or 7, depending on whether the galaxies were at or 1.47, respectively, corresponding to rest-frame 355m. The observations were designed to detect continuum emission using four spectral windows (SPWs), each covering an effective bandwidth of 1.875 GHz at a spectral resolution of 15.6 MHz. Observations were taken under relatively good weather conditions with precipitable water vapour (P.W.V.) ranging from 0.2 mm to 3.9 mm, and using 29 to 45 antennas (the earlier the cycle, the smaller the number) with the longest baselines spanning 1.0–1.5 km. The phase, bandpass and flux calibrators for all observations used in this work are listed in Table 1.
Data reduction was carried out using the Common Astronomy Software Applications (casa) and using the ALMA pipeline up to the production of calibrated data products. Three imaging approaches were performed using the task tclean, exploring a Briggs weighting (robust=0.5), natural weighting, and tapering such that we created a synthesized beam of (see Figs 8, 9). In all cases, the signal is interactively cleaned down to 2–3 (r.m.s. 25Jy beam-1) in regions with significant emission at the source position. The astrometric accuracy of the ALMA Band-7 image is around 1.5 mas. Information about each target is presented in Table 2.
Sources SHiZELS-7, SHiZELS-9, SHiZELS-11 and SHiZELS-14 were detected by ALMA at a significance higher than 5 in at least one of the three imaging approaches, while SHiZELS-21, SHiZELS-8, SHiZELS-10, SHiZELS-2 and SHiZELS-3 remained undetected, regardless of the imaging approach.
Within the field of view (FoV) of SHiZELS-7 and SHiZELS-10, we identify two serendipitous detections. We denote them as SHiZELS7-ID2 and SHiZELS10-ID2 and their properties are listed in Appendix D.
| ID | R.A. (J2000) | Dec. (J2000) | (mJy) | (kpc) | (kpc) | ||||||
|---|---|---|---|---|---|---|---|---|---|---|---|
| SHiZELS-7 | 02:17:00.34 | 05:01:50.6 | 1.455 | 42.1 | 0.15 0.03 | 10.5 0.4 | 10.4 0.2 | 1.60.3 | 0.80.5 | 3.7 0.3 | 4.3 0.4 |
| SHiZELS-9 | 02:17:12.99 | 04:54:40.7 | 1.462 | 42.4 | 0.51 0.06 | 11.2 0.4 | 10.6 0.1 | 1.90.2 | 1.00.3 | 4.9 0.3 | 4.8 0.4 |
| SHiZELS-11 | 02:18:21.23 | 05:02:48.9 | 1.492 | 42.3 | 1.34 0.14 | 11.6 0.4 | 11.5 0.1 | 1.70.1 | 0.80.1 | 5.2 0.4 | 4.3 0.5 |
| SHiZELS-14 | 10:00:51.58 | 02:33:34.1 | 2.242 | 42.9 | 2.31 0.23 | 12.6 0.3 | 11.1 0.1 | 2.60.2 | 1.50.2 | 4.7 0.3 | 4.1 0.4 |
| SHiZELS-10 | 02:17:39.02 | 04:44:41.4 | 1.447 | 41.9 | < 0.11 (5) | <11.3 (5) | 10.1 0.1 | 2.00.2 | 1.40.2 | – | – |
| SHiZELS-8 | 02:18:20.96 | 05:19:07.5 | 1.460 | 42.2 | < 0.12 (5) | <11.2 (5) | 10.3 0.1 | 1.90.2 | 1.40.4 | – | – |
| SHiZELS-2 | 02:19:25.50 | 04:54:39.6 | 2.223 | 42.3 | < 0.12 (5) | <11.9 (5) | 9.9 0.2 | 1.40.3 | 0.30.3 | – | – |
| SHIZELS-3 | 10:00:27.69 | 02:14:30.6 | 2.225 | 42.4 | < 0.10 (5) | <11.8 (5) | 9.0 0.1 | 0.90.2 | 0.20.1 | – | – |
| SHIZELS-21 | 02:16:45.82 | 05:02:45.0 | 2.237 | 42.6 | < 0.12 (5) | <11.8 (5) | 9.8 0.1 | 1.60.2 | 1.20.3 | – | – |
2.2 Global astrometry
One of the main challenges when analysing multi-wavelength high-resolution spatially-resolved observations is the global astrometric accuracy. In particular, IFU observations with a small FoV (as obtained with SINFONI, which has a FoV of about ) present a global astrometric uncertainty which is larger than the resolution elements of the observations, therefore they are difficult to anchor to other observations at high-resolution. For this reason, we perform the following astrometric corrections to analyse our data.
Firstly, we align the astrometry of the HiZELS narrow-band images by the public Gaia DR2 catalogue. The offset between the HiZELS catalogue generated by SExtractor and the Gaia catalogue is corrected to and . We degrade the resolution of the H moment-0 SINFONI image down to using a Gaussian kernel to get a similar resolution to the HiZELS narrow-band images. Then we fit a Gaussian profile to this low-resolution image in order to obtain the position of the peak, identify the offset with respect to the narrow-band image, and use this information to correct the astrometry of the IFU image.
As mentioned before, we have also used the available HST F606W and F140W observations 111HST proposal ID: 14719, P.I.: P. Best. The HST FoV is about , which is too small to apply a reliable astrometric correction using Gaia DR2. Therefore, we correct the global astrometry of the HST images using the HSC DR2 catalogue available in our fields (Aihara et al., 2019). The 5 limiting magnitude within diameter apertures of the HSC -band catalogue is 26.7 AB mag, which is similar to the HST images, and deep enough to have about 200 high-S/N sources for the alignment. The astrometric accuracy of HSC DR2 catalogue derives from the Gaia DR2 catalogue (Aihara et al., 2019). We match the HST and HSC catalogues for the offsets of R.A., Dec., and correct the astrometry of the HST image. After our astrometric correction, the catalogue match between HST and HSC catalogues is consistent with an offset of zero, with systematic errors of .
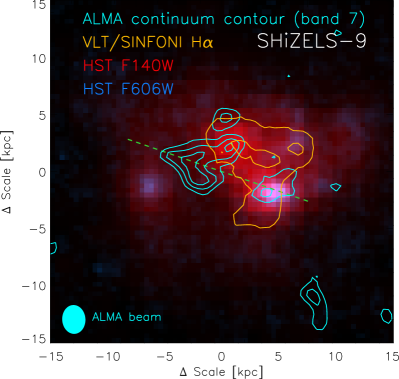
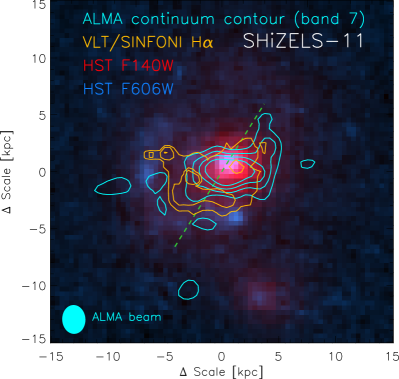
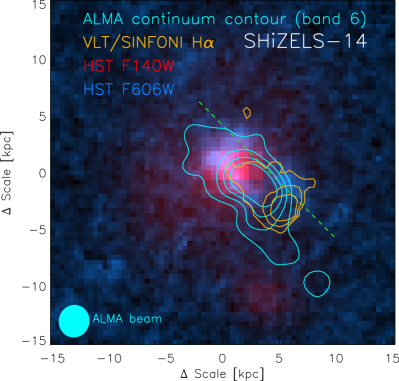
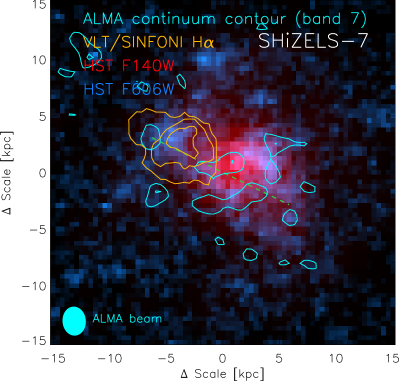
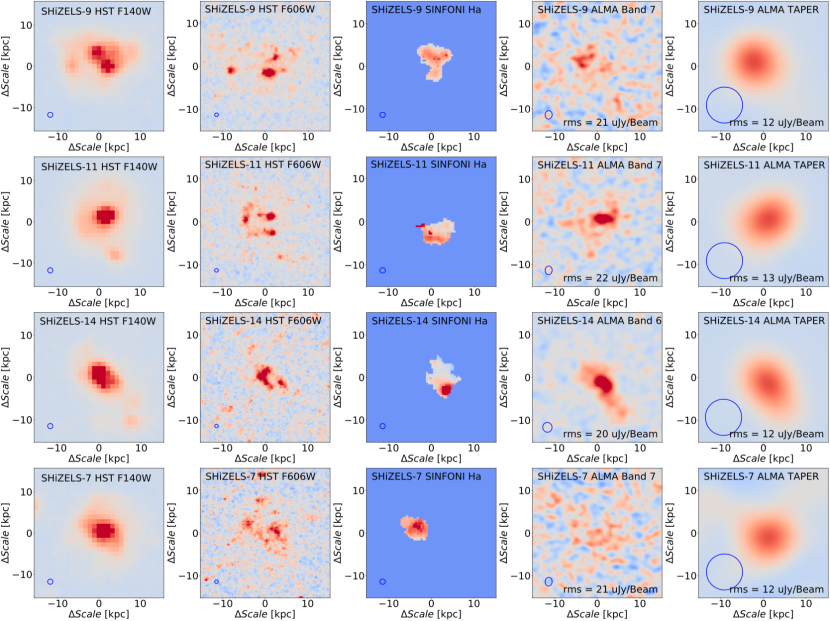
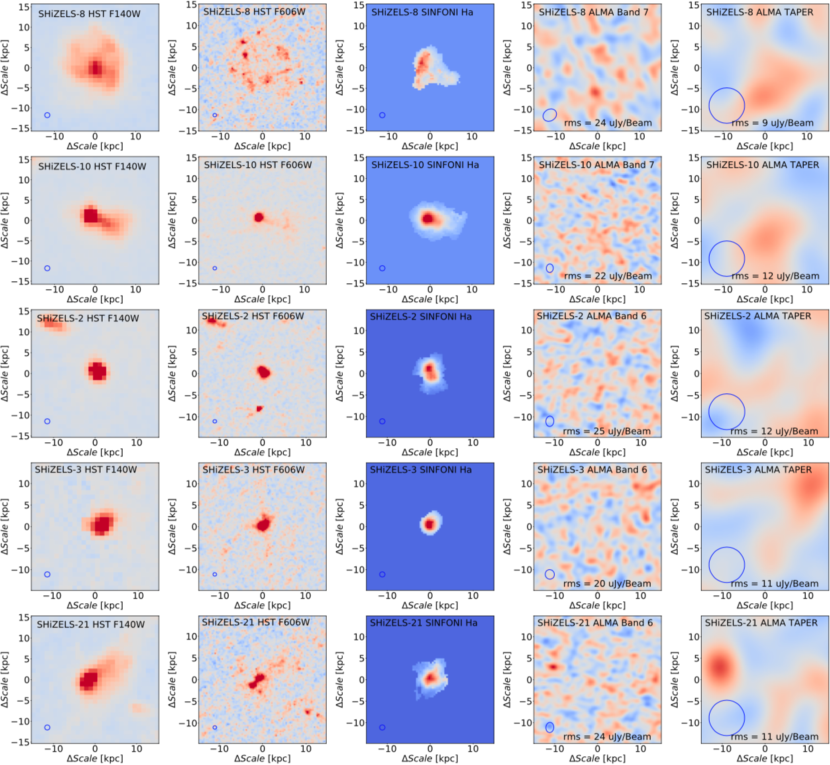
In Fig. 1, we show the true-colour image composite from HST F606W (in blue) and F140W (in red) images, including ALMA continuum contours in levels of , , , for the four ALMA-detected galaxies. The galaxy centres revealed by HST more or less coincide with the ALMA imaging. The observations reveal a complex state for the interstellar medium in SHiZELS galaxies at 1.47 and 2.23. We show multi-wavelength postage stamps of the HST, H (Gillman et al., 2019) and our ALMA images for each of the galaxies presented in this work in Figs 8 and 9.
| ID | [N ii]/H | 12+log(O/H) | ||||||
|---|---|---|---|---|---|---|---|---|
| SHiZELS-7 | 0.43 0.05 | 8.79 0.11 | 69 24 | 9.65 0.05 | 7.8 0.2 | 7.5 0.2 | 7.40.2 | -3.2 0.3 |
| SHiZELS-9 | 0.27 0.03 | 8.64 0.11 | 97 30 | 10.17 0.04 | 8.2 0.1 | 8.1 0.2 | 7.90.1 | -2.9 0.2 |
| SHiZELS-11 | 0.60 0.10 | 8.87 0.12 | 57 21 | 10.59 0.06 | 8.8 0.2 | 8.5 0.2 | 8.60.1 | -2.3 0.3 |
| SHiZELS-14 | 0.60 0.05 | 8.87 0.11 | 57 21 | 11.19 0.06 | 9.4 0.2 | 8.8 0.1 | 9.00.1 | -2.1 0.2 |
| SHiZELS-10 | 0.13 0.04 | 8.47 0.17 | 143 37 | 7.3 | 7.4 | 8.00.5 | -2.1 0.5 | |
| SHiZELS-8 | 0.1 | 8.42 | 264 | – | – | 7.4 | 8.00.5 | -2.3 0.5 |
| SHiZELS-2 | 0.12 0.01 | 8.45 0.11 | 150 38 | 7.7 | 7.6 | 7.30.6 | -2.5 0.6 | |
| SHiZELS-3 | 0.03 0.01 | 8.13 0.29 | 310 52 | 7.3 | 7.5 | 6.30.6 | -2.7 0.6 | |
| SHiZELS-21 | 0.23 0.04 | 8.60 0.16 | 106 32 | 7.9 | 7.6 | 7.60.5 | -2.1 0.5 |
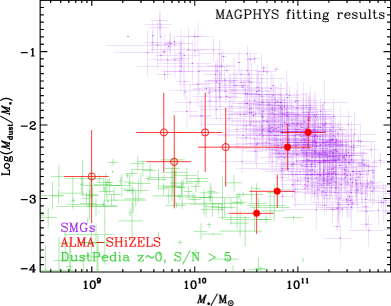
2.3 MAGPHYS fitting with ALMA flux
SEDs of the SHiZELS sample were previously fitted using MAGPHYS (da Cunha et al., 2008) in Gillman et al. (2019). The ALMA detected fluxes of the ALMA-SHiZELS galaxies can help to constrain the FIR properties. Therefore, we re-fit the SEDs of the four ALMA detected galaxies including the FIR flux we obtained in this work, and list the main results in Table 2 and 3. For the ALMA non-detected galaxies, we list the dust mass given by MAGPHYS from fitting the optical-to-NIR SEDs. The stellar mass and dust mass show reasonable consistencies from the different approach.
We show the dust-to-stellar mass ratio () in Fig. 2 and compare our results with the local galaxies from Dustpedia (Clark et al., 2018; Casasola et al., 2020). The only ULIRG in our sample, SHiZELS-14, has a larger than the local galaxies, while this value is consistent with the typical value of in SMGs at redshift about 2 (Calura et al., 2017). The rest targets of our sample all have consistent or 1 higher ) values as the local galaxies, even for the targets with no ALMA detection.
2.4 Global SFRs from H and FIR emission
To estimate the FIR luminosity (and SFRFIR) using the ALMA observations (rest-frame continuum at 355 m), we assume a FIR SED template based on previous stacking analyses for HiZELS galaxies at (Ibar et al., 2013) and 2.23 (Thomson et al., 2017). Thanks to the rich multi-wavelength coverage, the stellar masses of the HiZELS galaxies can be estimated reasonably well (see Sobral et al., 2014; Gillman et al., 2019). For the purpose of this work, for the targets, we adopt the stacked SEDs derived by Ibar et al. (2013) in the stellar mass bins of and . For galaxies at , we consider the FIR template presented in Thomson et al. (2017).
We fit each FIR template SED following the modified-blackbody fitting method described by Beelen et al. (2006), assuming a fixed power-law index for the dust emissivity, . The fitting results show a dust temperature of about 25 1 K for targets and 32 2 K for the targets, similar to previous measurements of luminous IR galaxies at high redshift (Hwang et al., 2010; Oteo et al., 2017; Liang et al., 2019). To estimate FIR luminosities, we normalise the assumed SED to the observed ALMA flux densities. We derive dust masses following the method presented in Beelen et al. (2006), finding values in the range of M⊙. From Table 3 we can see that the dust masses derived from SED fitting and the MAGPHYS are consistent. For the galaxies with no ALMA detection, we use global upper limits using the r.m.s. of the tapered image.
Uncertainties for the FIR properties come from the SED fitting, FIR flux measured from ALMA results, and template assumption. We expect dust-temperature uncertainties for galaxy templates for M⊙ galaxies of about 5 K (see the Fig. 5 in Ibar et al., 2013), which leads to a systematic uncertainty in L of about 0.3 dex. We run a Monte-Carlo simulation to sample the dust temperature, assuming a Gaussian distribution centred at from the FIR SED templates, and a scatter K. We also sample the ALMA flux density (or flux density limit) from a Gaussian distribution centred at the measured flux density with the observed scatter. Then we derive and , and their r.m.s. scatter, such that the scatter of includes the uncertainty in and ALMA flux density. Since we only have one detected FIR band for most sources, we cannot sensibly adopt a more complex model to understand the FIR properties.
The obscured SFR, as derived from the observed FIR emission, can be estimated by Kennicutt et al. (2012):
| (1) |
assuming a Chabrier initial mass function (IMF; Chabrier, 2003).
On the other hand, to correct the flux observed from the narrow-band H imaging for dust extinction, we assume a parametrisation of the H extinction as a function of stellar mass following Garn & Best (2010):
| (2) |
where . This correlation between H extinction and stellar mass has also been confirmed by Sobral et al. (2012), Koyama et al. (2019) and Qin et al. (2019). Using the stellar masses presented by in Table 2, we derive the extinction-corrected H luminosity () to obtain the SFR:
| (3) |
assuming the same Chabrier IMF.
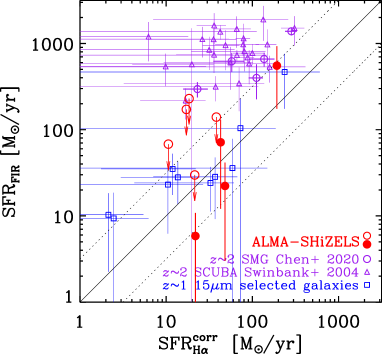
A comparison between these two SFR estimates is shown in Fig. 3.
Previous studies of the SFR from FIR and H show that SMGs at have much larger SFRFIR than SFR (Swinbank et al., 2004; Chen et al., 2020).
Due to the sensitive H selection of our HiZELS parent sample, our sample comprises more typical ‘main sequence’ galaxies, and is not limited to the most dusty starbursts. Only one of the ALMA-SHiZELS galaxies has FIR-derived SFR above 100 M. It is therefore not surprising that the SFRs derived from H and FIR emission are more similar for our sample than for literature SMGs.
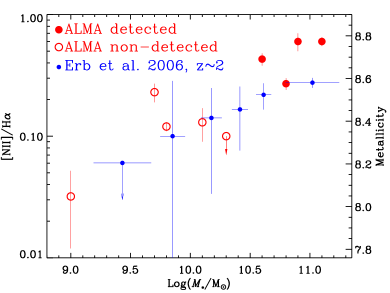
2.5 The role of stellar mass and gas-phase metallicity
We consider the gas-phase oxygen abundance as a proxy for metallicity, and estimate it from the [N ii]/H emission line ratio (Pettini & Pagel, 2004; Curti et al., 2017) from the near-IR IFU spectroscopy (see Table 3). The SHiZELS population has mainly Solar to sub-Solar values (Swinbank et al. 2012b; Molina et al. 2017). We show the mass-metallicity relation of our ALMA-HiZELS sample in Fig. 4 and identify the ALMA-detected and non-detected targets. We show the mass-metallicity relation at redshift from Erb et al. (2006) as a comparison. In our observations, we find that the lower the metal content or stellar mass, the weaker the ALMA continuum emission. Indeed, all of the ALMA-detected galaxies have [N ii]/H or , corresponding to 12+log(O/H) . The typical [N ii]/H emission line ratio for galaxies at ranges from 0.03 to 0.3 (Strom et al., 2017), thus our ALMA-detected sample is indeed biased towards massive and high-metallicity galaxies. As expected, dust continuum is more easily detected for a galaxy with higher stellar mass or metallicity.
The ALMA detected targets have stellar mass values about one order of magnitude higher than the ALMA non-detected targets. Since the SFR of the ALMA-SHiZELS sample is in the range of 10 to 100 M⊙ yr-1 (within one order of magnitude; Gillman et al., 2019), the ALMA detected targets in this work mainly have low specific SFR compared to the rest of the SHiZELS sample.
Using the metallicity measurements, we can also derive the gas-to-dust mass ratio () following Magdis et al. (2012): . We estimate ISM mass using the ALMA-derived 355 m flux, following Scoville et al. (2016) (Eq 16). Our derived dust masses are presented in Table 3. As shown there, these estimates are in good agreement with the values derived from SED fitting.
2.6 Dust radius of the ALMA detected targets
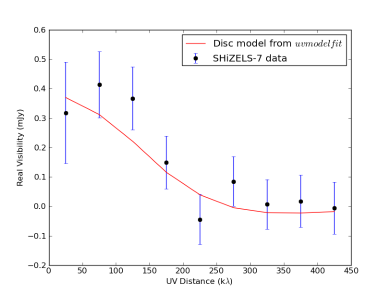
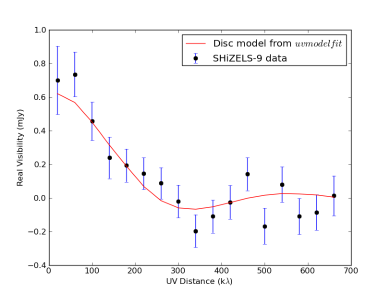
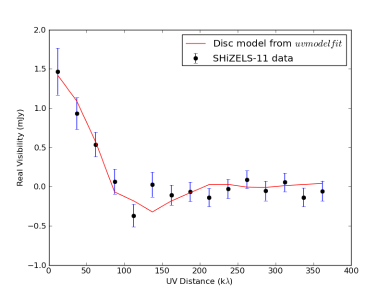
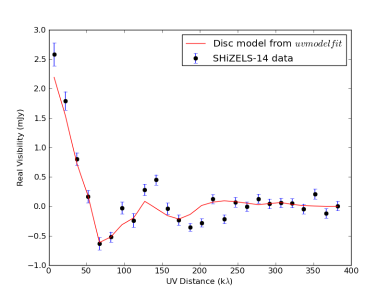
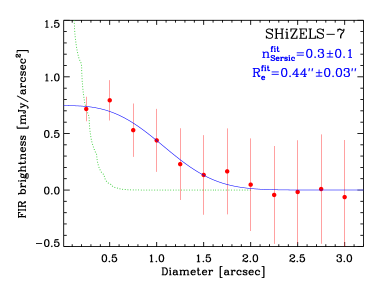
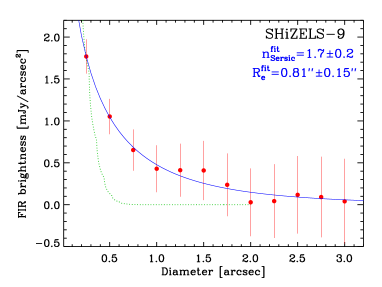
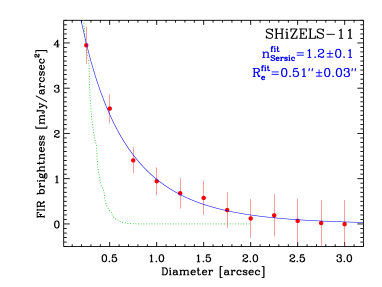
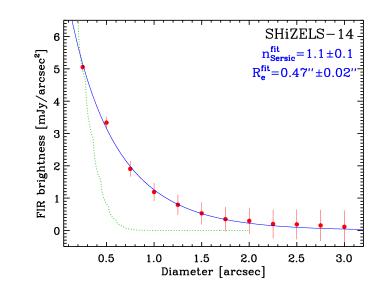
To estimate the dust radius, we fit the -real visibility of the ALMA detected targets by casa task uvmodelfit, and show the results in Fig. 5. We chose the model in uvmodelfit to fit the profile. The circularised radius of our targets are shown in Table 2. Since the FIR morphology is not regular, and thus the disk fitting results may not represent the flux distribution, we also measure the half-light radius () of the ALMA images from the surface brightness distribution in the image plane and show the results in Table 2. The FIR surface brightness profiles in real plane are also fitted by Sérsic function and can be found in Section B. The different approaches adopted for the measurements of the dust radii all show that the radii are 4-5 0.5 kpc, larger than the typical size of the high-redshift SMGs (Ikarashi et al., 2015; Simpson et al., 2015; Fujimoto et al., 2017). Dust emission from the four ALMA-detected galaxies is found to extend up to ( kpc, Fig. 10).
3 Results and discussion
3.1 Individual galaxy properties
Figs 1 and 8 and 9 show the HST, SINFONI and ALMA images of our SHiZELS sample. For the galaxies at redshift about 1.47 and 2.23, the HST F606W filter corresponds to rest-frame 2400 Å and 1800 Å, therefore these images are tracing mainly the detectable UV emission, i.e. the star formation that is not obscured by the dust. On the other hand, the observed HST F140W image reveals the rest-frame or band morphology (free of strong line emission), which is more sensitive to stellar mass. Thus Figs 1, 8 and 9 show proxies for the stars (F140W), UV-traced star formation (F606W), H-traced star formation (SINFONI), and dust mass distributions (ALMA). In this section, we describe properties of our ALMA-detected targets individually222Most of our targets have two versions of the H maps (Swinbank et al., 2012a; Gillman et al., 2019). The main difference in the H morphology is caused by the different S/N criteria to create the H maps. Gillman et al. (2019) built H maps with high S/N spectra while the results in Swinbank et al. (2012a) use all the available spectra, which would then trace more extended H emission..
We caution that morphological information derived from the rest-frame UV/optical can be potentially very misleading in sources with substantial dust extinction and on-going star formation and in particular it is difficult to trace the true stellar mass (see Lang et al., 2019).
-
•
SHiZELS-7: The H kinematics reveal the presence of an extended disc-like rotating structure. Two H star-forming clumps, separated by 4 kpc, are identified by Swinbank et al. (2012a), although the fainter clump is not seen in Gillman et al. (2019) because of the different S/N criteria. The FIR continuum is spread over a diffuse structure. The two H clumps are not likely to be affected by significant dust obscuration, so there might be no massive dust and gas clouds associated with the H features. The HST F140W and F606W images show that the least obscured regions in this galaxy show a compact stellar core and a extended UV morphology.
-
•
SHiZELS-9: shows an extended rotation-dominated structure in H with three bright clumps (separated by 3 kpc, Swinbank et al., 2012a). The FIR continuum shows a V-like structure in the central 3 kpc, linking a bright stellar core with a fainter one. A third stellar core shows both UV and FIR emission.
-
•
SHiZELS-11: This source was classified as a disk galaxy with a compact H structure (Swinbank et al., 2012a); although a newer analysis shows a marginally extended morphology (Gillman et al., 2019). SHiZELS-11 has an active galactic nucleus (AGN) identified in the X-rays by XMM-Newton and in the radio by the Very Large Array (VLA — Simpson et al., 2006; Ueda et al., 2008). SHiZELS-11 is also detected by Chandra in X-UDS survey (Kocevski et al., 2018), with X-ray luminosity is erg . The velocity dispersion of H is about 90 km s-1 (Gillman et al., 2019), much less than the typical velocity dispersion of type-I AGN, implying that the AGN in SHiZELS-11 must be obscured. Rotation is not clear from the H dynamics, and the position of the maximum velocity dispersion is offset from the brightest H pixel (Gillman et al., 2019). The HST F140W image shows a smaller source to the south, which may suggest a close merger or dust lane. The source has an apparently high metallicity and a steep metallicity gradient (Swinbank et al., 2012a), which might be due to contamination from an AGN. Both UV and FIR are bright in the galaxy centre, while the rest-frame optical is mainly coming from a clumpy structure surrounding the centre. The ALMA continuum shows compact and extended emission, which does not overlap with the H.
-
•
SHiZELS-14: This galaxy has been identified as a merger with three H clumps separated by 5 kpc (Swinbank et al., 2012b). The H morphology in Gillman et al. (2019) is less clumpy, but still extends to a half-light radius of about 7 kpc (Sersic model fitting results). The H kinematics show a velocity-dispersion-dominated system. The galaxy has the highest metallicity in the SHiZELS sample of Swinbank et al. (2012a). The full extent of the H emission is not traced by the rest-frame UV imaging. The ALMA continuum emission shows one dominant compact component at the centre, and more extended emission following a similar orientation as the F140W morphology. The FIR emission spreads up to , i.e. 16 kpc at . This target is comprehensively studied by Cochrane et al. (in preparation), including new Jansky VLA data.
3.2 Spatially resolved properties
3.2.1 The dust emission from & 2.23 galaxies
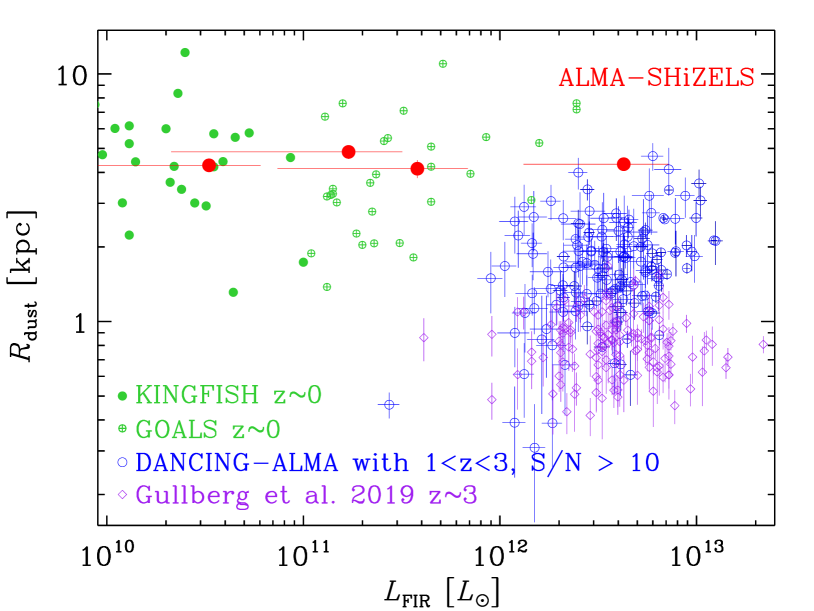
Previous sub-millimetre studies of high-redshift galaxies at high spatial resolution have revealed that clumps at 1 kpc scales do not particularly dominate the total flux emission, as is often seen in UV or H imaging (Hodge et al., 2019). For example, Hodge et al. (2016) used ALMA to observe a sample of submillimeter galaxies (SMGs) at resolution and found that the observed 870m continuum morphologies are predominantly smooth and disc-like with typical radii of kpc. Gullberg et al. (2019) also shows that dust emission size from SMGs is about kpc at 1–4, with a larger sample.
Although these previous studies have revealed the internal properties of the brightest SMGs, our focus is on the normal star forming galaxy population (i.e. galaxies selected by H flux, with many having Swinbank et al., 2012a) at high redshift. We find that our sample shows sub-millimetre continuum emission which is more extended than that seen in SMGs at . In the local universe, it is well known that ULIRGs present compact star-formation cores, which may eventually lead to a compact stellar core. The large FIR radius of our ALMA-HiZELS observations reveal the existence of a high-redshift galaxy population with extended star-formation activity at or 2.23, possibly sustained in thick rotating disc-like structures.
In Fig. 6 we compare our results to previous spatially resolved FIR studies. For the galaxies at and , the Key Insights on Nearby Galaxies: a Far Infrared Survey with Herschel project (KINGFISH; Kennicutt et al., 2011) surveys have found a typical radius of about 4 kpc with predominately disc-like morphologies (Mosenkov et al., 2019). For isolated LIRGs taken from the Great Observatories All-sky LIRG Survey (GOALS, Armus et al., 2009; Chu et al., 2017) we also find relatively large FIR sizes, similar to those from KINGFISH. To have enough spatial resolution, we measure the GOALS galaxy FIR size based on the Herschel PACS 160m image. The difference between the FIR radius in 160m and 350m is about 1.5 times or less (Mosenkov et al., 2019), which will not affect our results. Some of the LIRGs in GOALS sample are galaxy pairs or merging galaxies. To avoid the contamination from the neighbours, we only make use of the isolated galaxy sample here.
On the other hand, Demonstrating a New Census of Infrared Galaxies with ALMA (DANCING-ALMA, Fujimoto et al., 2017) project presents 1000 galaxies ( mainly ULIRGs) resolved by ALMA at 1 mm and finds a positive correlation between the radius and (in Fig. 6 we only chose , galaxies). The recent work by Gullberg et al. (2019) shows compact FIR emission for 150 SMGs, when the IR luminosity of the galaxy exceeds .
Our ALMA-SHiZELS sample is different from the previous luminous high redshift dusty populations as we are targeting a much fainter population. As shown in Fig. 6 and Tab. 2, our sample has typically lower IR luminosity, larger dust size than the high-redshift SMGs, which suggests that our survey are targeting the high-redshift star-forming galaxy population, rather than the high-redshift starburst galaxies.
The extension of the dust emission () could be roughly estimated from a theoretical point of view, assuming , where is the Stefan-Boltzmann constant, and the dust temperature () and are derived from SED templates (see § 2.4; Ma & Yan 2015; Yan & Ma 2016; Dudzevičiūtė et al. 2020). This effective radius can be considered as the lower size limit of the galaxy FIR emitters, hence the difference with respect to the half-light radius could be understood as the spatial occupation of dust structures below the resolution elements. Using this equation, we derive effective radii for our SHiZELS galaxies of 0.3–1.1 kpc, much smaller than the observed half-light radii of about 4.5 kpc, implying typical dust filling factors from 5 to 10 for our sample. Hodge et al. (2019) have found that at 500 pc resolution they can see tentative evidence of the spiral and bar structures of SMGs () at 250 m (rest-frame). Subject to surface brightness limitations, higher resolution ALMA imaging might reveal similarly complex structures in our galaxies.
3.2.2 Spatial correlation between dust and ionised gas
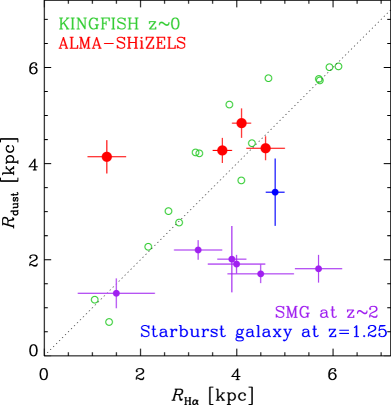
The observed morphologies of dust and H emissions are well known to be correlated (at kpc scales) for samples of local star-forming galaxies, such as the KINGFISH project (Kennicutt et al., 2011). In the left panel of Fig. 7 we show that if we compare the half-light radii measured by ALMA with respect to the H emission, we see good agreement for sources SHiZELS-7, -9 and -14, suggesting spatial coexistence (at kpc scales) of the dust and the ionised gas. In contrast, the source presenting an AGN, SHiZELS-11, shows a significantly larger FIR radius than that seen in H.
We compare our results to the recent high resolution ALMA and H observations of a sample of SMGs (Chen et al., 2020) and one starburst galaxy (Nelson et al., 2019) in the left-hand panel of Fig. 7. We find that our sample has a similar H radius to previously observed SMGs, suggesting extended star formation for these high-redshift galaxies. Despite this agreement, the dust emission from SMGs is typically more compact than our galaxies (Gullberg et al., 2019). The starburst galaxy in Nelson et al. (2019) has a dust radius higher than the SMGs, but still lower than our sample.
Although the SHiZELS sample shows a larger dust radius than the SMGs and starburst galaxy, most of the high-redshift galaxies in Fig. 7 have similar H radius of about 4 kpc. So the SMGs appear also to have an extended star formation region, as well as a compact dusty core in the galaxy center (e.g., Fig. 6). SMGs may obscure H emission especially in the center kpc region, so the H distribution in the SMG center might be more flatter, leading to a larger H half-light radius. Since H in SMGs can be bright and extended (Swinbank et al., 2004, 2006), while the dust morphology is compact (Rujopakarn et al., 2019; Chen et al., 2020), the large dust radii we observe in ALMA-SHiZELS sample may caused by the low SFR () of the SHiZELS sample, rather than with the H-selection method.
The strong dust extinction in SMGs may also affect the H emission such that the SFR derived from H is lower than the SFRFIR (Fig. 3), even though both SFR indicators may only reflect one aspect of the star formation and may still lower than the intrinsic SFR in galaxies.
The SHiZELS sample was selected on H, down to a flux limit that traces below the knee of the luminosity function, and therefore the bulk of the sample will be less dusty than submm selected galaxies. Our results show that the SHiZELS galaxies have very similar dust and H radii as the star-forming galaxies from KINGFISH at low redshift (Fig. 6 and 7). In the low-redshift universe, most of the star-forming galaxies are found to be spiral galaxies with low star-formation efficiency over an extended large disk (e.g., Leroy et al., 2008; Cheng et al., 2018), while ULIRGs usually have a more violent compact nuclear starburst in the galaxy center (Solomon et al., 1997; Downes & Solomon, 1998). The similarity between the bulk of the ALMA-SHiZELS sample and the KINGFISH sample in Fig. 6 and 7 is in line with the two samples tracing more similar modes of main sequence star formation, compared with the extreme starburst modes witnessed in SMGs.
H clumpy features are commonly found in high-redshift galaxies (Genzel et al., 2006; Swinbank et al., 2012b). However, our ALMA continuum images do not show clear counterparts of the H clumps, at least at kpc scales (Fig. 1). It may be that the observed clumps are not tracing true star-forming clumps, but less dusty regions of the galaxy, from which the H can escape (Swinbank et al., 2004).
3.2.3 A comparison between the HST and ALMA morphologies
The HST F140W images of our sample which trace the rest-frame optical emission (Fig. 8 and 9), reveal that only SHiZELS-9 has an apparently dual stellar core (the two cores have similar fluxes), which may be evidence of a major merger, or caused by a dust lane. SHiZELS-11 and -14 may both be undergoing or recently have undergone a minor merger event.
Spatial offsets between the rest-frame optical and FIR observations have been found in low and high-redshift (U)LIRGs (Charmandaris et al., 2004; Hodge et al., 2016). In Fig. 1 we see the spatial offsets and the overlap between the F140W and ALMA emission. For SHiZELS-9, the two major (rest-frame) -band cores present dust emission, while additional FIR emission comes from a region connecting to the third -band core. The -band flux distribution does not always follow the H or the dust morphology in our sample. A detailed study of spatially resolved dust extinction maps and the IRX- relation (the FIR and UV luminosity ratio versus the UV SED slope, Meurer et al., 1999) of our high-redshift star forming galaxies will be presented in a forthcoming paper.
The rest-frame UV images also show complex morphologies. Compared to the detected FIR emission from SHiZELS galaxies, the UV morphologies are extended and clumpy. For the ALMA non-detected galaxies, SHiZELS-10, -2, 3, and -21, the rest-frame UV and optical band images show compact cores at their centres (Fig. 9), evidencing compact UV star formation cores or regions of lower obscuration which is also found in the low-redshift low mass galaxies (Cheng et al., 2020). We see that galaxies display more compact rest-frame UV morphologies than the sample, which is consistent with previous studies (Paulino-Afonso et al., 2017).
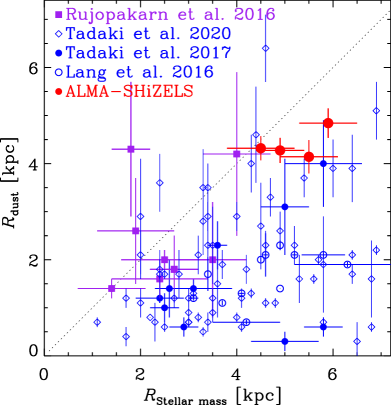
We show the half-light radii of the F140W emission in the right panel of Fig. 7. The F140W radii (adopted from Gillman et al. (2019)) have typical effective radii of 4.5 kpc, consistent with the typical size of the full HiZELS sample (Stott et al., 2013). Using the stellar masses for our targets to predict half-light radius based on the mass-size relation (Suess et al., 2019), we find that the size revealed by the F140W imaging are consistent with the predicted radius within 1. We also present the galaxy sample from Rujopakarn et al. (2016) composed of star-forming galaxies at redshift , observed by ALMA (870 m, 1.3 mm) and VLA (5 cm) at 04, the H selected main sequence star-forming galaxies from Tadaki et al. (2017), the SMGs at redshift 2 observed by ALMA 870 m from Lang et al. (2019) , and the recent ALMA 870m observation results of the massive star-forming galaxies at redshift 2 (Tadaki et al., 2020). in the right panel of Fig. 7. Tadaki et al. (2017)’s sample of proposed elliptical progenitor galaxies has systematically smaller FIR size similar to other SMGs, suggesting the future formation of compact red cores. Our targets are roughly the largest galaxies in both rest-frame optical band and FIR radius. The large FIR radius indicate the stellar mass is assembling at a larger radius, thus our targets would evolve into massive disk galaxies.
4 Conclusion
We present high-resolution () ALMA continuum observations (rest-frame m) of nine star-forming galaxies at redshift 1.47 and 2.23, taken from the HiZELS survey. These galaxies have been observed with previous AO-aided IFU H spectroscopy and HST at similar resolution, facilitating a spatial exploration of the star formation at high-redshift at kpc scale resolution. Our sample comprises a population of star-forming galaxies at redshift 1.47 and 2.23, which are mainly ‘main sequence’ galaxies, and have H luminosities close to or below at their redshift.
We detect four out of nine galaxies with ALMA. Their morphologies present extended faint structures, out to 16 kpc in diameter, much larger than the typical FIR size of sub-millimetre galaxies at high redshift. Our ALMA observations also reveal two serendipitous detections within the ALMA primary beams. Both of these are detected in previous optical and NIR surveys, located at different redshifts. For the ALMA non-detected galaxies, we find they mainly have either lower stellar masses () and lower [N ii]/H ratios, corresponding to 12+log(O/H) 8.5.
The SFR derived from FIR and dust corrected H are consistent with each other within 1. However, the spatially resolved FIR and H morphologies do not show a similar distribution, implying a complex distribution of the ISM state in these galaxies. At least at kpc scales, the H emission do not show a clear spatial correlation with respect to the FIR emission. We find that the brightest H clumps, previously identified via AO-aided IFU spectroscopy, are not significantly spatially correlated with the dust continuum emission which traces the bulk of the ISM, which appears smooth.
Our sample of SHiZELS galaxies have a typical rest-frame FIR size twice larger than the SMGs at high-redshift, while the H emission size of our sample and SMGs are similar. The similarity between the extent of the dust continuum emission, and IR luminosities of our sample and the local star-forming disky galaxies is in line with our sample being drawn from the ‘normal’ star-forming galaxy population at z=1.5-2.2. The dust continuum emission in these systems is dominated by a cool extended component, while in more active galaxies such as SMGs, compact nuclear starbursts dominate the dust emission (Gullberg et al., 2019).
Acknowledgements
This paper benefited from a number of thoughtful comments made by the anonymous referee. C.C. appreciates useful comments from Dr. Wenda Zhang. This work is supported by the National Key R&D Program of China grant 2017YFA0402704. C.C. is supported by the National Natural Science Foundation of China (NSFC), No. 11803044, 11673028, and J.H. is supported by the NSFC, No. 11933003. E.I. acknowledges partial support from FONDECYT through grant N∘ 1171710. SG acknowledges the support of the Science and Technology Facilities Council through grant ST/N50404X/1 and ST/L00075X/1. IRS acknowledges support from STFC (ST/T000244/1). PNB is grateful for support from STFC through grant ST/R000972/1. This work is sponsored in part by the Chinese Academy of Sciences (CAS), through a grant to the CAS South America Center for Astronomy (CASSACA) in Santiago, Chile. This work was supported by the National Science Foundation of China (11721303, 11991052) and the National Key R&D Program of China (2016YFA0400702). A.E. acknowledges partial support from the Center of Excellence in Astrophysics and Associated Technologies (AFB-170002) and FONDECYT Regular Grant 1181663. This paper makes use of the following ALMA data: ADS/JAO.ALMA#2012.1.00402.S, ADS/JAO.ALMA#2013.1.01188.S, ADS/JAO.ALMA#2015.1.00026.S. ALMA is a partnership of ESO (representing its member states), NSF (USA) and NINS (Japan), together with NRC (Canada), MOST and ASIAA (Taiwan), and KASI (Republic of Korea), in cooperation with the Republic of Chile. The Joint ALMA Observatory is operated by ESO, AUI/NRAO and NAOJ. A work based on observations collected at the European Organisation for Astronomical Research in the Southern Hemisphere under ESO programmes 082.B-0300(A) and 092.A-0090(A). This research is based on observations made with the NASA/ESA Hubble Space Telescope obtained from the Space Telescope Science Institute, which is operated by the Association of Universities for Research in Astronomy, Inc., under NASA contract NAS 5–26555. These observations are associated with program 14719.
Data availability: The data underlying this article are available in http://almascience.nrao.edu/aq/ and https://archive.stsci.edu/index.html, and can be accessed with ALMA project ID: 2012.1.00402.S; 2013.1.01188.S; 2015.1.00026.S and HST proposal ID: 14719
References
- Aihara et al. (2019) Aihara, H., AlSayyad, Y., Ando, M., et al. 2019, PASJ, 106
- Armus et al. (2009) Armus, L., Mazzarella, J. M., Evans, A. S., et al. 2009, PASP, 121, 559
- Beelen et al. (2006) Beelen, A., Cox, P., Benford, D., et al. 2006, ApJ, 642, 694
- Boquien et al. (2016) Boquien, M., Kennicutt, R., Calzetti, D., et al. 2016, A&A, 591, A6.
- Calura et al. (2017) Calura, F., Pozzi, F., Cresci, G., et al. 2017, MNRAS, 465, 54
- Casasola et al. (2020) Casasola, V., Bianchi, S., De Vis, P., et al. 2020, A&A, 633, A100
- Chabrier (2003) Chabrier, G. 2003, PASP, 115, 763
- Charmandaris et al. (2004) Charmandaris, V., Le Floc’h, E., & Mirabel, I. F. 2004, ApJ, 600, L15
- Chen et al. (2020) Chen, C.-C., Harrison, C. M., Smail, I., et al. 2020, A&A, 635, A119
- Cheng et al. (2018) Cheng, C., Ibar, E., Hughes, T. M., et al. 2018, MNRAS, 475, 248
- Cheng et al. (2020) Cheng, C., Xu, C. K., Xie, L., et al. 2020, A&A, 633, A105
- Chu et al. (2017) Chu, J. K., Sanders, D. B., Larson, K. L., et al. 2017, ApJS, 229, 25
- Clark et al. (2018) Clark, C. J. R., Verstocken, S., Bianchi, S., et al. 2018, A&A, 609, A37
- Cochrane et al. (2017) Cochrane, R. K., Best, P. N., Sobral, D., et al. 2017, MNRAS, 469, 2913
- Cochrane et al. (2018) Cochrane, R. K., Best, P. N., Sobral, D., et al. 2018, MNRAS, 475, 3730
- da Cunha et al. (2008) da Cunha, E., Charlot, S., & Elbaz, D. 2008, MNRAS, 388, 1595
- Curti et al. (2017) Curti, M., Cresci, G., Mannucci, F., et al. 2017, MNRAS, 465, 1384
- Dale et al. (2005) Dale, D. A., Bendo, G. J., Engelbracht, C. W., et al. 2005, ApJ, 633, 857
- Dale et al. (2007) Dale, D. A., Gil de Paz, A., Gordon, K. D., et al. 2007, ApJ, 655, 863
- Downes & Solomon (1998) Downes, D. & Solomon, P. M. 1998, ApJ, 507, 615
- Dudzevičiūtė et al. (2020) Dudzevičiūtė, U., Smail, I., Swinbank, A. M., et al. 2020, MNRAS, 494, 3828
- Erb et al. (2006) Erb, D. K., Shapley, A. E., Pettini, M., et al. 2006, ApJ, 644, 813
- Franceschini et al. (2003) Franceschini, A., Berta, S., Rigopoulou, D., et al. 2003, A&A, 403, 501
- Förster Schreiber et al. (2006) Förster Schreiber, N. M., Genzel, R., Lehnert, M. D., et al. 2006, ApJ, 645, 1062
- Förster Schreiber et al. (2009) Förster Schreiber, N. M., Genzel, R., Bouché, N., et al. 2009, ApJ, 706, 1364
- Förster Schreiber et al. (2018) Förster Schreiber, N. M., Renzini, A., Mancini, C., et al. 2018, ApJS, 238, 21
- Fujimoto et al. (2017) Fujimoto, S., Ouchi, M., Shibuya, T., & Nagai, H. 2017, ApJ, 850, 83
- Genzel et al. (2006) Genzel, R., Tacconi, L. J., Eisenhauer, F., et al. 2006, Nature, 442, 786
- Genzel et al. (2008) Genzel, R., Burkert, A., Bouché, N., et al. 2008, ApJ, 687, 59
- Garn & Best (2010) Garn, T., & Best, P. N. 2010, MNRAS, 409, 421
- Geach et al. (2008) Geach, J. E., Smail, I., Best, P. N., et al. 2008, MNRAS, 388, 1473
- Gillman et al. (2019) Gillman, S., Swinbank, A. M., Tiley, A. L., et al. 2019, MNRAS, 486, 175
- Gullberg et al. (2019) Gullberg, B., Smail, I., Swinbank, A. M., et al. 2019, MNRAS, 490, 4956
- Hodge et al. (2016) Hodge, J. A., Swinbank, A. M., Simpson, J. M., et al. 2016, ApJ, 833, 103.
- Hodge et al. (2019) Hodge, J. A., Smail, I., Walter, F., et al. 2019, ApJ, 876, 130
- Hwang et al. (2010) Hwang, H. S., Elbaz, D., Magdis, G., et al. 2010, MNRAS, 409, 75
- Ibar et al. (2013) Ibar, E., Sobral, D., Best, P. N., et al. 2013, MNRAS, 434, 3218
- Ikarashi et al. (2015) Ikarashi, S., Ivison, R. J., Caputi, K. I., et al. 2015, ApJ, 810, 133
- Katsianis et al. (2017) Katsianis, A., Blanc, G., Lagos, C. P., et al. 2017, MNRAS, 472, 919
- Kennicutt (1998) Kennicutt, R. C. 1998, ARA&A, 36, 189
- Kennicutt et al. (2003) Kennicutt, R. C., Jr., Armus, L., Bendo, G., et al. 2003, PASP, 115, 928
- Kennicutt et al. (2011) Kennicutt, R. C., Calzetti, D., Aniano, G., et al. 2011, PASP, 123, 1347
- Kennicutt et al. (2012) Kennicutt, R. C., Evans II, N. J. 2012, ARA&A, 50, 531
- Kocevski et al. (2018) Kocevski, D. D., Hasinger, G., Brightman, M., et al. 2018, ApJS, 236, 48
- Koyama et al. (2019) Koyama, Y., Shimakawa, R., Yamamura, I., et al. 2019, PASJ, 71, 8
- Lang et al. (2019) Lang, P., Schinnerer, E., Smail, I., et al. 2019, ApJ, 879, 54
- Lawrence et al. (2007) Lawrence, A., Warren, S. J., Almaini, O., et al. 2007, MNRAS, 379, 1599
- Leroy et al. (2008) Leroy, A. K., Walter, F., Brinks, E., et al. 2008, AJ, 136, 2782
- Liang et al. (2019) Liang, L., Feldmann, R., Kereš, D., et al. 2019, MNRAS, 489, 1397
- Ma & Yan (2015) Ma, Z., & Yan, H. 2015, ApJ, 811, 58
- Magdis et al. (2012) Magdis, G. E., Daddi, E., Béthermin, M., et al. 2012, ApJ, 760, 6
- Mehta et al. (2018) Mehta, V., Scarlata, C., Capak, P., et al. 2018, ApJS, 235, 36
- Meurer et al. (1999) Meurer, G. R., Heckman, T. M., & Calzetti, D. 1999, ApJ, 521, 64
- Molina et al. (2017) Molina, J., Ibar, E., Swinbank, A. M., et al. 2017, MNRAS, 466, 892
- Molina et al. (2019) Molina, J., Ibar, E., Smail, I., et al. 2019, MNRAS, 487, 4856
- Mosenkov et al. (2019) Mosenkov, A. V., Baes, M., Bianchi, S., et al. 2019, A&A, 622, A132
- Nelson et al. (2019) Nelson, E. J., Tadaki, Ken-ichi, Tacconi, L. J., et al. 2019, ApJ, 870, 130
- Oteo et al. (2015) Oteo, I., Sobral, D., Ivison, R. J., et al. 2015, MNRAS, 452, 2018
- Oteo et al. (2017) Oteo, I., Smail, I., Hughes, T., et al. 2017, arXiv e-prints , arXiv:1707.05329.
- Paulino-Afonso et al. (2017) Paulino-Afonso, A., Sobral, D., Buitrago, F., et al. 2017, MNRAS, 465, 2717
- Pettini & Pagel (2004) Pettini, M., & Pagel, B. E. J. 2004, MNRAS, 348, L59
- Qin et al. (2019) Qin, J., Zheng, X. Z., Wuyts, S., et al. 2019, ApJ, 886, 28
- Rujopakarn et al. (2016) Rujopakarn, W., Dunlop, J. S., Rieke, G. H., et al. 2016, ApJ, 833, 12
- Rujopakarn et al. (2019) Rujopakarn, W., Daddi, E., Rieke, G. H., et al. 2019, ApJ, 882, 107
- Scoville et al. (2007) Scoville, N., Aussel, H., Brusa, M., et al. 2007, ApJS, 172, 1
- Scoville et al. (2016) Scoville, N., Sheth, K., Aussel, H., et al. 2016, ApJ, 820, 83
- Shapiro et al. (2008) Shapiro, K. L., Genzel, R., Förster Schreiber, N. M., et al. 2008, ApJ, 682, 231
- Simpson et al. (2006) Simpson, C., Martínez-Sansigre, A., Rawlings, S., et al. 2006, MNRAS, 372, 741
- Simpson et al. (2015) Simpson, J. M., Smail, I., Swinbank, A. M., et al. 2015, ApJ, 799, 81
- Sobral et al. (2012) Sobral D., Best P. N., Matsuda Y., Smail I., Geach J. E., Cirasuolo M., 2012, MNRAS, 420, 1926
- Sobral et al. (2013) Sobral D., Smail I., Best P. N., Geach J. E., Matsuda Y., Stott J. P., Cirasuolo M., Kurk J., 2013, MNRAS, 428, 1128
- Sobral et al. (2014) Sobral, D., Best, P. N., Smail, I., et al. 2014, MNRAS, 437, 3516
- Sobral et al. (2015) Sobral D. et al., 2015, MNRAS, 451, 2303
- Sobral & Matthee (2019) Sobral, D., & Matthee, J. 2019, A&A, 623, A157
- Solomon et al. (1997) Solomon, P. M., Downes, D., Radford, S. J. E., et al. 1997, ApJ, 478, 144
- Stott et al. (2013) Stott, J. P., Sobral, D., Smail, I., et al. 2013, MNRAS, 430, 1158
- Strom et al. (2017) Strom, A. L., Steidel, C. C., Rudie, G. C., et al. 2017, ApJ, 836, 164
- Suess et al. (2019) Suess, K. A., Kriek, M., Price, S. H., et al. 2019, ApJ, 877, 103
- Swinbank et al. (2004) Swinbank, A. M., Smail, I., Chapman, S. C., et al. 2004, ApJ, 617, 64
- Swinbank et al. (2006) Swinbank, A. M., Chapman, S. C., Smail, I., et al. 2006, MNRAS, 371, 465
- Swinbank et al. (2012a) Swinbank, A. M., Sobral, D., Smail, I., et al. 2012a, MNRAS, 426, 935
- Swinbank et al. (2012b) Swinbank, A. M., Smail, I., Sobral, D., et al. 2012b, ApJ, 760, 130
- Tadaki et al. (2017) Tadaki, Ken-ichi, Genzel, R., Kodama, T., et al. 2017, ApJ, 834, 135
- Tadaki et al. (2020) Tadaki, Ken-ichi, Belli, S., Burkert, A., et al. 2020, arXiv:2009.01976
- Thomson et al. (2017) Thomson, A. P., Simpson, J. M., Smail, I., et al. 2017, ApJ, 838, 119
- Ueda et al. (2008) Ueda, Y., Watson, M. G., Stewart, I. M., et al. 2008, ApJS, 179, 124
- Yan & Ma (2016) Yan, H., & Ma, Z. 2016, ApJ, 820, 16
Appendix A Stamp images of ALMA-HiZELS targets
Appendix B Dust surface brightness profiles
We derive the dust continuum surface brightness profile by using the peak flux pixel as the centres of the tapered ALMA images. Then we perform aperture photometry by using a series of ring apertures in steps of (similar to the synthesised beam) in the natural-weighted ALMA images. Then we derive the surface brightness in each annulus for all of the four ALMA-detected galaxies, and show the results in Fig. 10. We also show the surface brightness profile of the ALMA synthesised beam, normalised to the maximum value for each source in Fig. 10. We fit the ALMA surface brightness profile with a Sersic function, and present the results in each panel. Sersic indices n of the ALMA images are lower than , implying a disk-like morphology of the dust emission. Based on the aperture photometry in each apertures, we also obtained the flux growth curve of each ALMA-detected galaxy, and derive the half-light radius in Tab. 2.
Appendix C ALMA non-detected targets
C.1 Individual properties
-
•
SHiZELS-21, also known as UDS-10 in Molina et al. (2017). This galaxy is a compact rotating galaxy. The H velocity dispersion profile is double peaked at about kpc from the galaxy center. The HST F606W image shows a double UV core structure which is barely resolved in the F140W image.
-
•
SHiZELS-8: This galaxy is dominated by rotation and present clumpy features (Swinbank et al., 2012a; Gillman et al., 2019). None of the three H clumps is detected by ALMA. Its metallicity is relatively low () and the metallicity gradient is flat (Swinbank et al., 2012a). A simple dynamical description using carbon monoxide is presented by Molina et al. (2019). The HST F606W image shows an extended UV morphology, while the F140W image shows a compact core in the galaxy. The clumpy structures seen in the H map are not recovered by the F606W image.
-
•
SHiZELS-10: This galaxy is compact in H ( 2.3 kpc) and identified as a merger (Swinbank et al., 2012a; Gillman et al., 2019). The ALMA continuum emission is undetected, probably due to limitations in the surface brightness. On the other hand, the HST F140W, F606W and the VLT/SINFONI images show a good spatial consistency with bright dots and a long tail.
-
•
SHiZELS-2: The H IFU observations evidence a clear rotation curve, including two clumps at the centre with a separation of (about 1.5 kpc Gillman et al., 2019). The fainter clump locates in the rotation center. The orientation of the HST morphology is similar to that revealed by rotation in H. The HST images show a compact stellar and star formation distribution. The HST F606W image also shows that the star formation in the galaxy center is bright in rest-frame UV (Gillman et al., 2019).
-
•
SHiZELS-3: The H velocity map shows a clear rotation feature, while the velocity dispersion map shows two peaks separated by 2.5 kpc, suggesting a complex dynamics probably associated to merging activity (Gillman et al., 2019). HST images show that the stellar mass and rest-frame UV star formation morphologies are compact.
C.2 Stacking analyses
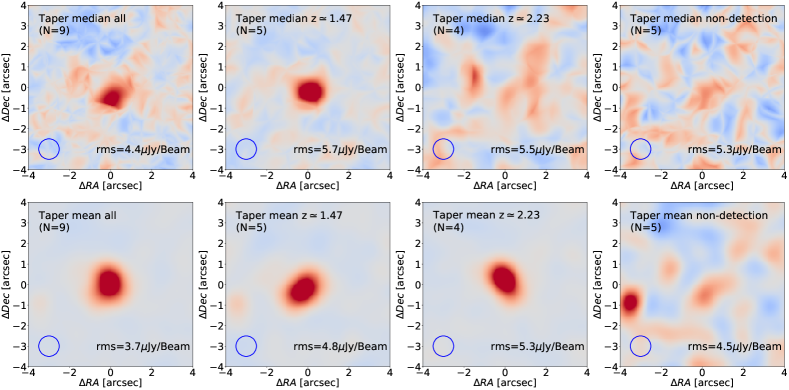
In this appendix we explore the possibility to extract information from the non-detected sources via a stacking approach. To do this, we stack the ALMA tapered image which are generated at resolution. We generate postage stamps (of ) for each ALMA continuum image, centred at the optical RA and Dec., to stack them based on median and average statistics (see Fig. 11). We reach rms values from 3.5 to 5.5 Jy beam-1 in these stacks. At , we detected three galaxies out of five, and both the average and median show a significant emission at the image centre. For the population, only one out of four targets is detected, hence the clear detection in the mean stack is clearly biased by the brightest galaxy. This significant detection disappears when we look at the median estimate. We also combined all non-detections together (mixing and 2.23 galaxies) in the right panels of Fig. 11.
To estimate the significance of the stacks of non-detected ALMA images, we use a peak to noise criterion. The peak values are obtained from a 2-D Gaussian profile using a fixed centre and fixed width (FWHM) at 1′′ (assuming point like detections). We measure the peak flux densities of 12.7 Jy beam-1 for the mean stacked image, and 13.1 Jy beam-1 for the median one. Comparing these values with the background noise, these peaks are only at 3 significance. We consider these stacks as non-detections.
Based on the rest-frame frequencies for these stack measurements, and considering the Rayleigh–Jeans tail (at 850m flux; Equ. 16 in Scoville et al., 2016), we can derive global ISM mass limits for our SHiZELS targets. Considering median stacks, and 5 upper limits for the population, we derive ISM masses of at and at .
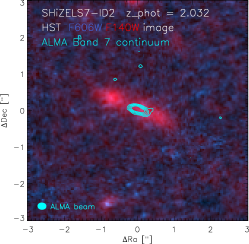
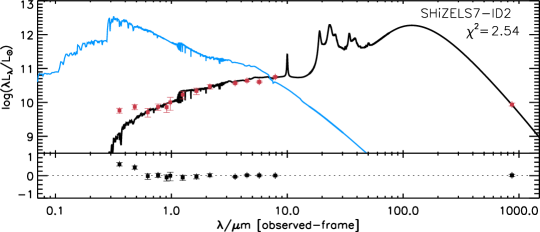
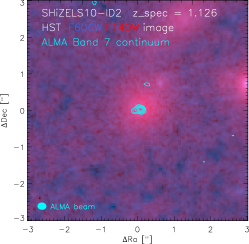
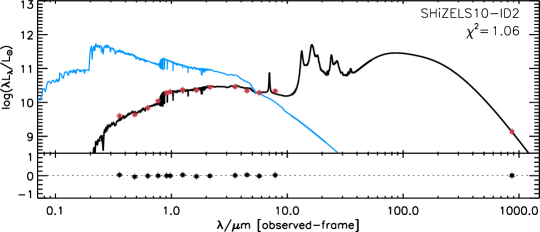
Appendix D Serendipitous ALMA detection
In this appendix, we briefly characterise the properties of the serendipitous galaxies SHiZELS7-ID2 and SHiZELS10-ID2. Both sources have been identified in the Multi-wavelength Photometric Catalog of the Spitzer Large Area Survey with Hyper-Suprime-Cam (SPLASH) in the Subaru XMM-Newton Deep Field (SXDF) (Mehta et al., 2018). SHiZELS10-ID2 presents a spectroscopic redshift at while SHiZELS7-ID2 only has a photometric redshift estimate at . In Fig. 12 we show the ALMA continuum 355 m rest-frame contours on top of a fake colour optical image. The ALMA flux densities are considered for a SED fitting approach including photometric bands taken from Mehta et al. (2018). We derive the stellar mass by MAGPHYS and the properties of these two targets are presented in Table 4 and Fig. 12. Considering the ALMA flux, our stellar masses are consistent with the previous results within 0.5 dex. More properties of these two targets can be found in Mehta et al. (2018).
| ID | ID | RA (J2000) | Dec (J2000) | Redshift | ALMA flux (mJy) | ||
|---|---|---|---|---|---|---|---|
| From Mehta et al. (2018) | 873m | By MAGPHYS | From Mehta et al. (2018) | ||||
| SHiZELS10-ID2 | 954698 | 02:17:39.261 | 4:44:42.33 | 0.20 0.03 | 10.4 0.1 | 10.2 | |
| SHiZELS7-ID2 | 874393 | 02:16:59.969 | 5:01:53.49 | 0.32 0.03 | 10.3 0.1 | 10.6 |