11email: {dritsakon, theosotr, p3110180, louridas}@aueb.gr
* These authors contributed equally to this work.
Search Engine Similarity Analysis: A Combined Content and Rankings Approach
Abstract
How different are search engines? The search engine wars are a favorite topic of on-line analysts, as two of the biggest companies in the world, Google and Microsoft, battle for prevalence of the web search space. Differences in search engine popularity can be explained by their effectiveness or other factors, such as familiarity with the most popular first engine, peer imitation, or force of habit. In this work we present a thorough analysis of the affinity of the two major search engines, Google and Bing, along with DuckDuckGo, which goes to great lengths to emphasize its privacy-friendly credentials. To do so, we collected search results using a comprehensive set of 300 unique queries for two time periods in 2016 and 2019, and developed a new similarity metric that leverages both the content and the ranking of search responses. We evaluated the characteristics of the metric against other metrics and approaches that have been proposed in the literature, and used it to (1) investigate the similarities of search engine results, (2) the evolution of their affinity over time, (3) what aspects of the results influence similarity, and (4) how the metric differs over different kinds of search services. We found that Google stands apart, but Bing and DuckDuckGo are largely indistinguishable from each other. ††The final authenticated version is available online at https://doi.org/10.1007/978-3-030-62008-0_2.
Keywords:
search engines distance metrics results ranking document similarity1 Introduction
Search engine battles make headlines in the international media; changes in their algorithms, aiming to produce more accurate results that respond better to user needs, have become topics of on-line analysts, while their rollout is eagerly followed across the globe.
Meanwhile, the inner workings of search engines are corporate secrets. For example, although we know that Google started with PageRank, we also know that the current Google service uses lots of proprietary mechanisms that have not been made public. That is also true for its prime competitor, Bing, or other search engines with a considerable following, like Baidu.
The battle for prevalence in the search engine market is an ongoing game. Recent developments, such as the disclosures of personal data misuse and the advent of stricter data protection policies, affect the dynamics of the market. A deeper look in the United States search engine market developments over the last three years reveals that Google’s market share increased by 5.45%, Bing’s market share decreased by 18.13%, while DuckDuckGo’s market share rose almost by a factor of four [27]. The latter is a search engine that goes at lengths to satisfy privacy conscious users. It gets its results from over four hundred sources like Wikipedia and a variety of partners including Bing [22]. Although it has a very small share compared to its aforementioned competitors, its considerable increase indicates an upward dynamic against the established and mature competitors of the market.
At the same time, search engines are evolving at a fast pace, returning far richer results than the “ten blue links” of the past [51]. Nowadays, search results include elaborate page titles and detailed textual snippets, while also aggregating relevant content from multiple specialized search services (referred to as verticals), such as images, video, business maps or weather forecasts [4, 51, 5]. These advances have given prominence to new user interaction patterns, e.g., users are usually attracted by vertical results which in turn increases the probability of inspecting nearby web results [15, 40]. As a result, even though the conventional approach of result ranking can still be used for search engine comparisons, it is essentially a first-order approximation of the problem that does not take into account the current heterogeneous user experience.
In this work we tackle the question of the similarity of search engines, by investigating whether their search results are indeed different. We examine Google and Bing, together with DuckDuckGo. Existing studies on search engine similarity primarily focus only on the ranking of the search results, while not considering the rest of their features, such as snippets or titles that play a critical role on attracting users’ clicks [18, 33, 39, 20]. Therefore, to compare these three search engines we propose a new similarity metric that takes into account both the top lists of search results, and their semantic content, as shown by the titles and text snippets in their responses. We apply our metric to data from a comprehensive set of queries gathered from two periods, in 2016 and in 2019.
Contributions
Our work contributes to both search engine affinity analysis and the top results literature:
-
•
Search engine affinity: We develop an experimental setting for assessing the affinity of three search engines, namely Google, Bing and DuckDuckGo. By assembling a varied set of around 300 unique queries and inspecting their top 10 results over two distinct periods, in 2016 and 2019, we study and compare the behavior of different search engines across time.
-
•
A novel metric for search engine similarity that considers both the order and the content of the results: Existing search engine comparison methods leverage ranked results. However, search engines tend to return rich and heterogeneous forms of information (such as elaborate titles and detailed snippets), and thus transforming user interaction patterns. We therefore introduce a combined content and rankings approach that returns more expressive similarity scores and distinguishes important differences in search engine behavior that are not apparent with existing rank-distance metrics.
-
•
Comparison findings: While Google appears to be different than both Bing and DuckDuckGo, the last two are indistinguishable from each other.
We find that while Google appears to be different than both Bing and DuckDuckGo, the last two are indistinguishable from each other. To arrive at this result, we start in Section 2 with an overview of related work. We introduce our metric in Section 3 and its application on our data set in Section 4. We wrap up with our conclusions and discussion in Section 5.
2 Background and Related Work
The issues of affinity, performance, and stability in search engines have attracted research attention since their early days in the 1990s. The oldest studies [28, 7, 17, 21, 38] focused mainly on evaluating and comparing the performance of search engines, employing usually a few queries (2 to 20) and manually examining the retrieved results for relevance with each search query. None of the search engines examined in these studies survives to this day. In 2004, three search engines, Google and two defunct ones, were evaluated, with Google demonstrating the best performance [49].
Concerning the affinity of search results, early studies showed that search engines produced mostly unique results with low overlap [45, 21, 11]. This could be justified by the fact that each search engine would index less than than one-third of the indexable web [36], leading half of all users to try different search engines when looking for an answer to a specific query [53]. The trend of low similarity continued throughout the 2000s [47, 10]. A study in 2007 revealed that the ranking of the search results by search engines was different than how users would rank them, thus demonstrating the potential for personalized search [8].
In 2010, Zaragoza et al. [56] conducted an alternative approach with quantitative statements, which they tested with 1000 queries on Google, Microsoft Live Search, and Yahoo! Search. They found that the three search engines gave satisfactory results for navigational queries (i.e., queries that referred to a particular web page or service) and for frequent non-navigational queries.
At the same time, Webber et al. [52] developed Rank-Biased Overlap, a similarity metric for ranked lists. The researchers created a set of 113 queries and inspected the top-100 urls produced by 11 search engines. Google and Microsoft Live Search results were common by 25%. Moreover, when checking against the localized versions of the search engines (e.g., the .au domain), Google was found to use less localization than Yahoo and Microsoft Live.
In a subsequent work in 2011 that investigated the ranking similarity between Bing and Google [14], Cardoso and Magalhães applied the Rank-Biased Overlap on the results of 40,000 queries, showing that the search engines differed considerably. Furthermore, they looked into the diversity of search results for a given query using the Jensen-Shannon divergence and came to the conclusion that Bing tended to interpret a given query more diversely than Google.
In 2014, Collier and Konagurthu [19] proposed a measure for the comparison of two top lists, based on the minimum length encoding framework developed by Wallace [50]. The researchers used 250 queries to retrieve search results from Ask, Google, and Yahoo. They measured the similarity of these search engines for up to the top 100 results and found that the search engines results differed linearly on their ranks, or quadratically using the Spearman and Kendall distances. Agrawal et al. [1] proposed two methods, TensorCompare and CrossLearnCompare, to compare search engine affinity based on the content of web results, and used these techniques to compare Google and Bing. We will return to this study in 4.6, where we use it to validate our own approach.
Most of the similarity studies focus only on the ranking of the search results, while not considering the rest of their semantic features, such as snippets or titles. The idea of a combined approach that facilitates both ranking and textual semantics has appeared in the field of Web search, especially for ranking search results [12, 57]. Although semantic features are largely incorporated into the process of producing and ranking search results, they are not integrated in the commonly used rank-distance metrics for comparing results between different search engines. Moreover, in cases where the results of the search engines have very similar urls and rankings but very different snippets / titles differ, a rank-distance metric cannot reflect this dissimilarity. On the other hand, approaches that solely focus on the content of web results would not sufficiently represent reality, when comparing search engines with similar snippets / titles, but different rankings.
In addition, the trend towards aggregation of multiple information sources into search results [4, 40, 51, 5] has significantly transformed the landscape of search result pages, which in turn has resulted in changes in the corresponding evaluation methodologies [6, 51]. As more heterogeneous information appears on modern search engine result pages, studies highlight interesting user interaction patterns [15, 35, 40, 55] where the sequential order of results does not play the sole role in browsing result pages. Recent research has shown that snippets and titles notably affect the user’s decision to click on a specific page [18, 33, 39, 20].
Unlike previous work, we propose a metric tailored to the search engine similarity problem that takes into account diverse criteria as to the rankings and the content of web results. Our combined ranking-content metric aims to return more expressive, objective and robust similarity scores. It also aims to distinguish important differences in search engine behavior that are not apparent with other rank-distance metrics, while viewing each search result as it is; a unified piece of information. Furthermore, to the best of our knowledge, none of the existing studies on search engine similarity include privacy-friendly search engines, such as DuckDuckGo.
3 The Metric
We introduce a new metric, which we call , to study search engine similarity. In Section 3.1 we formulate the problem that the metric aims to resolve and the criteria that it should meet; in Sections 3.2–3.5 we develop metric step-by-step. Then, in Section 3.6 we compare it to other existing metrics.
3.1 Problem Formulation
In what follows, we assume that for two search engines and we have two lists and of the ranked top results of search engine and search engine respectively. We denote the element of with , and similarly for .
Typically, responses produced by search engines consist of the identifier of the result’s web location (url), a result title, and a snippet describing the page content. With the evolution of search engines and the change in user experience, the sequential order of the search results is not the only factor that determines user interaction patterns. Specifically, snippets and titles are significantly involved in the user’s decision to click on a specific page [18, 33, 39, 20]. Therefore, a search engine comparison should take into account all three aspects in order to accurately appraise engine similarity.
Motivating Example
To further highlight the importance of snippets and titles, consider Table 1 that shows the top result returned by Google and Bing for the query “Steven Wilson”. Although search engines agree in the ordering (i.e., both results point to http://stevenwilsonhq.com/sw/), they produce completely different snippets. Depending on user’s search criteria, one snippet might be more effective on attracting user clicks than the other one. For instance, the snippet produced by Bing focuses on the artist’s favourite film directors, so it might be a good snippet when users search for general information about the artist. On the other hand, the snippet of Google announces his new album release; thus, it gives emphasis on music news.
| Bing | Google \bigstrut | |
| Position | 1 | 1 \bigstrut |
| URL | http://stevenwilsonhq.com/sw/ | http://stevenwilsonhq.com/sw/ \bigstrut |
| Snippet | Steven is a film aficionado, and frequently cites cinema as one of the key inspirations for his music. Some of this favourite directors include Stanley Kubrick, David Lynch, Ben Wheatley, Jonathan Glazer, Shane Meadows and Christopher Nolan. | The official website for songwriter/producer Steven Wilson. New live album/film ‘Home Invasion: In Concert at the Royal Albert Hall’ is out now! \bigstrut |
Criteria
As the ranking of search engine results does not fully capture their similarities, we need a more comprehensive affinity metric. This should meet the following four criteria:
-
C1
The number of common elements (results). The more elements search engine and share in their top results, the more similar they are.
-
C2
The distance of common elements. If an item appears in the results of both and , the affinity of and decreases as the distance of the element in the two result lists increases.
-
C3
The importance of agreement decreases as we go down in the results lists. For example, agreement at the top result is more important than that at the third or fourth result.
-
C4
If two search engines are similar, they produce similar titles and snippets, apart from returning similar results in a similar order.
3.2 Starting Point
As a starting point to define a metric for search engine affinity, we take the Jaro-Winkler distance, a variant of the Jaro distance [31], which was applied mainly to the record linkage problem, and whose goal is to compute string similarity based on the common elements and the number of transpositions between them [54]. The Jaro distance of two strings and is given by:
| (1) |
In the above, is the number of matching characters and denotes the number of transpositions. Two characters are considered matching if they are the same and their positions do not differ by more than . The number of transpositions is defined as half the number of matching characters that are in different order in the two strings.
The Jaro-Winkler distance extends the Jaro distance by boosting it using a scaling factor when the first characters match exactly:
| (2) |
In order to take into account the snippets and titles returned by the search engines, we adjust the Jaro-Winkler distance as follows:
| (3) |
where denotes the common length of the two result sets, is the number of common elements, is the penalty from transpositions, is the penalty from the differences between snippets, is the penalty from the differences between titles, and , , are weights attached to the penalties accrued from snippets, titles, and transpositions respectively.
Note that we compute the ratio of penalties and to the length of results lists rather than the number of matching elements , which is proposed by Jaro’s metric. This gives us a more reliable estimation of the affinity between lists. For example, suppose we compare a pair of result rankings of length and we get the number of matching elements as . According to equation 1, if then the term is equal to 1 and it contributes to the overall similarity, which is a high number, considering the low number of matching items (two). Also, we use instead of , as and have a common length .
3.3 Calculation of Penalties
Transpositions
To compute transpositions, we take the sum of the absolute differences of the positions of elements appearing in both lists. This is a variation of the deviation distance described by Ronald [43]. For lists and , the penalty is computed as follows, where is the position of in list :
This penalty is normalized on its upper bound. It can be proven that in the case of two lists of length the upper bound for transpositions of is:
where
Snippets and Titles
The process of evaluating the penalties related to snippets and titles is common for both. We examine the sentences , of snippets and titles that are produced by search engines and for a shared result. Then, we tokenize sentences and eliminate all stopwords as well as query terms. We get the union of all tokenized words that appeared in the two sentences and we calculate the corresponding frequencies, forming two vectors , where these two vectors represent the actual snippets or titles. We then compute the cosine distance of the two vectors . The overall penalty is computed by iterating and repeating this process for all common results and then summing all distances.
3.4 Similarity Boosting
The Jaro-Winkler metric treats all explicit matches at the first characters of strings equally (recall equation 2). We, however, require a descending significance for agreement as we go down the list of results. To do that, we increase the value of (equation 3) using weights when there are common results in positions . This follows our third criterion, that exact or adjacent matches are more important at the beginning of results lists rather than the end. This adjustment differs from the Jaro-Winkler metric in two ways.
First, the increase is not determined solely by the length of the matching prefix. For instance, imagine that we compare two vectors, . The Jaro-Winkler distance does not raise the precomputed Jaro value because there is no matching prefix between and . Our metric rewards agreement at positions up to , e.g., in our example, therefore, the matches at the second and third items of , increase the computed value.
Second, we also consider that the importance of positions has a descending order so that each position has an individual contribution to the total measure. In particular, we define a totally ordered set , so for each :
| (4) |
where is applied in case of agreement at the first position, at the second, and so forth.
3.5 The Metric
The final metric of similarity combines the number of overlapping results as well as ordering, snippets, and titles of results, and it is given by:
| (5) |
where
meets all four criteria of Section 3.1. The calculation of overlapping items, , fulfils C1. The computation of the penalty fulfils C2, whereas boosting satisfies criterion C3. Finally, and cover C4.
3.6 Comparison with Other Metrics
| a b c d e f a g h i j k | a b c d e f a b c g h i | a b c d e f g h i d e f | a b c d e f d e f a b c | a b c d e f a b c d f e | a b c d e f a b c f e d | |
| Spearman’s footrule | 1.0 | 1.0 | 1.0 | 0.0 | 0.89 | 0.78 |
| Kendall’s tau | 1.0 | 1.0 | 1.0 | 0.85 | 0.98 | 0.95 |
| 0.29 | 0.71 | 0.57 | 0.29 | 0.95 | 0.90 | |
| 0.48 | 0.82 | 0.36 | 0.18 | 0.98 | 0.97 | |
| Jaro-Winkler | 0.44 | 0.77 | 0.67 | 0.0 | 0.96 | 0.96 |
| [ | ] |
Many metrics have been proposed to evaluate the similarity of search engine results. However, most of them focus solely on the ranking of the search results. The concept behind our proposed metric is to estimate search engine similarity by incorporating the semantic features of the search results into a rank-distance approach. The dual nature of our metric enables more expressive and robust similarity scores and distinguishes important differences in search engine behavior that are not apparent with other rank-distance metrics. In addition, its content-awareness aims to better reflect the actual user experience, as it has evolved along with the developments in search engines.
To examine the behavior of our metric, we use a synthetic example to contrast it with other metrics. Specifically, we compare it with Spearman’s footrule and Kendall’s tau (modified so that they measure similarity instead of distance) [25], generalizations of these metrics [34], the Jaro-Winkler metric, and the metrics and proposed by Bar-Ilan et al. [10, 9].
Let be a list that contains responses provided by one search engine. We compare with six other results lists, , , , , , . Table 2 presents the output of the comparison between the lists using different metrics.
For the Jaro-Winkler metric we set , . In metric we set to penalize differences stemming from snippets, titles, and transpositions respectively, while we set , , , to reward matches at the first elements.
Only metric meets criterion C4 regarding snippets and titles. Thus, we present a lower and upper bound of our metric for every comparison. The lower bound corresponds to completely different snippets and titles among common results. The upper bound corresponds to snippets and titles that are identical.
Taking the different metrics in turn, in Table 2 we see that Spearman’s footrule and Kendall’s tau ignore mismatching elements, and compute similarity using only the common ones along with their distance, therefore, they do not meet criteria C1 and C3.
The Jaro-Winkler metric treats equally the transpositions of and in the comparisons and , even though the former introduces a greater misplacement of elements. Thus, it violates criterion C2. Moreover, according to equation 2, it does not assign descending significance to agreements at the prefix of lists, which is required by criterion C3.
Both the and metrics (the metric to a greater extent) estimate the similarity of lists by giving more emphasis to the ranking of items rather than the number of overlapping results. For example, we notice that even though and share all elements, the values of and show a decreasing importance to greater ranks, especially at the tail of lists. Also, a match in the first position, as in comparison , contributes to the overall similarity according to the metric, which is a great proportion relative to the number of matching items, i.e., only one out of total six. In essence, although and seem to satisfy criteria C1–C3, they actually ignore matches or adjacent matches at the end of lists; in fact, the metric can subsume and by using only the first elements, for .
Kumar and Vassilvitskii have proposed generalized versions of Spearman’s footrule and Kendall’s tau distances [34]; their versions take into account element weights, position weights, and element similarities in their calculations. It can be shown that the generalizations overlook elements that appear only in a single list and thus miss criterion C1.
4 Evaluation
We compare three search engines, Google, Bing, and DuckDuckGo (hereafter DDG), for numerous categories of queries, using our metric . Google and Bing are the two dominant search engines, and have been the subject of comparative research. DDG adopts a different philosophy, placing a premium on user privacy. Although far less popular than the two market leaders, it has a following among privacy-conscious users. In our empirical evaluation, we try to answer the following five research questions:111All data, results, and source code used on our experiments are available through https://doi.org/10.5281/zenodo.3980817.
-
RQ1
Do search engines produce similar web results? (Section 4.2)
-
RQ2
Is the similarity between search engines consistent over time? (Section 4.3)
-
RQ3
Which aspect of web results (i.e., rankings or content) influences the similarity of search engines the most? (Section 4.4)
-
RQ4
Do search engines produce similar results for different kinds of search services? (Section 4.5)
-
RQ5
How do the results produced by the metric correlate with the state-of-the-art? (Section 4.6)
4.1 Dataset
| Books & Authors | Drinks & Food |
| Multinational Companies | Music & Artists |
| Politicians | Regions |
| Software Technologies | Sports |
| TV & Cinema | Universities |
Our dataset consists of around \sepnum.,27600 top-10 lists in total. In order to assemble these search results, we constructed 10 categories of queries (Table 3). Every category contains around 30 queries; from these, 20 where taken from the U.S. version of Google Trends222https://www.google.com/trends/topcharts in May 2016 and the rest were selected by us. Given that we cannot test all possible queries, we selected queries that real people are likely to use and affect a large number of users. Furthermore, to achieve representativeness, we enriched each category with ten more queries selected by us, in order to include less popular but not rare queries that reflect the average search use.
For collecting web results, we are employing the Bing Web Search API333https://azure.microsoft.com/en-us/services/cognitive-services/bing-web-search-api/, the Google Custom Search API444https://developers.google.com/custom-search/, and a web scraper that we developed for DDG. Our approach ensures that the search engines do not take user history into account, which would affect the final results [29]. We performed the queries daily, at the same time, for a period of one month (31 days), from July to August 2016 and a period of 2 months (61 days) from May to July 2019. We use both datasets to answer RQ2; for the rest of the research questions, the analysis of them gave consistent results, so, for brevity, we will focus on the 2019 dataset here. For each query, we collected the top 10 results using the American domain of each engine.
URL Normalization
Each result contains a url that specifies its web location. Two identical urls refer to the same result but the same result could be pointed to by two different urls [44]. This complicates the analysis of query responses. Some existing studies address this problem by simple string comparison of urls [48, 46]. In our work, though, we applied standard normalization techniques [37]. Moreover, to further reduce the impact of the dust problem [44] (i.e., Different urls with Similar Text), we resolved redirect http responses (3xx status code) until we arrived at the final target url, which we then used for our analysis. For example, through this method, we can identify that both https://en.wikipedia.org/wiki/Perth, and https://en.wikipedia.org/wiki/Perth,_Western_Australia return identical content.
4.2 RQ1: Similarity of Search Engines
We estimate the similarity between Google, Bing and DDG by employing metric . Specifically, we compare the web results of every search engine pair, for each query and each date, resulting in three two-dimensional similarity arrays ; one for each search engine pair. Each element represents the similarity between the two search engines in the day for the query .
Recall from equation 5 that we need to define and the weights in order to reward matches at the first elements of the ranking lists. In our experiments, we set and ; we observed similar tendencies for different weight assignments. Regarding the importance of result factors, i.e., snippets, titles, and transpositions, we set , , . We use as the weight for title penalties, because differences in titles are rare and in this way we could boost this factor (see Section 4.4).
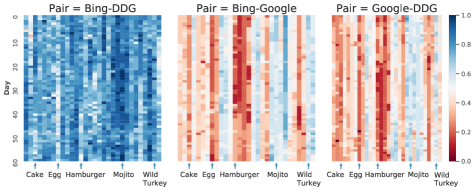
Figure 1 presents the heatmaps of the similarity arrays for the queries of the “Drinks & Food” category. These heatmaps are representative of all the other categories. Blue cells indicate cases where search engines are close to each other (the value of metric is high), while red cells reveal dissimilar web results ( is low).
It is easy to see that Bing and DDG give very similar results for the vast majority of the queries. For example, they returned almost identical results for the query “Mojito”, for all the days of our experiment. Beyond that, the heatmaps allow us to pinpoint the cases that do not conform to the general trend. For example, for the queries “Egg” and “Hamburger” among DDG and Bing, the similarity score slightly drops (observe the corresponding white and orange cells). Overall, our findings indicate that despite its tiny market share, DDG still manages to offer a product comparable to that of the market leaders. The similarity between Bing and DDG could be explained by the fact that DDG—among other things—employs Bing to get its results [22].
Moving to Google-Bing and Google-DDG, the results of metric indicate clear differences as a large number of cells tend to be red. Specifically, in some cases, the results present significant contrast, such as the query “Egg”. However, there is still a number of queries where the search engines seem to have a slightly higher degree of resemblance, e.g.,“Wild Turkey” and “Mojito”. Since, not much is known on how search engine ranking algorithms work, another factor that affects search engines’ similarity is their index size; in particular, Google has demonstrated a higher average index size than Bing [13].
4.3 RQ2: Consistency of Search Engines
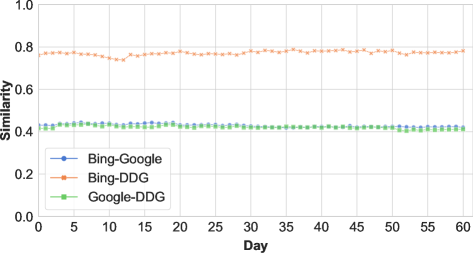
To estimate the consistency of search engine behavior over time, we calculate the average similarity score, as computed by metric , of the search engine results for every day and comparison pair. This is the mean per row of every array . Figure 2 presents the average similarity of every search engine pair over time. This figure clearly shows that the affinity of the search engines is almost constant over time, with only a small number of trivial fluctuations. The findings from this experiment imply that either the search engines do not significantly change their behavior or that their behavior changes in the same way.
In addition, the plots reveal that the similarity between Bing-DDG is almost double than that of Bing-Google and Google-DDG, strengthening our first finding. Also, Bing and DDG seem to behave with a similar manner when they are compared with Google, because the corresponding plots (observe the blue and green plots) almost lie on each other.
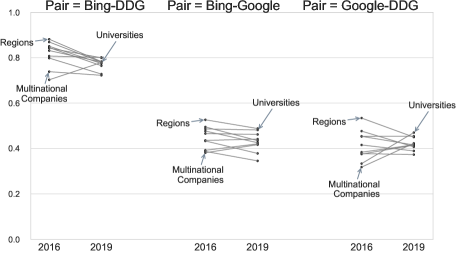
We also examined how the search engines’ similarity changes in the long-term. To do so, we compared the values between the 2016 and 2019 datasets. Figure 3 shows the differences in the similarity of every search engine for each query category from 2016 to 2019. Overall, we see that Bing and DDG moved from being very similar to slightly less so (their similarity decreases by 7.4%, on average). The affinity between of Bing-Google is almost stable (it drops by only 1.6%, on average). Finally, DDG has come somewhat closer to Google, i.e., there is an increase in their similarity by 4.5% on average. We inspected the categories, focusing especially on those that are bucking the trend (e.g., “Universities” in Bing-DDG). The results show that the increase in the similarity between Google and DDG is due to changes in DDG’s results within this period of time.
Apart from the similarity of search engine pairs between 2016 and 2019, we examined how a search engine changes itself between these two points in time. Certainly, in three years the world changes and information sources change as well. Therefore, we do not expect a search engine to return the same results in 2016 and in 2019 for the same query. However, although we expect all three search engines to change, we do not how to what degree they will change. We found that the average similarity between 2016 and 2019 is 0.37 for DDG, 0.43 for Bing, and 0.48 for Google; that is, Google changed the least and DDG the most. DDG’s rankings and search algorithms may have been updated to a greater extent than the other search engines. This may have supported DDG’s relative growth (its market share moved upwards by 274.28%) over the past three years [41, 27].
4.4 RQ3: Impact of Snippets, Titles, and Transpositions
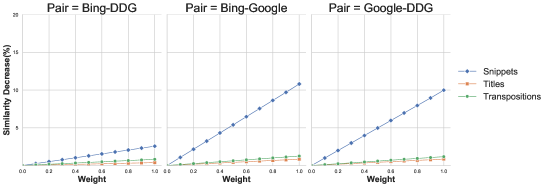
Unlike existing approaches, metric captures both the ordering (i.e., transpositions) and the content (i.e., snippets, titles) of results. Therefore, we can estimate how much each factor contributes to the differences between search engines. To do so, we instantiate the metric with different weights for each factor (recall from Equation 3). We first consider the metric as the baseline metric with weights , , . We compute the average similarity of every comparison pair for all the queries and days. Conceptually, considers only the number of overlapping results and the agreements at the first results. Then, we examine the effect of snippets by varying , , , while keeping . Similarly, we examine the effect of titles and transpositions by varying and while keeping the other two weights pegged to zero.
In figure 4, each diagram shows the impact of every factor on the decrease of for each search engine pair. It is clear that snippets have the biggest impact, by a wide margin. The difference in transpositions is much smaller, and the difference in titles minimal, throughout all search engine comparisons. Google seems to construct different snippets compared to Bing and DDG, an observation that is consistent with our motivating example in Section 3.1.
4.5 RQ4: Search Engine Similarity in Different Search Services
Apart from standard web search, search engines provide their users with a list of different services, such as, news, image, and video search. We investigated whether our findings regarding the similarity between search engines apply to the news search tab for 2019—we excluded other services as our metric works on textual results. We created a set of 30 news queries; 20 of them were taken from the Google News trends of May 2019 and the remaining 10 were generic news topics, e.g., “flood”.
The results show a very low average similarity of 0.12, in contrast with the average 0.54 similarity of the results from the regular search. Bing-Google is the pair that exhibits the highest similarity (0.15). Overall, this dissimilarity can be explained by the ephemeral nature of the news that requires quick evaluation and leads to daily ups and downs of topics and content. Also, the ranking algorithm of the news search results is different than that of the regular search, certainly for Google [23]. Each ranking algorithm takes into account multiple different parameters, such as human evaluators [23, 26], that can lead to completely divergent results. As indicated in the work of Agrawal et al. [2], the low similarity between search engines’ results is preferable, especially for informative search, because users get exposed to diverse views and perspectives (e.g., different political views).
4.6 RQ5: Comparison with Other Approaches
Rankings-Based Approaches
We study how metric correlates with three metrics that have been used in search engine comparisons (Section 3.6). Specifically, we use the metrics , , and Jaro-Winkler to compute the similarity between every search engine pair like we did in Section 4.2 using metric .
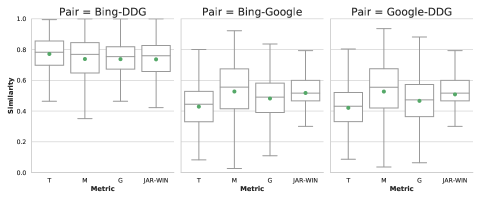
Figure 5 shows the box plots of the search engine affinity for each metric. Every box plot contains the median similarity (horizontal line), the mean similarity (green circle), along with the maximum and minimum similarity values. The figure replicates our first finding (Section 4.2), that is, Google seems to produce more unique results when compared to Bing or DDG, as the corresponding box plots are lower than those of the Bing-DDG pair. Hence, the results of metric are consistent with those of the three aforementioned metrics.
However, the box plots demonstrate that the metric seems to stand out from the others, especially in the Bing-Google, Google-DDG pairs. Specifically, by observing the average and the median similarity, we see that metric always produces lower values than the other metrics. This is explained by the fact that metric effectively captures differences that stem from snippets and titles in those comparison pairs, which the other metrics ignore (Section 4.4).
Content-Based Approaches
Agrawal et al. [1] have introduced TensorCompare and CrossLearnCompare, two content-based methods that utilize tensor decomposition and supervised learning techniques. Both methods exploit snippets of the search results in order to compare their content, but without considering their ordering. Nevertheless, we used them in comparison with our method to cross-check the metric with different content-based methods.
TensorCompare constructs a four mode tensor (result, query, day, search engine) and then applies a tensor decomposition algorithm [30] on it to get a sum of factor matrices, reflecting the corresponding modes of the tensor. CrossLearnCompare builds a classification model predicting the query that produces a result of a search engine given the results of a search engine as training data. The performance of the classifier then indicates how similar these search engines were. These methods were used to compare Google and Bing. The study results showed that these search engines seem to be significantly similar when judged on the content of their results.
We tried to replicate their findings. In order to test TensorCompare, we made our own implementation of the Alternating Poisson Regression (CP APR) [16] method, which is used for the tensor decomposition. To ensure the correctness of our implementation we tested its results against of that of the Matlab TensorToolbox555 http://www.sandia.gov/~tgkolda/TensorToolbox/index-1.0.html, using the method described by Albanese et al. [3] in their implementation of the Maximal Information Coefficient (MIC) metric introduced by Reshef et al. [42]. We followed exactly the steps described in their study to build the feature space and feed both methods.
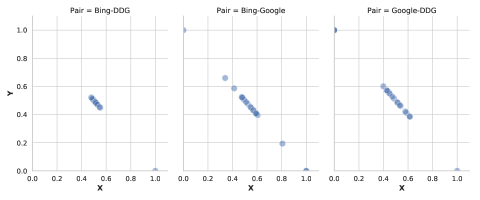
We ran these methods for every query category, incorporating results of all the days examined by our experiment. The TensorCompare results (see Figure 6) for the “Drinks & Food” category (we make similar findings for the rest of the categories) confirm that the Bing-DDG pair is much more related than the rest. This underpins our findings about RQ3 where Bing and DDG return snippets that are very close to each other.
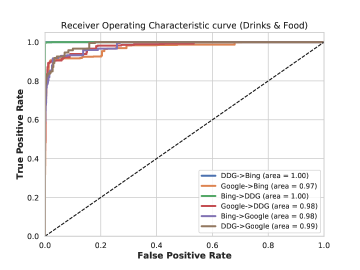
The results of CrossLearnCompare (Figure 7) clash with the results of the other methods. Specifically, according to the assessment of Agrawal et al., all search engines seem to behave with an almost identical manner as shown by the high predictability of queries, and indeed we replicated that. An explanation for this could be that CrossLearnCompare actually predicts queries and not search engines, which may be distinguishable from each other. As witnessed in the results obtained by the other methods, predicting queries rather than search engines means that it ignores the differences stemming from both the rankings and the snippets (as shown in Section 4.4) of results. In this way, CrossLearnCompare mistakenly indicates that there is a significant overlap in the results generated by Bing-Google and Google-DDG [2, 1].
However, notice that—once again—the pair of Bing-DDG is more predictable than the rest, meaning that those search engines generate web results with more similar contents than Bing-Google and Google-DDG, as we also find through our metric (Section 4.4).
4.7 Threats to Validity
The main threat to external validity is the representativeness of the selected queries. To mitigate this threat, we created a large corpus of \sepnum.,27600 lists of top-10 search results. These results were assembled from 300 unique queries, spanning 10 different topics. The two-thirds of the queries were taken from the Google trends of 2016, in order to study the search engines in use cases that impact a large number of users. The rest were selected by us, aiming to include less popular but not rare queries that better reflect the average search use.
Another threat to external validity could be that we considered only the top web results for every query. However, we based our decision on previous studies of user behavior [24, 32] that have shown that it is more likely for users to click an item included in the first ten results.
The main threat to internal validity is the design of our metric . To alleviate this threat, we kept four criteria in mind (Section 3.1) that are considered very important in search engine comparisons, and captured both the rankings and the content of the results. We compared the results of the metric with other existing methods (both rankings- and content-based), showing that the results of our metric are consistent with those found by others. Another threat comes from the methodology of collecting the web results. We used the rest apis of Google and Bing so that the web results are not biased by our search history [29]. We queried every search engine at the same time, each day, using the same parameters, employing standard url normalization methods, and resolving http redirections to mitigate the dust problem.
5 Conclusions and Discussion
In this work, we introduce a novel similarity metric for search engine comparison that combines the rankings of results and their semantic presentation. In contrast to the existing ranking-based or content-based approaches, our metric aims to be more expressive, robust and objective, following the aggregation of heterogeneous information into search results and the emergence of new user interaction patterns. Thus, it effectively captures differences that stem from snippets and titles, which the other metrics ignore.
By employing our metric, we were able to track engine similarity on both content and ranking across time, for a large and broad number of queries. Our results indicate that Google stands apart from Bing and DuckDuckGo, but these two are largely indistinguishable. The performance of DuckDuckGo may run counter to many expectations, taking into account the comparatively vast disparity of its resources. In our study we queried search engines without taking into account the user history. It is possible that when user history is employed, Bing would differ measurably from DuckDuckGo. Still, Google manages to differ from both Bing and DuckDuckGo even when it does not leverage personalized data.
Lately, search engines have started producing summaries, overviews, and compelling navigational aids, calling for more flexible comparison methodologies. Our approach consists a first step towards this direction, but the incorporation of semantically-rich features in search engine similarity measures seems a promising area for future research.
5.0.1 Acknowledgments
This work was supported by the European Union’s Horizon 2020 research and innovation program “FASTEN” under grant agreement No 825328.
References
- [1] Agrawal, R., Golshan, B., Papalexakis, E.: A study of distinctiveness in web results of two search engines. In: Proceedings of the 24th International Conference on World Wide Web. pp. 267–273. ACM (2015)
- [2] Agrawal, R., Golshan, B., Papalexakis, E.: Whither social networks for web search? In: Proceedings of the 21th ACM SIGKDD International Conference on Knowledge Discovery and Data Mining. pp. 1661–1670. KDD ’15, ACM, New York, NY, USA (2015). https://doi.org/10.1145/2783258.2788571, http://doi.acm.org/10.1145/2783258.2788571
- [3] Albanese, D., Filosi, M., Visintainer, R., Riccadonna, S., Jurman, G., Furlanello, C.: Minerva and minepy: a C engine for the MINE suite and its R, Python and MATLAB wrappers. Bioinformatics 29(3), 407–408 (2013)
- [4] Arguello, J., Diaz, F., Callan, J.: Learning to aggregate vertical results into web search results. In: Proceedings of the 20th ACM International Conference on Information and Knowledge Management. p. 201–210. CIKM ’11, Association for Computing Machinery, New York, NY, USA (2011). https://doi.org/10.1145/2063576.2063611, https://doi.org/10.1145/2063576.2063611
- [5] Arguello, J., Diaz, F., Callan, J., Crespo, J.F.: Sources of evidence for vertical selection. In: Proceedings of the 32nd International ACM SIGIR Conference on Research and Development in Information Retrieval. p. 315–322. SIGIR ’09, Association for Computing Machinery, New York, NY, USA (2009). https://doi.org/10.1145/1571941.1571997, https://doi.org/10.1145/1571941.1571997
- [6] Bailey, P., Craswell, N., White, R.W., Chen, L., Satyanarayana, A., Tahaghoghi, S.: Evaluating whole-page relevance. In: Proceedings of the 33rd International ACM SIGIR Conference on Research and Development in Information Retrieval. p. 767–768. SIGIR ’10, Association for Computing Machinery, New York, NY, USA (2010). https://doi.org/10.1145/1835449.1835606, https://doi.org/10.1145/1835449.1835606
- [7] Bar-Ilan, J.: Search engine results over time: A case study on search engine stability. Cybermetrics 2(3), 1 (1999)
- [8] Bar-Ilan, J., Keenoy, K., Yaari, E., Levene, M.: User rankings of search engine results. Journal of the American Society for Information Science and Technology 58(9), 1254–1266 (2007)
- [9] Bar-Ilan, J., Levene, M., Mat-Hassan, M.: Dynamics of search engine rankings-A case study. In: Proceedings of the 3rd International Workshop on Web Dynamics (2004)
- [10] Bar-Ilan, J., Mat-Hassan, M., Levene, M.: Methods for comparing rankings of search engine results. Computer networks 50(10), 1448–1463 (2006)
- [11] Bharat, K., Broder, A.: A technique for measuring the relative size and overlap of public web search engines. Computer Networks and ISDN Systems 30(1), 379–388 (1998)
- [12] Bian, J., Liu, T.Y., Qin, T., Zha, H.: Ranking with query-dependent loss for web search. In: Proceedings of the Third ACM International Conference on Web Search and Data Mining. p. 141–150. WSDM ’10, Association for Computing Machinery, New York, NY, USA (2010). https://doi.org/10.1145/1718487.1718506, https://doi.org/10.1145/1718487.1718506
- [13] van den Bosch, A., Bogers, T., de Kunder, M.: Estimating search engine index size variability: a 9-year longitudinal study. Scientometrics 107(2), 839–856 (May 2016). https://doi.org/10.1007/s11192-016-1863-z
- [14] Cardoso, B., Magalhães, J.: Google, Bing and a new perspective on ranking similarity. In: Proceedings of the 20th ACM international conference on Information and knowledge management. pp. 1933–1936. ACM (2011)
- [15] Chen, D., Chen, W., Wang, H., Chen, Z., Yang, Q.: Beyond ten blue links: Enabling user click modeling in federated web search. In: Proceedings of the Fifth ACM International Conference on Web Search and Data Mining. p. 463–472. WSDM ’12, Association for Computing Machinery, New York, NY, USA (2012). https://doi.org/10.1145/2124295.2124351, https://doi.org/10.1145/2124295.2124351
- [16] Chi, E.C., Kolda, T.G.: On tensors, sparsity, and nonnegative factorizations. SIAM Journal on Matrix Analysis and Applications 33(4), 1272–1299 (2012)
- [17] Chu, H., Rosenthal, M.: Search engines for the world wide web: A comparative study and evaluation methodology. Proceedings of the ASIS Annual Meeting 33, 127–135 (1996)
- [18] Clarke, C.L., Agichtein, E., Dumais, S., White, R.W.: The influence of caption features on clickthrough patterns in web search. In: Proceedings of the 30th annual international ACM SIGIR conference on Research and development in information retrieval. pp. 135–142. ACM (2007)
- [19] Collier, J.H., Konagurthu, A.S.: An information measure for comparing top k lists. In: e-Science (e-Science), 2014 IEEE 10th International Conference on. vol. 1, pp. 127–134. IEEE (2014)
- [20] Cutrell, E., Guan, Z.: What are you looking for?: an eye-tracking study of information usage in web search. In: Proceedings of the SIGCHI conference on Human factors in computing systems. pp. 407–416. ACM (2007)
- [21] Ding, W., Marchionini, G.: A comparative study of web search service performance. Proceedings of the ASIS Annual Meeting 33, 136–142 (1996)
- [22] DuckDuckGo: Duckduckgo sources. https://help.duckduckgo.com/results/sources/ (2019), online accessed; 07 August 2019
- [23] Economist, T.: Seek and you shall find: Google rewards reputable reporting, not left-wing politics (Jun 2019), https://www.economist.com/graphic-detail/2019/06/08/google-rewards-reputable-reporting-not-left-wing-politics
- [24] Enge, E., Spencer, S., Fishkin, R., Stricchiola, J.: The art of SEO. ” O’Reilly Media, Inc.” (2012)
- [25] Fagin, R., Kumar, R., Sivakumar, D.: Comparing top lists. SIAM Journal on Discrete Mathematics 17(1), 134–160 (2003)
- [26] Filloux, F.: Google news: the secret sauce. The Guardian (Feb 2013), https://www.theguardian.com/technology/2013/feb/25/1
- [27] GlobalStats, S.: Statcounter globalstats. http://gs.statcounter.com (2019), online accessed; 06 August 2019
- [28] Gordon, M., Pathak, P.: Finding information on the World Wide Web: the retrieval effectiveness of search engines. Information Processing & Management 35(2), 141–180 (1999)
- [29] Hannak, A., Sapiezynski, P., Molavi Kakhki, A., Krishnamurthy, B., Lazer, D., Mislove, A., Wilson, C.: Measuring personalization of web search. In: Proceedings of the 22nd international conference on World Wide Web. pp. 527–538. ACM (2013)
- [30] Harshman, R.A.: Foundations of the PARAFAC procedure: Models and conditions for an” explanatory” multi-modal factor analysis (1970)
- [31] Jaro, M.A.: Advances in record-linkage methodology as applied to matching the 1985 census of Tampa, Florida. Journal of the American Statistical Association 84(406), 414–420 (1989)
- [32] Joachims, T.: Optimizing search engines using clickthrough data. In: Proceedings of the eighth ACM SIGKDD international conference on Knowledge discovery and data mining. pp. 133–142. ACM (2002)
- [33] Joachims, T., Granka, L., Pan, B., Hembrooke, H., Radlinski, F., Gay, G.: Evaluating the accuracy of implicit feedback from clicks and query reformulations in web search. ACM Transactions on Information Systems (TOIS) 25(2), 7 (2007)
- [34] Kumar, R., Vassilvitskii, S.: Generalized distances between rankings. In: Proceedings of the 19th international conference on World wide web. pp. 571–580. ACM (2010)
- [35] Lagun, D., Agichtein, E.: Effects of task and domain on searcher attention. In: Proceedings of the 37th International ACM SIGIR Conference on Research and Development in Information Retrieval. p. 1087–1090. SIGIR ’14, Association for Computing Machinery, New York, NY, USA (2014). https://doi.org/10.1145/2600428.2609516, https://doi.org/10.1145/2600428.2609516
- [36] Lawrence, S., Giles, C.L.: Searching the world wide web. Science 280(5360), 98–100 (1998)
- [37] Lee, S.H., Kim, S.J., Hong, S.H.: On URL normalization. In: International Conference on Computational Science and Its Applications. pp. 1076–1085. Springer (2005)
- [38] Leighton, H.V., Srivastava, J.: First 20 precision among world wide web search services (search engines). Journal of the American Society for Information Science 50(10), 870–881 (1999)
- [39] Lewandowski, D.: The retrieval effectiveness of web search engines: considering results descriptions. Journal of Documentation 64(6), 915–937 (2008)
- [40] Liu, Z., Liu, Y., Zhou, K., Zhang, M., Ma, S.: Influence of vertical result in web search examination. In: Proceedings of the 38th International ACM SIGIR Conference on Research and Development in Information Retrieval. p. 193–202. SIGIR ’15, Association for Computing Machinery, New York, NY, USA (2015). https://doi.org/10.1145/2766462.2767714, https://doi.org/10.1145/2766462.2767714
- [41] Popper, N.: A feisty Google adversary tests how much people care about privacy. The New York Times (Jul 2019), https://www.nytimes.com/2019/07/15/technology/duckduckgo-private-search.html
- [42] Reshef, D.N., Reshef, Y.A., Finucane, H.K., Grossman, S.R., McVean, G., Turnbaugh, P.J., Lander, E.S., Mitzenmacher, M., Sabeti, P.C.: Detecting novel associations in large data sets. Science 334(6062), 1518–1524 (2011)
- [43] Ronald, S.: More distance functions for order-based encodings. In: 1998 IEEE International Conference on Evolutionary Computation Proceedings. IEEE World Congress on Computational Intelligence (Cat. No.98TH8360). pp. 558–563 (May 1998). https://doi.org/10.1109/ICEC.1998.700089
- [44] Schonfeld, U., Bar-Yossef, Z., Keidar, I.: Do not crawl in the DUST: different URLs with similar text. In: Proceedings of the 15th international conference on World Wide Web. vol. 3, pp. 1015–1016. ACM (2006). https://doi.org/10.1145/1242572.1242588
- [45] Selberg, E., Etzioni, O.: Multi-service search and comparison using the metacrawler. 4th International Conference on World Wide Web (1995)
- [46] Spink, A., Jansen, J., Wang, C.: Comparison of major web search engine overlap: 2005 and 2007. AusWeb 2008: 14th Australasian World Wide Web Conference (2008)
- [47] Spink, A., Jansen, B.J., Blakely, C., Koshman, S.: A study of results overlap and uniqueness among major web search engines. Information Processing & Management 42(5), 1379–1391 (2006)
- [48] Spink, A., Jansen, B.J., Blakely, C., Koshman, S.: A study of results overlap and uniqueness among major web search engines. Information Processing & Management 42(5), 1379 – 1391 (2006). https://doi.org/https://doi.org/10.1016/j.ipm.2005.11.001
- [49] Vaughan, L.: New measurements for search engine evaluation proposed and tested. Information Processing & Management 40(4), 677–691 (2004)
- [50] Wallace, C.S.: Statistical and inductive inference by minimum message length. Springer Science & Business Media (2005)
- [51] Wang, Y., Yin, D., Jie, L., Wang, P., Yamada, M., Chang, Y., Mei, Q.: Optimizing whole-page presentation for web search. ACM Trans. Web 12(3) (Jul 2018). https://doi.org/10.1145/3204461, https://doi.org/10.1145/3204461
- [52] Webber, W., Moffat, A., Zobel, J.: A similarity measure for indefinite rankings. ACM Transactions on Information Systems (TOIS) 28(4), 20 (2010)
- [53] White, R.W., Dumais, S.T.: Characterizing and predicting search engine switching behavior. 18th ACM Conference on Information and Knowledge Management p. 87–96 (2009)
- [54] Winkler, W.E.: String comparator metrics and enhanced decision rules in the Fellegi-Sunter model of record linkage (1990)
- [55] Yue, Y., Patel, R., Roehrig, H.: Beyond position bias: Examining result attractiveness as a source of presentation bias in clickthrough data. In: Proceedings of the 19th International Conference on World Wide Web. p. 1011–1018. WWW ’10, Association for Computing Machinery, New York, NY, USA (2010). https://doi.org/10.1145/1772690.1772793, https://doi.org/10.1145/1772690.1772793
- [56] Zaragoza, H., Cambazoglu, B.B., Baeza-Yates, R.: Web search solved?: all result rankings the same? In: Proceedings of the 19th ACM international conference on Information and knowledge management. pp. 529–538. ACM (2010)
- [57] Zhuang, Z., Cucerzan, S.: Exploiting semantic query context to improve search ranking. In: Proceedings of the 2008 IEEE International Conference on Semantic Computing. p. 50–57. ICSC ’08, IEEE Computer Society, USA (2008). https://doi.org/10.1109/ICSC.2008.8, https://doi.org/10.1109/ICSC.2008.8