11email: eduardo.gonzalez@uah.es 22institutetext: Center for Astrophysics Harvard & Smithsonian, 60 Garden Street, Cambridge, MA 02138, USA 33institutetext: Centro de Astrobiología (CSIC-INTA), Ctra. de Ajalvir, km. 4, E-28850, Torrejón de Ardoz, Madrid, Spain 44institutetext: George Mason University, Department of Physics & Astronomy, MS 3F3, 4400 University Drive, Fairfax, VA 22030, USA 55institutetext: Observatorio Astronómico Nacional (OAN-IGN)-Observatorio de Madrid, Alfonso XII, 3, E-28014 Madrid, Spain 66institutetext: European Southern Observatory, Alonso de Córdova 3107, Casilla 19001, Vitacura, Santiago, Chile 77institutetext: Centro de Astrobiología (CAB, CSIC-INTA), ESAC Campus, E-28692, Villanueva de la Cañada, Madrid, Spain 88institutetext: IAA - Instituto de Astrofísica de Andalucía (CSIC), Apdo. 3004, E-18008, Granada, Spain
A proto-pseudobulge in ESO 320-G030 fed by a massive molecular inflow driven by a nuclear bar
Galaxies with nuclear bars are believed to efficiently drive gas inward, generating a nuclear starburst and possibly an active galactic nucleus (AGN). We confirm this scenario for the isolated, double-barred, luminous infrared galaxy ESO 320-G030 based on an analysis of Herschel and ALMA spectroscopic observations. Herschel/PACS and SPIRE observations of ESO 320-G030 show absorption or emission in 18 lines of H2O, which we combine with the ALMA H2O 448 GHz line ( K) and continuum images to study the physical properties of the nuclear region. Radiative transfer models indicate that three nuclear components are required to account for the multi-transition H2O and continuum data. An envelope, with radius pc, dust temperature K, and cm-2, surrounds a nuclear disk with pc that is optically thick in the far-infrared (, cm-2). In addition, an extremely compact ( pc), warm ( K), and buried (, cm-2) core component is required to account for the very high-lying H2O absorption lines. The three nuclear components account for % of the galaxy luminosity ( M⊙ yr-1). The nucleus is fed by a molecular inflow observed in CO 2-1 with ALMA, which is associated with the nuclear bar. With decreasing radius ( pc), the mass inflow rate increases up to , which is similar to the nuclear star formation rate (SFR), indicating that the starburst is sustained by the inflow. At lower , pc, the inflow is best probed by the far-infrared OH ground-state doublets, with an estimated . The inferred short timescale of Myr for nuclear gas replenishment indicates quick secular evolution, and indicates that we are witnessing an intermediate stage ( Myr) proto-pseudobulge fed by a massive inflow that is driven by a strong nuclear bar. We also apply the H2O model to the Herschel far-infrared spectroscopic observations of HO, OH, 18OH, OH+, H2O+, H3O+, NH, NH2, NH3, CH, CH+, 13CH+, HF, SH, and C3, and we estimate their abundances.
Key Words.:
Galaxies: bulges – Galaxies: evolution – Galaxies: individual: ESO 320 G030 – Galaxies: nuclei – Infrared: galaxies – Submillimeter: galaxies1 Introduction
The funneling of large amounts of gas into galaxies’ nuclear regions has profound consequences for galaxy evolution because it triggers starbursts and leads to buried galactic nuclei that are characterized by high column densities and dust temperatures. This is followed by a rapid growth of supermassive black holes (SMBHs), which appear to gain most of their mass in bright quasar modes (Soltan 1982). Eventually, feedback unbinds the local gas supply, terminating the inflow and stalling further SMBH growth (e.g., Younger et al. 2008). While mergers are one obvious mechanism for generating central mass concentrations, secular evolution via mass inflows caused by disk instabilities such as bars can generate pseudobulges (Kormendy 1982; Kormendy & Kennicutt 2004; Combes & Sanders 1981); however, the physical properties of such nuclei while they are still assembling gas are not always well understood because of the high obscuration.
Taking advantage of the availability of far-infrared (far-IR) and (sub)millimeter (submm) wavelengths facilities is the best way to overcome these difficulties. Spectroscopy of buried nuclei in the far-IR with the Infrared Space Observatory and the Herschel Space Observatory has revealed high excitation of light hydrides, mostly water vapor (H2O) and hydroxyl (OH), with the far-IR ( m) lines detected in absorption and lines at longer wavelengths observed in emission (e.g., González-Alfonso et al. 2004, 2008, 2012, 2017, and references therein). The specific characteristic of these lines, as compared with the rotational lines of other more commonly used tracers (CO, HCN, HCO+, etc), is that their rotational levels are excited through the intense far-IR radiation generated in buried galactic nuclei, thus directly probing the generation of the bulk of the luminosity in these environments. The line ratios are thus sensitive to the strength of the far-IR radiation density responsible for the excitation, and the absolute line fluxes constrain the effective sizes of the involved regions, which will be similar to the physical sizes when the surface filling factor is . This provides an effective spatial resolution that is much better than the low spatial resolution of these powerful spectroscopic observations. These nuclei are also directly imaged through observations of the continuum at (sub)mm wavelengths (e.g., Sakamoto et al. 2013) or through the observation of vibrationally excited lines of HCN (e.g., Aalto et al. 2015) and HC3N (e.g., Rico-Villas et al. 2020). Nevertheless, it is highly desirable to combine these far-IR observations of H2O with (sub)mm interferometric observations of a transition of the same species, providing a more direct and complementary way to probe the size and morphology of highly obscured nuclear regions.
With ALMA, the first detections in space of the ortho-H2O transition at 448 GHz (H2O448), both in the local Universe (Pereira-Santaella et al. 2017) and at high redshift (Yang et al. 2020), offer a new way to address the need to spatially resolve these regions. Despite the large difference in the infrared luminosities of the two reported detections in H2O448 ( for the local luminous infrared galaxy (LIRG) ESO 320-G030, also identified as IRAS 11506-3851, and for the merger G09v1.97), the fractional luminosity of the H2O448 line is similar (); this is surprising because in both sources the line is generated in a small nuclear region that accounts for only a fraction of the total galaxy luminosity.
The main characteristics that make this line a unique probe of buried stages of galactic nuclei are (see also Pereira-Santaella et al. 2017; Yang et al. 2020): Owing to the long wavelength of the line and low transition probabilities, it is a deeper probe than other H2O lines at shorter wavelengths. The high energy of the involved rotational levels ( K) guarantees the filtering out of relatively cold extended regions, thus specifically tracing the warmest nuclear regions. The line in ESO 320-G030 indeed comes from a region that is even more compact than the continuum emission at 448 GHz, but it is spatially resolved with ALMA clearly probing the innermost rotating disk. Radiative transfer calculations confirm that the H2O448 line is pumped through absorption of far-IR photons in the high-lying H2O lines at 79 and 132 m, and the 79 m line () is indeed observed in absorption with Herschel toward buried galactic nuclei including ESO 320-G030, thus tracing the far-IR absorption detected with Herschel/PACS. While the H2O448 line is strong, our models indicate that it is not a maser (which would be difficult to interpret due to the uncertain amplification), and the low Einstein coefficient ensures that the transition requires high columns to emit at the observed level. The H2O448 line can be modeled, in combination with other H2O lines at shorter wavelengths, to provide crucial parameters such as the nuclear IR luminosity, the columns of gas, the continuum opacities, dust temperatures, and the kinematics of the warm and luminous nuclear ISM.
The observation of multiple H2O lines is required to obtain a complete description of buried nuclear regions, which can be thought of as an ensemble of components with differing characteristics. The most extreme nuclear components, characterized by optical depths at 100 m and dust temperatures K, are best identified with far-IR absorption lines with level energies at K (González-Alfonso et al. 2012). On the other hand, the opaque nuclei are surrounded by massive ISM components with moderate column densities and , which are best traced by the H2O lines at m lines with level energies below K. Pereira-Santaella et al. (2017) presented a model of the nucleus of ESO 320-G030 based on the H2O448 ALMA emission line and the pumping H2O 79 m Herschel absorption line. While the analysis of these two lines alone provided the average properties of a starburst nuclear disk in the galaxy, the extremely rich spectrum of H2O in the far-IR and submm allows us to obtain a more complete description of the nuclear region. As shown below, up to 18 lines of H2O have been detected with Herschel in ESO 320-G030. In this paper, we fully exploit the Heschel/ALMA synergy with the goal of inferring the physical conditions in the nuclear region of ESO 320-G030 from the full set of H2O absorption and emission lines.
At a distance of 48 Mpc ( pc arcsec-1, Pereira-Santaella et al. 2017), ESO 320-G030 is morphologically classified as class 0 (i.e., an isolated galaxy with a symmetric disk and no sign of past or ongoing interaction; Arribas et al. 2008), and with a regular velocity rotational field (Bellocchi et al. 2013, 2016). Nevertheless, it is a double-bar system (Greusard et al. 2000), with the nuclear bar (, radius of kpc) nearly perpendicular to the primary bar ( kpc, Pereira-Santaella et al. 2016). Evidence of high nuclear star formation activity and obscuration has already been derived from optical and near-IR observations (Alonso-Herrero et al. 2006; Rodríguez-Zaurín et al. 2011; Piqueras López et al. 2016), and the relatively deep 9.7 m silicate absorption (Pereira-Santaella et al. 2010a). While far-IR spectroscopy shows inverse P-Cygni profiles in the ground-state OH doublets suggesting inflowing gas (Fig. 11 in González-Alfonso et al. 2017, and Sect. 4.2 below), outflows from the nucleus have also been detected in H (Arribas et al. 2014) and NaD (Cazzoli et al. 2014, 2016) with moderate velocities ( km s-1), and in CO 2-1 with higher velocities (Pereira-Santaella et al. 2016; per20). There is no clear evidence for the presence of an active galactic nucleus (AGN), either from mid-IR indicators such as the undetected [O iv] and [Ne v] tracers or the mid-IR slope of the continuum (Pereira-Santaella et al. 2010b; Alonso-Herrero et al. 2012), the observed radio properties (in a survey of OH megamaser galaxies by Baan & Klöckner 2006), or from the X-ray emission and the optical spectral classification (Pereira-Santaella et al. 2011). ESO 320-G030 can be thus considered a prototype of an isolated galaxy with strong secular evolution driven by bars during a phase of central gas assembly with feedback already in action.
This paper is structured as follows. We present the observations in Sect. 2; the analysis of the H2O data and the continuum, including a 3D modeling approach, is described in Sect. 3; we discuss the formation of the buried nucleus in ESO 320-G030 in light of the CO ALMA observations at higher spatial scales in Sect. 4, including an estimate of the mass inflow rate based on the CO data cube and on the far-IR profiles of the OH doublets. Our findings are discussed and summarized in Sect. 5. We also present in Appendix A all Herschel/PACS wavelength ranges observed in ESO 320-G030, and apply the H2O-based model to all other observed absorption molecular features to estimate the molecular abundances.
2 Observations
2.1 Herschel/PACS data
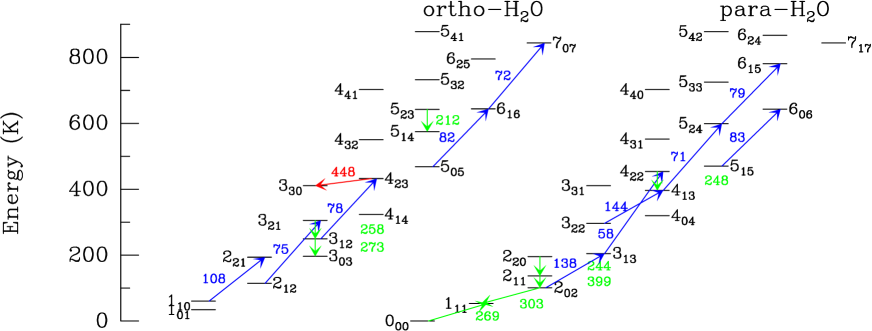
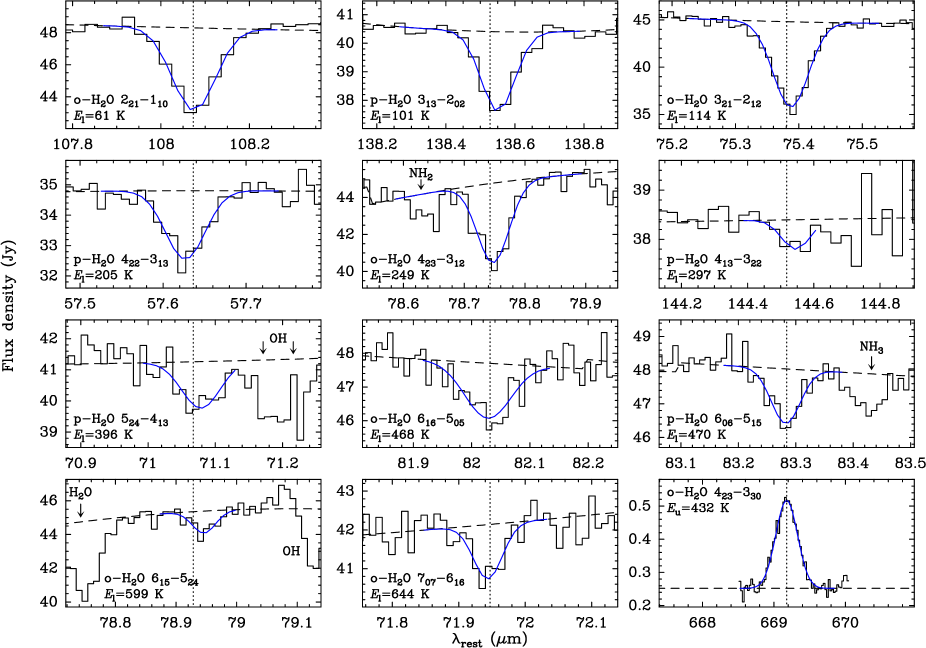
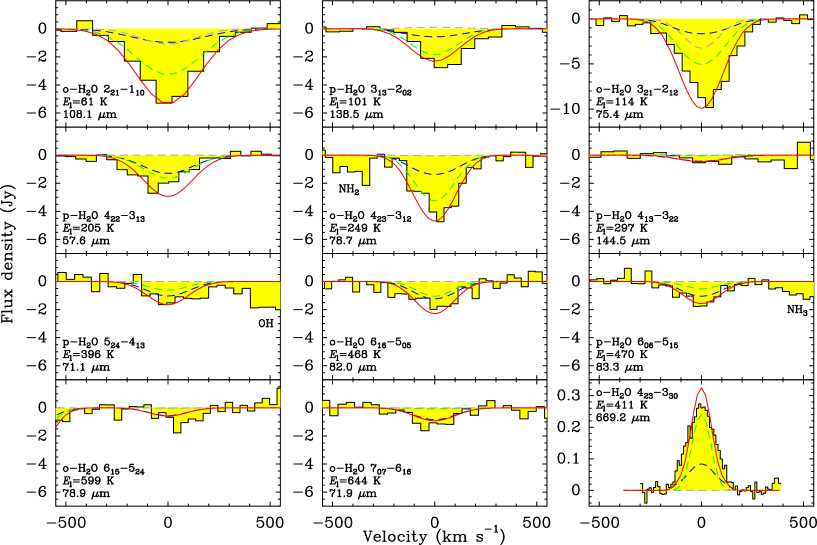
The Herschel/PACS (Pilbratt et al. 2010; Poglitsch et al. 2010) spectra presented here were obtained as part of the Herschel Open Time (OT2) program HerMoLirg (PI: E. González-Alfonso), which aimed to observe a set of molecular lines including H2O in a sample of local (Ultra-)Luminous Infrared Galaxies ((U)LIRGs). The observed lines are indicated with blue arrows in the energy level diagram of Fig. 1. The spectra were observed in high spectral sampling range-mode using the first and second orders of the grating. The velocity resolution of PACS in first order ranges from to 180 km s-1 over the wavelength range from 105 to 190 m, and in second order from to km s-1 from 52 to 98 m. The data reduction was performed using the PACS reduction and calibration pipeline (ipipe) included in HIPE 14.0.1, with calibration tree version 72, using an oversampling of four fully independent channels (an upsample parameter of 1). The molecular absorption lines are effectively point-like in ESO 320-G030, and we have thus used the point source calibrated spectra “c129” produced by scaling the emission from the central spatial pixel to the total emission from the central spaxels (“c9”), which is itself scaled according to the point-source correction (see also González-Alfonso et al. 2017). The absolute flux scale is robust to potential pointing jitter, with continuum flux reproducibility of %. The H2O spectra observed with Herschel/PACS toward ESO 320-G030 are shown in Fig. 2, together with the adopted baselines and Gaussian fits to the profiles. The resulting line fluxes along with transition parameters are listed in Table 1. The individual H2O lines are denoted according to their round-off wavelengths as indicated in the second column of Table 1, except the line observed with ALMA that is denoted according to its frequency in GHz (i.e., H2O448).
All observed H2O lines in the PACS wavelength range ( m) are detected in absorption, as also seen in several other buried galactic nuclei (e.g., González-Alfonso et al. 2004, 2008, 2012; Fischer et al. 2014). Lower level energies cover a full range of to K, and are thus expected to probe regions with significantly different dust temperatures (). Specifically, the highest-lying line H2O72 is clearly detected, indicating the presence of a very warm, optically thick component in the nucleus of ESO 320-G030 (Pereira-Santaella et al. 2017).
2.2 Herschel/SPIRE data
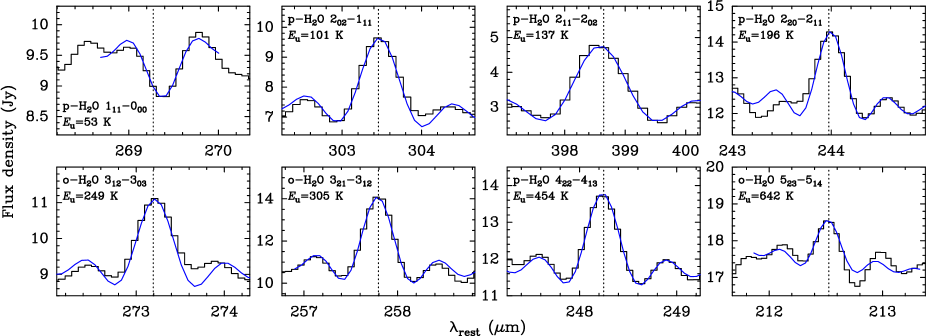
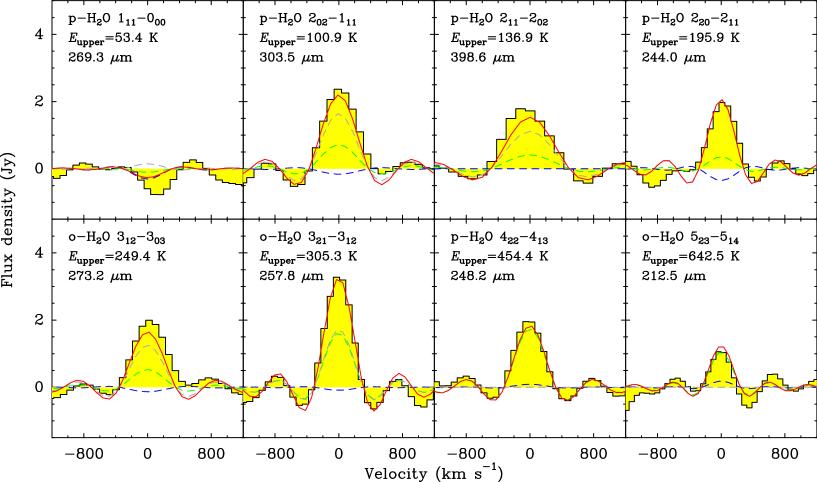
The Herschel/SPIRE (Griffin et al. 2010) spectrum of ESO 320-G030 was obtained as part of the Herschel Open Time Key Project Hercules (PI: P. van der Werf). The SPIRE spectrometer observations cover the wavelength range m with two spatial arrays covering two bands: SSW ( m) and SLW ( m). The HIPE 15.0.1 unapodized spectra were downloaded from the archive, with a spectral resolution of full-width half-maximum . The observed lines are indicated with green arrows in Fig. 1, and the spectra are shown in Fig. 3. Sinc functions on top of baselines of order 1 were fitted around the spectra, and the resulting line fluxes are also listed in Table 1.
As observed in all other (U)LIRGs at low and high redshifts (e.g., González-Alfonso et al. 2010; Yang et al. 2013, 2016; Liu et al. 2017; Lis et al. 2011; Pereira-Santaella et al. 2013; Omont et al. 2013), the excited submillimeter lines of H2O (i.e., with the lower level of the transition above ground-state) are observed in emission. Only the ground-state H2O (H2O269) line is observed either in emission and/or absorption, depending on the source (González-Alfonso et al. 2010; Spinoglio et al. 2012; Weiß et al. 2010; Rangwala et al. 2011), with complex intrinsic profiles in some galaxies as observed with the high-resolution Herschel/HIFI spectrometer (Liu et al. 2017). In ESO 320-G030, the H2O269 line is seen in absorption but significantly redshifted relative to the other lines. This redshifted absorption is also seen in other ground-state transitions, as the OH doublets at 119 and 79 m, tracing an apparent extended inflow (González-Alfonso et al. 2017). Cancellation of emission and absorption features in the H2O269 line within the SPIRE spectral resolution cannot be ruled out. The ground-state H2O+ line at 268.85 m, detected in strong absorption in M82 (Weiß et al. 2010), is not detected in ESO 320-G030.
The H2O lines displayed in Fig. 3 are the same as those detected with Herschel/SPIRE toward Mrk 231 (González-Alfonso et al. 2010). The lines in this wavelength range that trace the warmest dust are the high-lying H2O248 and H2O212 transitions. In Mrk 231, the flux ratio of these lines is , while this ratio in ESO 320-G030 is significantly lower, . Since the H2O212 line requires warmer dust than the H2O248 to be efficiently excited, the lower ratio in ESO 320-G030 indicates lower than in Mrk 231 in the region sampled by these lines (Section 3.2.2).
2.3 ALMA data
In the present study we use a new reduction of the band 8 ALMA data of ESO 320-G030 based on the combination of extended and compact array configurations. The observations with the extended configuration (project #2016.1.00263.S), with baselines ranging from 15 to 920 m, 42 antennas and a maximum recoverable scale of , were described in Pereira-Santaella et al. (2017). The compact configuration has baselines from 15 to 160 m, providing a maximum recoverable scale of . The two data sets were calibrated using the standard ALMA reduction software CASA (version 5.4; McMullin et al. 2007), and combined in the uv plane within the LRSK frequency reference frame. For spectroscopic observations of the H2O448 line, a velocity resolution of km s-1 ( MHz) was selected in the final data cubes, as well as pixels with a size of . We used for the cleaning the Briggs weighting with a robustness parameter of 0.5 (Briggs 1995), which provided a beam with a full width at half maximum (FWHM) of arcsec2 ( pc2) and a position angle (PA) of deg. The resulting 1 sensitivity was of mJy beam-1 for the 16 MHz channels. The continuum was extracted from line-free channels in the upper sideband at 454 GHz. With a similar beam size and PA as for the line observations, the achieved 1 sensitivity was of mJy beam-1.
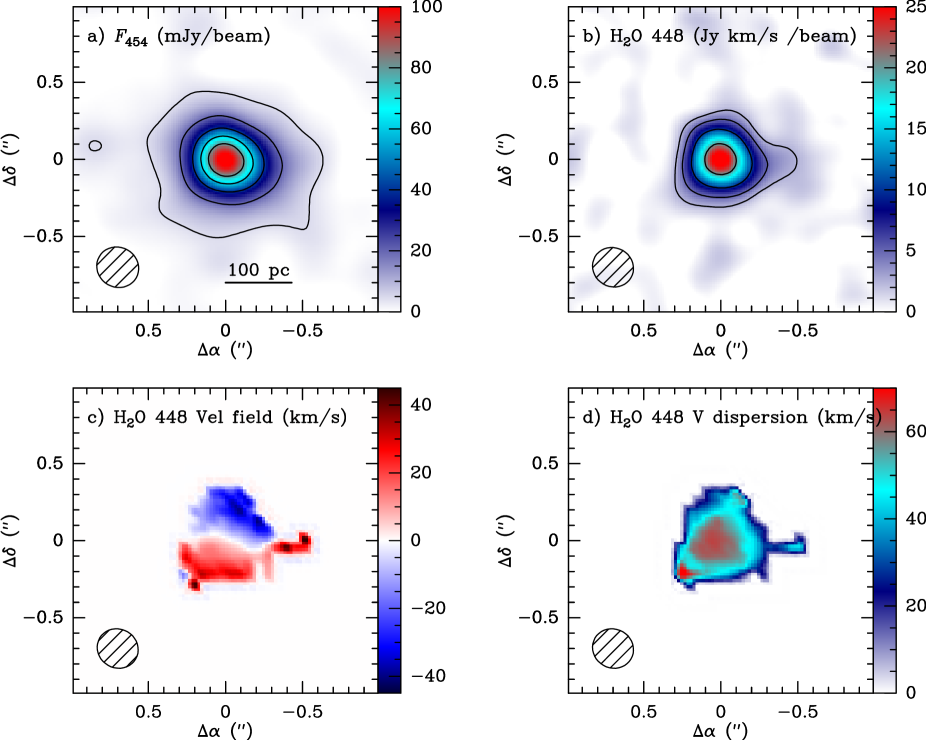
The spectrum of the H2O448 line extracted from a circular aperture of radius is shown in the lower-right panel of Fig. 2, yielding a flux of Jy km s-1. The maps of the 454 GHz (660 m) continuum, which is dominated by thermal dust emission (Pereira-Santaella et al. 2016, 2017), and of the velocity-integrated intensity (moment 0), velocity field (moment 1), and velocity dispersion (moment 2) of the H2O448 line are shown in Fig. 4. The 454 GHz continuum flux extracted from an aperture of radius is mJy. The fluxes measured in the H2O448 line and continuum are slightly higher than previously reported (Pereira-Santaella et al. 2017) because of the inclusion of the compact array configuration.
As noted in Pereira-Santaella et al. (2017), the 454 GHz continuum, with a low-brightness surface above level of arcsec2 (effective radius of 120 pc), is significantly more spatially extended than the H2O448 line, which probes a nuclear disk (Fig. 4c). The maps of both the continuum and H2O448 line are elongated in approximately the east-west direction, in contrast with the CO (2-1) emission that traces much larger scales and probes a disk inclined and with (Pereira-Santaella et al. 2016). The continuum at 454 GHz and the H2O448 line emission are however aproximately aligned with the nuclear bar (, see Sect. 4.1).
| Transition | Name | Flux | Obs ID | |||
|---|---|---|---|---|---|---|
| (m) | (K) | (K) | (Jy km s-1) | |||
| p-H2O | H2O58 | |||||
| p-H2O | H2O71 | |||||
| o-H2O | H2O72 | |||||
| o-H2O | H2O75 | |||||
| o-H2O | H2O78 | |||||
| p-H2O | H2O79 | |||||
| o-H2O | H2O82 | |||||
| p-H2O | H2O83 | |||||
| o-H2O | H2O108 | |||||
| p-H2O | H2O138 | |||||
| p-H2O | H2O144 | |||||
| o-H2O | H2O212 | |||||
| p-H2O | H2O244 | |||||
| p-H2O | H2O248 | |||||
| o-H2O | H2O258 | |||||
| p-H2O | H2O269 | |||||
| o-H2O | H2O273 | |||||
| p-H2O | H2O303 | |||||
| p-H2O | H2O399 | |||||
| o-H2O | H2O448 | ALMA#2016.1.00263.S |
3 Analysis
As shown in Figs. 2 and 3, a total of 20 H2O lines in absorption or in emission, with wavelengths ranging from 58 to 669 m, are detected in ESO 320-G030, and an ALMA map of one high-lying line, the H2O448 transition, is available, as well as the map of the 454 GHz continuum dominated by thermal dust emission. This gives a unique opportunity to combine all these data, and exploit at the maximum level the Herschel/ALMA synergy to infer the distribution of luminosity sources, their spatial extent, dust temperatures, and ISM column densities with unprecedented accuracy. To attain this goal, we fit the data, including up to 3 continuum flux densities, to a linear combination of spherically symmetric model components from a library (Sect. 3.1), which yields the solid angles, and hence the spatial scales of the different components. Since H2O is excited primarily through absorption of dust-emitted photons, our fit also gives specific predictions for the spectral energy distribution (SED) of the fitted components, and the predicted combined SED is compared with the observed SED (Sect. 3.2). In addition, the fit enables a Bayesian analysis that yields the probability densities of the inferred physical parameters. To check the reliability of these results, the components inferred from the spherically symmetric models are combined into a physical model in 3D, with predicted maps for the 454 GHz continuum and the H2O448 line that are compared with the observed maps to further refine our results (Sect. 3.3).
3.1 Fitting procedure
3.1.1 Defining the data set
We attempt to model the nuclear region of ESO 320-G030 from the H2O absorption and emission lines and the observed continuum flux densities at some specific wavelengths. We include in the fit all detected H2O lines, which are observed with the Herschel beam of (PACS) and (SPIRE). While the high-lying absorption lines are indeed expected to be fully nuclear, this is not necessarily true for the lowest-lying absorption and emission lines. Nevertheless, the low-brightness emission observed in the 454 GHz continuum map (Fig. 4a) indicates the presence of a nuclear but relatively extended ( pc) component where the low-lying absorption and emission can be formed. We will thus implicitly assume that all H2O lines with a non-ground-state lower level () are basically nuclear and associated with the spatial scale of the 454 GHz map, and results below will show the plausibility of this assumption.
Nevertheless, we note that the ground-state H2O269 line, the only SPIRE line that is seen in absorption, is significantly redshifted relative to the systemic velocity (Fig. 3), similar to the OH ground-state lines at 119 and 79 m (González-Alfonso et al. 2017). On the one hand, such absorption is expected to be produced by foreground gas not necessarily forming part of the modeled nuclear gas. On the other hand, an inner strong emission line is disfavored because there is no hint of an emission feature in the blueshifted part of the line. We therefore include the line in the fit with a high 1 uncertainty of 200 Jy km s-1, nearly the value of the measured flux (Table 1). In addition, the very high-lying H2O line at m, lying close to the [O i] 63 m line, is detected in NGC 4418 (González-Alfonso et al. 2012), but is not detected in ESO 320-G030, with Jy km s-1 (2 ). We also use below this non-detection to further constrain the inferred physical parameters of the core of the nucleus (Sect. 3.1.5).
We consider in the fit 3 continuum flux densities, at 30, 428, and 660 m, as constraints for fitting the SED. The measured flux densities at 428 m (700 GHz, Jy, Pereira-Santaella et al. in prep.) and 660 m (454 GHz, Fig. 4) are evidently nuclear as they have been measured with ALMA. We also expect the 30 m continuum as measured by Spitzer to be nuclear as well and intrinsically related to H2O because H2O probes the SED transition from mid- to far-IR wavelengths (González-Alfonso et al. 2012; Falstad et al. 2015, 2017; Aladro et al. 2018). No more continuum flux densities (e.g., in the far-IR) are included in the fit because they may be contaminated by extended emission unrelated to H2O.
3.1.2 A library of model components
A library of model components has been developed following the method described in González-Alfonso et al. (2014a). In short, the model components consist of spherically symmetric distributions of gas and dust, for which the statistical equilibrium populations of the H2O rotational levels are calculated through nonlocal, non-LTE radiative transfer calculations. The fluxes and profiles of all involved lines and the spectral energy distribution (SED) of the dust continuum from the mid-IR to the mm are subsequently computed. We assume for each component uniform physical properties: , the continuum optical depth at 100 m along a radial path , the column density of H2O along a radial path , the H2 density , the velocity dispersion , and the gas temperature . The gas and dust are assumed to be mixed. The physical parameters that are modified from model to model are , , , and , and we keep fixed km s-1 and K. As shown in González-Alfonso et al. (2014a), the excitation depends on and line fluxes are then proportional to , so that results can be easily scaled to any other value of .
While the excitation of H2O is dominated by radiative pumping, and thus our data are much more sensitive to the parameters defining the radiation field ( and ) than to the collisional parameters ( and ), collisional excitation can still have an impact in populating the low-lying (excited) levels from which the pumping cycle operates (González-Alfonso et al. 2014a). A significant role of H2O excitation through collisions is not a priori expected in ESO 320-G030 given the lack of emission in the H2O269 ground-state line (contrary to the case of NGC 1068), but we aim to further check this point by looking for any trend in the line ratios that would favor some role of collisions. To do this, we vary keeping K as a constant fiducial value characterizing warm (shocked) molecular gas, so that any significant impact of collisions would be reflected in a trend favoring high values of . That we do not find such a trend below (Section 3.2.2) indicates that our results are insensitive to our choice of .
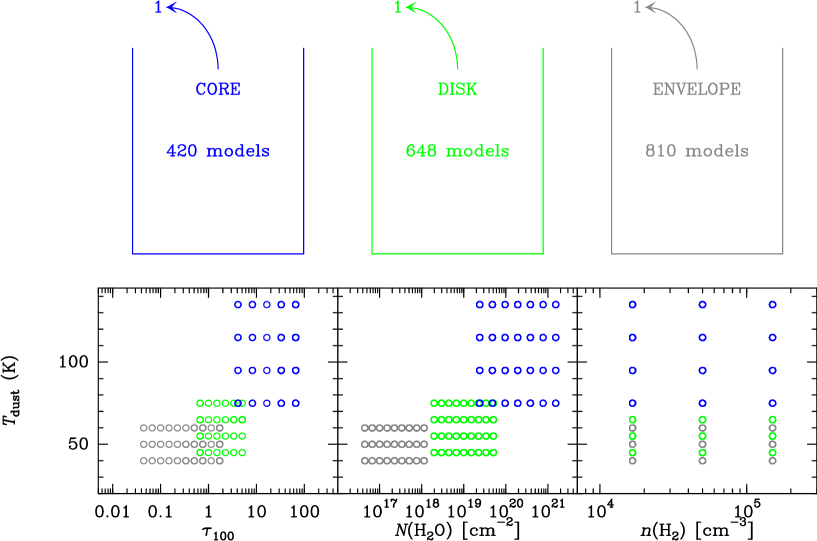
3.1.3 Groups of model components
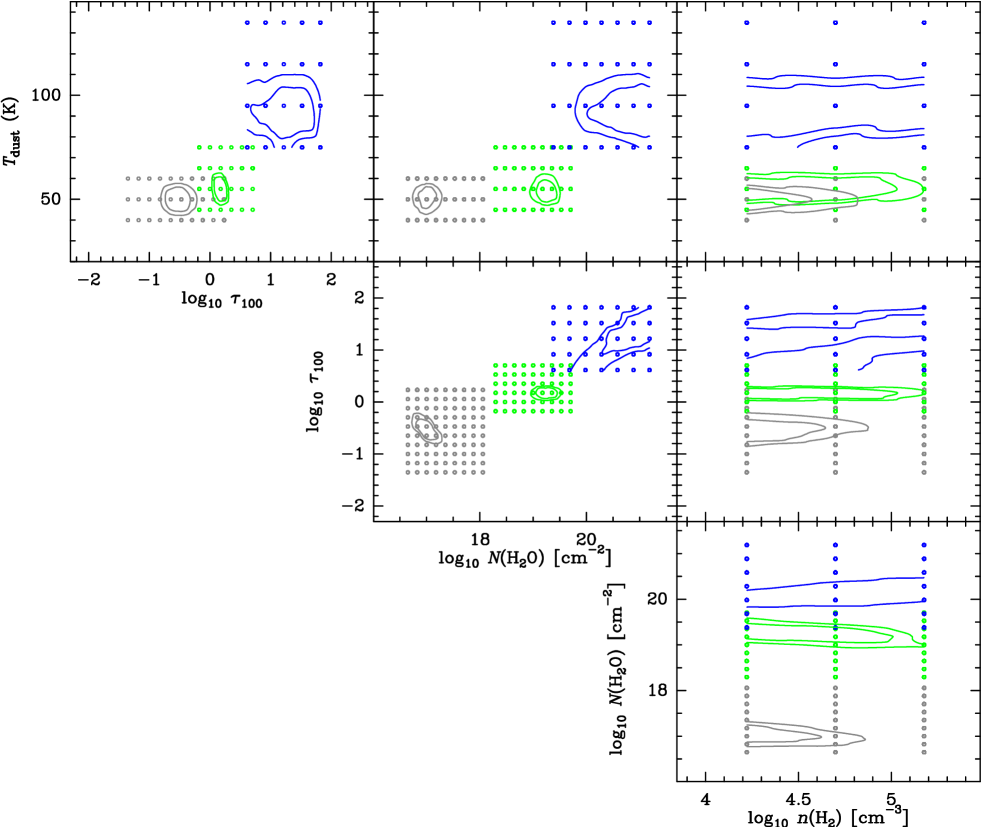
The model components are classified into 3 groups according to their physical parameters (Fig. 5). The “core” models are all optically thick in the far-IR () and very warm ( K). The “disk” models have lower but are still (nearly) optically thick () with K. The “envelope” models mainly cover optically thin conditions but can reach optically thick values (), and have moderate K. Each of these 3 groups covers a regular grid in the free parameters (, , , ). Models were generated and added to each group as needed to obtain reliable likelihood distributions of the above parameters, as shown below. While is varied by more than 1 dex within each group with multiplicative factors of , the grid for is coarser with only 3 values, representing typical densities of buried galactic nuclei ( cm-3, see Fig. 5).
3.1.4 Minimizing
As shown below, a reasonable model fit to the present data set requires the combination of components, one from each group (Fig. 5). We then consider all possible combinations, in a number of , that are obtained by taking 1 component of each group. For each combination, and since each component yields line fluxes and continuum flux densities that are proportional to the solid angle , where is the the effective radius, the reduced () is minimized to give :
| (1) |
where is the number of H2O lines and continuum flux densities that are fitted, are the observed fluxes, are their uncertainties, and is the predicted flux per unit solid angle for line by model component . To obtain , we sum in quadrature the errors in Table 1 and the systematic uncertanties of 15% and 10% for the Herschel and ALMA measurements, respectively. The minimization is performed by a standard procedure and yields both for each component of the combination and then the minimum .
3.1.5 Likelihood distributions
Our model for ESO 320-G030 has a total of free physical parameters, (, , , ) for each of the 3 model components. In our approach, the sizes for each combination are treated as derived rather than free parameters, as they are uniquely determined from the minimization above. We follow Ward et al. (2003) and Kamenetzky et al. (2011) in calculating the likelihood distributions of the free physical parameters, which are collected into vector . A given set of values yields modeled line fluxes or continuum flux densities that are inserted into the vector of components. We also denote as vectors and the values and uncertainties measured for these quantities. For a given set of physical parameters , the probability density for measuring a set of values is
| (2) | |||||
where corresponds to the line and continuum detections and to the undetected H2O line at 63.32 m, which is treated according to Appendix B by Pereira-Santaella et al. (2015).
The likelihood of a particular set of parameters , for a set of measurements , is given by the Bayes’s theorem:
| (3) |
where is the prior probability density function. The posterior distribution of eq. (3) is marginalized over to obtain the likelihood distribution of a specific parameter , and of any function of parameters (Eqs. 5 and 6 in Ward et al. 2003).
Besides calculating the probability densities of the free parameters, we also determine for each component the likelihood distributions for the sizes , the H2O abundances relative to H nuclei (, González-Alfonso et al. 2014a), the infrared luminosities , and the fractions of the H2O448 flux and 454 GHz continuum flux density arising from each component ( and , respectively).
We started running calculations with the prior probability density function for all sets of parameters. We found in this case that some solutions for the disk, characterized by extremely high and low K, yielded significant likelihood. A similar situation was also found by Ward et al. (2003) in their bayesian analysis of the 12CO emission in M82, where solutions with unphysically large CO column densities and low volume densities were rejected. We have then put a single constraint on the H2O abundance as derived above from and , which implicitly assumes a gas-to-dust ratio of 100 by mass. Models that have accounted for the H2O absorption and emission in buried galactic nuclei have shown that high H2O abundances are inferred in the very warm nuclear cores with K (González-Alfonso et al. 2012; Falstad et al. 2015, 2017; Aladro et al. 2018). However, in the more extended regions surrounding these cores where is moderate, decreases to values . To avoid unphysical solutions of extremely high in moderately warm environments, we use the prior whenever a model component with K and is found, and otherwise.
3.2 Results
| CORE | DISK | ENVELOPE | |||||||
| Parameter | Median | Rangea | Fiducialb | Median | Rangea | Fiducialb | Median | Rangea | Fiducialb |
| (K) | 95.0 | 55.0 | 50.0 | ||||||
| 32.0 | 1.5 | 0.22 | |||||||
| log10 (cm-2) | 21.2 | 19.3 | 17.0 | ||||||
| log10 (cm-3) | 4.7 | 4.2 | 4.2 | ||||||
| (pc) | c | 11.0 | 41.4 | 130 | |||||
| log10 (L⊙) | 10.2 | 10.4 | 10.9 | ||||||
| log10 (M⊙) | 8.2 | 8.1 | 8.2 | ||||||
| 0.34 | 0.66 | 0 | |||||||
| 0.29 | 0.24 | 0.47 | |||||||
| log10 | |||||||||
-
a
90% confidence intervals
-
b
Values for the fiducial model, selected for detailed comparison with data (see Sect. 3.2)
-
c
Assuming km s-1 for the core component
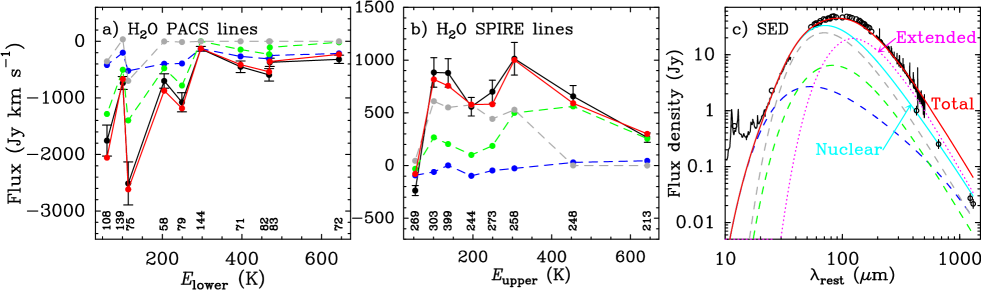
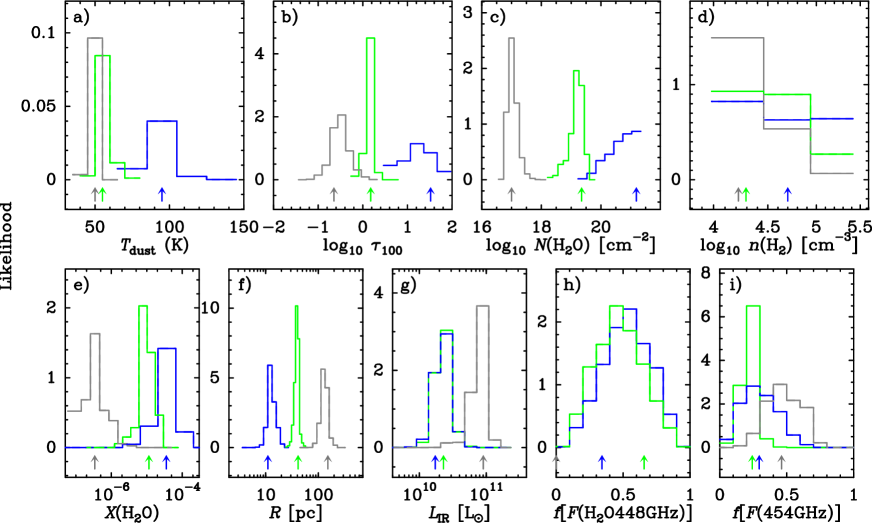
The values of for the best-fit combinations are in the range , indicating that three components provide a good fit and more are not needed. On the other hand, the minimum value of significantly increases to 2.3 when only 2 components are used. Based on the superior comparison between the observed and model-predicted maps of the H2O448 and 454 GHz continuum emission (see Sect. 3.3), we have selected a specific model combination, with , as the fiducial model for detailed comparison with the data. Results for the fiducial model are compared with Herschel data and with the observed SED of ESO 320-G030 in Fig. 6, and Fig. 7 displays the probability distributions of the free (upper row) and derived (lower row) parameters. The modeled and observed profiles of the Herschel/PACS and ALMA lines, and of the Herschel/SPIRE lines are compared in Figs. 8 and 9, respectively. Median likelihood estimators and 90% confidence intervals, together with the values of the parameters of the fiducial model, are listed in Table 2. We also evaluate the degeneracy among the free parameters by showing in Appendix B their marginalized 2D posterior distributions.
3.2.1 The core, disk, and envelope components
As stated in Sect. 3.1.4, we require 3 components to attain a reasonable fit to the whole data set, which can be now justified in the light of Figs. 6a-b and 7. To fit the high-lying absorption lines ( K) observed with Herschel/PACS, a very warm ( K) and optically thick at 100 m “core component” is required. Its very small effective size ( pc, Fig. 7f) suggests a torus around an AGN, such as that of NGC 1068 (see García-Burillo et al. 2019) but with a much higher column density and mass (Sect. 3.2.5); it could also represent super star clusters in a very early stage of evolution (Rico-Villas et al. 2020) spread over the nuclear region. Because of the compactness of this component, it cannot be solely responsible for the measured fluxes of the rest of H2O absorption lines. Therefore, the inclusion of a “disk component” is required, with a more moderate K but still optically thick in the far-IR (, Fig. 7a-b). Its size, pc (Fig. 7f), is similar to the size of the disk observed in the H2O448 ALMA line (Fig. 4c); this line is indeed predicted to be formed in both the core and disk components (Fig. 7h). The disk mainly accounts for most of the observed flux in the absorption lines with K and for the high-lying lines observed with SPIRE in emission (H2O248 and 212), contributing in addition significantly to many of the remaining lines. However, the disk cannot fully account for the low-lying ( K) emission lines (Fig. 6b), and an extended, optically thin component () is additionally required. This “envelope component”, which is also moderately warm ( K), is predicted to have a radius of pc (Table 2), similar to the extent of the low-brightness surface seen in the 454 GHz map (Fig. 4a). This consistency in sizes supports our assumption that most of the H2O low-lying emission observed with Herschel/SPIRE is of nuclear origin, although some extra-nuclear contribution to the lowest-lying H2O lines is not ruled out. The optical depths at 100 m, sizes, and H2O column densities of the three components have distributions with little overlap (Fig. 7b-c-f), which supports the reliability of our three model components approach.
3.2.2 H2O excitation, column densities, and abundances
While our model grid only explores results for a fixed K and 3 (expectedly representative) values of , Fig. 7d indicates that the excitation of H2O is dominated by radiative pumping: The flat distribution in densities for the core indicates that results for this component are insensitive to ; for the envelope, results strongly favor low , and low or moderate densities of several cm-3 are favored for the disk. We expect that varies across the different components, and that the derived densities would be higher than suggested by Fig. 7d if were lower than assumed. Our models, however, do not require the use of a varying because collisional excitation does not appear to play a key role in the excitation of H2O.
The column densities of the envelope and disk components are well defined and very different, and cm-2 respectively (Fig. 7c). Estimating the H column densities from the continuum optical depth at 100 m, the resulting abundances are and for the envelope and the disk, respectively.
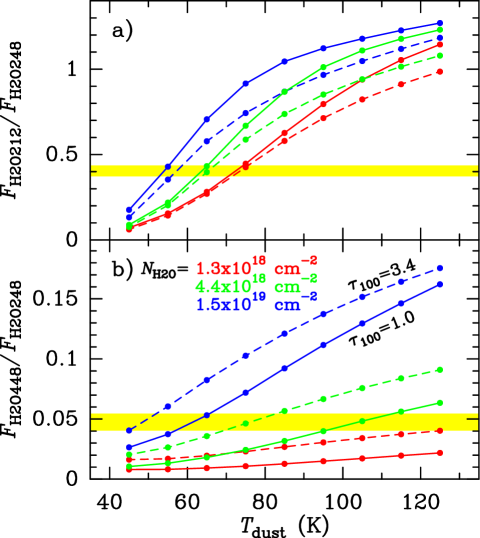
The disk component, which has high and is optically thick in the far-IR, nevertheless has a moderate K. Since the H2O248 and H2O212 emission lines are expected to arise predominantly from the nuclear disk (Figs. 6b and 9), we use their ratio in Fig. 10a to better demonstrate the origin of the physical conditions inferred for this component. The measured H2O212-to-H2O248 flux ratio of is by itself consistent with a range of K depending on , with decreasing with increasing . This degeneracy is broken when considering the H2O448 line observed with ALMA. The measured H2O448-to-H2O248 flux ratio in Fig. 10b has been corrected to account for only the fraction of the H2O448 flux, %, arising from the disk (see Section 3.3.3). Even with this correction, the resulting ratio of is so high that it cannot be explained with the lowest cm-2 considered in Fig. 10b, but requires higher columns. The highest cm-2 and K are mostly consistent with both ratios displayed in Fig. 10, although the increase in , as favored in Appendix A, would also enable warmer K and lower cm-2. The inferred extremely high in the disk is consistent with the strong absorption and emission in the HO and 18OH lines, which still require a low abundance ratio (Appendix A).
In the core component, only a lower limit for of cm-2 is obtained. Primarily responsible for the very high-lying excitation observed with Herschel/PACS H2O lines in absorption (specifically the H2O72 line with K), all lines -including the submillimeter H2O448 transition- are saturated in this component. The values of and are also rather uncertain for the core given its extremely buried conditions.
3.2.3 The fit to the SED and the nuclear SFR
The SED predicted by our fiducial model, shown in Fig. 6c, is rather representative of all best-fit combinations. In the transition from the mid- to far-IR wavelengths ( m), the SED is dominated by the optically thin, extended envelope, but the flux densities in the (sub)millimeter from the three components are expected to be comparable. The three nuclear components combined, however, account for a luminosity of L⊙ (light-blue curve in Fig. 6c for the fiducial model), that is, % of the total galaxy luminosity. To fit the whole SED from to m as observed with Spitzer and Herschel/PACS and SPIRE, an additional extra-nuclear component has been included in Fig. 6c (magenta curve, labeled extended), with K and L⊙. ALMA and Herschel/SPIRE measure continuum flux densities at 428 m of and Jy, respectively, indeed indicating the presence of a continuum component missed by ALMA, also at longer wavelengths ( mm, Fig. 6c). This component is expected to be of much larger extent than the nuclear components traced by H2O, and associated with star formation in the rest of the galaxy. There is indeed prominent Pa- emission well outside the nuclear region (Alonso-Herrero et al. 2006, see also Sect. 4.1).
Using the Kennicutt & Evans (2012) star formation rate (SFR) calibration of the total IR luminosity, which is based on the works by Murphy et al. (2011) and Hao et al. (2011), the total and nuclear SFR are and M⊙ yr-1, respectively. These values also assume that the very optically thick and compact core component is powered by star formation; if we assume that its luminosity is driven by an extremely buried AGN, the nuclear SFR is derived from the IR luminosities of only the disk and envelope to give M⊙ yr-1. Our inferred nuclear SFR is % higher than the values previously estimated ( M⊙ yr-1; Rodríguez-Zaurín et al. 2011; Pereira-Santaella et al. 2016).
The distribution of infrared luminosities of the three nuclear components, shown in Fig. 7g, indicate rather surprisingly similar values for the compact core and the more extended disk. This could suggest that the disk is to some extent heated by (and reemitting) the radiation coming out from the core. However, the disk cannot surround the core on the front side (as seen from the Earth) because the former is optically thick in the far-IR continuum and hence the core would not be detected in the far-IR H2O lines. If the disk extends only on the sides of the core, it will only intercept a fraction of the luminosity emitted by the latter, thus limiting the nonlocal heating effect at spatial scales of pc.
3.2.4 The H2O448 line and the 454 GHz continuum emission
The relative contributions of the three nuclear components to the 454 GHz total flux density of mJy () are uncertain. While the contribution by the disk is expected to be around %, the contributions by the core and the envelope show broad distributions (Fig. 7i). This uncertainty is due to the distributions in sizes for the envelope and core, and to the relatively broad distribution found for the optical depth of the core (Fig. 7b). The fiducial model has continuum optical depths at 454 GHz of , , and for the core, disk, and envelope, respectively.
The relative contributions of the core and disk components to the H2O448 flux are even more uncertain (Fig. 7h). (The envelope makes a negligible contribution to this line in any case.) Since the H2O448 line is seen in emission, it is potentially sensitive to the volume of the source (rather than to the surface, as is the case for absorption lines) except when saturated, and its flux also depends on the details of the extinction within the core at 448 GHz. Nevertheless, this ambiguity is solved below (Sect. 3.3) because we have the maps of both the H2O448 line and 454 GHz continuum emission, which can be compared with predictions from the model combinations.
3.2.5 Gas masses
We calculate the gas mass of each component traced by H2O as
| (4) |
where cm-2 is the gas column per unit optical depth at 100 m (González-Alfonso et al. 2014a), and accounts for He. The computed values are also listed in Table 2. The mass associated with the core component has a large uncertainty because its is not well constrained. Our 3D approach in Sect. 3.3 indicates that its mass likely does not exceed M⊙. The combined gas mass of the 3 nuclear components is M⊙.
The CO emission from Pereira-Santaella et al. (2016) has also been used to estimate gas masses. Using the CO emission within the 3 contour of the 454 GHz emission displayed in Fig. 4a, thus covering accurately the three components traced by H2O, and assuming the same brightness for the and lines with a ULIRG conversion factor of , the gas mass is M⊙. This value is comparable to the mass derived from the H2O model. The CO emission is however much more extended than the 454 GHz contiuum (see Sect. 4.1); the gas masses within radii of , , and in the plane of the galaxy (233, 466, and 700 pc, respectively) are , , and M⊙, respectively.
The three components probed by H2O lie within a radius of ( pc) from the galaxy center. The dynamical mass within this radius can be estimated from the rotation curve shown by Pereira-Santaella et al. (2016), which gives M⊙ (M. Pereira-Santaella et al., in prep). Using the combined gas mass as derived above from the H2O model, the gas fraction is %. At the current rate of nuclear star formation (Sect. 3.2.3), the nuclear starburst has an age of Myr. This should be considered an upper limit owing to the plausible presence of a stellar population prior to the current burst.
3.2.6 Summary and limitations of the model

Figure 11 summarizes visually two possible scenarios of the model source based on our three component fitting of the nuclear region of ESO 320-G030. The most extended component, the envelope, has a luminosity of L⊙ and an effective radius of pc, is optically thin in the far-IR, and only contributes significantly to the absorption or emission of the lowest-lying far-IR and submillimeter lines. Its contribution to the H2O448 line is negligible, as this line is exclusively formed in environments that are optically thick in the far-IR, the disk and the core. The disk has a luminosity of L⊙ and an effective radius of pc, and contributes significantly to the excited lines of H2O both in absorption and in emission. Our sketch in Fig. 11 shows the envelope and the disk as ellipses with their major axis coincident with the minor kinematic axis to account for the apparent elongation of the source in that direction, which nearly coincides with the direction of the nuclear bar. The different components can indeed be inclined and shaped arbitrarily provided that the solid angle as derived from our models remains unchanged (ignoring possible significant changes in level populations as a consequence of the different geometry). The disk component is (partially) resolved by the ALMA beam of . Finally, we identify from the very high-lying absorption lines of H2O an additional, very compact component with an effective radius of pc, very warm ( K), and with a luminosity similar to that of the disk despite its small size. It is extremely buried with H2 columns probably above cm-2, resembling the buried galactic nuclei (BGNs) detected in HCN vibrational emission (e.g., Sakamoto et al. 2010; Aalto et al. 2015; Martín et al. 2016). This core is however unresolved by the ALMA beam, and our fit to the H2O fluxes cannot distinguish between a physically coherent region at the center of the galaxy, as depicted in model A, or a discrete set of star-forming cores spread out over the disk volume (model B) or even beyond. Nevertheless, we can discriminate between both models by comparing the observed spatial distribution of the 454 GHz continuum and H2O448 emission with the predicted distributions involved by the two scenarios in Fig. 11, as shown below.
3.3 A 3D approach
A 3D model approach is here used with three main purposes: first, to check the reliability of our model fits, and in particular of the calculated sizes of the three components. This is performed by inspecting whether any of our best-fit model combinations, obtained from spherically symmetric models, can predict spatial distributions for the 454 GHz continuum and H2O448 line emission that are consistent with the ALMA maps. The comparison will provide a way to refine the overall model and discriminate among combinations with low , as the contributions by the several model components to the H2O448 line and to the 454 GHz continuum emission are poorly determined (Fig. 7h-i). Second, we also aim to discriminate between scenarios A and B in Fig. 11. Finally, analysis of the velocity field will establish the dynamical mass as a function of inclination, favoring a given geometric disposition relative to the plane of the galaxy that may shed light on the gas motions responsible for the formation of the nuclear structure.
3.3.1 Description of the 3D model

Our model simulates arbitrarily complex source geometries and velocity fields by means of small cubes defined within a large cube of side 480 pc. The small cubes have sides of pc, which determines the resolution of the simulations. While calculations for the equilibrium can be performed with a Monte Carlo approach, we simply use in the present calculations the values of and optical depths (i.e., the brightness), and sizes (i.e., the solid angle) of the three components as inferred from our fiducial model to generate beam-convolved maps at 454 GHz that can be directly compared with the observed maps. Likewise, we use the brightness and solid angle of the H2O448 line for the core and disk components, as derived from the fiducial model, to generate beam-convolved maps for the H2O448 line that are compared with the observed spatial distribution.
We use the geometry depicted in Fig. 11. The disk and envelope are assumed to lie in the plane of the galaxy, and are observed with an inclination angle of (Pereira-Santaella et al. 2016). The actual sizes for the fiducial model in Table 2 are then increased to match the required solid angles. The kinematic major axis observed in the nuclear region, however, has a PA of , significantly higher than the value of derived from the large-scale CO observations (Pereira-Santaella et al. 2016). To approximately account for the elongated shapes along the minor kinematic axis observed in the lowest contours of the 454 GHz continuum and H2O448 line images (Fig. 4), the disk and envelope are modeled as ellipses with aspect ratio . The envelope is assumed to cover the disk on the front and back sides, with an effective radius fixed at 130 pc.
The unresolved core component in model A is simulated as a spherical source. In model B, no core is included and the brightness of the disk in both the 454 GHz continuum and the H2O448 line are increased to match the combined flux of both components.
As pointed out above, there is a wide range in both and (i.e., the relative contributions of the different components to the H2O448 line and 454 GHz continuum emission) among our best-fit solutions (Table 2 and Fig. 7h-i). Our fiducial model was selected because it generates maps for both the 454 GHz continuum and H2O448 line that compare well with the observed maps, as shown in the next sections.
3.3.2 The 454 GHz continuum
The 3D simulation of the 454 GHz continuum for the fiducial model is compared with the observed map in Fig. 12. Maps of the continuum optical depth at 454 GHz for models A and B are displayed in panels e and f, respectively, and the corresponding intensity maps are shown in panels b and c. The solid angle subtended by each isocontour in panels a-c is shown in panel d.
Our fiducial model reproduces the overall distribution of intensities rather satisfactorily. Specifically, the envelope is required to account for the observed extended emission of the continuum. It is also evident from Fig. 12 that model A more closely resembles the observed map than model B, indicating the presence of an intensity peak of the continuum at the center that we associate with the very high-lying H2O absorption lines, that is, the core. However, model A slightly overpredicts the intensity continuum from the center. While the model predicts fluxes of and mJy from the core and the disk, a better match to the map would be obtained with and mJy, respectively.
3.3.3 The H2O448 line emission
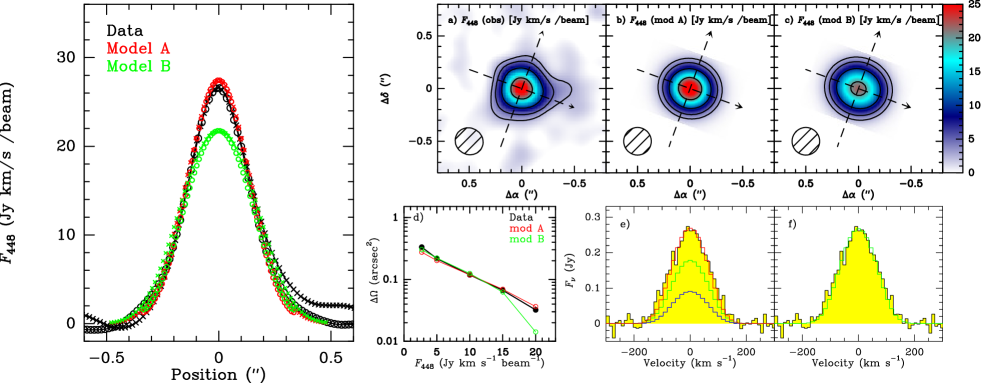
Only the core and the disk are included in the simulations for the H2O448 line emission, as the optically thin envelope does not obscure or contribute to this intrinsically weak line. The simulated velocity-integrated intensity maps of the line for models A and B are compared with the observed map in Fig. 13a-c, and the solid angles subtended by the isocontours in these panels are compared in panel d. The emergent line profiles from the whole region are compared with the observed profile in panels e and f, and the observed and modeled intensities along the major and minor axes are compared in the left-hand panel.
From the comparison of the maps, we conclude that an effective disk radius of pc matches rather well the observed map. In addition, model A matches the observed intensity distribution slightly better than model B, although higher angular resolution is required to verify this point. In our fiducial model, the core accounts for Jy km s-1 (, Fig. 7h) so that the disk dominates the H2O448 line emission.
3.3.4 The velocity field
The 3D simulations also provide a good match to the observed H2O448 line shape (Fig. 13e-f). Line broadening is here simulated by both microturbulence, with the same km s-1 as adopted for the 1D models, and a rotating velocity field that further broadens the line, of the form:
| (5) | |||||
| (6) |
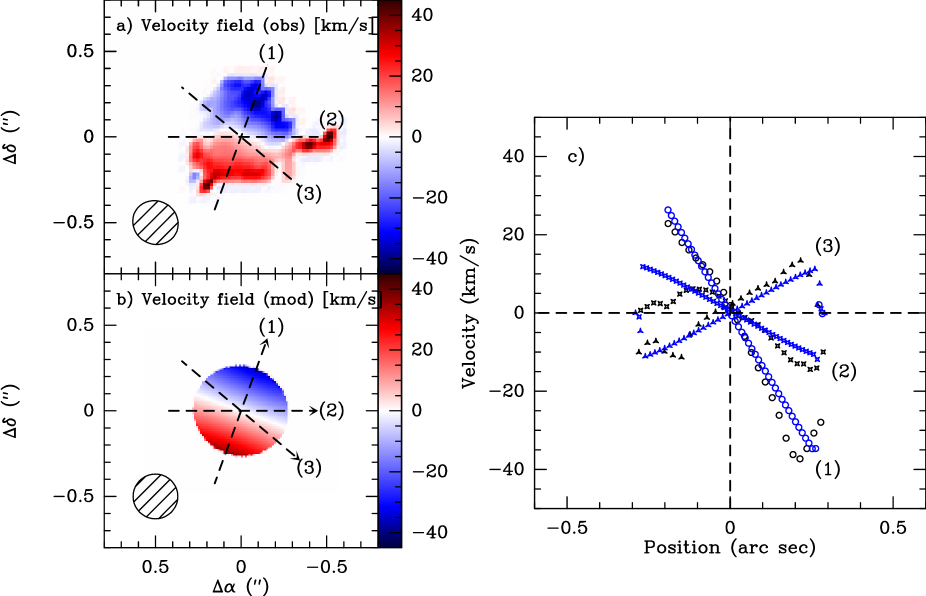
where is the radius of the core component. We have not attempted more complex velocity fields given our limited spatial resolution and significant beam smearing. Figure 14 compares the observed and modeled maps of the line-of-sight velocity. Although our adopted velocity field approximately accounts for the observed rotation, the observed field is quite distorted, as is also seen from the strips along the three axes in panel c. The apparent S-shape of the zero velocity contour may indicate an elongated disk (Franx & de Zeeuw 1992) or warping, but also the presence of inflowing gas motions along the minor kinematic axis of the disk. A massive inflow is indeed observed on larger spatial scales, as described below (Sect. 4).
The rotational velocity of km s-1 of the disk gives a dynamical mass that is inconsistent with the high concentration of gas in the nuclear region. Considering both the rotation and dispersion motions as in Bellocchi et al. (2013), (where the velocities are in km s-1 and in pc) gives at pc, while the combined gas mass (i.e., not including the stellar mass) of the core and disk components is (Sect. 3.2.5). This discrepancy can be attributed to a lower inclination of the nuclear disk relative to that of the host galaxy; indeed, the kinematic major axis of the nuclear disk is significantly rotated relative to that of the host, which may suggest some degree of kinematic decoupling. Alternatively, could underestimate if the nuclear gas is not rotationally supported, but supported by radiation pressure and turbulence.
3.3.5 Additional remarks
While the model with 3 components accounts for the main properties of H2O448 and continuum emission as observed at (60 pc) resolution, it is obviously very schematic with sharp edges and transitions from one component to the next. In reality, we may expect a smoother transition between the different components, with the envelope representing the optically thin extension of the nuclear disk, and the core a cusp of gas column density and located at the center of the galaxy. On the other hand, the majority of the H2O absorption lines observed with Herschel/PACS have rest wavelengths m, with only 2 absorption lines observed at longer wavelengths. This means that the continuum optical depth of the disk at m is better probed by species with lines observed in this wavelength range. Our model for the remaining molecular species in Appendix A indeed indicates that (disk) is probably somewhat higher () than in our fiducial model. Finally, we note that the sizes estimated for the different components depend on the assumed velocity dispersion of 100 km s-1. While these sizes and are well constrained for the disk and envelope given the spatial resolution of our ALMA data and the spectral resolution of the H2O448 line, the size of the compact core is not so well constrained as it would increase with lower . Higher spatial resolution observations would be required to better constrain the size and kinematics of this component.
4 A massive molecular inflow feeding the nucleus of ESO 320-G030
4.1 The inflow seen in CO 2-1
We have so far analyzed the nuclear (inner pc) region of ESO 320-G030 by combining the Herschel and ALMA H2O lines and the far-IR and submm continuum, but can we trace the formation of such an extreme nuclear region from the observed kinematics at larger spatial scales? Pereira-Santaella et al. (2016) reported the CO map observed with ALMA on spatial scales of and with a resolution similar to that of the H2O448 observations, , thus providing an ideal tool to search for hints of inflowing gas. Pereira-Santaella et al. (2016) fit the large-scale velocity field in ESO 320-G030 by excluding the nuclear region where complex CO profiles were found; here we focus on the CO in this nuclear region.
4.1.1 The velocity field
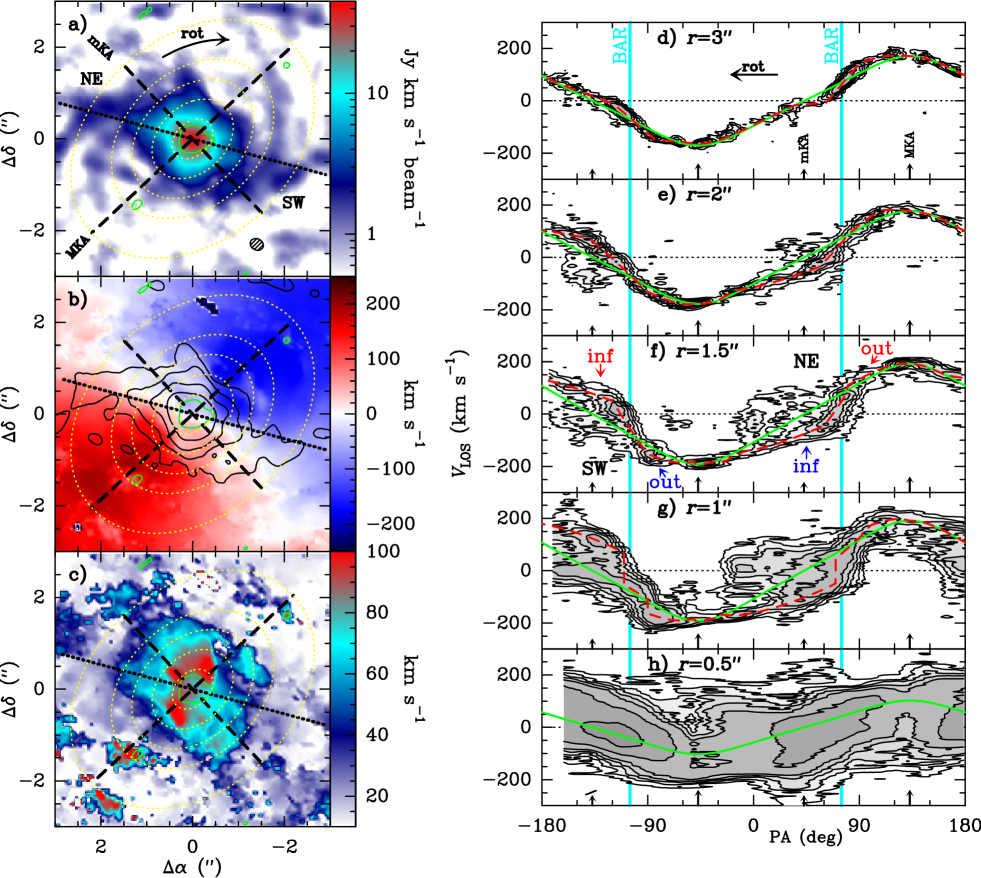
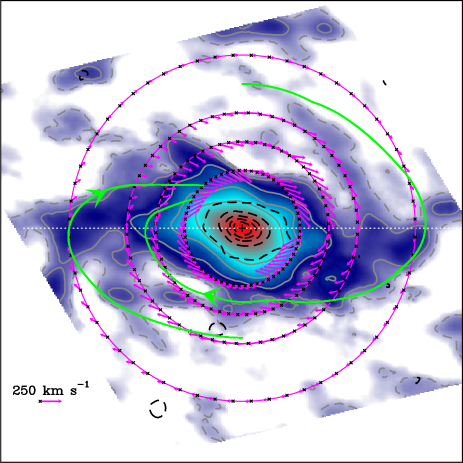
Figure 15a-c shows the CO color-coded maps of integrated intensity (moment 0, between and km s-1), the velocity field (moment 1) and velocity dispersion (moment 2), respectively. The dotted line in these panels indicates the approximate direction of the nuclear bar (), which is well traced by the VLT/NACO K-band image shown in Fig. 17a. The green contour at the center in Fig. 15a-c is the lowest (most extended) contour of the H2O448 line in Fig. 4b, emphasizing the compactness of the core+disk nuclear structure probed by the H2O line as compared with the large-scale CO emission. The yellow dotted curves depict circles in the plane of the galaxy with radii , , , , and . PV diagrams along these circles are shown in panels d-h, where the green curves indicate the velocity field fitted by Pereira-Santaella et al. (2016), that is, a uniform rotational velocity with no radial component. It is clearly seen in panels d-g that, around the PA of the bar and mostly overshooting it (i.e., at lower PA, in the clockwise direction of rotation), the bulk of the gas shows significant departures from these ordered circular motions.
We have then modified this regular velocity field to account for the main kinematic departures from the green curves:
| (7) | |||||
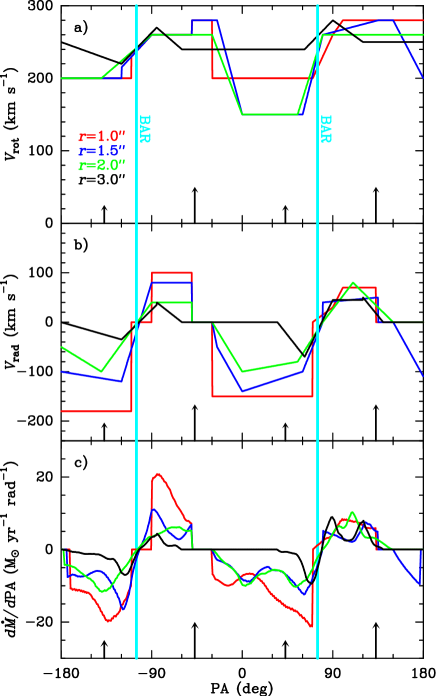
where , increasing in the clockwise (rotation) direction, measures the angular position in the plane of the galaxy, is the position angle of the major kinematic axis (MKA), is the inclination angle, is the rotational velocity, and is the radial component of the velocity. Equation (7) takes into account that the NE region is the far-side of the disk (Fig. 11; see also Fig. 9 in Cazzoli et al. 2014), and hence any inflowing component () in that region () will be blueshifted (see Fig. 15f). Similarly, the SW region corresponds to the near side of the disk, and any inflow component here would be redshifted. The modified velocity field is displayed with dashed red curves in panels d-h, and the curves of and along these circles are shown in Fig. 16a-b.
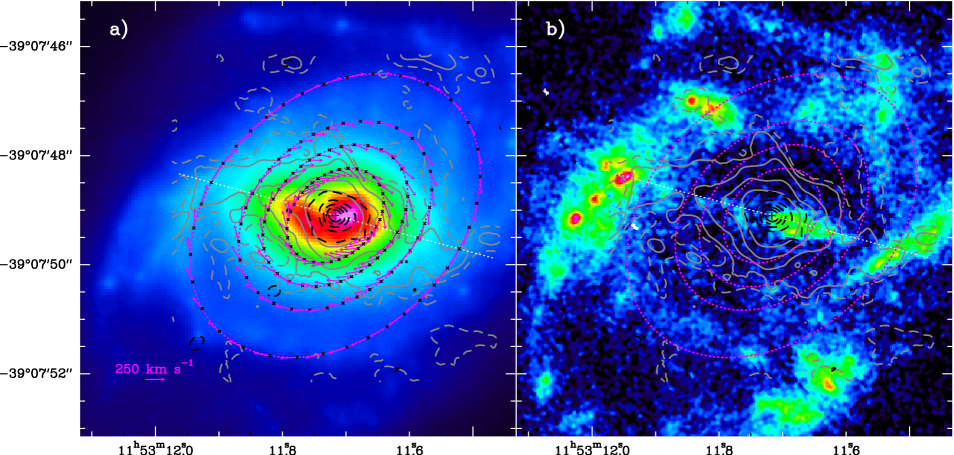
The integrated intensity map in Fig. 15a shows relatively strong emission not only along the bar but also at lower PA, resulting in an elongated shape along the minor kinematic axis (mKA). This is the region where the velocity dispersion is above 60 km s-1 (panel c) and where the velocity field shows strong disturbances (panel b). Two trailing spiral arms at pitch angle of arise from each side of the bar.
The overall kinematics shown in Fig. 15d-g clearly illustrate that the bulk of the gas in the NE region of the disk, ahead of the bar major axis in the forward (rotation) direction (, i.e., at around the mKA), is blueshifted, and the gas on the opposite SW region of the disk () is redshifted (as indicated in panel f). This effect is already seen at (700 pc), and becomes increasingly pronounced toward the center. If the gas in these regions remains in the plane of the galaxy, the observed velocity shifts are ascribed to an inflow (), as along the mKA. In addition, we also find clear evidence of outflowing gas () at PA higher than that of the bar (i.e., for gas that has not still arrived at the bar). The outflowing gas is clearly seen at (see Fig. 15f); it is blueshifted (redshifted) on the western (eastern) side of the disk. Nevertheless, the magnitude of this velocity is significantly lower than the inflow velocity ahead of the bar, except at where both are similar (Fig. 16b).
Our fit to the PV diagrams in Fig. 15d-g, with results for and in Fig. 16a-b, respectively, is based on the observed slope and values of . Around the mKA, where gas on both sides of the disk shows inflowing velocities, is well constrained from the values of . Inflow velocities as large as km s-1 are obtained at ( pc). The slope of in these PA regions indicates that, at , sharply decreases to km s-1. At PA around and , where outflowing gas is detected, we have some degeneracy between and , which is approximately solved from the slope of . At , we find some evidence of increasing at the trailing edge of the bar. At , the CO lines become very broad with FWZI of km s-1; the high turbulence masks both the rotation field and any possible inflow in these innermost regions, although hints of a velocity pattern similar to that found at higher are seen on the NE side of the disk. The inflow in this region is better probed by the OH lines (Sect. 4.2).
Besides the above velocity field that applies to the bulk of gas at different radii and PA, Fig. 15 also shows a low intensity component that is fully decoupled from the overall pattern but is also symmetric relative to the center. It is traced by the lowest contour(s) in the velocity-position maps of panels e-g, showing very-high velocity dispersion. This component is already seen at around and, symmetrically, around (panel e), with line-of-sight velocities that extend from the velocity of the rotating gas at that position to a similar velocity but with opposite sign. As decreases to , the component becomes more extended in PA. The overall direction of this component is similar to that of the outflowing clumps observed in CO 2-1 (Pereira-Santaella et al. 2016), and to the direction of the bipolar outflow seen in NaD as well (Cazzoli et al. 2014). It is thus possible that this CO component represents the low-velocity counterpart of the CO outflow, with a relatively high opening angle that enables both negative and positive line-of-sight velocities at a given position. Nevertheless, a more plausible interpretation suggested by the limiting velocities and also by the location of this component ahead of the bar major axis, is that it represents the kinematic effect of the strong shock produced by the gas overshooting the bar. The fraction of gas mass sampled within a velocity range of km s-1 around the red curves in Fig. 15d-g ranges from 43% at to 87% at .
4.1.2 The gas flow
The Pa- image in Fig. 17b (from Alonso-Herrero et al. 2006) shows ring-like emission with a radius of kpc, at the expected location of the inner Lindblad resonance (ILR) of the primary bar where the gas tends to pile up and star formation is likely to proceed. Friedli & Martinet (1993) argued that, in order to avoid chaos around the principal resonances, a double-bar system evolves with the corotation radius of the nuclear bar coincident with the ILR of the large-scale bar (see also Hunt et al. 2008), and we indeed observe CO emission along the nuclear gas bar approaching the Pa- ring (Fig. 17b). Using (Athanassoula 1992), appropriate for fast rotating bars, also gives a similar kpc. The nuclear bar pattern speed is expected to be km s-1 kpc-1, where we have used the observed velocity field fitted by Pereira-Santaella et al. (2016). Such a high value of indicates that the nuclear bar is decoupled from the primary bar; simulations indeed indicate that the decoupling requires both the presence of the primary bar ILR and the anti-bar orbit family (Friedli & Martinet 1993). The properties of the nuclear bar of ESO 320-G030 (length and ) are similar to those of NGC 2782 (Hunt et al. 2008). At ( pc), the velocity of the bar is km s-1. Therefore, the gas on the trailing edge outruns the bar, but the gas on the leading edge has a small rotational velocity ( km s-1) in the frame of the rotating bar, comparable to or even lower than the inflow velocities in the same region.
The K-band image of ESO 320-G030, displayed in Fig. 17a, probes the nuclear bar rather well, with still a V-shaped apparent absorption at probably caused by the outflow observed around that direction (Pereira-Santaella et al. 2016; Cazzoli et al. 2014). The velocity vectors of the molecular gas along the circles, projected on the plane of sky, are overlaid on this image. Most of the CO emission along the gas bar is spatially shifted in the clockwise (rotation) direction relative to the stellar bar. The inflowing gas () is also seen ahead of the bar major axis, and the outflowing gas is observed on the opposite sides, so that both mark the intersections of the gas flow, which is elongated along the bar, with the circles. Nevertheless, owing to the asymmetry of the negative and positive values of (Fig. 16b), the lines of gas flow are not expected to be closed, but will spiral onto the nuclear region.
Since the gas orbits are expected to be approximately stationary in the rotating bar frame, we show in Fig. 18 the deprojected images of CO and 454 GHz continuum, together with the inferred velocity vectors in the frame of the bar after correcting for the assumed km s-1 kpc-1. The whole image is rotated such that the bar lies in the horizontal direction. In this frame, the velocity vectors are nearly parallel to the isocontours of CO emission at the leading edge of the gas bar, and are perpendicular to the bar where the gas crosses it. Therefore, our inferred velocity field approximately accounts for the morphology of the leading edge of the gas bar, where the gas flows parallel to the bar and in the inward direction. This point is better seen with the two green curves of Fig. 18, which are generated by integrating over time the velocity vector. The departing points are selected so as the lines get close to the circle when crossing the bar. The curves should be considered with caution, as the velocity field is only determined at four radial positions and a linear interpolation is performed at all other radii. Nevertheless, they seem to delineate rather well the leading edge of the CO gas bar. This connection between kinematics and morphology gives support to the model, and illustrates the very efficient bar mechanism to drive a massive inflow. While these green lines cannot be considered realistic gas “orbits,” due to complex events such as shocks at the bar position, they represent prominent (dominant) lines of gas flow associated with the velocity component in red in Fig. 15d-g, and as such they have an associated timescale. The elapsed time along the calculated lines is 13 and 24 Myr, corresponding to turns of the bar.
4.1.3 The mass inflow rate
We estimate the instantaneous mass inflow rate at a radius as the net gas mass crossing in the inward direction the circles depicted in Fig. 15a-c per unit time:
| (8) | |||||
where is an arc element in the plane of the galaxy, measures the gas mass with , is the beam area at the source distance, and is the radial interval sampled by the beam in the galaxy plane. This equation integrates over the circles the gas mass flowing with divided by , where is displayed in Fig. 16b. In the second equality of eq. (8), the CO luminosity only involves line-of-sight velocities within km s-1 from the red curves in Fig. 15d-g. We adopt a conversion factor , and implicitly assume the same brightness for the CO and lines. Finally, and (both within the range ) are geometrical factors that account for the source inclination; corrects for the radial interval sampled by the beam on the plane of the source, and corrects for the projection of the circular arcs on the plane of the sky:
| (9) |
Equation (8) implicitely corrects the gas mass crossing the circles in the inward direction () for that crossing them in the outward direction (), and can be thus considered net inflow rates. The values of as a function of PA are displayed in Fig. 16c, where negative (positive) values indicate inflowing (outflowing) contributions. It shows that the outflowing mass does not cancel the inflowing mass at , although a massive outflowing clump is seen at for .
The values of are listed in Table 3. At , yr-1 is similar to our estimated nuclear SFR ( yr-1, Sect. 3.2.3), strongly suggesting that the nuclear starburst is fed and sustained by the observed inflow. Our values are not corrected by the feedback from the nuclear region, although yr-1 (Pereira-Santaella et al. 2016). We have also estimated in Table 3 the inward flux of angular momentum across the quoted circles, by including the factor in the second equality of eq. (8). While is negative at , meaning a net transfer of angular momentum outward, its value at shorter radii does not show a clear dependence on .
| a | a | |
| ( yr-1) | ( pc km s-1 yr-1) | |
| 3 | ||
| 2 | 11.3 | |
| 1.5 | 16.0 | |
| 1 | 19.9 |
-
a
Both and are net values.
The timescale associated with the inflow is , where is the gas mass of the nuclear region ( , Sect. 3.2.5). This gives the time for complete nuclear gas replenishment, Myr, which corresponds to rotation period of the nuclear bar. This timescale is similar to the elapsed time estimated for the longest curve in Fig. 18, Myr. Since the gas mass enclosed in the annulus between and is (Sect. 3.2.5), it gives an independent estimate of yr-1. The similarity of both estimates is encouraging, given that the former gives an “instantaneous” value (i.e., averaged over the time the flow crosses a radial distance equivalent to the beam size, Myr at 100 km s-1) while the latter is a value averaged over the next Myr.
Our timescale for complete nuclear gas replenishment is also similar –to within a factor of 2– to the equivalent timescales estimated for NGC 4418 (González-Alfonso et al. 2012; Sakamoto et al. 2013) and Arp 299a (Falstad et al. 2017), two LIRGs with luminosities similar to ESO 320-G030 and showing also inflowing molecular gas toward their nuclei. It is also consistent with the expectedly short timescales of low-luminosity AGN duty cycles (García-Burillo & Combes 2012).
4.1.4 The overall scenario
The kinematic model derived from the CO data cube indicates an efficient mechanism that drives a massive inflow along the bar. The gas in the arms, which is rotating faster than the bar, overruns it with perpendicular incidence. At and beyond the leading edge of the bar, a negative torque is exerted by the stars that drains angular momentum of the molecular gas (García-Burillo et al. 2005; Hunt et al. 2008), generating orbits of high eccentricity that make the gas flow couple to the bar morphology. The steep change in the direction of the velocity vectors at the leading edge of the bar suggests the presence of a nearly radial shock front, which is offset from the bar major axis in the forward (rotation) direction (Kormendy & Kennicutt 2004). The gas approaching the bar in the perpendicular direction will shock the gas flowing parallel to the bar along its leading edge, coming from larger . Dissipation of kinetic energy through these shocks and viscosity contribute to drive a quasi-radial inflow in the rotating bar frame; we expect that after just two crossings of the bar, the inflowing gas will accumulate, through a shock that drives turbulence, around the envelope and nuclear disk, thus feeding the nuclear starburst. In ESO 320-G030, the inflowing gas does not stall in a ring at the ILR of the nuclear bar, but continues all the way toward the inner pc as evidenced by the high concentration of warm molecular gas forming the structures probed by H2O and other species (Appendix A). The enhanced nuclear star formation as derived from the IR luminosities of the nuclear disk and envelope (Sect. 3.2.3) strongly suggests that we are viewing a pseudobulge in formation, namely, a proto-pseudobulge.
We obtain inflow velocities comparable in magnitude to those inferred in NGC 1530 (Regan et al. 1997), and also increasing toward the center. With decreasing distance to the nucleus, shocks increase the gas turbulence and the inflow becomes more disordered and not restricted to the plane of the galaxy. Fig. 15c shows that velocity dispersion as measured by CO 2-1 apparently decreases just at the nucleus. This decreasing is associated with a nuclear blue asymmetric self-absorbed CO profile (Pereira-Santaella et al. 2017), illustrating that the inflowing gas from the SW region is also seen in front of the nucleus at small radii. The increasing flow distortion, with gas inflowing along orbits not contained in the galaxy plane, is also required to account for the redshifted velocities found in the OH 119 and 79 m doublets observed in absorption (Sect. 4.2), indicating the presence of gas with line-of-sight velocities of km s-1. It is plausible that this represents the effect of vertical resonances on the gas flow that make the inflow 3D (Pfenniger & Norman 1990). The extra-planar flow of gas may also have a contribution from the fountain effect generated by the neutral outflow (Cazzoli et al. 2014), which remains gravitationally bound to the galaxy.
4.2 The inflow observed in the far-IR
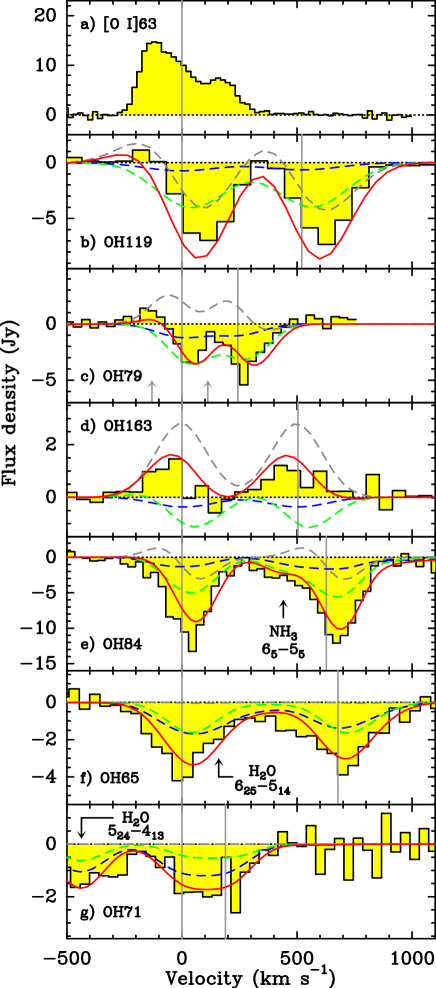
Clear evidence of inflowing gas is also seen in the far-IR. The [O i] 63 m line shows a blue asymmetric profile with redshifted absorption at km s-1 (Fig. 20a). Unlike the case of NGC 4418 (González-Alfonso et al. 2012), however, the redshifted part of the profile is seen in emission above the continuum, probably because the continuum emission from ESO 320-G030 is less spatially concentrated than in NGC 4418.
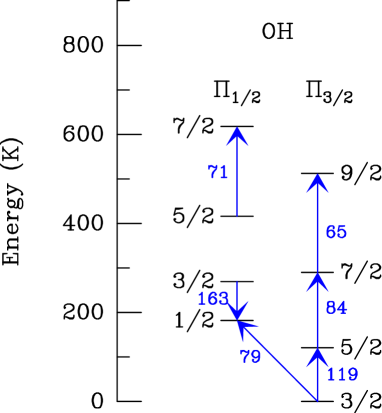
The observed OH doublets, indicated in the energy level diagram of Fig. 19, show a sequence in the velocity of the absorption as a function of the lower level energy and line optical depth (Fig. 20b-g): The ground-state and optically thick OH 119 m doublet peaks at km s-1; the cross-ladder ground-state OH 79 m doublet, with lower opacity, also shows evidence for redshifted absorption but at lower velocities; the OH 84 m doublet, with K, still shows some hints of redshifted absorption, but the high-lying OH 65 and 71 m doublets, with and K, respectively, peak at central velocities. Since the doublets progressively probe more excited (and therefore more central) regions, the inflow dissipates its kinetic energy when approaching the very inner regions of the nucleus (i.e., the disk, where inflow motions are still seen, and the core).
On the other hand, the high OH column densities (see below) required to account for the observed absorption suggest that these are produced within the nuclear region sampled by H2O. Therefore, we explore here whether the inflow observed in the far-IR is primarily associated with the outermost nuclear H2O component, that is, the envelope, responsible for the low-lying H2O far-IR absorption and submm emission lines. Indeed, hints of redshifted absorption are also seen in the H2O138 and H2O75 lines (Fig. 8). This inflowing region is smaller (, Fig. 11) than that sampled by CO (, Fig. 15).
We have then applied the composite H2O fiducial model to OH, but have included a velocity field as follows: For the envelope, the gas is inflowing with a velocity of 100 km s-1 at the outermost radius and decreasing linearly with radius; for the disk, an inflow velocity of 60 km s-1 is adopted. No velocity field is included for the core component. Model results are overlaid on the observed line profiles in Fig. 20b-e, and are roughly consistent with the scenario that the inverse P-Cygni OH 119 m and 79 m profiles are driven by an inflow within the envelope that primarily applies to the external shells ( pc). Since this component is optically thin in the far-IR continuum, it generates inverse P-Cygni profiles in OH 119 and OH 84 m but a blue asymmetric profile in OH 79 m (gray dashed curves in Fig. 20). Toward the optically thick disk and core components all doublets are predicted in absorption, and the blue asymmetric profile of the OH 163 m doublet is produced by the redshifted absorption toward the disk (green dashed curve in Fig. 20d). The net modeled profiles (shown in red) resemble the observed ones although with significant discrepancies in the OH 119 m doublet.
The OH column density of the inflowing gas in the envelope is cm-2. To estimate the associated mass inflow rate, we adopt a geometry consisting of two shells on opposite sides, each with radius pc, surface , and width pc, inflowing with an average velocity of km s-1, so that
| (10) |
which results in yr-1 for a fiducial OH abundance of . While this estimate is admittedly rather uncertain, it is consistent with the scenario of several dozens solar masses per year of gas feeding the nucleus of ESO 320-G030, as inferred from CO.
5 Discussion and conclusions
The combined analysis of the H2O absorption and emission lines in ESO 320-G030, with wavelengths ranging from to m, and the continuum, together with high-resolution data obtained with ALMA for the H2O448 line and the associated submm dust emission, unveils the structure of the galactic nucleus which we suggest is evidence for the presence of a prominent proto-pseudobulge fed by a molecular inflow driven by a strong nuclear bar. The radius of the most extended region of the nucleus (the envelope component, pc) is in the lower range of measured pseudobulge sizes (e.g., Carollo 1999; Fisher & Drory 2008). The radius will likely increase in view of the CO gas reservoir around the nucleus, with a mass comparable to that of the nucleus. Our 3D model for the H2O448 line shape indicates a velocity field with , meaning that there is an increase in random motions relative to ordered gas motions in the nuclear disk. Stellar kinematics indicate a value of within an aperture of pc, also showing an increase in random motions in the nuclear region while retaining a memory of the rotation (A. Crespo Gómez et al., in prep.).
The envelope has typical columns of cm-2 and is moderately warm ( K). With these conditions, the low-lying H2O lines at submm wavelengths ( m) are efficiently pumped, but little absorption is produced in the far-IR with only significant absorption in the H2O lines at 75 and 108m. Nevertheless, the inferred colums are more than enough to extinguish any line emission at short wavelengths, and indeed the Pa- emission within kpc primarily probes the western (near) side of the nuclear bar, with a morphology different from that of the continuum submm emission (Fig. 17b). It is within the envelope region where the CO 2-1 line becomes very broad (Fig. 15c), which is probably a direct consequence of the shocks produced by the inflowing gas and may be evidence of disordered motions that would eventually lead to a pseudobulge.
High-lying molecular absorption lines in the far-IR are produced when the columns are so high that the far-IR continuum becomes optically thick (González-Alfonso et al. 2015), and these conditions are also linked to the emission in the H2O448 line. In ESO 320-G030, a nuclear disk with projected radius of pc attains these conditions, though still with moderately warm dust ( K). The disk is distorted, elongated in the direction of the bar, and highly turbulent (); it is thus expected to be geometrically thick (e.g., Cazzoli et al. 2020).
At the center of the disk, an unresolved, extremely buried () and very warm ( K for the far-IR photosphere; see González-Alfonso & Sakamoto 2019) core component is identified from the absorption detected in very high-lying lines of H2O, of which the H2O line at m ( K) is an excellent tracer. We estimate a core radius of pc, but higher angular resolution observations are required to better determine its size. HCN vibrational emission has been recently detected in ESO 320-G030 (N. Falstad et al., in preparation), additionally indicating the presence of a very warm optically thick region. In such environments, trapping of IR radiation raises and the mid-IR radiation density within the cocoon of dust, but the resulting SED does not show any enhanced mid-IR emission as only the photosphere is probed at mid- and even far-IR wavelengths (González-Alfonso & Sakamoto 2019). Because of their extreme extinction, the nature of these very compact nuclear components has been long debated; even X-rays and mid-IR high ionization tracers from a putative AGN are expected to be severely attenuated. ESO 320-G030 is undetected with the Swift/BAT all-sky survey observations111https://swift.gsfc.nasa.gov/results/bs105mon/ in the keV band with a sensitivity of erg s-1 cm-2, which translates into a luminosity of L⊙. Assuming a % contribution to the bolometric AGN luminosity in the quoted band, the upper limit for is L⊙; however, absorption at keV is still relevant for cm-2, and an AGN with % of the total galaxy luminosity is still possible. Assuming this limiting AGN scenario, a mass accretion rate onto the black hole of yr-1 would be required for a fiducial radiative efficiency of . This BHAR is a factor of times the estimated nuclear SFR, matching the volume-averaged ratio in local bulge-dominated galaxies (Heckman et al. 2004). Using for (Sect. 3.2.5) as a proxy for the mass of the pseudobulge in formation, and the ratio appropriate for small bulges (Kormendy & Ho 2013), the resulting 222Using the observed km s-1 as a proxy for the stellar velocity dispersion that would result once the gas is locked onto stars, and the observed correlation by Tremaine et al. (2002), a slightly higher is obtained. would be emitting at a high level of . This very crude estimate is comparable to the high Eddington ratio () estimated for NGC 4418 if an AGN is assumed to power its compact nucleus (Sakamoto et al. 2013).
The nuclear core may still be primarily powered by a starburst, with a limiting luminosity surface density of kpc-2. This is close to the value theoretically expected for radiation-pressure supported starburst disks (Thompson et al. 2005). Even in this scenario, the core component is expected to host a growing SMBH at the center of the galaxy, given the nuclear feeding reservoir ( within pc) and excellent conditions for such fast growth (probably constrained by radiation pressure on dust grains). Statistically, Seyfert galaxies are preferentially found in barred systems (e.g., Maia et al. 2003).
Excluding the luminosity of the core component, the averaged nuclear SFR surface density is , and the averaged nuclear molecular gas surface density is . Thus the nuclear region of ESO 320-G030 lies near the high end of the Schmidt law for starburst galaxies (Kennicutt 1998).
Bars within bars were long ago understood to provide an efficient way to drive gas toward the very inner centers of galaxies (e.g., Shlosman et al. 1989), and ESO 320-G030 appears to be a prototypical example of such a system. The nuclear region is moderately elongated along the bar as traced primarily by the dust continuum image at 454 GHz, and a massive inflow is found in the inner kpc of the galaxy from the analysis of the CO 2-1 data cube. The azimuthal velocity of the molecular gas sharply decreases across the bar, resembling the large velocity jumps observed across optical dust lanes associated with bars (e.g., Regan et al. 1997). The molecular inflow, with typical radial velocities of km s-1, is indeed strongly associated with the nuclear bar. Two independent estimates of the mass inflow rate from CO yield similar values, M⊙ yr-1. Since these values are similar to the SFR of the nuclear region ( M⊙ yr-1), we conclude that the enhanced nuclear starburst is fed and sustained by the observed inflow. These inflow velocities are also observed in the ground-state OH doublets at 119 and 79 m as redshifted absorption, probing line-of-sight velocities toward the source of far-IR continuum that indicate a complex 3D flow not restricted to the plane of the galaxy. The inflowing gas probed by OH appears to be more compact than that sampled by CO; it is associated with the envelope component and its kinetic energy dissipates at spatial scales of the nuclear disk ( pc). The mass inflow rate inferred from OH is M⊙ yr-1, comparable to that derived from CO.
The timescale associated with the inflow, Myr, is also expected to characterize the timescale over which the current nuclear burst will fade, once the gas reservoir within the ILR of the primary bar is fully accreted onto the nucleus. This is at least one order of magnitude shorter than typical formation timescales of pseudobulges as inferred for circumnuclear star-forming rings in barred galaxies (Kormendy & Kennicutt 2004), indicating that atypically short timescale secular evolution, extreme accumulations of gas, and plausibly fast growing SMBHs may characterize nuclei of galaxies with strong nuclear bars.
While the case of ESO 320-G030 is exceptional in the local universe, how common are these nuclear gas concentrations at , when the cosmic accretion rate required to sustain the observed SFR in massive main sequence galaxies was M⊙ yr-1 (Scoville et al. 2017), similar to the value we obtain for the nuclear region of ESO 320-G030? How does that matter accrete onto galaxies, and how is it redistributed? What is the impact of short-range, intense bursts of nuclear star formation on overall galaxy evolution over cosmic time? Far-IR spectroscopy provides a unique way of measuring the spatial structure of star formation during prolific stages of nuclear gas accumulation, which can be unveiled with future far-IR facilities similar to the recently cancelled SPace Infrared telescope for Cosmology and Astrophysics (SPICA) (Roelfsema et al. 2018)333During the final stages of preparation of this manuscript, the SPICA mission was cancelled by ESA prior to the scheduled Mission Selection Review; see abe20..
Acknowledgements.
EG-A is grateful for the warm hospitality of the Harvard-Smithsonian Center for Astrophysics, where part of the present study was carried out, and thanks Javier Goicoechea for useful conversations on the far-IR spectrum of Sgr B2, Alex Crespo Gómez for sharing preliminary results on the stellar kinematics in ESO 320-G030, and Juan Rafael Martínez-Galarza for useful conversations on the Bayesian analysis. We thank the anonymous referee for constructive and helpful comments on the manuscript. PACS was developed by a consortium of institutes led by MPE (Germany) and including UVIE (Austria); KU Leuven, CSL, IMEC (Belgium); CEA, LAM (France); MPIA (Germany); INAFIFSI/OAA/OAP/OAT, LENS, SISSA (Italy); IAC (Spain). This development has been supported by the funding agencies BMVIT (Austria), ESA-PRODEX (Belgium), CEA/CNES (France), DLR (Germany), ASI/INAF (Italy), and CICYT/MCYT (Spain). SPIRE was developed by a consortium of institutes led by Cardiff University (UK) and including Univ. Lethbridge (Canada); NAOC (China); CEA, LAM (France); IFSI, Univ. Padua (Italy); IAC (Spain); Stockholm Observatory (Sweden); Imperial College London, RAL, UCL-MSSL, UKATC, Univ. Sussex (UK); and Caltech, JPL, NHSC, Univ.Colorado (USA). This development has been supported by national funding agencies: CSA (Canada); NAOC (China); CEA, CNES, CNRS (France); ASI (Italy); MCINN (Spain); SNSB (Sweden); STFC, UKSA (UK); and NASA (USA). This paper makes use of the following ALMA data: ADS/JAO.ALMA#2016.1.00263.S and ADS/JAO.ALMA#2013.1.00271.S. ALMA is a partnership of ESO (representing its member states), NSF (USA) and NINS (Japan), together with NRC (Canada) and NSC and ASIAA (Taiwan) and KASI (Republic of Korea), in cooperation with the Republic of Chile. The Joint ALMA Observatory is operated by ESO, AUI/NRAO and NAOJ. Based on observations made with ESO Telescopes at the Paranal Observatory under programme ID 086.B-0901(A). EG-A is a Research Associate at the Harvard-Smithsonian Center for Astrophysics. EG-A, JM-P, and FR-V thank the Spanish Ministerio de Economía y Competitividad for support under projects ESP2017-86582-C4-1-R and PID2019-105552RB-C41. EG-A and HAS thank NASA grant ADAP NNX15AE56G. MP-S acknowledges support from the Comunidad de Madrid, Spain, through Atracción de Talento Investigador Grant 2018-T1/TIC-11035 and PID2019-105423GA-I00 (MCIU/AEI/FEDER,UE). AA-H and SG-B acknowledge support through grant PGC2018-094671-B-I00 (MCIU/AEI/FEDER,UE). LC, AA-H, MP-S, and JM-P acknowledge support under project No. MDM-2017-0737 Unidad de Excelencia ”María de Maeztu” - Centro de Astrobiología (INTA-CSIC). SG-B acknowledges support from the Spanish MINECO and FEDER funding grant AYA2016-76682-C3-2-P. C.Y. acknowledges support from an ESO Fellowship. LC acknowledges support from the Spanish Ministerio de Economía y Competitividad for support under project ESP2017-83197. SC acknowledges financial support from the State Agency for Research of the Spanish MCIU through the ’Center of Excellence Severo Ochoa’ award to the Instituto de Astrofísica de Andalucía (SEV-2017-0709). This research has made use of NASA’s Astrophysics Data System (ADS) and of GILDAS software (http://www.iram.fr/IRAMFR/GILDAS).References
- Aalto et al. (2015) Aalto, S., Martín, S., Costagliola, F., et al. 2015, A&A, 584, A42
- Aladro et al. (2018) Aladro, R., König, S., Aalto, S., et al. 2018, A&A, 617, A20
- Alonso-Herrero et al. (2012) Alonso-Herrero, A., Pereira-Santaella, M., Rieke, G. H., & Rigopoulou, D. 2012, ApJ, 744, 2
- Alonso-Herrero et al. (2006) Alonso-Herrero, A., Rieke, G. H., Rieke, M. J., et al. 2006, ApJ, 650, 835
- Arribas et al. (2014) Arribas, S., Colina, L., Bellocchi, E., Maiolino, R., & Villar-Martín, M. 2014, A&A, 568, A14
- Arribas et al. (2008) Arribas, S., Colina, L., Monreal-Ibero, A., et al. 2008, A&A, 479, 687
- Athanassoula (1992) Athanassoula, E. 1992, MNRAS, 259, 345
- Baan & Klöckner (2006) Baan, W. A. & Klöckner, H. R. 2006, A&A, 449, 559
- Bellocchi et al. (2016) Bellocchi, E., Arribas, S., & Colina, L. 2016, A&A, 591, A85
- Bellocchi et al. (2013) Bellocchi, E., Arribas, S., Colina, L., & Miralles-Caballero, D. 2013, A&A, 557, A59
- Briggs (1995) Briggs, D. S. 1995, in American Astronomical Society Meeting Abstracts, Vol. 187, American Astronomical Society Meeting Abstracts, 112.02
- Carollo (1999) Carollo, C. M. 1999, ApJ, 523, 566
- Cazzoli et al. (2014) Cazzoli, S., Arribas, S., Colina, L., et al. 2014, A&A, 569, A14
- Cazzoli et al. (2016) Cazzoli, S., Arribas, S., Maiolino, R., & Colina, L. 2016, A&A, 590, A125
- Cazzoli et al. (2020) Cazzoli, S., Gil de Paz, A., Márquez, I., et al. 2020, MNRAS, 493, 3656
- Cernicharo et al. (2000) Cernicharo, J., Goicoechea, J. R., & Caux, E. 2000, ApJ, 534, L199
- Combes & Sanders (1981) Combes, F. & Sanders, R. H. 1981, A&A, 96, 164
- Falstad et al. (2017) Falstad, N., González-Alfonso, E., Aalto, S., & Fischer, J. 2017, A&A, 597, A105
- Falstad et al. (2015) Falstad, N., González-Alfonso, E., Aalto, S., et al. 2015, A&A, 580, A52
- Fischer et al. (2014) Fischer, J., Abel, N. P., González-Alfonso, E., et al. 2014, ApJ, 795, 117
- Fischer et al. (2010) Fischer, J., Sturm, E., González-Alfonso, E., et al. 2010, A&A, 518, L41
- Fisher & Drory (2008) Fisher, D. B. & Drory, N. 2008, AJ, 136, 773
- Franx & de Zeeuw (1992) Franx, M. & de Zeeuw, T. 1992, ApJ, 392, L47
- Friedli & Martinet (1993) Friedli, D. & Martinet, L. 1993, A&A, 277, 27
- García-Burillo & Combes (2012) García-Burillo, S. & Combes, F. 2012, in Journal of Physics Conference Series, Vol. 372, Journal of Physics Conference Series, 012050
- García-Burillo et al. (2019) García-Burillo, S., Combes, F., Ramos Almeida, C., et al. 2019, A&A, 632, A61
- García-Burillo et al. (2005) García-Burillo, S., Combes, F., Schinnerer, E., Boone, F., & Hunt, L. K. 2005, A&A, 441, 1011
- Goicoechea et al. (2004) Goicoechea, J. R., Rodríguez-Fernández, N. J., & Cernicharo, J. 2004, ApJ, 600, 214
- González-Alfonso et al. (2014a) González-Alfonso, E., Fischer, J., Aalto, S., & Falstad, N. 2014a, A&A, 567, A91
- González-Alfonso et al. (2018) González-Alfonso, E., Fischer, J., Bruderer, S., et al. 2018, ApJ, 857, 66
- González-Alfonso et al. (2013) González-Alfonso, E., Fischer, J., Bruderer, S., et al. 2013, A&A, 550, A25
- González-Alfonso et al. (2014b) González-Alfonso, E., Fischer, J., Graciá-Carpio, J., et al. 2014b, A&A, 561, A27
- González-Alfonso et al. (2012) González-Alfonso, E., Fischer, J., Graciá-Carpio, J., et al. 2012, A&A, 541, A4
- González-Alfonso et al. (2010) González-Alfonso, E., Fischer, J., Isaak, K., et al. 2010, A&A, 518, L43
- González-Alfonso et al. (2017) González-Alfonso, E., Fischer, J., Spoon, H. W. W., et al. 2017, ApJ, 836, 11
- González-Alfonso et al. (2015) González-Alfonso, E., Fischer, J., Sturm, E., et al. 2015, ApJ, 800, 69
- González-Alfonso & Sakamoto (2019) González-Alfonso, E. & Sakamoto, K. 2019, ApJ, 882, 153
- González-Alfonso et al. (2008) González-Alfonso, E., Smith, H. A., Ashby, M. L. N., et al. 2008, ApJ, 675, 303
- González-Alfonso et al. (2004) González-Alfonso, E., Smith, H. A., Fischer, J., & Cernicharo, J. 2004, ApJ, 613, 247
- Greusard et al. (2000) Greusard, D., Friedli, D., Wozniak, H., Martinet, L., & Martin, P. 2000, A&AS, 145, 425
- Griffin et al. (2010) Griffin, M. J., Abergel, A., Abreu, A., et al. 2010, A&A, 518, L3
- Hao et al. (2011) Hao, C.-N., Kennicutt, R. C., Johnson, B. D., et al. 2011, ApJ, 741, 124
- Heckman et al. (2004) Heckman, T. M., Kauffmann, G., Brinchmann, J., et al. 2004, ApJ, 613, 109
- Hunt et al. (2008) Hunt, L. K., Combes, F., García-Burillo, S., et al. 2008, A&A, 482, 133
- Indriolo et al. (2013) Indriolo, N., Neufeld, D. A., Seifahrt, A., & Richter, M. J. 2013, ApJ, 764, 188
- Kamenetzky et al. (2011) Kamenetzky, J., Glenn, J., Maloney, P. R., et al. 2011, ApJ, 731, 83
- Kennicutt (1998) Kennicutt, Robert C., J. 1998, ApJ, 498, 541
- Kennicutt & Evans (2012) Kennicutt, R. C. & Evans, N. J. 2012, ARA&A, 50, 531
- Kormendy (1982) Kormendy, J. 1982, ApJ, 257, 75
- Kormendy & Ho (2013) Kormendy, J. & Ho, L. C. 2013, ARA&A, 51, 511
- Kormendy & Kennicutt (2004) Kormendy, J. & Kennicutt, Robert C., J. 2004, ARA&A, 42, 603
- Lis et al. (2011) Lis, D. C., Neufeld, D. A., Phillips, T. G., Gerin, M., & Neri, R. 2011, ApJ, 738, L6
- Liu et al. (2017) Liu, L., Weiß, A., Perez-Beaupuits, J. P., et al. 2017, ApJ, 846, 5
- Maia et al. (2003) Maia, M. A. G., Machado, R. S., & Willmer, C. N. A. 2003, AJ, 126, 1750
- Martín et al. (2016) Martín, S., Aalto, S., Sakamoto, K., et al. 2016, A&A, 590, A25
- Martín et al. (2010) Martín, S., Aladro, R., Martín-Pintado, J., & Mauersberger, R. 2010, A&A, 522, A62
- Mattila (1986) Mattila, K. 1986, A&A, 160, 157
- McMullin et al. (2007) McMullin, J. P., Waters, B., Schiebel, D., Young, W., & Golap, K. 2007, in Astronomical Society of the Pacific Conference Series, Vol. 376, Astronomical Data Analysis Software and Systems XVI, ed. R. A. Shaw, F. Hill, & D. J. Bell, 127
- Mookerjea et al. (2010) Mookerjea, B., Giesen, T., Stutzki, J., et al. 2010, A&A, 521, L13
- Murphy et al. (2011) Murphy, E. J., Condon, J. J., Schinnerer, E., et al. 2011, ApJ, 737, 67
- Nagy et al. (2013) Nagy, Z., Van der Tak, F. F. S., Ossenkopf, V., et al. 2013, A&A, 550, A96
- Neufeld et al. (2012) Neufeld, D. A., Falgarone, E., Gerin, M., et al. 2012, A&A, 542, L6
- Neufeld et al. (2015) Neufeld, D. A., Godard, B., Gerin, M., et al. 2015, A&A, 577, A49
- Omont et al. (2013) Omont, A., Yang, C., Cox, P., et al. 2013, A&A, 551, A115
- Pereira-Santaella et al. (2015) Pereira-Santaella, M., Alonso-Herrero, A., Colina, L., et al. 2015, A&A, 577, A78
- Pereira-Santaella et al. (2010a) Pereira-Santaella, M., Alonso-Herrero, A., Rieke, G. H., et al. 2010a, ApJS, 188, 447
- Pereira-Santaella et al. (2011) Pereira-Santaella, M., Alonso-Herrero, A., Santos-Lleo, M., et al. 2011, A&A, 535, A93
- Pereira-Santaella et al. (2016) Pereira-Santaella, M., Colina, L., García-Burillo, S., et al. 2016, A&A, 594, A81
- Pereira-Santaella et al. (2010b) Pereira-Santaella, M., Diamond-Stanic, A. M., Alonso-Herrero, A., & Rieke, G. H. 2010b, ApJ, 725, 2270
- Pereira-Santaella et al. (2017) Pereira-Santaella, M., González-Alfonso, E., Usero, A., et al. 2017, A&A, 601, L3
- Pereira-Santaella et al. (2013) Pereira-Santaella, M., Spinoglio, L., Busquet, G., et al. 2013, ApJ, 768, 55
- Pfenniger & Norman (1990) Pfenniger, D. & Norman, C. 1990, ApJ, 363, 391
- Pilbratt et al. (2010) Pilbratt, G. L., Riedinger, J. R., Passvogel, T., et al. 2010, A&A, 518, L1
- Piqueras López et al. (2016) Piqueras López, J., Colina, L., Arribas, S., Pereira-Santaella, M., & Alonso-Herrero, A. 2016, A&A, 590, A67
- Poglitsch et al. (2010) Poglitsch, A., Waelkens, C., Geis, N., et al. 2010, A&A, 518, L2
- Polehampton et al. (2007) Polehampton, E. T., Baluteau, J.-P., Swinyard, B. M., et al. 2007, MNRAS, 377, 1122
- Rangwala et al. (2011) Rangwala, N., Maloney, P. R., Glenn, J., et al. 2011, ApJ, 743, 94
- Regan et al. (1997) Regan, M. W., Vogel, S. N., & Teuben, P. J. 1997, ApJ, 482, L143
- Rico-Villas et al. (2020) Rico-Villas, F., Martín-Pintado, J., González-Alfonso, E., Martín, S., & Rivilla, V. M. 2020, MNRAS, 491, 4573
- Rodríguez-Zaurín et al. (2011) Rodríguez-Zaurín, J., Arribas, S., Monreal-Ibero, A., et al. 2011, A&A, 527, A60
- Roelfsema et al. (2018) Roelfsema, P. R., Shibai, H., Armus, L., et al. 2018, PASA, 35, e030
- Sakamoto et al. (2013) Sakamoto, K., Aalto, S., Costagliola, F., et al. 2013, ApJ, 764, 42
- Sakamoto et al. (2010) Sakamoto, K., Aalto, S., Evans, A. S., Wiedner, M. C., & Wilner, D. J. 2010, ApJ, 725, L228
- Scoville et al. (2017) Scoville, N., Lee, N., Vanden Bout, P., et al. 2017, ApJ, 837, 150
- Sheffer et al. (2008) Sheffer, Y., Rogers, M., Federman, S. R., et al. 2008, ApJ, 687, 1075
- Shlosman et al. (1989) Shlosman, I., Frank, J., & Begelman, M. C. 1989, Nature, 338, 45
- Snow et al. (2007) Snow, T. P., Destree, J. D., & Jensen, A. G. 2007, ApJ, 655, 285
- Soltan (1982) Soltan, A. 1982, MNRAS, 200, 115
- Spinoglio et al. (2012) Spinoglio, L., Pereira-Santaella, M., Busquet, G., et al. 2012, ApJ, 758, 108
- Tang et al. (2019) Tang, X. D., Henkel, C., Menten, K. M., et al. 2019, A&A, 629, A6
- Thompson et al. (2005) Thompson, T. A., Quataert, E., & Murray, N. 2005, ApJ, 630, 167
- Tremaine et al. (2002) Tremaine, S., Gebhardt, K., Bender, R., et al. 2002, ApJ, 574, 740
- Ward et al. (2003) Ward, J. S., Zmuidzinas, J., Harris, A. I., & Isaak, K. G. 2003, ApJ, 587, 171
- Weiß et al. (2010) Weiß, A., Requena-Torres, M. A., Güsten, R., et al. 2010, A&A, 521, L1
- Welty et al. (2006) Welty, D. E., Federman, S. R., Gredel, R., Thorburn, J. A., & Lambert, D. L. 2006, ApJS, 165, 138
- Wilson & Rood (1994) Wilson, T. L. & Rood, R. 1994, ARA&A, 32, 191
- Yang et al. (2013) Yang, C., Gao, Y., Omont, A., et al. 2013, ApJ, 771, L24
- Yang et al. (2020) Yang, C., González-Alfonso, E., Omont, A., et al. 2020, A&A, 634, L3
- Yang et al. (2016) Yang, C., Omont, A., Beelen, A., et al. 2016, A&A, 595, A80
- Younger et al. (2008) Younger, J. D., Hopkins, P. F., Cox, T. J., & Hernquist, L. 2008, ApJ, 686, 815
Appendix A Herschel/PACS and SPIRE observations of ESO 320-G030 and models
We have applied our composite model for H2O to all other molecular absorption features detected in the far-IR with Herschel/PACS. Models were generated for H2O, HO, OH, 18OH, OH+, H2O+, H3O+, NH, NH2, NH3, CH, CH+, 13CH+, SH, HF, C3, and H2S, and the resulting modeled spectrum is overlaid with the spectra of all observed PACS wavelength ranges in Fig. 21444The m range has an Obs ID 1342212227; all other Obs ID are listed in Table 1.. Model predictions at submm wavelengths are also compared with the Herschel/SPIRE spectrum of ESO 320-G030 in Fig. 22.
Models for species other than H2O have the intrinsic uncertainty of the contribution of each component to the line absorption or emission. We have adopted the following criteria: Since the optically thin envelope generates little absorption in the H2O lines, it is only included when needed, that is, for species that require it to obtain a reasonable fit in some lines. These are OH, OH+, and NH2. For the species HO and 18OH, we adopt a fixed column density ratio relative to the main isotopologues in the core and the disk. For the other species we started by assuming the same abundance in the core and the disk, but later relaxed this assumption for some species to obtain a better fit to the observed lines. In addition, we allowed for some flexibility in the value of for the disk and the envelope, relative to the fiducial model. In Table 2, the envelope has a fiducial , but both OH and OH+ are better reproduced with . In addition, of the disk is allowed to vary between the fiducial value of and . The increase in has the effect of enhancing the modeled molecular absorption at m. For most species (OH, 18OH, OH+, H3O+, NH, CH, CH+, 13CH+, C3, and SH) an inflow velocity of 60 km s-1 was included in the disk model to match the position of the observed absorption features, which further indicates that the inflowing gas is still present at galactocentric distances of only pc. The column densities and abundances in the very saturated core component are obviously uncertain, and we rely mostly on the values in the disk for which uncertainties are expected to be better than 0.4 dex.
OH: All observed doublets at 65.2, 71.2, 79.2, 84.3, 119.3, and 163.2 m are detected (see also Sect. 4.2). A very high OH abundance in the core is apparently required to nearly reproduce the OH 71 and 65 m absorption, but it is significantly lower in the disk. The model overpredicts to some extent the absorption in the OH 119 m doublet.
HO: Absorption lines are detected at 75.9, 109.4, and 139.6 m, although the first two lines are close to the edge of the observed wavelength ranges. The lines are reproduced by assuming the same ratio in the core and the disk. The resulting model reproduces rather well the HO submm lines at 250, 264, 272, and 402 m (Fig. 22).
18OH: The observed doublets at 65.7, 85, and 120 m are nearly reproduced with , a value similar to that found for H2O. The enhancement of 18O in the nuclear region of ESO 320-G030 is higher than in the Galactic Center (, see Wilson & Rood 1994, and references therein), higher than in M 82 and NGC 253 (Martín et al. 2010), similar to the value in Arp 220 (González-Alfonso et al. 2012), and lower than in Mrk 231 (González-Alfonso et al. 2014b).
OH+: The 3 absorption lines at m are primarily generated in the core, while the and 158.4 m lines at longer wavelengths are expected to be produced by the disk. To reproduce these features, a high OH+ abundance of is required in both components, comparable to the value inferred in Mrk 231 (González-Alfonso et al. 2018). Additional contribution by the envelope with a similar OH+ abundance is included to better match the strong absorption at 153 m. By contrast, no far-IR OH+ absorption is detected in the high spectral resolution (Fabry-Pérot) spectrum of Sgr B2 taken with the Infrared Space Observatory (ISO) (Polehampton et al. 2007). Although the far-IR OH+ absorption is prominent, the ground-state lines in the submm are hardly seen (Fig. 22), which is consistent with the model.
H2O+: Absorption features are seen at 65.5 (blended with NH2), 78.55, 143.3, 143.8 (blended with C3), and m, although the latter features are shifted relative to the expected positions. Our model assumes the same abundance in both the core and the disk, , and the 143.3 m is somewhat overpredicted. Hence, a ratio is inferred. The model for H2O+ satisfactorily reproduces the submm lines at m.
H3O+: The clearest evidence of H3O+ absorption is found at the red edge of the NH3 166 m absorption, with hints of absorption also seen at 82.3 and 82.9 m but no detected absorption at 69.55 m. The latter constrains the H3O+ abundance to , but the feature at 166 m is not fully reproduced. It is possible that formation pumping enhances this absorption, as favored in Arp 220 (González-Alfonso et al. 2013). Results are consistent with .
NH: Strong absorption features are detected at , 151.1, 151.5 (blended with C3), (blended with OH+), and 153.4 m, with additional hints of absorption at 153.7 m. A high NH abundance of in both components is required to match the observed absorption. At submm wavelengths, the model predicts little absorption in the ground-state lines at 300, 308, and 317 m. While this is consistent with the lack of absorption features at 308 and 317 m, the absorption observed at 300 m remains underpredicted.
NH2: Absorption is detected at 65.6 (blended with H2O+), , and 130.2 m, which we use to estimate the NH2 column density. NH2 also has strong lines in the submm at m (in absorption) and m (in emission), which are reasonably reproduced by the model after adding an envelope contribution to the model (with a NH2 abundance of ). The abundance of NH2 in the core and disk components is about one order of magnitude lower than NH, in contrast with the abundance ratio in Sgr B2 where NH2 is much more abundant than NH (Goicoechea et al. 2004). This suggests that there is an additional source of ionization in ESO 320-G030, probably due to cosmic rays.
NH3: Absorption features are detected at 71.6, 83.4, , 84.5 (blended with OH), 165.7, and 170 m, which are reproduced with a high NH3 abundance of . The model also approximately accounts for the observed ground-state para-NH3 absorption at 256.6 m (). We then infer , a ratio similar to the value in Sgr B2 (Goicoechea et al. 2004). The nitrogen chemistry in ESO 320-G030 appears to be the result of a combination of shock chemistry and high ionization rates.
CH: The doublet with K is detected at m. The model, with a CH abundance of , is consistent with the lack of detection of CH at 203-204 m. Our derived abundance is a factor of higher than the value derived in dark molecular clouds (Mattila 1986) and diffuse clouds (Sheffer et al. 2008). Formation of CH from CH+, which is very abundant (see below), may be favored (Welty et al. 2006).
CH+: Clear absorption is observed at 119.8 m, adjacent to the redshift component of the 18OH doublet at 120 m. While this absorption is in principle attributable to both the CH+ line and to 17OH ground-state absorption, the latter species is not expected to contribute significantly because the other component of the doublet at m is not detected (see also Fischer et al. 2010). On the other hand, the CH+ line at 72.3 m is not detected. To account for the CH+ 119.8 m absorption, a very high abundance of is required, which is consistent with the lack of detection of the ground-state line at 359 m. A similarly high CH+ abundance has been inferred by Nagy et al. (2013) toward the Orion Bar, but only within a narrow range where reaction of C+ with vibrationally excited H2 can overcome the high activation barrier of the formation reaction . The much higher implied column densities of CH+ in the nucleus of ESO 320-G030 may indicate the additional combined effect of widespread dissipation of turbulence, shocks, and ionization by cosmic rays. A column density ratio is found in the Magellanic Clouds (Welty et al. 2006), while this ratio is in ESO 320-G030.
13CH+: A broad absorption feature is detected at 120.55 m, which could be associated with either 13CH+ and/or to SH (see below). To check if it can be reproduced with only 13CH+, a model with a fixed abundance ratio is used, appropriate for the central regions of starburst galaxies (Tang et al. 2019). The resulting modeled 13CH+ absorption accounts for approximately half of the observed 120.55 m feature. It is possible that the 13CH+ abundance in ESO 320-G030 is even higher than the adopted value, as in the very center of NGC 4945 (Tang et al. 2019).
SH: We have attempted to fill in the remaining 120.55 m absorption by including a model for SH; the transition that may contribute to the observed absorption feature is ( K). A constraint on the SH model is that it generates ground-state absorption at 217 m, close to the CO line. From the observed CO SLED, we expect little contamination by SH to CO , implying an upper limit to the SH abundance of . The 120.55 m absorption is then still underpredicted. The quoted SH abundance is a factor of higher than the highest SH abundance inferred in diffuse clouds (Neufeld et al. 2012, 2015), where SH only accounts for % of the gas-phase sulfur chemistry.
HF: A single far-IR feature is observed at 81.2 m. We fix the HF abundance in both the core and the disk to the gas-phase fluorine abundance (Snow et al. 2007; Indriolo et al. 2013), and the observed HF line is approximately reproduced. The model is also consistent with the apparent ground-state absorption at 243 m. An undepleted chemistry is strongly suggested by these results.
C3: Weak absorption features coincident with lines of the band of C3 are observed at 142.7, 143.8 (blended with H2O+), 145.1 and, imprinted on a wing emission in the [C ii]157 m line, at 157.3 and 158.1 m. We thus favor the detection of C3 in ESO 320-G030. The observed absorption lines are dominated by the disk, for which a very high abundance of is required. For comparison, Cernicharo et al. (2000) and Mookerjea et al. (2010) infer an abundance of C3 relative to H2 in the galactic sources Sgr B2 and W31C of . The modeled spectrum predicts C3 absorption features at 167.7 and 176.7 m which are within the S/N of the observed spectra.
H2S?: A relatively strong feature is detected at 150.15 m, matching the expected position of the H2S line ( K). However, a similar or deeper absorption would be expected in the line at 144.78 m, but it is not detected. The 151.15 m feature is not detected in the (ISO) spectrum of Sgr B2 (Polehampton et al. 2007). The possible carrier of this absorption is considered unknown.
We have also indicated in Fig. 22 the position of the HCN to lines (except the line that is blended with CO at 260 m). Apparent absorption features are detected at the wavelengths of the (282 m), (242 m), and (212 m) lines, but not at the position of the transition at 226 m. While this does not allow us to unambiguously associate the quoted spectral features to HCN, no alternative, reliable carriers have been found.
| CORE | DISK | |||
|---|---|---|---|---|
| Species | a | a | ||
| H2O | 1 | 1 | ||
| HO | 100 | 100 | ||
| OH | 2 | 1 | ||
| 18OH | 100 | 100 | ||
| OH+ | 280 | 140 | ||
| H2O+ | 1200 | 350 | ||
| H3O+ | 1200 | 350 | ||
| NH | 75 | 20 | ||
| NH2 | 620 | 175 | ||
| NH3 | 38 | 10 | ||
| CH | 740 | 210 | ||
| CH+ | 180 | 50 | ||
| 13CH+ | 3600 | 1050 | ||
| SH | 1800 | 520 | ||
| HF | 1800 | 520 | ||
| C3 | 180 | 30 | ||
-
a
Abundances of species relative to H nuclei are estimated from the column density and the continuum optical depth at 100 m ().
In summary, high enhancements in the abundance and column density of light hydrides are observed in the nuclear region of ESO 320-G030. In relation with Sgr B2, the prototypical high-mass star forming region in our galaxy with a nucleus optically thick in the far-IR, qualitative differences are seen in the absorption due to excited OH+, CH+, and also NH. These highly reactive species are widely observed in diffuse clouds through absorption from the ground-state level, but not in dense regions through absorption from rotational levels above the ground-state. Since the X-ray emission from the nucleus of ESO 320-G030 is weak (Pereira-Santaella et al. 2011), the source of molecular ionization is likely to be cosmic rays (see also the case of Mrk 231 in González-Alfonso et al. 2018). In addition, an undepleted chemistry (i.e., no grain mantles) generated by shocks and warm dust is strongly suggested.
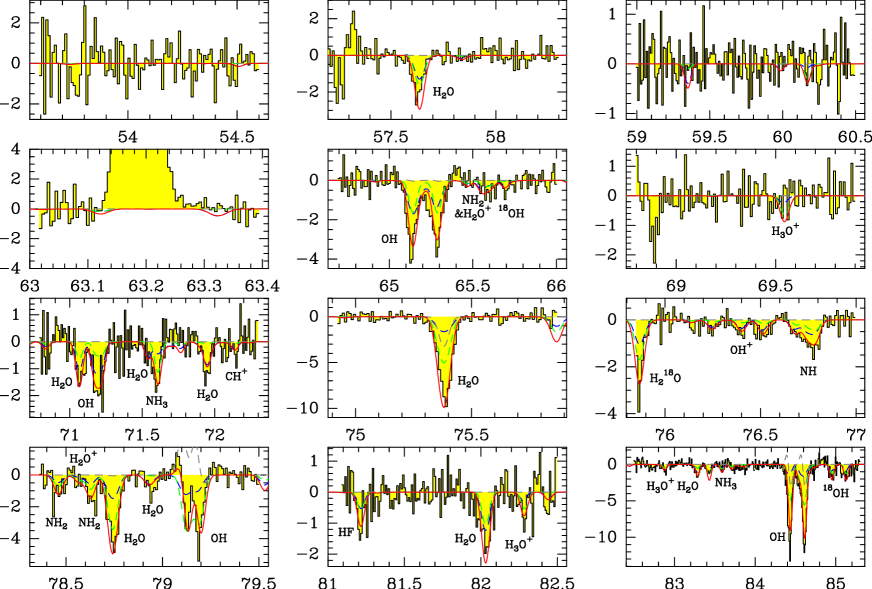
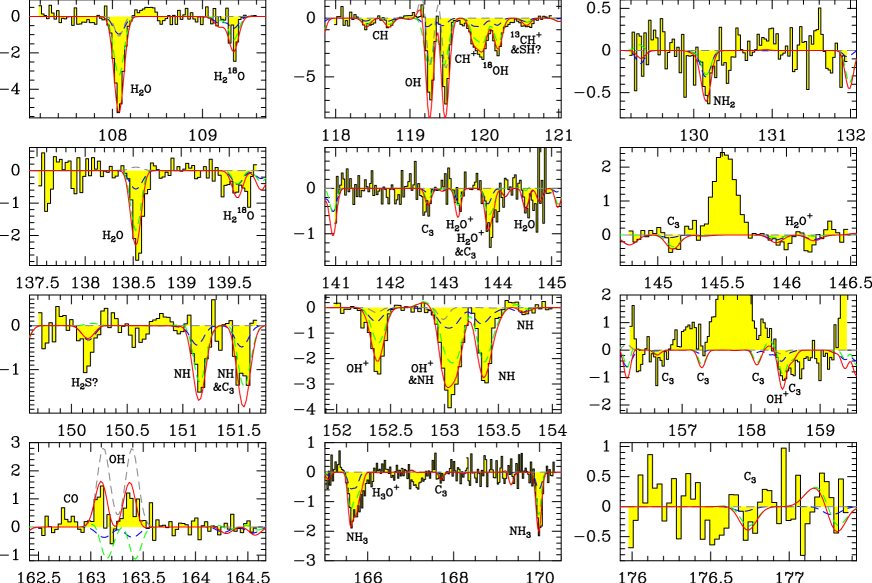
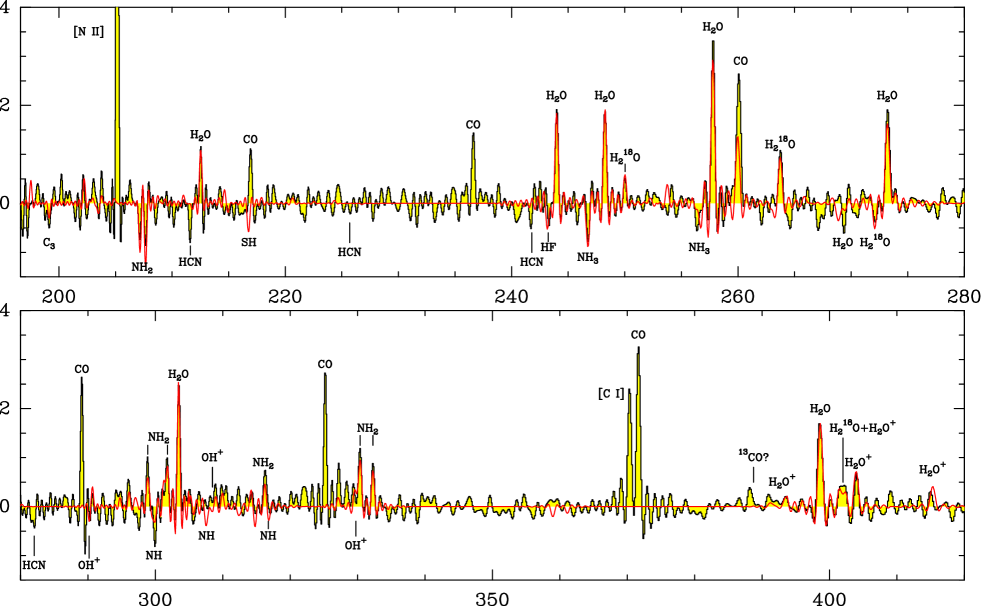
Appendix B 2D likelihood distributions of the free parameters
The posterior distribution of eq. (3) is marginalized over to produce the 2D likelihood distributions of the free physical parameters, as shown in Fig. 23. This enables an evaluation of the degeneracies among these parameters.
We find two main degeneracies: First, is degenerate with in the core component. The extinction in this component is important even in the submm, so that an increase in reduces the width of the external shell responsible for the line absorption. As a consequence, the required H2O column density increases to maintain the same value in the photosphere that can be traced. Second, the opposite effect is to some extent found in the envelope, where an increase in is accompanied by a decrease in . In this component, extinction by dust is negligible, and any increase in involves a stronger radiation field that is responsible for the H2O excitation, thereby reducing to some extent the value required to explain the observed line fluxes. Nevertheless, the values of and in the envelope are still well constrained by the data.