Early High-contrast Imaging Results with Keck/NIRC2-PWFS: The SR 21 Disk
Abstract
High-contrast imaging of exoplanets and protoplanetary disks depends on wavefront sensing and correction made by adaptive optics instruments. Classically, wavefront sensing has been conducted at optical wavelengths, which made high-contrast imaging of red targets such as M-type stars or extincted T Tauri stars challenging. Keck/NIRC2 has combined near-infrared (NIR) detector technology with the pyramid wavefront sensor (PWFS). With this new module we observed SR 21, a young star that is brighter at NIR wavelengths than at optical wavelengths. Compared with the archival data of SR 21 taken with the optical wavefront sensing we achieved 20% better Strehl ratio in similar natural seeing conditions. Further post-processing utilizing angular differential imaging and reference-star differential imaging confirmed the spiral feature reported by the VLT/SPHERE polarimetric observation, which is the first detection of the SR 21 spiral in total intensity at band. We also compared the contrast limit of our result ( at and at ) with the archival data that were taken with optical wavefront sensing and confirmed the improvement, particularly at . Our observation demonstrates that the NIR PWFS improves AO performance and will provide more opportunities for red targets in the future.
monthyearday\THEYEAR \monthname[\THEMONTH] \twodigit\THEDAY
1 Introduction
High-contrast imaging has opened a new way of exploring and characterizing exoplanets around young stars (e.g. HR8799 bcde; Marois et al., 2008, 2010). This is achieved with large ground-based telescopes by correcting wavefronts of the incident light that are distorted by turbulence of the Earth’s atmosphere. Adaptive optics (AO: Beckers, 1993) provides real-time corrections to the wavefront distortions using a guide star, which results in a point spread function (PSF) close to a diffraction-limited pattern. Wavefront sensing has classically been performed at optical wavelengths, in which case the visible brightness of the guide star is very important for the wavefront sensing and correction. However, for some specific science targets such as M-type stars or extincted young stellar objects (YSOs) that are faint at optical wavelengths while bright in the near-infrared (NIR), wavefront sensing at NIR wavelengths provides better AO performance. Recently, a NIR Pyramid wavefront sensor (PWFS) was installed in the AO system at Keck-II (Bond et al., 2018, 2020 in press) as part of the Keck Planet Imager and Characterizer (KPIC: Mawet et al., 2016). Science operations using the NIR-PWFS with Keck/NIRC2 began in early 2019.
EM* SR 21 (hereafter SR 21) is a YSO in the Ophiuchus star forming region with a distance of pc (Gaia Collaboration et al., 2018). Herczeg & Hillenbrand (2014) found a spectral type of F7 and an age of 10 Myr assuming 121 pc for its distance. Sallum et al. (2019) inferred a spectral type of G3 for assuming the Gaia-based distance. Its SED shows strong IR excess but lacks emission at , which suggests a transitional disk with an inner gap (Brown et al., 2007). High-angular resolution studies have shown a large cavity (e.g. van der Marel et al., 2016), which together with complicated features such as gaps and spirals suggests possible planet formation within the disk (Sallum et al., 2019; Muro-Arena et al., 2020). This YSO is faint at optical wavelengths but bright at NIR wavelengths (e.g., =14.1, =7.5; Cutri et al., 2003; Rebull et al., 2018), making it a suitable testbed for high-contrast imaging with the PWFS to better explore its surrounding disk features and/or companions. In this study we present the latest observation of SR 21, which is among the earliest science targets high-contrast imaging with with the NIR-PWFS following Wang et al. (2020), who observed PDS 70 using Keck/NIRC2 with the NIR-PWFS. Section 2 describes our observations, data reduction, and the results. Data analysis and discussion including the comparison with the archived Keck/NIRC2 data are described in Section 3. Finally our observations and results are summarized in Section 4.
2 Observations and Results
2.1 Observations
We observed SR 21 on 2020 May 31 UT with Keck/NIRC2+PWFS in band combined with the vector vortex coronagraph mask (inner working angle: IWA100 mas; Serabyn et al., 2017; Mawet et al., 2017) and angular differential imaging (ADI: Marois et al., 2006). The wavefront sensing was carried out at band. The total exposure time is sec (0.3 sec per exposure 100 coadds 137 frames) and the parallactic angle change is . We also took an off-axis image offset by from the vortex mask, which is comprised of 100 coadds each having an integration time of 0.0075 sec. Typical full width at half maximum (FWHM) was measured to be 8.2 pix (or 81.8 mas with a pixel scale of 9.972 mas/pix). We compared this unsaturated PSF with the simulated ideal PSF at band, where we took into account throughput loss by the vortex mask (see Figure 1), and we obtained a Strehl ratio of (approximately equivalent to the root mean square (RMS) of the wavefront errors 200 nm). The current throughput of the NIRC2-PWFS is and the maximum elevation of SR 21 was during our observations, which affected the AO performance compared with the ideal case (Bond et al., 2018, 2020 in press). The data were taken as a part of a shared-risk program using the NIR-PWFS (PI: Dimitri Mawet) which was aimed at science verification with redder targets. In this program we did not observe suitable reference stars for reference-star differential imaging (RDI: Ruane et al., 2019) and thus we decided to use other data sets (see Table 1 and Section 2.2.1) that have the most comparable luminosity at and bands to SR 21 among targets observed at this epoch as reference PSFs for the RDI reduction.
| target | date [UT] | total exposure [s] | seeing [′′]1 | [mag]2 | [mag]3 |
|---|---|---|---|---|---|
| SR 21 | 2020 May 31 | 4110 | 0.50 | 7.5 | 6.1 |
| WaOph 6 | 2020 May 30 | 1230 | 0.49 | 7.6 | 7.6 |
| WSB 52 | 2020 Jun 2 | 5040 | 0.47 | 9.2 | 7.5 |

2.2 Data Reduction and Results
We first carried out preprocessing, including bad pixel correction, flat fielding, sky subtraction and image registration following Xuan et al. (2018) and Ruane et al. (2019). We then performed post-processing to subtract the stellar halo. We investigate two approaches of post-processing here: RDI to investigate the faint disk features and inner potential companions, and ADI to investigate outer potential companions. For both approaches, we used the pyKLIP package111https://pyklip.readthedocs.io/en/latest/index.htmll (Wang et al., 2015) that adopted Karhunen-Loève Image Projection (KLIP: Soummer et al., 2012; Amara & Quanz, 2012) to produce the most likely reference PSF for the target exposure.
2.2.1 RDI
As we did not take suitable data sets for the reference PSF, the RDI results can be affected by the quality of other stars in the reference library. In addition to the SR 21 data, we included WaOph 6 and WSB 52 data sets (PI: Charlotte Bond, Dimitri Mawet) in the PSF library (see Table 1 for the observing logs). We decided to use these two stars as reference stars because their magnitudes are the closest to SR 21 among all targets taken on and around 2020 May 31. These two stars are young stellar objects (YSOs) surrounded by protoplanetary disks, which have been resolved by Huang et al. (2018a, b). The NIRC2 -band PSF for these targets may be influenced by the disks, which could impact the RDI reduction at particularly inner separations.
As mentioned above, the reference stars (WaOph 6 and WSB 52) used in this study are not ideal for the RDI reduction of SR 21 because 1) their magnitudes are not exactly the same, 2) observational conditions may vary from target to target, and 3) they possibly include the protoplanetary disk signals at band, which can degrade the efficiency and output of the post-processing with RDI. We first conducted frame selection among the PSF library by taking advantage of the mean square error (MSE: Wang et al., 2004; Ruane et al., 2019). We evaluated MSE scores at separations 390 mas (5 /D) and removed the worst 20% of frames in each data set. After the frame selection the field of view (FoV) was cropped into , which is used to make the reference PSF. We performed RDI reduction including all the science data sets and the selected good reference data sets using pyKLIP.
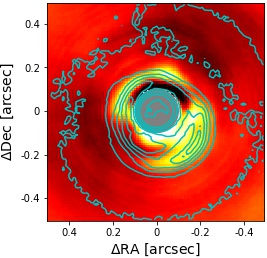
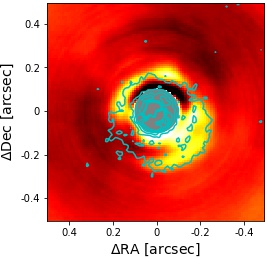
Figure 2 shows the RDI-reduced result (Karhunen-Loève - the number of basis vector; KL=5) in total intensity, which is overlaid with contours from SPHERE/IRDIS -band coronagraphic (left) and -band non-coronagraphic (right) observations. We reduce the public SPHERE observations of SR 21 on UT 2018 March 1 (ESO GTO program 1100.C-0481(Q), PI: J.-L. Beuzit) using IRDAP (van Holstein et al., 2017, 2020). The bright extended feature at position angle (PA) between and is clearly co-located with the spiral detected by SPHERE (’Spiral 1’ in Muro-Arena et al., 2020) and this detection is one of several cases that the spiral feature is clearly resolved in -band (e.g. HD 142527, HD 100546, MWC 758, and CQ Tau; Rameau et al., 2012; Currie et al., 2015; Reggiani et al., 2018; Uyama et al., 2020a). To test the potential contamination of the disk feature around the reference stars in band, we checked the archival VLT/SPHERE -band polarimetric data set of WaOph6 taken on UT 2018 June 22 (ESO GTO program 1100.C-0481(Q), PI: J.-L. Beuzit). The SPHERE data set presents very faint feature of the disk surface of WaOpH 6, and the SPHERE-based SR 21 spiral arm is 30 times brighter than the WaOph 6 disk at the same position, indicating that the contamination of the WaOph 6 disk on the NIRC2 PSF of SR 21 should be relatively very small. For WSB 52 there is no public SPHERE data in the VLT archive.
However, our observation did not confirm other features the SPHERE observations reported. The inner area of the processed image has regions with both positive and negative intensity. Part of the positive areas might correspond to the real disk features but they are likely affected by the poor RDI reduction due to the non-ideal reference stars.
|
2.3 ADI
We conducted basic ADI reduction using pyKLIP using all of the 137 frames. We divided the NIRC2 FoV into 9 annuli 4 subsections to produce the most likely reference PSF at each area. We also assumed the real astrophysical signal, if any, moves 1 pix from frame to frame to avoid heavy self-subtraction caused by the ADI reduction.
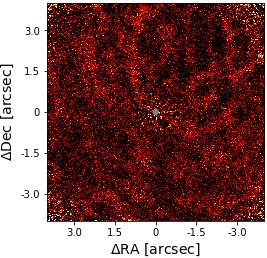
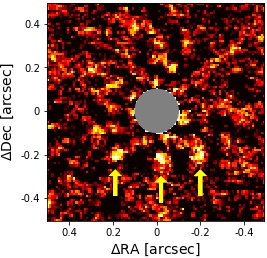
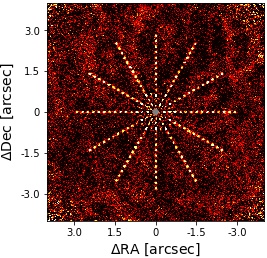
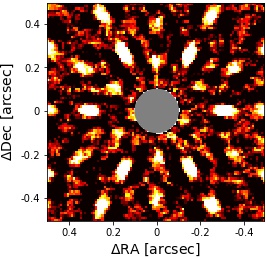
Figure 3 shows the ADI result (KL=20) for the larger FoV (left) and for the zoomed-in image (right) to compare with the RDI result. We did not detect any significant sources within . With a smaller number of KL we also see the spiral feature in the ADI-reduced image (Figure 4). In the zoomed-in image of Figure 3, there are two marginal point-like sources to the Southwest and South that are coincident with the spiral feature and stable among KLs between 10 and 30. However, their signal to noise ratios (SNRs) are not large enough to robustly claim a detection (3.5, 3.7, respectively). There is another marginal source outside the spiral feature at Southeast but this is fainter than the sources mentioned above. In this study, we regard them as the residuals of the spiral feature or uncorrected speckle noise and future observation that can explore deeper. contrast at will help to identify the nature of these sources especially in the context of planet-disk interactions in the SR 21 system. We also injected fake sources at separations ranging - and at a variety of position angles to test whether the inject sources are reliably reproduced after the ADI reduction. We altered the contrast levels of the fake sources as a function of radius ( at , at , and at ) because a bright source can result in large flux loss. Figure 5 shows a result of the injection test. Although part of the disk features may affect the outcome of the ADI reduction, the injection test shows that the point sources can be reliably recovered.
|

|
3 Discussion
3.1 Spiral Feature
The disk feature detected in band may be explained by two scenarios: scattering or self-luminosity. If the spiral feature is self-luminous it may be a result of heating a shock around the protoplanet, which would indicate planet-disk interactions (e.g. Lyra et al., 2016).
We use our RDI result to extract the surface brightness of the spiral feature because RDI causes only modest signal loss (e.g. with the PCA-based RDI reduction of the disk feature; Uyama et al., 2020b) compared with self-subtraction of ADI, particularly at such small separations. We converted the pixel count into surface brightness by comparing the photometric result of the off-axis PSF (aperture radius=3.5FWHM) with the Spitzer/IRAC-3.6m value (1.230.01 Jy; Gutermuth et al., 2009). We traced the spiral feature and investigated several areas, which measures 60, 100, 80, 70 mJy arcsec-2 at PA=180∘, 210∘, 240∘, and 270∘, respectively222We do not present the error bars for these values because we are not able to evaluate systematic errors caused by the non-ideal reference stars. The background noise estimated from standard deviation in an annular area at in the RDI-reduced image corresponds to 6 mJy/arcsec2.. Assuming these values reflect thermal emissions from the optically-thick surface of the spiral, the typical temperature of the spiral corresponds to K. On the other hand, assuming (Francis & van der Marel, 2020) and for the typical separation of the spiral, the effective temperature at the spiral is estimated at K and the derived temperature from our RDI result suggests the scattering effect or another heating mechanism (e.g. the shock scenario; Lyra et al., 2016).
We also calibrated the SPHERE -band image following the IRDAP pipeline. We measured that polarimetric intensity at the spiral surface is – mJy arcsec-2 along the spine, with an error of mJy arcsec-2, which is defined as standard deviation in an annular area (at radii between 175 and 225 mas) of the calibrated SPHERE image that is smoothed with a Gaussian kernel ( pix). By comparing these values with radiative transfer simulations one can infer the scattering characteristics and the possibility of thermal emission at the spiral surface, but we note that simply comparing our -band total intensity with the SPHERE -band polarimetric imaging result leaves uncertainty on polarization ratio. Obtaining total intensity and polarization intensity at the same wavelength is useful to characterize the scattering mechanisms at the disk surface in detail.
As mentioned in Section 2, the reference stars we used in this study are not suitable for SR 21 and thus the extracted surface brightness may be biased. Future follow-up observations with more suitable reference stars will help to better investigate the whole disk feature including the spiral in band.
3.2 Detection Limits
We convolved the ADI-reduced image by a circular aperture with a radius of FWHM/2 and then calculated the radial noise profile, which is then compared with the unsaturated PSF of SR 21. We calibrated this radial profile by the flux loss ratio at each separation estimated from the injection test result. Figure 7 shows our 5 contrast limit: we achieved 10-4 at and at . With the COND03 model (Baraffe et al., 2003) assuming 10 Myr overlaid in Figure 7, we set a constraint on , , and at au, 55 au, and 110 au, respectively. We assumed 5.8 mag at band, which is different from Muro-Arena et al. (2020). Their assumption of 6.8 mag is equivalent to 0.48 Jy at 3.8 and this value is fainter than photometric values at adjacent wavelengths (e.g. Jy at 3.5-4.6; Gutermuth et al., 2009; Cutri et al., 2013; Schlafly et al., 2019). Our assumption of 5.8 mag is equivalent to the Spitzer/IRAC-3.6 value. Our mass limit is consistent with an updated mass limit of the archival data from Figure A.1 of Muro-Arena et al. (2020) (in private communications). We also took into account extinction by the interstellar medium considering (Herczeg & Hillenbrand, 2014) and wavelength dependence of extinction (: Draine, 1989), which corresponds to .
The evolutionary model we adopted in Figure 7 does not include the accreting mechanism. Given that the gas in the SR 21 disk has not been fully depleted at the predicted location the potential protoplanet would likely be actively accreting. So we also compare our contrast limits with a ’circumplanetary-disk’ model (Zhu, 2015), with which the -band luminosity is calculated as a function of the product of planet mass () and accretion rate () and inner radius of the circumplanetary disk (). We follow Ruane et al. (2017) who investigated constraints on the potential accreting planets in the TW Hya disk. Muro-Arena et al. (2020) predicted a protoplanet at 44 au and PA and we use our contrast limit to set a constraint on the mass accretion rate onto this potential protoplanet. Figure 7 shows the comparison between our contrast limit at (contrast: 2.6) and the cirucmplanetary-disk model at given inner radii (). Even if we assume 1 for the potential protoplanet as predicted in Muro-Arena et al. (2020), we are not able to solve the degeneracy between the mass accretion rate and the inner radius of the circumplanetary disk because no observational evidence of the circumplanetary disk in the SR 21 disk has been reported. Therefore our detection limit could set an upper limit of the accretion rate to yr-1 by referring to a case in the circumplanetary-disk model.
These estimations of the mass/accretion-rate limits do not include potential extinction of the SR 21 disk itself. This leaves uncertainty on the mass estimation but this may not be as important because the -band detection limits are less subject to the extinction than shorter NIR wavelengths (e.g. bands).


3.3 Comparison with the Archival Data
Compared with the archival Keck/NIRC2 -band data taken on 2016 April 23 (PI: Van der Marel, see Appendix A of Muro-Arena et al., 2020), we detected the spiral feature in both of the RDI (Figure 2) and ADI (KL=3 and 5 at Figure 4) reductions, while Muro-Arena et al. (2020) did not report any disk features in the archival Keck data. Our detection limit also achieves a better contrast level particularly at inner separations than the archival data (see Figure 7 for the comparison of the detection limits). At separations the difference of the contrast limits is likely related to difference of the exposure time (4110 sec and 2160 sec for our observation and the previous observation, respectively). We also note that difference of field rotation ( and , respectively) may also affect the detection limits at inner separations because a ratio of flux loss made by the ADI reduction can be affected by the rotation angle.
The main difference is that we used the vortex coronagraph and NIR-PWFS while the archival data were taken with the optical wavefront sensing and no coronagraph mask. We took into account the effect of the vortex mask when we measured the Strehl ratio (see Section 2.1). The observing conditions are also different - typical DIMM seeings were and on 2020 May 31 and 2016 April 23 respectively. We measured the Strehl ratio of the archival data to be 69%, which is smaller than that we measured for our observation. Although seeing was slightly larger on 2016 April 23 when the archival data were taken, the majority of the additional wavefront errors due to the increased seeing should be outside the AO correction radius. The increase of the Strehl ratio by 20% is likely produced by the NIR-PWFS suggesting that the NIR-PWFS meaningfully improved the AO performance of Keck/NIRC2 on such a red target.
4 Summary
We have presented the latest Keck/NIRC2 -band observation of SR 21. The observation was conducted with a NIR ( band) PWFS and the Strehl ratio is measured to be 87% (approximately 200 nm for RMS of the wavefront errors). We used the pyKLIP package to post-process the observation utilizing RDI and ADI techniques. In the RDI-reduced image, we confirmed the spiral feature in total intensity at band, which is consistent with the VLT/SPHERE polarimetric observation. However, we did not observe suitable reference stars for SR 21 but instead used WaOph 6 and WSB 52, which might also include disk signals. Therefore our RDI result may have been affected by these non-ideal reference stars. Our ADI reduction did not detect any convincing companion candidates but we confirmed the spiral feature at small KLs (KL 5). In addition to the spiral feature at small KLs, we see two point-like sources with SNRs of at KL = 10–30 but they may be residuals of the spiral feature. We calculated a 5 contrast limit from the ADI result, which achieved at and at . Assuming COND03 model and 10 Myr, we converted the contrast limit into a mass limit - 16 , 10 , and 5 at 40 au, 50 au, and 110 au, respectively. Compared with the archival data taken with optical wavefront sensing we achieved the better Strehl ratio and better contrast level, which suggests that the NIR PWFS improved the AO performance of Keck/NIRC2 and will provide more opportunities for red targets. As the spiral feature is affected by the bias of the reduction method and the reference stars used in this study, future observation of this system will provide better RDI results and enable a detailed discussion on the surface brightness distribution of the protoplanetary disk.
Keck:II (NIRC2)
References
- Amara & Quanz (2012) Amara, A., & Quanz, S. P. 2012, MNRAS, 427, 948
- Baraffe et al. (2003) Baraffe, I., Chabrier, G., Barman, T. S., et al. 2003, A&A, 402, 701
- Beckers (1993) Beckers, J. M. 1993, ARA&A, 31, 13
- Bond et al. (2018) Bond, C. Z., Wizinowich, P., Chun, M., et al. 2018, Proc. SPIE, 10703, 107031Z
- Bond et al. (2020 in press) Bond, C. Z., Cetre, S., Lilley, S., et al. 2020 in press, JATIS
- Brown et al. (2007) Brown, J. M., Blake, G. A., Dullemond, C. P., et al. 2007, ApJ, 664, L107
- Currie et al. (2015) Currie, T., Cloutier, R., Brittain, S., et al. 2015, ApJ, 814, L27
- Cutri et al. (2003) Cutri, R. M., Skrutskie, M. F., van Dyk, S., et al. 2003, VizieR Online Data Catalog, II/246
- Cutri et al. (2013) Cutri, R. M., et al. 2013, VizieR Online Data Catalog, II/328
- Draine (1989) Draine, B. T. 1989, 93
- Francis & van der Marel (2020) Francis, L., & van der Marel, N. 2020, ApJ, 892, 111
- Gaia Collaboration et al. (2018) Gaia Collaboration, Brown, A. G. A., Vallenari, A., et al. 2018, A&A, 616, A1
- Gutermuth et al. (2009) Gutermuth, R. A., Megeath, S. T., Myers, P. C., et al. 2009, ApJS, 184, 18
- Herczeg & Hillenbrand (2014) Herczeg, G. J., & Hillenbrand, L. A. 2014, ApJ, 786, 97
- Huang et al. (2018a) Huang, J., Andrews, S. M., Pérez, L. M., et al. 2018a, ApJ, 869, L43
- Huang et al. (2018b) Huang, J., Andrews, S. M., Dullemond, C. P., et al. 2018b, ApJ, 869, L42
- Lyra et al. (2016) Lyra, W., Richert, A. J. W., Boley, A., et al. 2016, ApJ, 817, 102
- Marois et al. (2006) Marois, C., Lafrenière, D., Doyon, R., et al. 2006, ApJ, 641, 556
- Marois et al. (2008) Marois, C., Macintosh, B., Barman, T., et al. 2008, Science, 322, 1348
- Marois et al. (2010) Marois, C., Zuckerman, B., Konopacky, Q. M., et al. 2010, Nature, 468, 1080
- Mawet et al. (2016) Mawet, D., Wizinowich, P., Dekany, R., et al. 2016, Proc. SPIE, 9909, 99090D
- Mawet et al. (2017) Mawet, D., Choquet, É., Absil, O., et al. 2017, AJ, 153, 44
- Muro-Arena et al. (2020) Muro-Arena, G. A., Ginski, C., Dominik, C., et al. 2020, A&A, 636, L4
- Ochsenbein et al. (2000) Ochsenbein, F., Bauer, P., & Marcout, J. 2000, A&AS, 143, 23
- Rameau et al. (2012) Rameau, J., Chauvin, G., Lagrange, A. M., et al. 2012, A&A, 546, A24
- Rebull et al. (2018) Rebull, L. M., Stauffer, J. R., Cody, A. M., et al. 2018, AJ, 155, 196
- Reggiani et al. (2018) Reggiani, M., Christiaens, V., Absil, O., et al. 2018, A&A, 611, A74
- Ruane et al. (2017) Ruane, G., Mawet, D., Kastner, J., et al. 2017, AJ, 154, 73
- Ruane et al. (2019) Ruane, G., Ngo, H., Mawet, D., et al. 2019, AJ, 157, 118
- Sallum et al. (2019) Sallum, S., Skemer, A. J., Eisner, J. A., et al. 2019, ApJ, 883, 100
- Schlafly et al. (2019) Schlafly, E. F., Meisner, A. M., & Green, G. M. 2019, ApJS, 240, 30
- Serabyn et al. (2017) Serabyn, E., Huby, E., Matthews, K., et al. 2017, AJ, 153, 43
- Soummer et al. (2012) Soummer, R., Pueyo, L., & Larkin, J. 2012, ApJ, 755, L28
- Uyama et al. (2020a) Uyama, T., Muto, T., Mawet, D., et al. 2020a, AJ, 159, 118
- Uyama et al. (2020b) Uyama, T., Currie, T., Christiaens, V., et al. 2020b, ApJ, 900, 135
- van der Marel et al. (2016) van der Marel, N., van Dishoeck, E. F., Bruderer, S., et al. 2016, A&A, 585, A58
- van Holstein et al. (2017) van Holstein, R. G., Snik, F., Girard, J. H., et al. 2017, Proc. SPIE, 10400, 1040015
- van Holstein et al. (2020) van Holstein, R. G., Girard, J. H., de Boer, J., et al. 2020, A&A, 633, A64
- Wang et al. (2015) Wang, J. J., Ruffio, J.-B., De Rosa, R. J., et al. 2015, ascl:1506.001
- Wang et al. (2020) Wang, J. J., Ginzburg, S., Ren, B., et al. 2020, AJ, 159, 263
- Wang et al. (2004) Wang, Z., Bovik, A. C., Sheikh, H. R., & Simoncelli, E. P. 2004, ITIP, 13, 600
- Wenger et al. (2000) Wenger, M., Ochsenbein, F., Egret, D., et al. 2000, A&AS, 143, 9
- Xuan et al. (2018) Xuan, W. J., Mawet, D., Ngo, H., et al. 2018, AJ, 156, 156
- Zhu (2015) Zhu, Z. 2015, ApJ, 799, 16