The pulsating white dwarf G117-B15A: still the most stable optical clock known
Abstract
The pulsating hydrogen atmosphere white dwarf star G 117-B15A has been observed since 1974. Its main pulsation period at 215.19738823(63) s, observed in optical light curves, varies by only s/s and shows no glitches, as pulsars do. The observed rate of period change corresponds to a change of the pulsation period by 1 s in 6.2 million years. We demonstrate that this exceptional optical clock can continue to put stringent limits on fundamental physics, such as constraints on interaction from hypothetical dark matter particles, as well as to search for the presence of external substellar companions.
1 Introduction
G 117–B15A (catalog G 117-B15A), also called RY LMi and WD 0921+354, is a pulsating white dwarf with a hydrogen atmosphere, a DAV or ZZ Ceti star (McGraw, 1979). White dwarf stars are the most common end product of stellar evolution. From the observed initial-mass-function, more than 97% of all stars evolve to white dwarfs (Fontaine et al., 2001; Koester, 2002; Smartt, 2009; Althaus et al., 2010; Woosley & Heger, 2015; Lauffer, Romero & Kepler, 2018). When the normal white dwarf cooling reduces their temperatures such that the their outer envelopes develop partial ionization zones — which depends on the dominant chemical element in the envelope — convection zones are established that drive pulsations. These pulsations are seen as luminosity variations and the period of the dominant pulsation mode is related to the thermal timescale at the base of the envelope. These white dwarf stars show multi-periodic non-radial -mode pulsations that — being global — can be used to measure their internal properties and their rate of evolution (Winget & Kepler, 2008; Fontaine & Brassard, 2008; Vauclair, 2013; Althaus et al., 2010; Córsico et al., 2019).
McGraw & Robinson (1976) found G 117-B15A to be variable, and Kepler et al. (1982) found six simultaneous excited periods in its light curve. The dominant mode has a period of 215 s, a fractional optical amplitude around 22 mma (milli-modulation amplitude, or parts per thousand), and is stable in amplitude and phase. The other, smaller pulsation modes, vary in amplitude from night to night (Kepler et al., 1995), either caused by internal instabilities or unresolved components. Because the DAVs are normal stars except for their variability (Robinson, 1979; Bergeron et al., 1995, 2004; Castanheira et al., 2013; Romero et al., 2013), i.e., an evolutionary stage in the cooling of all white dwarfs, it is likely that the DAV structural properties are representative of all hydrogen atmosphere — DA — white dwarfs. DA white dwarfs comprise more than 80% of all white dwarfs (e.g. Kepler, et al., 2019).
In their review of the properties of pulsating white dwarfs, Córsico et al. (2019) list the 250 ZZ Cetis known at the time. Since then, 39 additional ZZ Cetis have been published (Vincent et al., 2020).
We report our continuing study of the star G 117–B15A, one of the hottest of the ZZ Ceti stars. The rate of change of a pulsation period with time for -mode pulsations in white dwarf stars is theoretically directly related to its evolutionary timescale (Winget et al., 1983), allowing us to infer the age of a cool white dwarf. We have been observing the star since 1974 to measure the rate of period change with time () for the largest amplitude periodicity, at 215 s. Using all the data obtained from 1974 through 2005, Kepler et al. (2005) estimated the intrinsic rate of period change
The quoted uncertainty was the intrinsic one from the fit only.
Kepler (1984) demonstrated that the observed variations in the light curve of G 117–B15A are due to non-radial g-mode pulsations. Kepler et al. (2000) show the models predict the effect of radius change due to the still ongoing contraction are an order of magnitude smaller than the cooling effect on the rate of period change.
Concerning the expected stability of pulsation modes, Hermes et al. (2017) used Kepler and K2 data to show that modes with periods longer than about 800 s are considerably less coherent than shorter period modes, with their power spectra often having a “mottled” appearance. Montgomery et al. (2020) showed that this could be explained by the longer period modes having a stronger interaction with the surface convection zone of the star, since they have turning points much closer to the surface than low-period modes. We return to this question with regards to G 117-B15A in Section 5.1.2.
G 117–B15A is proving to be a useful laboratory for particle physics (Isern et al., 2004). Córsico et al. (2001) calculated the limit on the axion mass compatible with the then observed upper limit to the cooling, showing and Kepler (2004) demonstrates axion cooling would be dominant over neutrino cooling for the lukewarm white dwarf stars for axion masses of this order. Biesiada & Malec (2002) show that the upper limit published in Kepler et al. (2000) limits the string mass scale for 6 dimensions, from the observed cooling rate and the emission of Kaluza-Klein gravitons, but the value is unconstrained for higher dimensions. Benvenuto et al. (2004) show the observed rates of period change can also be used to constrain the dynamical rate of change of the constant of gravity .
2 Observations
Kepler et al. (2005) reported on the observations from 1974 to 2005. In this paper we report on 178 h of additional time series photometry from 2005 to 2020 (Table 1), most taken with the Argos prime-focus CCD camera (Nather & Mukadam, 2004) on the m Otto Struve telescope at McDonald Observatory.
We use the BG40 filter on all observations because it increases the contrast between the (mostly blue) pulsational amplitude and the (mostly red) sky background. Also, the sky background is variable, and introduces strong systematics. Non-radial g-mode light variations have the same phase in all colors (Robinson, Kepler, & Nather, 1982) but the amplitudes decrease with wavelength. For example, a filter-less observation with Argos gives an amplitude around 40% smaller for G 117–B15A.
| Date | Exposure | Duration | Number | Telescope |
| (s) | (s) | - | - | |
| 2005-Dec-05 | 5 | 7040 | 1408 | McD 2.1m |
| 2005-Dec-09 | 5 | 12000 | 2400 | McD 2.1m |
| 2006-Mar-01 | 5 | 14020 | 2804 | McD 2.1m |
| 2006-Mar-04 | 5 | 9305 | 1861 | McD 2.1m |
| 2006-Mar-06 | 10 | 13140 | 1314 | McD 2.1m |
| 2006-Dec-21 | 10 | 4280 | 428 | McD 2.1m |
| 2006-Dec-28 | 5 | 15730 | 3147 | McD 2.1m |
| 2007-Mar-16 | 5 | 2865 | 545 | McD 2.1m |
| 2007-Apr-10 | 5 | 6775 | 1355 | McD 2.1m |
| 2008-Feb-09 | 5 | 16040 | 3208 | McD 2.1m |
| 2008-Mar-11 | 5 | 10175 | 2035 | McD 2.1m |
| 2008-Mar-13 | 5 | 9900 | 1980 | McD 2.1m |
| 2008-Mar-14 | 5 | 3600 | 720 | McD 2.1m |
| 2009-Jan-29 | 5 | 15035 | 3008 | McD 2.1m |
| 2009-Jan-30 | 5 | 14400 | 2881 | McD 2.1m |
| 2009-Feb-03 | 5 | 10315 | 2064 | McD 2.1m |
| 2009-Apr-13 | 20 | 7400 | 370 | 0.6m Suhora |
| 2009-Apr-15 | 22 | 6974 | 317 | 0.6m Suhora |
| 2009-Apr-24 | 10 | 9030 | 903 | McD 2.1m |
| 2010-Jan-10 | 5 | 3840 | 768 | McD 2.1m |
| 2010-Jan-20 | 5 | 7320 | 1465 | McD 2.1m |
| 2010-Feb-16 | 5 | 10805 | 2161 | McD 2.1m |
| 2010-Feb-19 | 10 | 10740 | 1075 | McD 0.9m |
| 2010-Mar-10 | 15 | 7380 | 493 | McD 0.9m |
| 2010-Mar-11 | 15 | 18480 | 1233 | McD 0.9m |
| 2010-Mar-17 | 10 | 18350 | 1836 | McD 0.9m |
| 2010-Mar-18 | 10 | 27030 | 2704 | McD 0.9m |
| 2010-Mar-19 | 10 | 22910 | 2292 | McD 0.9m |
| 2010-Mar-21 | 15 | 20160 | 1345 | McD 0.9m |
| 2010-Apr-10 | 10 | 14640 | 1464 | McD 2.1m |
| 2010-Apr-16 | 10 | 1360 | 137 | McD 2.1m |
| 2010-Dec-12 | 10 | 17530 | 1753 | McD 2.1m |
| 2011-Jan-06 | 10 | 5810 | 581 | McD 2.1m |
| 2011-Jan-09 | 10 | 9770 | 977 | McD 2.1m |
| 2011-Feb-01 | 10 | 9870 | 987 | McD 2.1m |
| 2013-Apr-13 | 5 | 7900 | 1580 | McD 2.1m |
| 2013-Apr-23 | 5 | 10800 | 2160 | McD 2.1m |
| 2013-Apr-25 | 5 | 12670 | 2534 | McD 2.1m |
| 2015-Jan-17 | 30 | 30240 | 890 | McD 2.1m |
| 2015-Jan-18 | 30 | 10620 | 344 | McD 2.1m |
| 2015-Mar-14 | 10 | 11070 | 1101 | McD 2.1m |
| 2015-Mar-16 | 20 | 18700 | 826 | McD 2.1m |
| 2015-Mar-19 | 14 | 14266 | 1019 | McD 2.1m |
| 2015-Mar-20 | 25 | 8100 | 294 | McD 2.1m |
| Date | Exposure | Duration | Number | Telescope |
| (s) | (s) | - | - | |
| 2018-Jan-26 | 15 | 15720 | 1049 | McD 2.1m |
| 2018-Jan-27 | 5 | 14285 | 2856 | McD 2.1m |
| 2018-Jan-28 | 10 | 12460 | 1247 | McD 2.1m |
| 2018-Mar-12 | 10 | 5380 | 539 | McD 2.1m |
| 2018-Mar-13 | 10 | 12480 | 742 | McD 2.1m |
| 2018-Mar-14 | 10 | 9710 | 673 | McD 2.1m |
| 2018-Mar-15a | 10 | 4350 | 435 | McD 2.1m |
| 2018-Mar-15b | 10 | 1940 | 195 | McD 2.1m |
| 2019-Jan-05 | 3 | 20142 | 6713 | McD 2.1m |
| 2020-Feb-20 | 20 | 8400 | 380 | McD 2.1m |
| 2020-Feb-23 | 15 | 18960 | 1132 | McD 2.1m |
3 Data Reduction
We reduce and analyze the data in the manner described by Nather et al. (1990), and Kepler (1993). We bring all the data to the same fractional amplitude scale, and the times from terrestrial UTC to the uniform Barycentric Julian Coordinated Date (TCB) scale, using JPL DE405 ephemeris (Standish, 1998, 2004) to model Earth’s motion. We compute Fourier transforms for each individual run, and verify that the main pulsation at 215 s dominates each data set and has an amplitude stable up to 15%, our uncertainty in amplitude due to the lack of accurate time and color-dependent extinction determination.
4 Time Scale for Period Change
As the dominant pulsation mode at s has been stable in frequency and amplitude since our first observations in 1974, we can calculate the time of maximum for each new run and look for deviations from those assuming a constant period.
We fit our observed time of maximum light, , to the equation for the difference to the calculated one, :
where , , and is the epoch of the time of maximum , i.e, the integer number of cycles after our first observation , which occurred in 16 Dec 1974111Fitting the whole light curve with a term proportional to by non-linear least squares gives unreliable uncertainty estimates and the alias space in P and is extremely dense due to 45 yr data set span (O’Donoghue, 1994)..

In Figure 1, we show the O–C timings after subtracting the correction to period and epoch, and our best fit curve through the data. The size of each point is proportional to its weight, i.e., inversely proportional to the square of uncertainty in phase. The error bars plotted are . From our data through 2020, we obtain a new value for the epoch of maximum, , a new value for the period, , and most importantly, an observed rate of period change of:
Our quoted uncertainty is the most conservative estimate from the weighted average, which accounts for the reduction on the number of effective data points. For a comparison with the uncertainty published in Kepler et al. (2005), the internal uncertainty is now , clearly underestimated from the changes in the value itself.
We use linear least squares to make our fit, with each point weighted inversely proportional to the uncertainty in the time of maxima for each individual run squared. We quadratically add an additional 1 s of uncertainty to the time of maxima for each night to account for external uncertainty caused perhaps by the beating of possible small amplitude pulsations (Kepler et al., 1995) or the small modulation seen in Figure 1. The amplitude, 1 s, is chosen as from the Fourier transform of the . Such external uncertainty is consistent with Splaver et al. (2005) who show that the true uncertainties of the times of arrival of the milli-second pulsars are generally larger than the formal uncertainties, and that a quadratic term is added to them to fit the observations.
The satellite TESS observed G 115-B15A in Sector 21, almost continuously from 21 Jan 2020 to 18 Feb 2020. As the data is co-added on board to 120 s, and the camera is only 15 cm, the observed light curve resulted in an uncertainty of 13.8 s on the time of maximum of the 215 s pulsation. Even though the phase is in agreement with the observed , it did not produce any improvement in our determination. Including the data from TESS, the values are unchanged, due to its large uncertainty. We note that TESS data in Sector 21 already includes the correction of 2 s to Data Product Timestamps in the pipeline222https://archive.stsci.edu/missions/tess/doc/tess_drn/tess_reprocessing-sector_14_19_drn30_v01.pdf, but there is still an extra uncertainty perhaps as large as 4 s in the TESS timings, compared to ground observations (von Essen et al., 2020).
5 Discussion
We claim that the 215 s periodicity in G 117-B15A is the most stable optical clock known. According to Nicholson et al. (2015), their optical atomic clock based on 2,000 ultracold strontium atoms trapped in a laser lattice lose no more than 1 second in 15 billion years, with an accuracy of s/s in the JILA clock. Considering its period is s, even though it is many orders of magnitude more accurate than G 117-B15A, it less stable, as its timescale for period changes, i.e., the time it takes to lose a whole cycle, is 1250 s, compared to 1.2 Gyr for G 117–B15A. The total 26 s phase change observed for G 117-B15A after 45 years of observations implies one cycle of the phase will be reached in 372.5 yr. In terms of accuracy, Brewer et al. (2019) reports the NIST quantum-logic clock reached a systematic uncertainty of . Even the Hulse & Taylor’s millisecond pulsar (Hulse & Taylor, 1975), has a timescale for period change of only 0.35 Gyr (Damour & Taylor, 1991), but the radio millisecond pulsar PSR J1909-3744 (Liu et al., 2020) has s/s, and a timescale of 18 Gyr, after 15 years of observations. after correcting for the motion effects (pulsar proper motion, galactic differential acceleration, orbital motion and general relativity correction), jitter, red and white noise models. The timescale based on the spin of radio pulsars with millisecond periods can have a stability comparable to that of atomic timescales, but millisecond pulsars are also known to undergo sudden small glitch events (e.g. McKee et al., 2016), magnetospheric changes (Shannon et al., 2016) and effects relating to sudden changes in the interstellar medium (Lentati et al., 2016; Brook et al., 2018; Lam et al., 2018).
G 117–B15A was the first pulsating white dwarf to have its main pulsation mode index identified. The 215 s mode has , as determined by comparing the ultraviolet pulsation amplitude, measured with the Hubble Space Telescope, to the optical amplitude (Robinson et al., 1995). Using time-resolved spectra obtained at the Keck Telescope, Kotak et al. (2004) confirm the measurement for the P=215 s pulsation and show that the other large amplitude modes, at 271 s and 304 s, show chromatic amplitude changes that do not fit simple single mode theoretical models (Robinson et al., 1995). Robinson et al. (1995), and Koester, Allard, & Vauclair (1994) derive near 12,400 K, while Bergeron et al. (1995, 2004) using a less efficient model for convection, estimated =11,630 K. Gianninas et al. (2011) used ML2/ models, which corrected to Tremblay et al. (2013) tri-dimensional convection calculations correspond to K, and . The uncertainty in effective temperature determinations from spectroscopy are of the order of 300 K, and 0.05 dex in the surface gravity (Bergeron et al., 1995).
Benvenuto et al. (2002) show the seismological models with time-dependent element diffusion are only consistent with the spectroscopic data if the modes are the , , 3, and 4, and deduces , and K, similar to those by Koester & Allard (2000). Their best model predicted a parallax =15.89 mas, s/s, for the P=215 s, s/s, for the P=271 s, and s/s, for the P=304 s periodicities.
Romero et al. (2012) used the mode identification and the observed periods of the three largest known pulsation modes to solve earlier degeneracy in solutions and derive a hydrogen layer mass best estimate of , assuming for the 215 s mode on their evolutionary C/O core white dwarfs, which resulted in C/O=0.28/0.70 for its mass. The core composition is constrained mainly by the presence of the 304 s pulsation. In their Table 2, Córsico et al. (2012a) quote the theoretical rates of period change for the Romero et al. (2012) best fit model as , , and , for the , 3 and 4 modes. The mode corresponds to the s trapped mode in the hydrogen layer. Similar values were found by Bischoff-Kim et al. (2008) for their thicker hydrogen layer solution while their thinner solution had . Córsico et al. (2012a) also show that because the mode is trapped at the surface hydrogen layer, its rate of period change is almost insensitive to the core composition.
While it is true that the period change timescale can be proportional to the cooling timescale, it is also possible that other phenomena with shorter timescales can affect . The cooling timescale is the longest possible one.
As a corollary, if the observed is low enough to be consistent with evolution, then other processes, such as perhaps a magnetic field or diffusion induced changes in the boundary layers, are not present at a level sufficient to affect .
5.1 Theoretical Estimates and Corrections
5.1.1 Proper Motion
Stars are moving — they are observed to have a proper motion across the sky. As shown by Shklovskii (1970), and known as the “Shklovskii effect”, this means that the observed period derivatives will be higher than the intrinsic period derivative by an amount proportional to . Pajdosz (1995) estimated the influence of the proper motion of the star on the measured as:
where is the radial velocity of the star. Assuming he derived
where is the effect of the proper motion on the rate of period change, is the pulsation period, is the proper motion and is the distance. The proper motion, , and the parallax, , were estimated by Gaia DR2, for both G 117-B15A and its proper motion companion G 117-B15B:
Therefore s/s, and the evolutionary — intrinsic — rate of period change :
5.1.2 Limits on Mode Coherence
Montgomery et al. (2020) showed that the result of Hermes et al. (2017) that modes with periods longer than about 800 s are considerably less coherent than shorter period modes could be explained by their interaction with the time-dependent convection zone. Since the modes are assumed to acquire a small phase shift each time they reflect off the base of the convection zone, we can estimate the average amount of phase that would be accumulated by the 215 s mode over the total time base of observations. While the details are presented in Appendix A, we find that average accumulated phase would be only rad, which translates into a shift in the diagram of only s, i..e., negligible.
5.1.3 Effect of a Changing Magnetic Field
A weak magnetic field can perturb the oscillation frequencies of a star in much the same way that slow rotation does. If this magnetic field also slowly changes its magnitude with time, then it will produce a non-evolutionary for the modes. Here we provide an estimate of the size and rate of change of the magnetic field that would be required to mimic the observed for the 215 s mode; details are given in Appendix B.
Employing the same approach as Jones et al. (1989) and Montgomery (1994), we find that a uniform magnetic field that decreases from 280 G to 0 G over a time period of 46 years can produce s/s for a 209 s, mode. In addition, it is the change in that matters, so the same effect would be produced by a field that decreases from 2814 G to 2800 G over a period of 46 years.
5.2 Pulsation Models
With time, as the temperature in the core of a white dwarf decreases, electron degeneracy increases and the pulsational spectrum of the star shifts to longer periods, in the absence of significant residual gravitational contraction. We compare the measured value of with the range of theoretical values derived from models with C/O cores subject to g–mode pulsations in the temperature range of G 117–B15A which allow for mode trapping. Bischoff-Kim et al. (2008) estimated for their best model with K, , and a helium layer mass of if and if . The adiabatic pulsation calculations of Romero et al. (2012) with realistic evolutionary models, give a mass of , and for the , observed oscillation.
The observed yr is equivalent to 1 s change in period in 6.2 million years. We have therefore measured a rate consistent with the evolutionary time scale for this lukewarm white dwarf.
5.2.1 Core Composition
For a given mass and internal temperature distribution, theoretical models show that the rate of period change increases if the mean atomic weight of the core is increased, for models which have not yet crystallized in their interiors. As the evolutionary model cools, its core crystallizes due to Coulomb interactions between the ions (Lamb & van Horn, 1975), and crystallization slows down the cooling by the release of latent heat. Montgomery & Winget (1999) describe the effect of crystallization on the pulsations of white dwarf stars, but G 117–B15A is not cool or massive enough to have a crystallized core (Winget et al., 1997), or even for the convective coupling of the core to the envelope described by Fontaine et al. (2001) to occur.
The heavier the particles that compose the nucleus of the white dwarf, the faster it cools. The best estimate of mean atomic weight of the core comes from the comparison of the observed with values from an evolutionary sequence of white dwarf models. Brassard et al. (1992) computed the rates of period changes for 800 evolutionary models with various masses, all with carbon cores but differing He/H surface layer masses, obtaining values similar to those of Winget et al. (1981), Wood & Winget (1988), and Bradley & Winget (1991). In those models, the average value of for all , 2 and 3 modes with periods around 215 s in models with an effective temperature around 13,000 K, and a mass of 0.5 , is: Benvenuto et al. (2004) C/O models give Using a Mestel-like cooling law (Mestel, 1952; Kawaler et al., 1986), i.e., , where is the mean atomic weight in the core, one could write, for untrapped modes:
All these models were computed assuming a thick hydrogen layer, which lead to no significant mode trapping. The observed rate of period change is therefore consistent with a C or C/O core. The largest uncertainty comes from the models, essentially the hydrogen layer mass (Bischoff-Kim et al., 2008).
5.2.2 Reflex Motion
The presence of an orbital companion could contribute to the period change we have detected. When a star has an orbital companion, the variation of its line-of-sight position with time produces a variation in the time of arrival of the pulsation maxima, by changing the light travel time between the star and the observer by reflex motion of the white dwarf around the barycenter of the system. Kepler et al. (1991) estimated a contribution to caused by reflex orbital motion of the observed proper motion companion of G 117–B15A in their equation (10) as:
where is the total separation, here is the gravitational constant, is the mass of the companion star. In the above derivation they have also assumed the orbit to be nearly edge on to give the largest effect possible. G 117-B15A with Gaia magnitude , absolute magnitude , and Gaia color , Gaia DR2 parallax mas, proper motion ppm= mas/yr, and its common proper motion companion G 117–B15B (catalog G 117-B15B), with , =10.934, BP-RP=2.885, 13.8” away, mas, ppm= mas/yr, are a common proper motion pair, forming a real binary system. Silvestri et al. (2002) measured the radial velocity of G 117-B15B, assuming it formed a wide binary system with G 117-B15A as only km/s. Kotak et al. (2004) classifies G 117-B15B as an M3Ve from its spectra, obtained with the 10 m Keck I telescope, and measured and K. Kirkpatrick et al. (2011) classifies G117-B15B as M3.5V from WISE colors. The mass of an M3.5V should be around (Lang, 1991). With a separation of 13.8 arcsec, AU, assuming the observed distance between G 117-B15A and B is at its largest (), where is the argument of periapsis. This corresponds to a lower limit on the orbital period of around 22 000 years, and we estimate . The large uncertainty takes into account the possibility the orbit might be strongly elliptical. Even though G 117–B15A and B form a real binary system, the contribution of the orbital reflex motion to the observed is negligible.
The whole observed phase change could also be caused by a planet of Jupiter’s mass orbiting the white dwarf edge-on at a distance of 31 AU, which corresponds to an orbital period around 314 yr, or a more massive planet in a less inclined orbit. Duncan & Lissauer (1998) show that such a planet would survive the post-main sequence mass loss. Any closer to the white dwarf, and such planets would produce a larger (e.g. Krzesinski et al., 2020). Note however that reflex motion produces sinusoidal variations on the , which are distinguishable from parabolic variations after a significant portion of the orbit has been covered. This allows us to rule out the presence of planets as a function of orbital period and , where is the orbital inclination (see Figure 4 in Mullally et al., 2008). Considering a second-order derivative of the has not been detected yet, only planets with orbital periods longer than about 900 yr should be indistinguishable from a parabola, or if their effect on the (O-C) is smaller than 1 s, i.e., with similar to the Earth’s mass. The theoretical upper limit for a stable planetary orbit around G 117-B15A is around (Musielak et al., 2005), i.e., around 240 AU, assuming the observed distance between G 117-B15A and B, , is at its largest (), which would lead to a period of 4800 yr. At that distance, a planet would have to be more massive than to produce a phase change in 45 yr as large as the 26 s observed. Note that for half of the orbit the correction has the opposite sign. If the measured for other ZZ Cetis, like R548 (Mukadam et al., 2013) and L19-2 (Sullivan & Chote, 2015) are also larger than the white dwarf cooling timescales, it is unlikely they are all caused by planets traveling away from us.
As discussed by Damour & Taylor (1991), any relative acceleration of the star with respect to the barycenter of the solar system will contribute to the observed . Their equations (2.2) for the differential galactic orbits, decomposed in a planar contribution (2.12), where the second term is the proper motion correction, and a perpendicular contribution (2.28), applied to G 117-B15A, show the galactic contribution to be exactly the one calculated above for proper motion, i.e., the other terms are negligible — 2 to 3 orders of magnitude smaller.
5.3 Axions
In section 5.2 we list the predicted value of for the trapped mode for the evolutionary models as . As the value of the observed rate of period change is larger than the theoretical model, we study the possibility of the excess of cooling as due to axions — hypothetical weakly interacting particles proposed as a solution to the strong charge-parity problem in quantum chromodynamics (Peccei & Quinn, 1977). This possibility was first raised by Isern et al. (1992) since axions, similar to neutrinos, can escape carrying energy. At the time, employing semi analytical models to the observed period change of G 117-B15A (), they estimated a mass of meV. Kepler et al. (2000) published a value for (), much lower than the previous value, and Córsico et al. (2001) estimated meV using a detailed asteroseismological model. Later, with improved models and determination of (Kepler et al., 2005), Bischoff-Kim et al. (2008) estimated meV. The determination of by Kepler (2012) was used by Córsico et al. (2012a) to estimate meV. This idea was also applied to other DAVs with known, finding meV for R 548 (Córsico et al., 2012b) and meV for L 19-2 (Córsico et al., 2016).
Now, using the new determination for of G117-B15A we are able to set new constraints on the axion mass, assuming the extra cooling is due to the putative axion.
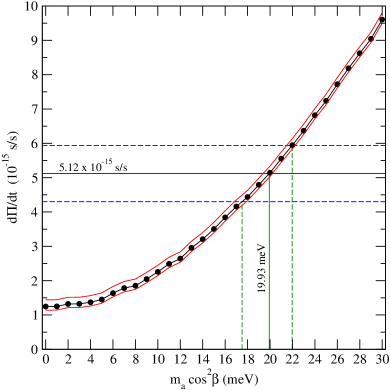
Using the value for the intrinsic , and assuming the effects from possible orbiting planets and magnetic fields are negligible, we estimate an axion mass using fully evolutionary models (see Fig. 2) calculated with LPCODE (e.g. Althaus et al., 2010; Romero et al., 2012) including axions during all the white dwarf cooling. These results are very similar to those of Fig. 5 of Córsico et al. (2012b). As a result we obtain a value of the coupling constant between axions and electrons , or, adopting the DFSZ model (Dine et al., 1981; Zhitnitsky, 1980), an axion mass meV. De Gerónimo et al. (2017) estimated the high and low limits for the C() O reaction rate from the uncertainties given in Kunz et al. (2002). These limits are and factors in the reaction rate, which translates into a central carbon abundance of and respectively, for the best fit model for G 117-B15A. For the k=2, l=1 mode, corresponding to the 215 s mode, the value for , in the case where no axions are considered, changes by % and %, respectively. Since this mode is trapped in the envelope, we do not expect large differences in the value of the rate of period change when the central composition changes (Córsico et al., 2016). Considering both the observational and model uncertainties, the estimated axion mass is meV.
6 Conclusions
We have measured the rate of change of the main pulsation period for the K pulsating DA white dwarf G 117–B15A, the first ZZ Ceti to have its evolutionary rate of change measured, confirming it is the most stable optical clock known, with a rate of change of 1 s in million years and a precise laboratory for physics at high energy. We note that mode trapping can reduce the rate of period change by up to a factor of two (Bradley, 1996; Córsico et al., 2012a), but the changes in the trapping layers are still caused by cooling, and are included in our theoretical models.
After a large investment of telescope time to achieve such precision, we have measured the cooling rate of this 2.16 Gyr old white dwarf (Romero et al., 2012) — or 1.79 Gyr for our models with 20 meV axions. This estimate includes the time the star, with (Romero et al., 2012), took to reach the white dwarf phase. We have also demonstrated it does not harbor planetary bodies similar to Jupiter in mass up to a distance around 30 AU from the star, modulo , where is the inclination to the line of sight. We cannot exclude larger distances or smaller planets with light travel time effects on the white dwarf smaller than 1s.
| Time of Maximum | Epoch of | ||
|---|---|---|---|
| BJDD | Maximum | (sec) | (sec) |
| 2442397.917507 | 0 | 0.0 | 2.1 |
| 2442477.797089 | 32071 | 0.5 | 1.7 |
| 2442779.887934 | 153358 | 3.9 | 2.1 |
| 2442783.850624 | 154949 | 1.2 | 2.9 |
| 2442786.981458 | 156206 | 2.2 | 1.5 |
| 2443462.962774 | 427607 | 1.6 | 1.4 |
| 2443463.946592 | 428002 | 0.5 | 1.4 |
| 2443465.969049 | 428814 | 0.5 | 1.6 |
| 2443489.909755 | 438426 | 0.2 | 1.5 |
| 2443492.898616 | 439626 | 0.9 | 1.6 |
| 2443521.927837 | 451281 | 0.1 | 1.3 |
| 2443552.752879 | 463657 | 0.8 | 1.4 |
| 2443576.725940 | 473282 | -1.6 | 3.3 |
| 2443581.692438 | 475276 | 0.3 | 1.3 |
| 2443582.693698 | 475678 | -0.2 | 1.3 |
| 2443583.697469 | 476081 | 1.0 | 1.3 |
| 2443584.733602 | 476497 | 0.8 | 1.4 |
| 2443604.659292 | 484497 | 1.3 | 1.5 |
| 2443605.752703 | 484936 | 0.4 | 1.4 |
| 2443611.693050 | 487321 | 0.6 | 1.3 |
| 2443613.658222 | 488110 | 0.7 | 1.6 |
| 2443636.674971 | 497351 | 8.8 | 3.4 |
| 2443839.956765 | 578967 | 5.8 | 3.0 |
| 2443841.976708 | 579778 | 3.7 | 3.5 |
| 2443842.980413 | 580181 | -0.7 | 2.2 |
| 2443843.944332 | 580568 | 0.5 | 2.6 |
| 2443869.989703 | 591025 | 1.5 | 2.4 |
| 2443870.946182 | 591409 | 5.5 | 3.1 |
| 2443874.916339 | 593003 | 2.4 | 2.1 |
| 2443959.695117 | 627041 | 0.1 | 2.0 |
| 2443963.662836 | 628634 | 1.6 | 2.1 |
| 2443990.664641 | 639475 | 2.7 | 1.3 |
| 2444169.945954 | 711455 | 0.1 | 1.6 |
| 2444231.822666 | 736298 | -0.7 | 2.9 |
| 2444232.818992 | 736698 | 3.0 | 1.6 |
| 2444293.833896 | 761195 | 0.3 | 1.8 |
| 2444637.776174 | 899285 | 5.8 | 1.9 |
| 2444641.624287 | 900830 | 2.8 | 1.1 |
| 2444992.789531 | 1041820 | 0.1 | 1.6 |
| 2444994.689956 | 1042583 | 1.2 | 1.2 |
| 2444996.744801 | 1043408 | 2.0 | 1.3 |
| 2444997.723649 | 1043801 | 1.9 | 1.2 |
| 2445021.716661 | 1053434 | 1.7 | 1.4 |
| 2445703.860004 | 1327309 | 1.9 | 1.7 |
| 2445734.642701 | 1339668 | 2.4 | 1.2 |
| Time of Maximum | Epoch | ||
|---|---|---|---|
| BJDD | (sec) | (sec) | |
| 2445735.643972 | 1340070 | 2.8 | 1.3 |
| 2446113.763716 | 1491882 | 2.9 | 1.2 |
| 2446443.775386 | 1624379 | 2.8 | 1.1 |
| 2446468.630178 | 1634358 | 2.1 | 1.3 |
| 2446473.718679 | 1636401 | 0.3 | 1.6 |
| 2446523.620086 | 1656436 | 2.2 | 1.6 |
| 2446524.613917 | 1656835 | 5.5 | 2.5 |
| 2446768.855451 | 1754896 | 2.9 | 1.4 |
| 2446794.935676 | 1765367 | 2.5 | 2.1 |
| 2446796.928219 | 1766167 | 0.3 | 1.6 |
| 2446797.924535 | 1766567 | 3.1 | 1.3 |
| 2446798.903378 | 1766960 | 2.6 | 1.8 |
| 2446823.663537 | 1776901 | 3.1 | 1.9 |
| 2446825.651132 | 1777699 | 3.7 | 1.5 |
| 2447231.328096 | 1940575 | 3.7 | 1.9 |
| 2447231.612054 | 1940689 | 5.1 | 3.5 |
| 2447232.396626 | 1941004 | 5.0 | 1.6 |
| 2447232.623291 | 1941095 | 5.9 | 2.9 |
| 2447233.343090 | 1941384 | 4.5 | 1.3 |
| 2447233.634506 | 1941501 | 4.7 | 2.3 |
| 2447234.319475 | 1941776 | 6.8 | 3.2 |
| 2447235.313250 | 1942175 | 5.2 | 1.4 |
| 2447235.607168 | 1942293 | 6.4 | 2.1 |
| 2447236.610922 | 1942696 | 6.2 | 1.6 |
| 2447589.375198 | 2084328 | 3.2 | 1.4 |
| 2447594.331735 | 2086318 | 5.2 | 1.6 |
| 2447595.323018 | 2086716 | 3.5 | 2.0 |
| 2447596.311907 | 2087113 | 10.1 | 2.3 |
| 2447597.315602 | 2087516 | 4.8 | 1.7 |
| 2447598.319339 | 2087919 | 3.1 | 3.1 |
| 2447499.072036 | 2048072 | 6.5 | 3.2 |
| 2447532.768799 | 2061601 | 1.3 | 1.4 |
| 2447853.846325 | 2190511 | 4.3 | 2.1 |
| 2447856.832697 | 2191710 | 5.2 | 1.9 |
| 2447918.644630 | 2216527 | 2.6 | 3.1 |
| 2447920.619811 | 2217320 | 6.7 | 3.3 |
| 2447952.622834 | 2230169 | -3.3 | 2.9 |
| 2447972.620899 | 2238198 | 9.6 | 6.1 |
| 2447973.709340 | 2238635 | 9.7 | 2.6 |
| 2447973.741682 | 2238648 | 6.5 | 1.4 |
| 2447978.770467 | 2240667 | 10.0 | 2.1 |
| 2447979.781717 | 2241073 | 11.8 | 3.1 |
| 2447980.319627 | 2241289 | 4.6 | 3.5 |
| 2447977.403038 | 2240118 | 7.5 | 2.3 |
| 2447978.327055 | 2240489 | 4.3 | 3.3 |
| 2447979.358189 | 2240903 | 2.6 | 3.4 |
| 2447979.358145 | 2240903 | -1.2 | 4.9 |
| 2447978.601069 | 2240599 | 7.4 | 2.5 |
| Time of Maximum | Epoch | ||
|---|---|---|---|
| BJDD | (sec) | (sec) | |
| 2447980.621017 | 2241410 | 5.8 | 3.4 |
| 2447980.782929 | 2241475 | 7.2 | 2.3 |
| 2447981.325918 | 2241693 | 8.4 | 1.4 |
| 2447981.592393 | 2241800 | 5.7 | 1.4 |
| 2447981.779185 | 2241875 | 4.8 | 1.1 |
| 2447982.329663 | 2242096 | 7.4 | 1.8 |
| 2447982.743093 | 2242262 | 5.0 | 1.2 |
| 2447983.734400 | 2242660 | 5.4 | 1.2 |
| 2447979.281057 | 2240872 | 9.5 | 2.9 |
| 2447980.224899 | 2241251 | -2.4 | 2.9 |
| 2447984.735678 | 2243062 | 6.5 | 1.1 |
| 2448245.724666 | 2347847 | -3.3 | 5.1 |
| 2448267.799932 | 2356710 | 5.2 | 2.3 |
| 2448324.627972 | 2379526 | 4.3 | 1.2 |
| 2448325.708938 | 2379960 | 4.1 | 1.3 |
| 2448328.593208 | 2381118 | 6.4 | 1.6 |
| 2448331.661735 | 2382350 | 4.0 | 1.2 |
| 2448238.571479 | 2344975 | 8.3 | 2.2 |
| 2448622.833258 | 2499253 | 3.3 | 1.8 |
| 2448680.642683 | 2522463 | 6.3 | 1.2 |
| 2448687.614155 | 2525262 | 4.0 | 1.2 |
| 2448688.597979 | 2525657 | 3.4 | 1.2 |
| 2449062.660365 | 2675840 | 4.2 | 1.6 |
| 2449063.609354 | 2676221 | 6.7 | 1.9 |
| 2449066.615640 | 2677428 | 6.5 | 1.4 |
| 2449066.371558 | 2677330 | 7.2 | 2.0 |
| 2449066.326737 | 2677312 | 8.2 | 2.6 |
| 2449069.342967 | 2678523 | 6.4 | 1.7 |
| 2449298.239287 | 2770423 | 8.5 | 4.1 |
| 2449298.304041 | 2770449 | 8.2 | 4.1 |
| 2449294.214264 | 2768807 | 5.5 | 4.1 |
| 2449294.293897 | 2768839 | -0.5 | 4.1 |
| 2449295.439583 | 2769299 | -4.0 | 6.1 |
| 2449295.494387 | 2769321 | -3.3 | 7.1 |
| 2449036.809260 | 2665461 | 2.4 | 2.2 |
| 2449038.677300 | 2666211 | 3.1 | 2.2 |
| 2449040.687310 | 2667018 | 3.6 | 4.1 |
| 2449041.616360 | 2667391 | 4.9 | 4.1 |
| 2449799.723888 | 2971765 | 5.6 | 1.3 |
| 2450427.920960 | 3223981 | 8.2 | 3.8 |
| 2450429.973242 | 3224805 | 2.7 | 2.4 |
| 2450430.914779 | 3225183 | 6.9 | 2.5 |
| 2450431.843821 | 3225556 | 7.5 | 1.5 |
| 2450434.912392 | 3226788 | 8.8 | 2.0 |
| 2450436.929828 | 3227598 | 5.4 | 1.7 |
| 2450483.633189 | 3246349 | 9.6 | 1.8 |
| 2451249.5989069 | 3553878 | 10.1 | 1.3 |
| 2451249.7632895 | 3553944 | 9.7 | 1.7 |
| Time of Maximum | Epoch | ||
|---|---|---|---|
| BJDD | (sec) | (sec) | |
| 2451250.6126098 | 3554285 | 8.7 | 2.0 |
| 2451526.8772586 | 3665203 | 10.4 | 1.2 |
| 2451528.8523866 | 3665996 | 10.0 | 1.5 |
| 2451528.9196061 | 3666023 | 7.4 | 1.4 |
| 2451528.9868422 | 3666050 | 6.3 | 1.9 |
| 2451529.8585943 | 3666400 | 6.6 | 2.0 |
| 2451530.9097492 | 3666822 | 13.4 | 2.41 |
| 2451960.8561629 | 3839442 | 10.1 | 1.62 |
| 2451962.7864775 | 3840217 | 11.3 | 1.48 |
| 2451967.6806926 | 3842182 | 8.1 | 1.93 |
| 2451988.7919772 | 3850658 | 10.5 | 2.00 |
| 2451990.7845255 | 3851458 | 8.8 | 1.59 |
| 2452037.6472583 | 3870273 | 10.1 | 3.39 |
| 2452045.6399770 | 3873482 | 12.5 | 1.85 |
| 2452225.9050927 | 3945857 | 7.6 | 1.34 |
| 2452225.9598927 | 3945879 | 8.0 | 0.65 |
| 2452263.8834810 | 3961105 | 10.6 | 0.58 |
| 2452316.6442205 | 3980721 | 13.1 | 1.0 |
| 2452317.8995164 | 3982288 | 12.2 | 0.67 |
| 2452319.7999417 | 3982691 | 12.0 | 0.79 |
| 2452317.6479750 | 3982792 | 10.3 | 0.95 |
| 2452321.8348344 | 3983555 | 11.4 | 1.23 |
| 2452322.7265266 | 3984372 | 9.9 | 3.03 |
| 2452312.7412881 | 3984730 | 11.4 | 3.5 |
| 2452373.6840808 | 4089983 | 9.9 | 1.1 |
| 2452373.6839702 | 4090425 | 12.6 | 1.2 |
| 2452373.7140655 | 4090791 | 10.6 | 0.68 |
| 2452375.6392709 | 4122465 | 12.8 | 1.0 |
| 2452374.7700070 | 4124076 | 12.5 | 1.23 |
| 2452581.9494464 | 4134940 | 12.0 | 1.83 |
| 2452583.9095168 | 4137288 | 11.5 | 1.74 |
| 2452584.8812628 | 4144503 | 13.8 | 0.92 |
| 2452585.9821875 | 4148953 | 12.0 | 1.16 |
| 2452586.8937641 | 4146104 | 12.3 | 0.7 |
| 2452665.7845581 | 4255806 | 13.7 | 0.72 |
| 2452669.7970851 | 4256260 | 10.6 | 1.52 |
| 2452696.8561592 | 4257768 | 12.8 | 0.96 |
| 2452724.6624548 | 4267394 | 10.5 | 0.81 |
| 2453381.7442572 | 4409917 | 11.5 | 1.41 |
| 2453439.7653860 | 4433212 | 13.9 | 1.0 |
| 2453446.6073830 | 4435959 | 15.2 | 0.71 |
| 2453473.6191370 | 4446804 | 15.1 | 0.75 |
| Time of Maximum | Epoch | ||
|---|---|---|---|
| BJDD | (sec) | (sec) | |
| 2453709.9576790 | 4541692 | 15.36 | 1.58 |
| 2453713.7883270 | 4543230 | 9.76 | 1.36 |
| 2453795.7202970 | 4576125 | 13.89 | 1.14 |
| 2453798.7440310 | 4577339 | 14.88 | 1.56 |
| 2453800.7291150 | 4578136 | 13.82 | 1.32 |
| 2454090.9940570 | 4694675 | 16.41 | 1.92 |
| 2454097.8708770 | 4697436 | 13.67 | 1.26 |
| 2454175.7329770 | 4728697 | 13.56 | 2.10 |
| 2454505.6674710 | 4861163 | 16.64 | 1.09 |
| 2454536.7864160 | 4873657 | 17.32 | 1.16 |
| 2454538.7914220 | 4874462 | 15.95 | 1.21 |
| 2454539.5760330 | 4874777 | 19.16 | 1.43 |
| 2454860.8527290 | 5003767 | 14.62 | 1.18 |
| 2454861.8714540 | 5004176 | 16.72 | 1.16 |
| 2454865.7718960 | 5005742 | 15.80 | 1.43 |
| 2454935.282668 | 5033650 | 17.80 | 2.00 |
| 2454937.327536 | 5034471 | 17.34 | 2.67 |
| 2454945.716259 | 5037839 | 18.20 | 1.66 |
| 2455215.8113837 | 5146280 | 17.03 | 1.29 |
| 2455216.7429028 | 5146654 | 16.45 | 1.18 |
| 2455243.7347524 | 5157491 | 18.16 | 1.26 |
| 2455266.604463 | 5166673 | 18.74 | 1.76 |
| 2455272.6766822 | 5169111 | 17.25 | 1.83 |
| 2455273.588298 | 5169477 | 17.26 | 1.63 |
| 2455274.592065 | 5169880 | 19.53 | 1.42 |
| 2455276.6069443 | 5170689 | 15.42 | 3.27 |
| 2455542.8289250 | 5277575 | 19.59 | 1.28 |
| 2455567.8558979 | 5287623 | 18.64 | 1.48 |
| 2455570.8223324 | 5288814 | 18.49 | 1.33 |
| 2455593.7542828 | 5298021 | 17.52 | 1.29 |
| 2456395.6136513 | 5619961 | 19.00 | 1.44 |
| 2456405.6736629 | 5624000 | 21.75 | 1.16 |
| 2457039.68401488 | 5878550 | 21.05 | 4.19 |
| 2457040.73759366 | 5878973 | 21.76 | 1.79 |
| 2457095.73749568 | 5901055 | 24.57 | 1.27 |
| 2457097.63542361 | 5901817 | 25.14 | 0.96 |
| 2457100.62178721 | 5903016 | 25.28 | 0.62 |
| 2457101.62556613 | 5903419 | 27.23 | 14.81 |
| 2458189.71735867 | 6340279 | 27.19 | 1.32 |
| 2458190.59411461 | 6340631 | 29.42 | 1.41 |
| 2458191.66260081 | 6341060 | 26.95 | 1.22 |
| 2458192.59418283 | 6341434 | 31.81 | 1.50 |
| 2458192.68629503 | 6341471 | 28.00 | 2.65 |
| 2458146.67287842 | 6322997 | 25.35 | 0.79 |
| Time of Maximum | Epoch | ||
|---|---|---|---|
| BJDD | (sec) | (sec) | |
| 2458145.70398597 | 6322608 | 24.83 | 0.58 |
| 2458144.72013874 | 6322213 | 23.40 | 0.85 |
| 2458488.81432050 | 6460364 | 26.35 | 0.54 |
| 2458870.45096380 | 6613588 | 27.75 | 3.14 |
| 2458902.63843304 | 6626511 | 29.26 | 13.8 |
Appendix A Estimate of Phase Drift of 215 s Mode
According to Montgomery et al. (2020), modes experience a small phase shift at their outer turning point due to the changing depth of the convection zone. If we assume that the average phase shift (due to the presence of multiple modes) is essentially random, then we can treat the accumulated phase after multiple reflections as a random walk. Denoting the average phase shift after one reflection as , then the average total phase shift after cycles is given by
| (A1) |
Values of can be obtained from the damping rate via the following relation (equation 15 of Montgomery et al., 2020):
| (A2) |
where is the radial order of the mode and is its period. Thus, we find that
| (A3) |
For the relevant mode in G117-B15A, the total number of cycles is , , s, and, from Fig. 9a of Montgomery et al. (2020), (and possibly much smaller than this), which yields a total phase shift of . Thus, the average shift of the last point in the diagram should be s. Given this small value, the analysis of G117-B15A should be unaffected by the time-dependent effects of the surface convection zone.
Appendix B Effect of a Changing Magnetic Field
A pulsating white dwarf with a magnetic field should have its oscillation frequencies perturbed by the field. If that field changes with time (as has been directly observed in many astronomical objects) then the oscillation frequencies will also change with time.
For the case of oscillation frequencies perturbed by slow rotation, the use of perturbation theory is valid because the effects of rotation are everywhere small. This is not true for weak magnetic fields. Near the surface of a stellar model the gas pressure () approaches zero while the magnetic pressure does not. Thus, there is always a region in which , and, since the magnetic field geometry can modify the angular structure of the modes in this region, a self-consistent treatment can be quite complex (e.g., Dziembowski & Goode, 1996; Bigot et al., 2000; Bigot & Dziembowski, 2002).
Fortunately, we are only interested in the special case of the effect of a weak magnetic field on the frequencies of low-order g-modes in white dwarfs. These modes have outer turning points far below the region where , so the perturbations to their frequencies do not strongly depend on their angular structure in the surface layers. Thus, a simple perturbative treatment as used in Jones et al. (1989) should be adequate for these modes.
Since we are only interested in order of magnitude estimates, we choose a constant field in the direction aligned with the rotation axis. We also only consider the perturbation of modes; the perturbation of other values will be the same order of magnitude. Repeating the analysis in Montgomery (1994) for a “G117-B15A-like” model (12,400 K, ), we find that a magnetic field that decreases in strength from 280 G to 0 G over a time span of 46 years can produce s/s for a mode with and s. Furthermore, it is actually the change in that matters, i.e., , so the same effect would be produced by a magnetic field the goes from 2814 G to 2800 G over the same time span.
References
- Althaus et al. (2010) Althaus, L. G., Córsico, A. H., Isern, J., et al. 2010, A&A Rev., 18, 471. doi:10.1007/s00159-010-0033-1
- Benvenuto et al. (2002) Benvenuto, O. G., Córsico, A. H., Althaus, L. G., & Serenelli, A. M. 2002, MNRAS, 332, 399
- Benvenuto et al. (2004) Benvenuto, O. G., García-Berro, E., & Isern, J. 2004, Phys. Rev. D, 69, 082002
- Bergeron et al. (1995) Bergeron, P., Wesemael, F., Lamontagne, R., Fontaine, G., Saffer, R.A., & Allard, N.F. 1995, ApJ, 449, 258
- Bergeron et al. (2004) Bergeron, P., Fontaine, G., Billères, M., Boudreault, S., & Green, E. M. 2004, ApJ, 600, 404
- Biesiada & Malec (2002) Biesiada, M. & Malec, B. (2002) Physical Review D, 65, 43008
- Bigot et al. (2000) Bigot, L., Provost, J., Berthomieu, G., et al. 2000, A&A, 356, 218
- Bigot & Dziembowski (2002) Bigot, L. & Dziembowski, W. A. 2002, A&A, 391, 235
- Bischoff-Kim et al. (2008) Bischoff-Kim, A., Montgomery, M. H., & Winget, D. E. 2008, ApJ, 675, 1512
- Bradley (1996) Bradley, P.A. 1996, ApJ, 468, 350
- Bradley & Winget (1991) Bradley, P. A., & Winget, D. E. 1991, ApJS, 75, 463
- Bradley (1998) Bradley, P. A. 1998, ApJS, 116, 307
- Brassard et al. (1993) Brassard, P., Fontaine, G., Wesemael, F., & Talon, A. 1993, In White Dwarfs: Advances in Observation and Theory, ed. M.A. Barstow, (Dordrecht: Kluwer), 485
- Brassard et al. (1992) Brassard, P., Fontaine, G., Wesemael, F., & Tassoul, M. 1992, ApJS, 81, 747
- Brewer et al. (2019) Brewer, S. M., Chen, J.-S., Hankin, A. M., et al. 2019, Phys. Rev. Lett., 123, 033201
- Brook et al. (2018) Brook, P. R., Karastergiou, A., McLaughlin, M. A., et al. 2018, ApJ, 868, 122
- Castanheira et al. (2013) Castanheira, B. G., Kepler, S. O., Kleinman, S. J., et al. 2013, MNRAS, 430, 50
- Córsico et al. (2001) Córsico, A.H., Benvenuto, O.G., Althaus, L.G., Isern, J. & Garcia-Berro, E. 2001, New Astronomy, 5, 197.
- Córsico et al. (2012b) Córsico, A. H., Althaus, L. G., Romero, A. D., et al. 2012, J. Cosmology Astropart. Phys, 2012, 010
- Córsico et al. (2012a) Córsico, A. H., Althaus, L. G., Miller Bertolami, M. M., et al. 2012, MNRAS, 424, 2792
- Córsico et al. (2016) Córsico, A. H., Romero, A. D., Althaus, L. G., et al. 2016, J. Cosmology Astropart. Phys, 2016, 036
- Córsico et al. (2019) Córsico, A. H., Althaus, L. G., Miller Bertolami, M. M., et al. 2019, A&A Rev., 27, 7
- Damour & Taylor (1991) Damour, T., & Taylor, J. H. 1991, ApJ, 366, 501
- De Gerónimo et al. (2017) De Gerónimo, F. C., Althaus, L. G., Córsico, A. H., et al. 2017, A&A, 599, A21. doi:10.1051/0004-6361/201629806
- Dine et al. (1981) Dine, M., Fischler, W., & Srednicki, M. 1981, Physics Letters B, 104, 199
- Duncan & Lissauer (1998) Duncan, M. J., & Lissauer, J. J. 1998, Icarus, 134, 303
- Dziembowski & Goode (1996) Dziembowski, W. A. & Goode, P. R. 1996, ApJ, 458, 338
- Eggen & Greenstein (1965) Eggen, O.J., and Greenstein, J.L. 1965, ApJ, 141, 183
- Finley et al. (1997) Finley, D. S., Koester, D., & Basri, G. 1997, ApJ, 488, 375
- Fontaine et al. (2001) Fontaine, G., Brassard, P., & Bergeron, P. 2001, PASP, 113, 409
- Fontaine & Brassard (2008) Fontaine, G. & Brassard, P. 2008, PASP, 120, 1043. doi:10.1086/592788
- Gaia Collaboration et al. (2018) Gaia Collaboration, Brown, A. G. A., Vallenari, A., et al. 2018, A&A, 616, A1
- Gianninas et al. (2011) Gianninas, A., Bergeron, P., & Ruiz, M. T. 2011, ApJ, 743, 138
- Giclas et al. (1963) Giclas, H. L., Burnham, R., & Thomas, N. G. 1963, Lowell Observatory Bulletin, Vol.6, 120, 42
- Greaves (2004) Greaves, J. 2004, MNRAS, 355, 585
- Harrington & Dahn (1980) Harrington, R.S. & Dahn, C.C. 1980, AJ, 85, 454
- Hermes et al. (2017) Hermes, J. J., Gänsicke, B. T., Kawaler, S. D., et al. 2017, ApJS, 232, 23
- Holberg, Barstow, & Burleigh (2003) Holberg, J. B., Barstow, M. A., & Burleigh, M. R. 2003, ApJS, 147, 145
- Hulse & Taylor (1975) Hulse, R. A., & Taylor, J. H. 1975, ApJ, 195, L51
- Isern et al. (1992) Isern, J., Hernanz, M., & Garcia-Berro, E. 1992, ApJ, 392, L23
- Isern et al. (2004) Isern, J., Garcia-Berro, E., Corsico, A. H., Benvenuto, O. G., & Althaus, L. G. 2004, Communications in Asteroseismology, 145, 13
- Jones et al. (1989) Jones, P. W. Hansen, C. J., Pesnell, W. D., & Kawaler, S. D., 1989, ApJ, 336, 403
- Kaspi et al. (1994) Kaspi, V. M., Taylor, J. H., & Ryba, M. F. 1994, ApJ, 428, 713
- Kawaler et al. (1986) Kawaler, S. D., Winget, D. E., Iben, I., & Hansen, C. J. 1986, ApJ, 302, 530
- Kepler et al. (1983) Kepler, S. O., Robinson, E. L., & Nather, R. E. 1983, ApJ, 271, 744
- Kepler (1984) Kepler, S.O. 1984, ApJ, 286, 314
- Kepler (1993) Kepler, S.O. 1993, Baltic Astronomy, 2, 515
- Kepler et al. (1982) Kepler, S.O., Robinson, E.L., Nather, R.E., & McGraw, J.T. 1982, ApJ, 254, 676
- Kepler et al. (1991) Kepler, S.O., et al. 1991, ApJ, 378, L45.
- Kepler et al. (1995) Kepler, S.O., et al. 1995, Baltic Astronomy, 4, 221.
- Kepler et al. (2000) Kepler, S.O. et al. 2000, ApJ, 534, L185.
- Kepler (2004) Kepler, S. O. 2004, International Journal of Modern Physics D, 13, 1493
- Kepler et al. (2005) Kepler, S. O., Costa, J. E. S., Castanheira, B. G., et al. 2005, ApJ, 634, 1311
- Kepler (2012) Kepler, S. O. 2012, Progress in Solar/Stellar Physics with Helio- and Asteroseismology, 462, 322
- Kepler, et al. (2019) Kepler S. O., et al., 2019, MNRAS, 486, 2169
- Kirkpatrick et al. (2011) Kirkpatrick, J. D., Cushing, M. C., Gelino, C. R., et al. 2011, ApJS, 197, 19
- Kleinman et al. (2004) Kleinman, S. J., et al. 2004, ApJ, 607, 426
- Koester (2002) Koester, D. 2002, A&A Rev., 11, 33. doi:10.1007/s001590100015
- Koester & Allard (2000) Koester, D., & Allard, N. F. 2000, Baltic Astronomy, 9, 119
- Koester, Allard, & Vauclair (1994) Koester, D., Allard, N.F., & Vauclair, G. 1994, A&A, 291, L9
- Koester & Holberg (2001) Koester, D., & Holberg, J. B. 2001, ASP Conf. Ser. 226: 12th European Workshop on White Dwarfs, 226, 299
- Kotak et al. (2004) Kotak, R., van Kerkwijk, M. H., & Clemens, J. C. 2004, A&A, 413, 301
- Krzesinski et al. (2020) Krzesinski, J., Blokesz, A., Siwak, M., et al. 2020, arXiv:2009.02749
- Kunz et al. (2002) Kunz, R., Fey, M., Jaeger, M., et al. 2002, ApJ, 567, 643. doi:10.1086/338384
- Lam et al. (2018) Lam, M. T., Ellis, J. A., Grillo, G., et al. 2018, ApJ, 861, 132
- Lamb & van Horn (1975) Lamb, D. Q., & van Horn, H. M. 1975, ApJ, 200, 306
- Lang (1991) Lang, K.R. 1999, Astrophysical Data: Planets and Stars, (Springer-Verlag, NY), p. 145
- Lauffer, Romero & Kepler (2018) Lauffer, G. R., Romero, A. D. and Kepler, S. O. 2018, MNRAS, 480, 1547.
- Lentati et al. (2016) Lentati, L., Shannon, R. M., Coles, W. A., et al. 2016, MNRAS, 458, 2161
- Liu et al. (2020) Liu, K., Guillemot, L., Istrate, A. G., et al. 2020, arXiv:2009.12544
- Mestel (1952) Mestel, L. 1952, MNRAS, 112, 583
- Montgomery et al. (2020) Montgomery M. H., Hermes J. J., Winget D. E., Dunlap B. H., Bell K. J., 2020, ApJ, 890, 11
- McGraw (1979) McGraw, J.T. 1979, ApJ, 229, 203
- McGraw & Robinson (1976) McGraw, J.T., & Robinson, E.L. 1976, ApJ, 205, L155
- McKee et al. (2016) McKee, J. W., Janssen, G. H., Stappers, B. W., et al. 2016, MNRAS, 461, 2809
- Montgomery (1994) Montgomery, M. H. 1994, M.Sc. Thesis (The University of Texas at Austin)
- Montgomery & Winget (1999) Montgomery, M. H. & Winget, D. E. 1999, ApJ, 526, 976.
- Mullally et al. (2005) Mullally, F., Thompson, S. E., Castanheira, B. G., Winget, D. E., Kepler, S. O., Eisenstein, D. J., Kleinman, S. J., & Nitta, A. 2005, ArXiv Astrophysics e-prints, arXiv:astro-ph/0502520
- Mullally et al. (2008) Mullally, F., Winget, D. E., Degennaro, S., et al. 2008, ApJ, 676, 573
- Mukadam et al. (2003) Mukadam, A. S., et al. 2003, ApJ, 594, 961
- Mukadam et al. (2004a) Mukadam, A. S., et al. 2004, ApJ, 607, 982
- Mukadam et al. (2004b) Mukadam, A. S., Winget, D. E., von Hippel, T., Montgomery, M. H., Kepler, S. O., & Costa, A. F. M. 2004, ApJ, 612, 1052
- Mukadam et al. (2013) Mukadam, A. S., Bischoff-Kim, A., Fraser, O., et al. 2013, ApJ, 771, 17
- Musielak et al. (2005) Musielak, Z. E., Cuntz, M., Marshall, E. A., et al. 2005, A&A, 434, 355
- O’Donoghue (1994) O’Donoghue, D. 1994, MNRAS, 270, 222
- Nather et al. (1990) Nather, R.E., Winget, D.E., Clemens, J.C., Hansen, C.J., & Hine, B.P. 1990, ApJ, 361, 309
- Nather & Mukadam (2004) Nather, R. E. & Mukadam, A. S. 2004, ApJ, 605, 846
- Nicholson et al. (2015) Nicholson, T .L., Campbell, S. L. Hutson, R. B., Marti, G. E., Bloom, B. J., McNally, R. L., Zhang, W., Barrett, M.D., Safronova, M. .S., Strouse, G. S., Tew W. L. & Ye, J. 2015, Nature Communications, 6, A6896
- Pajdosz (1995) Pajdosz, G. 1995, A&A, 295, L17
- Peccei & Quinn (1977) Peccei, R. D. & Quinn, H. R. 1977, Phys. Rev. D, 16, 1791
- Panei et al. (2000) Panei, J. A., Althaus, L. G., & Benvenuto, O. G. 2000, A&A, 353, 970
- Robinson (1979) Robinson, E.L. 1979, in Proc. of IAU Colloq. 53, White Dwarfs and Variable Degenerate Stars, ed. H.M. Van Horn & V. Weidemann (Rochester: Univ. Rochester), 343
- Robinson, Kepler, & Nather (1982) Robinson, E.L., Kepler, S.O., & Nather, R.E. 1982, ApJ, 259, 219
- Robinson et al. (1995) Robinson, E.L., Mailloux, T.M., Zhang, E., Koester, D., Stiening, R.F., Bless, R.C., Percival, J.W., Taylor, M.J., & van Citters, G.W. 1995, ApJ, 438, 908
- Romero et al. (2012) Romero, A. D., Córsico, A. H., Althaus, L. G., et al. 2012, MNRAS, 420, 1462
- Romero et al. (2013) Romero, A. D., Kepler, S. O., Córsico, A. H., et al. 2013, ApJ, 779, 58
- Shannon et al. (2016) Shannon, R. M., Lentati, L. T., Kerr, M., et al. 2016, ApJ, 828, L1
- Shklovskii (1970) Shklovskii, I. S. 1970, Soviet Ast., 13, 562
- Silvestri et al. (2002) Silvestri, N. M., Oswalt, T. D., & Hawley, S. L. 2002, AJ, 124, 1118
- Smartt (2009) Smartt S. J., 2009, ARA&A, 47, 63
- Splaver et al. (2005) Splaver, E. M., Nice, D. J., Stairs, I. H., Lommen, A. N., & Backer, D. C. 2005, ApJ, 620, 405
- Standish (1998) Standish, E. M. 1998, A&A, 336, 381
- Standish (2004) Standish, E. M. 2004, A&A, 417, 1165
- Sullivan & Chote (2015) Sullivan, D. J. & Chote, P. 2015, 19th European Workshop on White Dwarfs, 493, 199
- Tremblay et al. (2013) Tremblay, P.-E., Ludwig, H.-G., Steffen, M., et al. 2013, A&A, 559, A104
- Vauclair (2013) Vauclair, G. 2013, EAS Publications Series, 63, 175. doi:10.1051/eas/1363020
- Vincent et al. (2020) Vincent, O., Bergeron, P., & Lafrenière, D. 2020, IAU Symposium, 357, 123. doi:10.1017/S1743921320000265
- von Essen et al. (2020) von Essen, C., Lund, M. N., Handberg, R., et al. 2020, AJ, 160, 34
- Winget & Kepler (2008) Winget, D. E. & Kepler, S. O. 2008, ARA&A, 46, 157. doi:10.1146/annurev.astro.46.060407.145250
- Winget et al. (1981) Winget, D. E., van Horn, H. M., & Hansen, C. J. 1981, ApJ, 245, L33
- Winget et al. (1983) Winget, D. E., Hansen, C. J., & van Horn, H. M. 1983, Nature, 303, 781
- Winget et al. (1987) Winget, D. E., Hansen, C. J., Liebert, J., van Horn, H. M., Fontaine, G., Nather, R. E., Kepler, S. O., & Lamb, D. Q. 1987, ApJ, 315, L77
- Winget et al. (1997) Winget, D. E., Kepler, S. O., Kanaan, A., Montgomery, M. H., & Giovannini, O. 1997, ApJ, 487, L191.
- Wood & Winget (1988) Wood, M. A., & Winget, D. E. 1988, Multimode Stellar Pulsations, 199
- Woosley & Heger (2015) Woosley S. E., Heger A., 2015, ASSL, 412, 199 \eprint1505.06712
- Zhitnitsky (1980) Zhitnitsky, A. R. 1980, Sov. J. Nucl. Phys., 31, 260