Pulsational pair-instability and the mass gap of Population III Black Holes: Effects of overshooting
Abstract
Since the discovery of GW190521, several proposals have been put forward to explain the formation of a black hole (BH) in the mass gap caused by (pulsational) pair-instability, . We calculate the mass ejection of Population III stars by the pulsational pair-instability (PPI) process using a stellar evolution and hydrodynamical code. If a relatively small, but reasonable value is adopted for the overshooting parameter, the stars do not become red super giants during the PPI phase. We show that in this case most of the hydrogen envelope remains after the mass ejection by PPI. We find that the BH mass could be at most around below the mass range of pair-instability supernovae.
1 Introduction
The discovery of GW190521 (Abbott et al., 2020) raised an important question. It was suggested that the primary back hole (BH) was in the BH mass gap, (e.g., Farmer et al., 2019; Mapelli et al., 2020), which is caused by the (pulsational) pair-instability (P)PI process (e.g., Woosley, 2017). This primary mass may be explained if a BH grows after its formation. Several such formation scenarios have been proposed. For example, BH mergers in star clusters (e.g. Rodriguez et al., 2019; Di Carlo et al., 2020; 2020ApJ...902L..26F; 2020arXiv200911447L), gas accretion onto Population (Pop) III BHs (e.g. 2019A&A...632L...8R; 2020ApJ...903L..21S) and combination of BH mergers and gas accretion in disks of active galactic nuclei (e.g. Yang et al., 2019; Tagawa et al., 2020).
On the other hand, Farrell et al. (2020), Kinugawa et al. (2020) and Tanikawa et al. (2020) discuss that the binary evolution model may explain a BH mass larger than under some assumptions. Specifically, Tanikawa et al. (2020) claims that a larger BH mass can be realized if a star does not become a red super giant due to a relatively small overshooting parameter. It was also suggested that if a small 12CO reaction rate is adopted, the mass range for the PPI phase shrinks and can even disappear (Farmer et al. 2020; see also Takahashi 2018). In this case the BH mass gap can be shrunk to explain GW190521 (Belczynski, 2020).
In this , we calculate PPI mass loss using a stellar evolution and hydrodynamical code to re-investigate the BH mass gap for Pop III stars. We note that although the PPI mass loss has been discussed by several authors, no previous works have actually calculated the mass loss process using Pop III stellar evolution models. For example, in the work of Woosley (2017), metal free models are mimicked by setting the mass loss rate of a metal poor model to be zero. We show that the BH mass gap depends sensitively on the overshooting parameter. The lower bound of the gap can be much larger than previously thought if we adopt a relatively small, but reasonable, overshooting parameter.
2 Method
The calculation method is similar to Yoshida et al. (2016). We first calculate stellar evolution using the HOSHI code (Takahashi et al., 2018) including the PPI phase. In this , we adopt a 49 isotope nuclear reaction network. Note that in the HOSHI code, acceleration terms are not solved and thus hydrodynamical evolution can not be solved accurately. During the PPI phase, mass ejection may occur due to hydrodynamical effects. We solve such mass ejection using a piecewise parabolic method hydrodynamical code, e.g., Colella & Woodward (1984), including nuclear energy generation. If mass loss occurs we calculate the evolution after removing the corresponding mass from the surface of the star.
The models we calculate are Pop III stars with zero metallicity and have initial masses in the range, . The 12CO is chosen to be 1.5 times the CF88 rate (Caughlan & Fowler, 1988) since, as described in Umeda et al. (2012), the solar abundance ratios are reproduced well if the rate is slightly larger than the value adopted there, 1.3 times the CF88 rate.
In this , we focus on the effect of overshooting. In the HOSHI code, the overshooting is taken with a diffusive treatment. We consider two cases for the overshooting parameter which is defined e.g., in Yoshida et al. (2019). Following that paper, we call the =0.01 and 0.03 cases M and L models, respectively. The M model is a similar choice to GENEC (Ekström et al., 2012), and the L model is similar to Stern (Brott et al., 2011).
3 Results
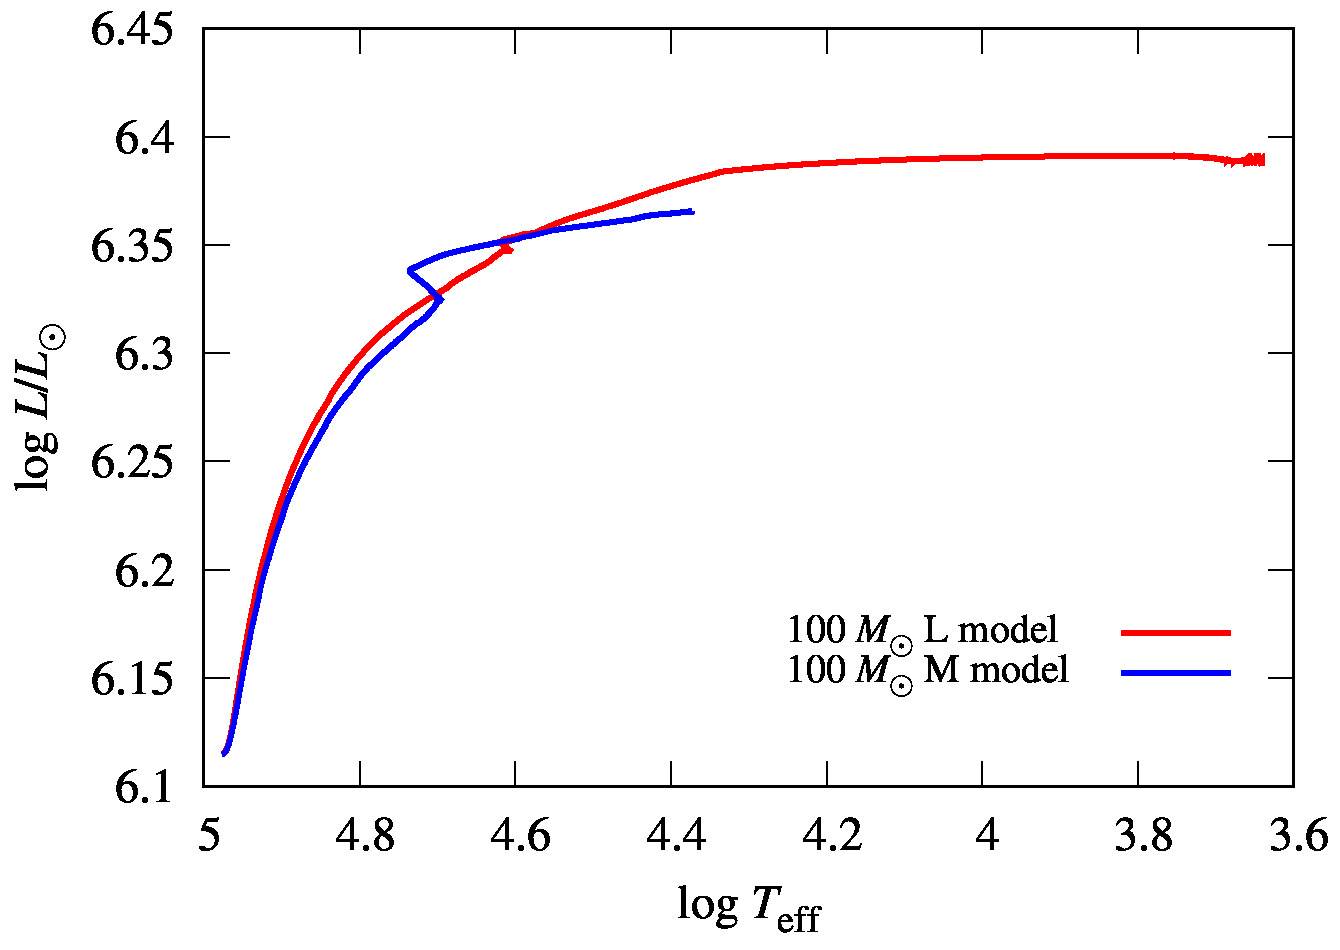
Here we first describe typical differences between the L and M models. Fig. 1 shows the HR-diagrams of 100 models. The L models tend to be red after H-burning, while the M models stay blue in the mass range studied here. The differences between the two models are not large for lower masses () but are signifigant for more massive stars, (e.g., Tanikawa et al., 2020).
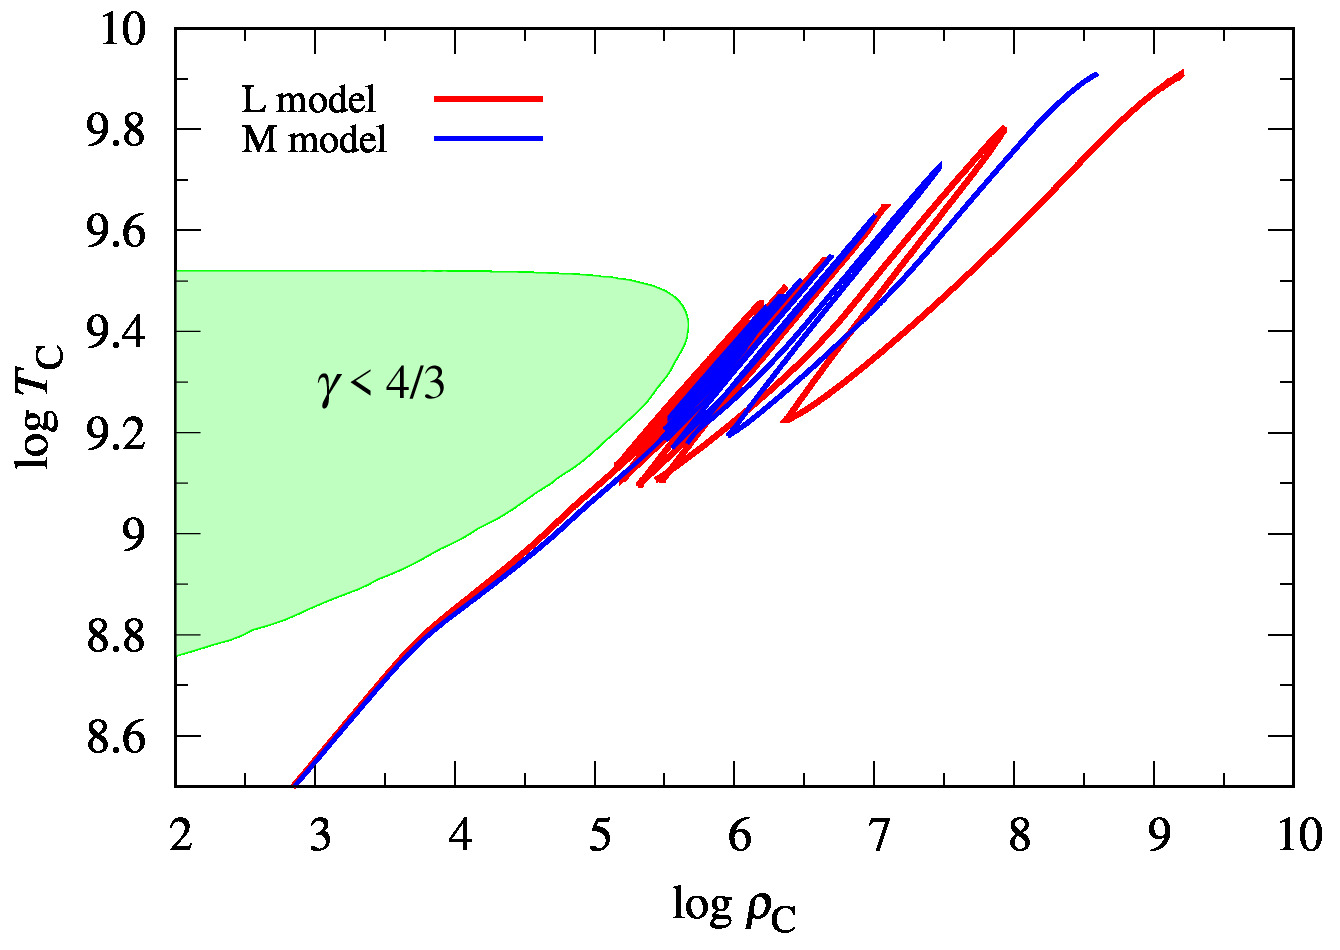
Figure 2 shows the evolution of central temperature and central density for the 100 models around the PPI phase. Both models show temperature & density oscillations during the central Si-burning phase. This oscillation phase is commonly called the PPI phase. As shown below only the last few large oscillations can cause mass ejection.
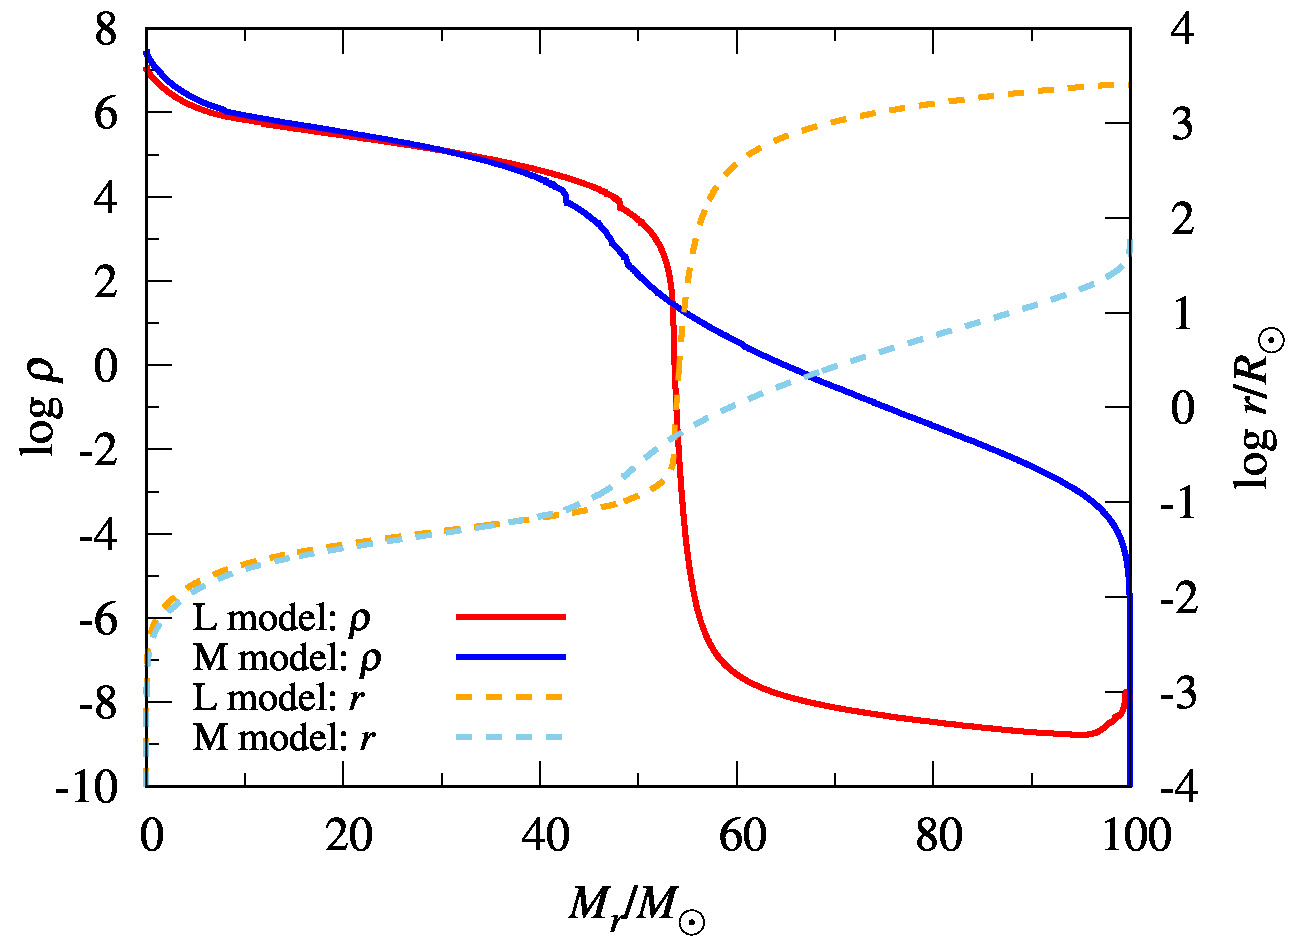
In Figure 3, we show the internal density and radius distribution of the 100 models as a function of enclosed mass () at a time just before the first mass ejection: Log = 9.72 (M model) and Log = 9.64 (L model). We find that inner structures () are similar, but the envelope structures () are quite different.
Table 1 summarizes the main results. , and are the initial, final CO-core and final He-core masses. For most L models, the hydrogen mass fraction changes rapidly at the edge of the He core so that the lower and upper bounds of are identical. The next column shows the number of major PPI oscillations which have peak temperatures Log . The restriction is made because we find mass ejection can only accompany major oscillations, and specifically those with high peak temperatures, although numerous smaller oscillations can occur as shown in Fig.2. Furthermore, not all of the major oscillations result in mass ejections, and we find that the number of mass ejections, which are listed in the next column, is at most 2. We think this is one of the most interesting results in this . For the L models, we find only one mass ejection at most. This is in contrast to the case of CO stars (Yoshida et al., 2016). For Pop III stars, most shock waves produced by PPI, excluding the last one or two, are damped out in the hydrogen envelope without mass ejection. The peak temperature during a PPI oscillation accompanying mass ejection is shown in the next column. The last two columns are the remnant mass after the mass ejection and the energy of the ejecta, respectively.
| # of PPI | Ejection # | Log | Ejecta Energy | ||||
|---|---|---|---|---|---|---|---|
| () | () | () | (K) | () | () | ||
| L Models (=0.03) | |||||||
| 70 | 34.2 | 38.9-48.8 | 4 | 0 | - | 70 | - |
| 75 | 34.9 | 39.3 | 4 | 1 | 9.81 | 42.4 | 6.5 |
| 80 | 37.4 | 42.2-42.9 | 3 | 1 | 9.71 | 42.4 | 0.18 |
| 100 | 48.1 | 53.6 | 2 | 1 | 9.65 | 52.2 | 4.5 |
| 120 | 57.9 | 64.9 | 1 | 1 | 9.66 | 60.3 | 4.7 |
| 135 | 65.4 | 73.5 | 1 | 1 | 9.63 | 66.9 | 5.6 |
| M Models (=0.01) | |||||||
| 70 | 27.0 | 30.3-34.4 | 0 | 0 | - | 70 | - |
| 80 | 31.8 | 35.3-39.4 | 5 | 0 | - | 80 | - |
| 90 | 37.2 | 41.9-44.8 | 3 | 1 | 9.76 | 83.0 | 1.4 |
| 100 | 42.7 | 47.3-52.1 | 2 | 1 | 9.73 | 91.7 | 1.5 |
| 110 | 46.7 | 50.8-56.5 | 2 | 1 | 9.60 | (105.5) | 0.44 |
| (interval: 0.064 yr) | 2 | 9.72 | 91.9 | 3.5 | |||
| 115 | 47.9 | 55.1-62.7 | 1 | 1 | 9.69 | 99.0 | 5.5 |
| 120 | 50.8 | 56.3-71.3 | 2 | 1 | 9.64 | (107.0) | 3.4 |
| (interval: 0.82 yr) | 2 | 9.86 | 69.9 | 49 | |||
| 125 | 55.9 | 63.9-64.9 | 2 | 1 | 9.61 | (99.5) | 6.5 |
| (interval: 3.1 yr) | 2 | 9.79 | 65.1 | 52 | |||
| 130 | 55.6 | 60.9-75.1 | 2 | 1 | 9.60 | (114.3) | 4.7 |
| (interval: 3.1 yr) | 2 | 9.80 | 77.7 | 39 | |||
| 135 | 58.3 | 65.3-72.6 | 1 | 1 | 9.64 | 108.7 | 5.6 |
Note. — , and are the initial, final CO-core and final He-core masses. is defined as the enclosed mass of the CO rich core with helium mass fraction . The range of is defined by for the lower bound and for the upper bound. The next column is the number of PPI oscillations which have peak temperatures Log . The next column is the number of mass ejections. Here, 1 and 2 represent the first and second mass ejections. For the second ejection, we also show the time interval between the two peaks. The peak temperature during a mass ejecting pulse is shown next. The last two columns are the remnant mass and energy of the ejecta. in the parentheses is the stellar mass after the first pulse.
4 Implications
4.1 L models
In the L models, the remnant mass, which we associate with the BH mass, ranges from 42.4 to 70 for the initial mass range of 70 to 135 . The maximum BH mass is obtained for the lowest initial mass, 70 , because only this case does not experience PPI mass ejection. Although only the last PPI pulse ejects mass, almost all of the hydrogen envelope is removed by this pulse. As a result, the expected range for the BH mass gap will be around 70 to 130 assuming the upper bound of the gap is determined by the most massive He core mass exploding as a pair-instability supernova (Takahashi et al., 2018). The lower bound is a little larger than other arguments (e.g., Abbott et al., 2020) but is still marginaly small to explain GW190521 ().
4.2 M models
Although the parameter choice of the M models is as reasonable as the L models, the remnant BH masses are surprisingly different between the two models. First, we find that of the M models is smaller than that of the L models for the same initial mass. This is because smaller means weaker convective mixing which leads to smaller He and CO cores. This smaller CO core mass is one reason why the 80 model does not experience PPI mass ejection in the M model.
Though this effect is important, another effect is much more important in estimating the maximum BH mass below the mass gap. As described above, the L models have a much larger radius than the M models during the PPI phase. Thus, the binding energy of the hydrogen envelope of the M models ( erg) is typically two orders of magnitudes larger than that of the L models ( erg). As shown in Table 1., the typical ejecta energy is of the order of erg and is too small to blow off the entire hydrogen envelope of the M models. Therefore, the remnant mass of the M models is larger than that of the L models. A zero-metallicity model calculated in Farrell et al. (2020) has a compact envelope similar to our models, but they concluded that the BH mass would be small because PPI occurred. We show, however, that the PPIs are not strong enough to eject mass.
In our results, the remnant mass monotonically increases from 70 to 99 for = 70 to 115 . For = 120 to 130 the remnant BH masses are smaller than the = 115 model because PPI mass ejection occurs twice. The second mass ejection is much stronger than the first one. This is because the binding energy of the hydrogen envelope is reduced by the first ejection, and also because the peak temperature during the second PPI oscillation is higher, creating a stronger outgoing shock wave. The maximum remnant mass is obtained for = 135 for which the BH mass will be about 110. This is because this model collapses without the second mass ejection. Therefore, the maximum BH mass below the mass gap could be obtained for a model just below the pair-instability supernova region. We should stress that the M model’s highest remnant mass corresponding to the highest initial mass is quite different from the L model, in which the maximum BH mass corresponds to the most massive model which does not experience PPI mass ejection.
4.3 GW190521
After the discovery of GW190521, several possibilities have been proposed to explain the large primary BH mass. Here we propose another simple solution by applying relatively weak convective overshooting mixing with a parameter of =0.01. In this M Model, a BH with may be produced just below the BH mass gap. We note that our result is for single star evolution, and thus can be immediately applied to binary BH formation models without binary star interactions.
Recently Tanikawa et al. (2020) discussed that in their binary evolution models, the L models have difficulty explaining the primary BH of GW190521. On the other hand the M models may explain it because they can avoid large mass loss during binary interactions due to their small radius. We note that they assume different relations between and from this work and they assume that no PPI occurs for . Nevertheless their assumptions are not far from our M model, and become closer if the PPI pulses are weakened for some reason.
There has been a suggestion that the PPI pulses are weakened if a smaller 12CO rate (Farmer et al., 2019) is adopted. The rate we use here is a standard value to explain the abundance of the universe. We discuss elsewhere how much we can vary the rate to be consistent with the abundance observations.
4.4 PPI supernovae (SNe)
In our results, no L models experience PPI mass ejection twice. These stars would shine as dark SNe IIp, since the ejecta energy is smaller than usual SNe. For M models, the stars would also shine as dark SNe II during the first mass ejection. After the second mass ejection, stars would shine brighter since the ejecta energies are larger. These stars would shine one more time due to the collision between the first and the second ejecta. The light curves for these stages will be investigated elsewhere.
References
- Abbott et al. (2020) Abbott, R., Abbott, T. D., Abraham, S., et al. 2020, Phys. Rev. Lett., 125, 101102, doi: 10.1103/PhysRevLett.125.101102
- Belczynski (2020) Belczynski, K. 2020, arXiv e-prints, arXiv:2009.13526. https://arxiv.org/abs/2009.13526
- Brott et al. (2011) Brott, I., de Mink, S. E., Cantiello, M., et al. 2011, A&A, 530, A115, doi: 10.1051/0004-6361/201016113
- Caughlan & Fowler (1988) Caughlan, G. R., & Fowler, W. A. 1988, Atomic Data and Nuclear Data Tables, 40, 283, doi: 10.1016/0092-640X(88)90009-5
- Colella & Woodward (1984) Colella, P., & Woodward, P. R. 1984, Journal of Computational Physics, 54, 174, doi: 10.1016/0021-9991(84)90143-8
- Di Carlo et al. (2020) Di Carlo, U. N., Mapelli, M., Bouffanais, Y., et al. 2020, MNRAS, 497, 1043, doi: 10.1093/mnras/staa1997
- Ekström et al. (2012) Ekström, S., Georgy, C., Eggenberger, P., et al. 2012, A&A, 537, A146, doi: 10.1051/0004-6361/201117751
- Farmer et al. (2020) Farmer, R., Renzo, M., de Mink, S. E., Fishbach, M., & Justham, S. 2020, ApJ, 902, L36, doi: 10.3847/2041-8213/abbadd
- Farmer et al. (2019) Farmer, R., Renzo, M., de Mink, S. E., Marchant, P., & Justham, S. 2019, ApJ, 887, 53, doi: 10.3847/1538-4357/ab518b
- Farrell et al. (2020) Farrell, E. J., Groh, J. H., Hirschi, R., et al. 2020, arXiv e-prints, arXiv:2009.06585. https://arxiv.org/abs/2009.06585
- Kinugawa et al. (2020) Kinugawa, T., Nakamura, T., & Nakano, H. 2020, arXiv e-prints, arXiv:2009.06922. https://arxiv.org/abs/2009.06922
- Mapelli et al. (2020) Mapelli, M., Spera, M., Montanari, E., et al. 2020, ApJ, 888, 76, doi: 10.3847/1538-4357/ab584d
- Rodriguez et al. (2019) Rodriguez, C. L., Zevin, M., Amaro-Seoane, P., et al. 2019, Phys. Rev. D, 100, 043027, doi: 10.1103/PhysRevD.100.043027
- Tagawa et al. (2020) Tagawa, H., Haiman, Z., & Kocsis, B. 2020, ApJ, 898, 25, doi: 10.3847/1538-4357/ab9b8c
- Takahashi (2018) Takahashi, K. 2018, ApJ, 863, 153, doi: 10.3847/1538-4357/aad2d2
- Takahashi et al. (2018) Takahashi, K., Yoshida, T., & Umeda, H. 2018, ApJ, 857, 111, doi: 10.3847/1538-4357/aab95f
- Tanikawa et al. (2020) Tanikawa, A., Kinugawa, T., Yoshida, T., Hijikawa, K., & Umeda, H. 2020, arXiv e-prints, arXiv:2010.07616. https://arxiv.org/abs/2010.07616
- Umeda et al. (2012) Umeda, H., Yoshida, T., & Takahashi, K. 2012, Progress of Theoretical and Experimental Physics, 2012, 01A302, doi: 10.1093/ptep/pts017
- Woosley (2017) Woosley, S. E. 2017, ApJ, 836, 244, doi: 10.3847/1538-4357/836/2/244
- Yang et al. (2019) Yang, Y., Bartos, I., Gayathri, V., et al. 2019, Phys. Rev. Lett., 123, 181101, doi: 10.1103/PhysRevLett.123.181101
- Yoshida et al. (2019) Yoshida, T., Takiwaki, T., Kotake, K., et al. 2019, ApJ, 881, 16, doi: 10.3847/1538-4357/ab2b9d
- Yoshida et al. (2016) Yoshida, T., Umeda, H., Maeda, K., & Ishii, T. 2016, MNRAS, 457, 351, doi: 10.1093/mnras/stv3002