Machine versus Human Attention in Deep Reinforcement Learning Tasks
Abstract
Deep reinforcement learning (RL) algorithms are powerful tools for solving visuomotor decision tasks. However, the trained models are often difficult to interpret, because they are represented as end-to-end deep neural networks. In this paper, we shed light on the inner workings of such trained models by analyzing the pixels that they attend to during task execution, and comparing them with the pixels attended to by humans executing the same tasks. To this end, we investigate the following two questions that, to the best of our knowledge, have not been previously studied. 1) How similar are the visual representations learned by RL agents and humans when performing the same task? and, 2) How do similarities and differences in these learned representations explain RL agents’ performance on these tasks? Specifically, we compare the saliency maps of RL agents against visual attention models of human experts when learning to play Atari games. Further, we analyze how hyperparameters of the deep RL algorithm affect the learned representations and saliency maps of the trained agents. The insights provided have the potential to inform novel algorithms for closing the performance gap between human experts and RL agents.
1 Introduction
Researchers have devoted much effort to understanding deep neural networks (DNNs). Since DNNs are partially inspired by the biological nervous systems, researchers have compared these neural networks with the human brain and sensory systems by asking two typical types of questions. The first one considers representation: How similar are the visual representations learned by DNNs and humans when performing the same tasks? The second one concerns explainability: How do similarities and differences in the learned representations explain DNNs’ performance on their tasks?
The first question motivates a seminal line of research that compares representations learned by DNNs with those learned by humans. In computer vision, a linear model that uses the feature map activations generated by a trained CNN can accurately predict neural activities in the early visual cortex, indicating that the two systems have learned similar visual representations [19, 80, 81]. In language learning, a similar connection is found between deep language models and cortical areas [32, 35]. However, this type of comparison has just emerged in decision-making research [46, 13], which motivates us to compare DNNs trained for deep reinforcement learning (RL) tasks with human decision-making. We ask: Do deep RL agents and humans agree on what visual features are important? In other words, do agents pay attention to the same visual features as humans do?
The explainability question is motivated by the Explainable AI (XAI) for deep RL agents [29, 2, 57]. Deep RL has achieved many successes, but few of us fully understand these agents. These agents often learn a mapping from raw images to actions end-to-end where it is not clear why a particular decision is made. Our work addresses the explainability of these black-box models: Do RL agents make mistakes because they fail to attend to important visual features that matter for making the correct decision? An expert human’s attention data could serve as a useful reference for identifying important visual features, which has been validated in object recognition tasks [52].
To answer these two questions, we situate our research in the domain of Atari games [6]. These games span a variety of dynamics, visual features, reward mechanisms, and difficulty levels for both humans and AIs. Two recent lines of research have made our work possible. On the one hand, a human attention dataset on Atari games has been collected using eye trackers [88] and convolution-deconvolution networks have been shown to accurately predict human attention distributions [86]. On the other hand, tools have been introduced to generate visual interpretations of RL agents [23] so one can visualize an RL agent’s saliency map given an image, which is a topographically arranged map that assigns an importance weight to each image pixel and is often treated as the “attention map" of the RL agent. However, these tools can only provide qualitative results – we still need to manually inspect the saliency maps to interpret the performance. A useful comparison standard like human attention had not been considered hence systematic quantification was impossible.
In this work, we present a novel study that compares the RL agent’s attention with both real and estimated human attention. We analyze how learning and hyperparameters of the RL algorithm affect the learned representations and saliency maps. We analyze failure and unseen states for RL agents and identify potential challenges to achieve human-level performance. We conclude by discussing insights gained for RL researchers in both cognitive science and AI.
2 Related Work
Human vs. machine attention in vision and language tasks.
Human experts’ gaze is very efficient and accurate for solving vision tasks. The peak angular speed of the human eye during a saccade reaches up to 900 degrees per second [61]. This allows humans to move their foveae to the right place at the right time to attend to important features [17]. Therefore, human expert’s gaze serves as a good standard in many vision-related tasks for evaluating machine attention, or as a learning target for training machine attention [59, 87]. This approach is widely used in computer vision, see Nguyen et al. [53] for a review. For example, visual saliency researchers train DNNs to predict human visual attention. Saliency research is a well-developed field and we direct interested readers to recent review papers [7, 10, 26, 9]. One such paper has compared visual saliency models with human visual attention [40]. In vision-related language tasks, such as image captioning and visual question answering, it was found that the saliency maps of DNN models are different from human attention [15, 74, 27]. Understanding and quantifying such differences have provided insights on the performance, especially in failure scenarios, of these vision-language models.
Visual explanation for deep RL.
Two classes of methods are widely used to generate visual interpretations of DNNs in the form of saliency maps: gradient-based and perturbation-based. Gradient-based methods compute saliency maps by estimating the input features’ influence on the output using the gradient information [69, 70, 45, 85, 68, 73, 66, 12, 89]. These methods are for visualizing general DNNs but have been used to interpret deep RL agents [39, 78, 67, 36, 77]. Yet gradient-based saliency maps often lack physical meaning and could be difficult to interpret–they may highlight regions with no task-relevant objects or features [23, 25], thus are not used in our analyses.
Perturbation-based methods alter parts of the input image and measure how much the output is affected by the change. Hence there have been different methods of altering the input [84, 22, 14, 90, 60]. These methods have been applied to Atari deep RL agents and can generate qualitatively meaningful saliency maps [23, 34, 24, 58]. However, without human attention as a reference, it is difficult to quantitatively analyze these saliency maps, which motivates our work. There are also methods that change the architecture of the deep RL network by augmenting it with an explicit artificial attention module, so that one can directly access its attention map [51, 82, 50]. Researchers have taken this approach and compared RL agents’ attention with human attention [54]. However, these methods do not apply to general deep RL algorithms since they need to modify the original network architectures and retrain the new ones.
3 Method
We now discuss methods for modeling human attention, training RL agents, and extracting attention information from the trained RL agents. We then discuss how we select data for comparing human versus RL attention, and define the comparison metrics.
Human attention data and model
We use human expert gaze data from Atari-HEAD dataset [88]. The original game runs continually at 60Hz [6], a speed that is challenging even for professional gamers. Human eye movements were rushed and inaccurate at this speed and hence could not serve as a useful reference. In [88], however, the human data were collected in a semi-frame-by-frame mode. Without changing the action manipulation or the reward structures of the games, this design mimicked the frame-by-frame processing of RL agents for the human players. The players were allowed enough time to process the visual input, producing higher-quality data with more precise attention allocation and action execution. These advantages led to world expert-level performance in [88]–about 35x better than the human performance reported in previous deep RL literature [48, 28].
To get human saliency maps for the image states generated by RL agents, we need an accurate human attention model. RL agents make many more mistakes than expert humans and cannot reach the late stages of the games. This creates a state distribution that does not match human data, which contains mostly good states. Having a human attention model allows us to perform comparisons in states encountered by RL agents only, which is especially important when we later analyze RL agents’ failure states.
Predicting human attention is a challenging task in Atari games. The human gaze is rarely on the player’s avatar or contingency regions [6] so simple object detectors would not work. Human players often select and focus on a few among multiple visually identical objects, and divide their attention if multiple objects are relevant for decision making. Recently, variants of convolution-deconvolution network models have achieved the best results on predicting human attention [44, 86, 55, 16]. Here we followed their approach and trained gaze models from ground truth human gaze data. Given an image, the models produce a heatmap of the same dimension that predicts human attention distribution. These models have been evaluated and described in detail in previous studies (e.g., [86]), so we leave out the details in Appendix 1. As a control analysis, we include two attention models in addition to the human gaze. The first one captures the motion information, measured by Farneback optical flow between two consecutive images [20]. The second model captures salient low-level image features, including color, orientation, and intensity (weighted equally), computed by the classic Itti-Koch saliency model [33]. Implementation details of these models can be found in Appendix 1.
Reinforcement learning agent and attention model
As a case study, we use a popular deep RL algorithm named Proximal Policy Optimization (PPO) [65] with default hyperparameters [30]. For each experimental condition (discussed later), we train 5 models with different random seeds to capture the variance in training and ensure reproducibility. For the Atari gaming environment, we use the basic version that has no frame skipping and no stochasticity in action execution (NoFrameskip-v4 version). In order to capture variance in training and ensure reproducibility, we select six popular Atari games instead of using all Atari games and train 540 agents in total, with the same hyperpareameters except for random seeds and discount factors (see Section 4; 300 GPU days on GeForce GTX 1080/1080 Ti).
We use a perturbation-based method [23] to extract attention maps from PPO agents, which has been validated by several subsequent studies [25, 67]. The algorithm takes an input image and applies a Gaussian filter to a pixel location to blur the image. This manipulation adds spatial uncertainty to the region around and produces a perturbed image . Denote the learned policy as and the inputs to the final softmax activation as for image (i.e. the last latent representation). A saliency score for this pixel can be defined as how much the blurred image changes the latent representation in Euclidean space:
| (1) |
Intuitively, describes how much removing information from the region around location changes the policy [23]. In other words, a large indicates that the information around pixel is important for the learning agent’s decision making. Instead of calculating the score for every pixel, [23] found that computing a saliency score for pixel mod 5 and mod 5 produced good saliency maps at lower computational cost for Atari games. The final saliency map is normalized as .
Comparison metrics
Next, we compile a set of game images to compute human and RL saliency maps. For each game, we let a trained PPO agent (with default hyperparameters) play the game until terminated, and uniformly sampled 100 images from the recorded trajectory. We will refer to this set of images as the standard image set.
We then define two metrics for comparing saliency maps when using RL data: Pearson’s Correlation Coefficient (CC) and Kullback-Leibler Divergence (KL). Let denote the human saliency map predicted by the human attention network. CC is between and captures the linear relation between two distributions and :
| (2) |
where denotes the covariance, and and are the standard deviations of and respectively. CC penalizes false positives and false negatives equally.
However, we may not want to penalize the RL agent if it attends to regions that the human gaze model is not currently focused on. The human gaze data only reveals the “overt” attention, and humans can still pay “covert” attention to entities in the working memory [56, 64]. In other words, being attended to by the human gaze is a sufficient (but not necessary) condition for the features to be important. Thus we need a second metric that penalizes the agent only if it fails to pay attention to human attended regions, or equivalently, a metric that is sensitive to false negatives if we treat human attention as the ground truth. KL is an ideal candidate in this case [9]:
| (3) |
where is a small regularization constant (chosen to be 2.2204e-16 [9]) and determines how much zero-valued predictions are penalized.
4 Results
To make meaningful comparisons, we first ensure that the human attention model is accurate, and that PPO agents’ attention maps are consistent over repeated runs. We then compare human attention with PPO attention obtained from different learning stages and from agents that are trained with different discount factors. We then analyze PPO agents’ attention in failure and unseen states. Finally, we show comparison results for other deep RL algorithms.
Accuracy of human attention model
We implement the convolution-deconvolution gaze prediction model [88] to generate a human saliency map for image at timestep , given a stack of four consecutive images as input. We use 80% gaze data for training and 20% for testing. The model can accurately predict the human gaze. On testing data, we obtained Area under ROC Curve (AUC) score of , CC of , and KL of , averaged over all games. Prediction accuracy for individual games can be found in Appendix 1 of the supplementary materials. A visualization of the gaze data and prediction results can be found in the attached video file. This accuracy is considered high in saliency research [9].
Consistency of RL attention
We then show that saliency maps of the RL agents trained under the same experiment setting, provided by [30], are highly consistent despite the stochasticity in the training process. The stochasticity is controlled by a random seed that is used to initialize both the game environment and the network. For each game, we use 5 random seeds (0-4), train an agent using each seed, and generate 5 saliency maps with these trained agents. For each image in the standard set, we compute pair-wise CCs between the 5 saliency maps (10 CCs in total). The average value for these 10 CCs, across 100 images and 6 games, is . Given such high consistency, the saliency maps we use later are the averaged results of these 5 saliency maps.
4.1 RL versus human attention: The effects of learning
So far we have verified that the gaze model can accurately predict human attention and that RL attention is consistent across repeated runs. We now address the primary research question: How similar are the visual features learned by RL agents and humans when performing the same task? We first study how the attention of PPO agents evolves over the training steps, compared with human attention. For each game, we saved neural network weights at different time steps during training. Then we use these saved models to generate saliency maps on the standard image set.
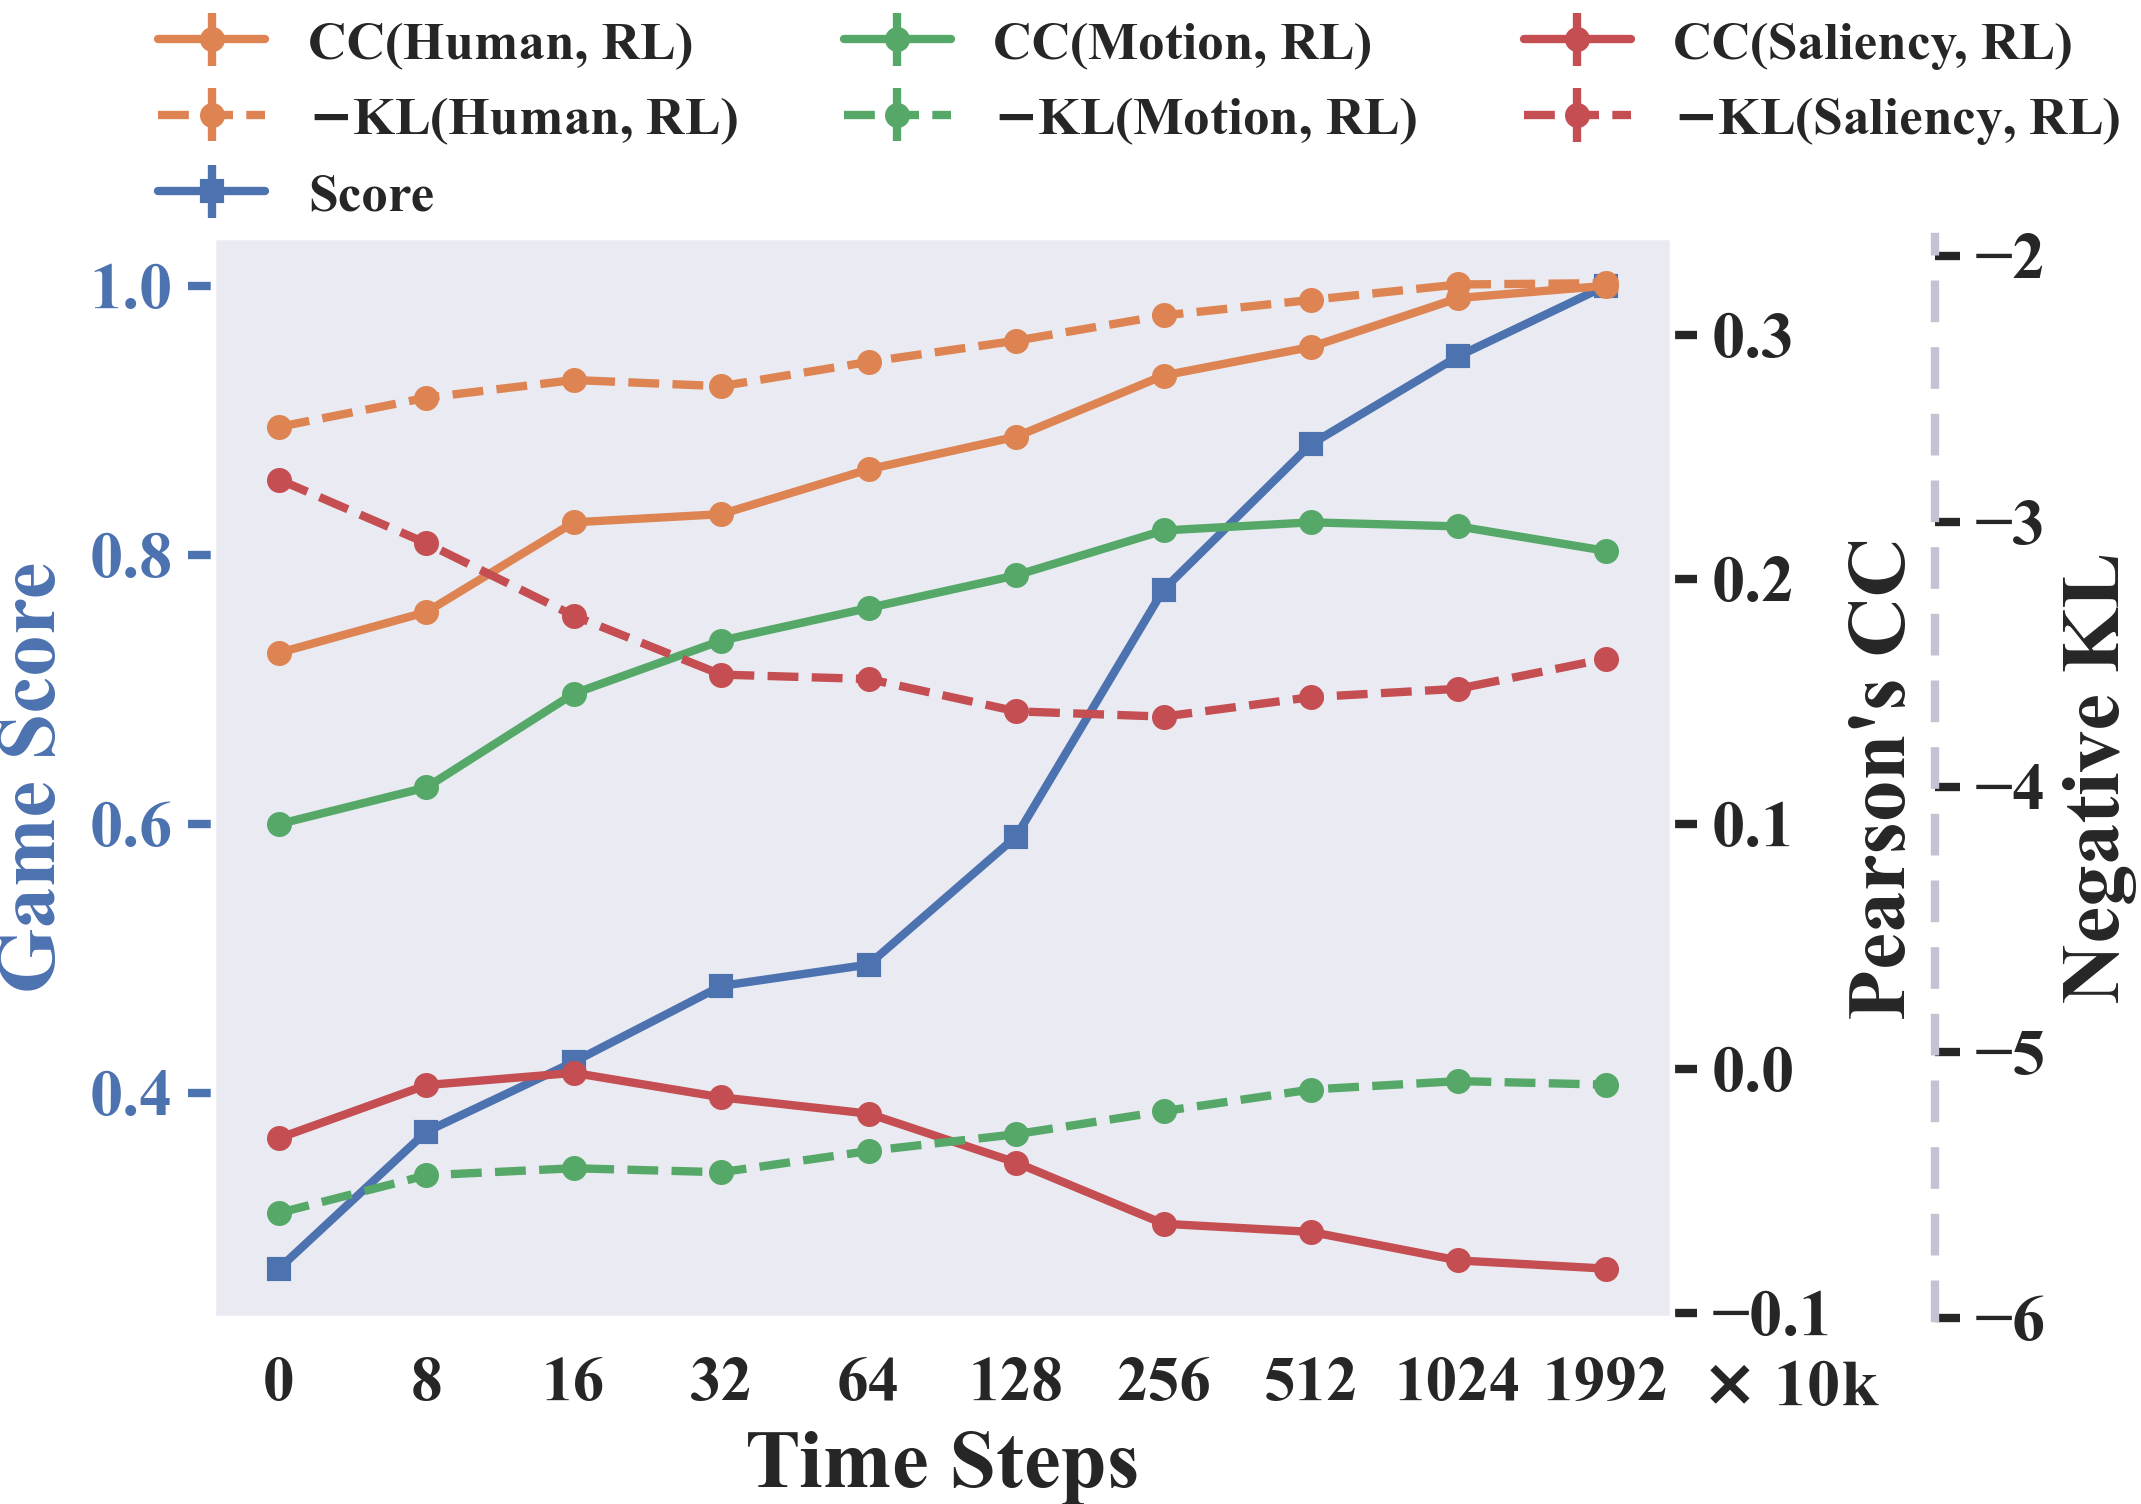
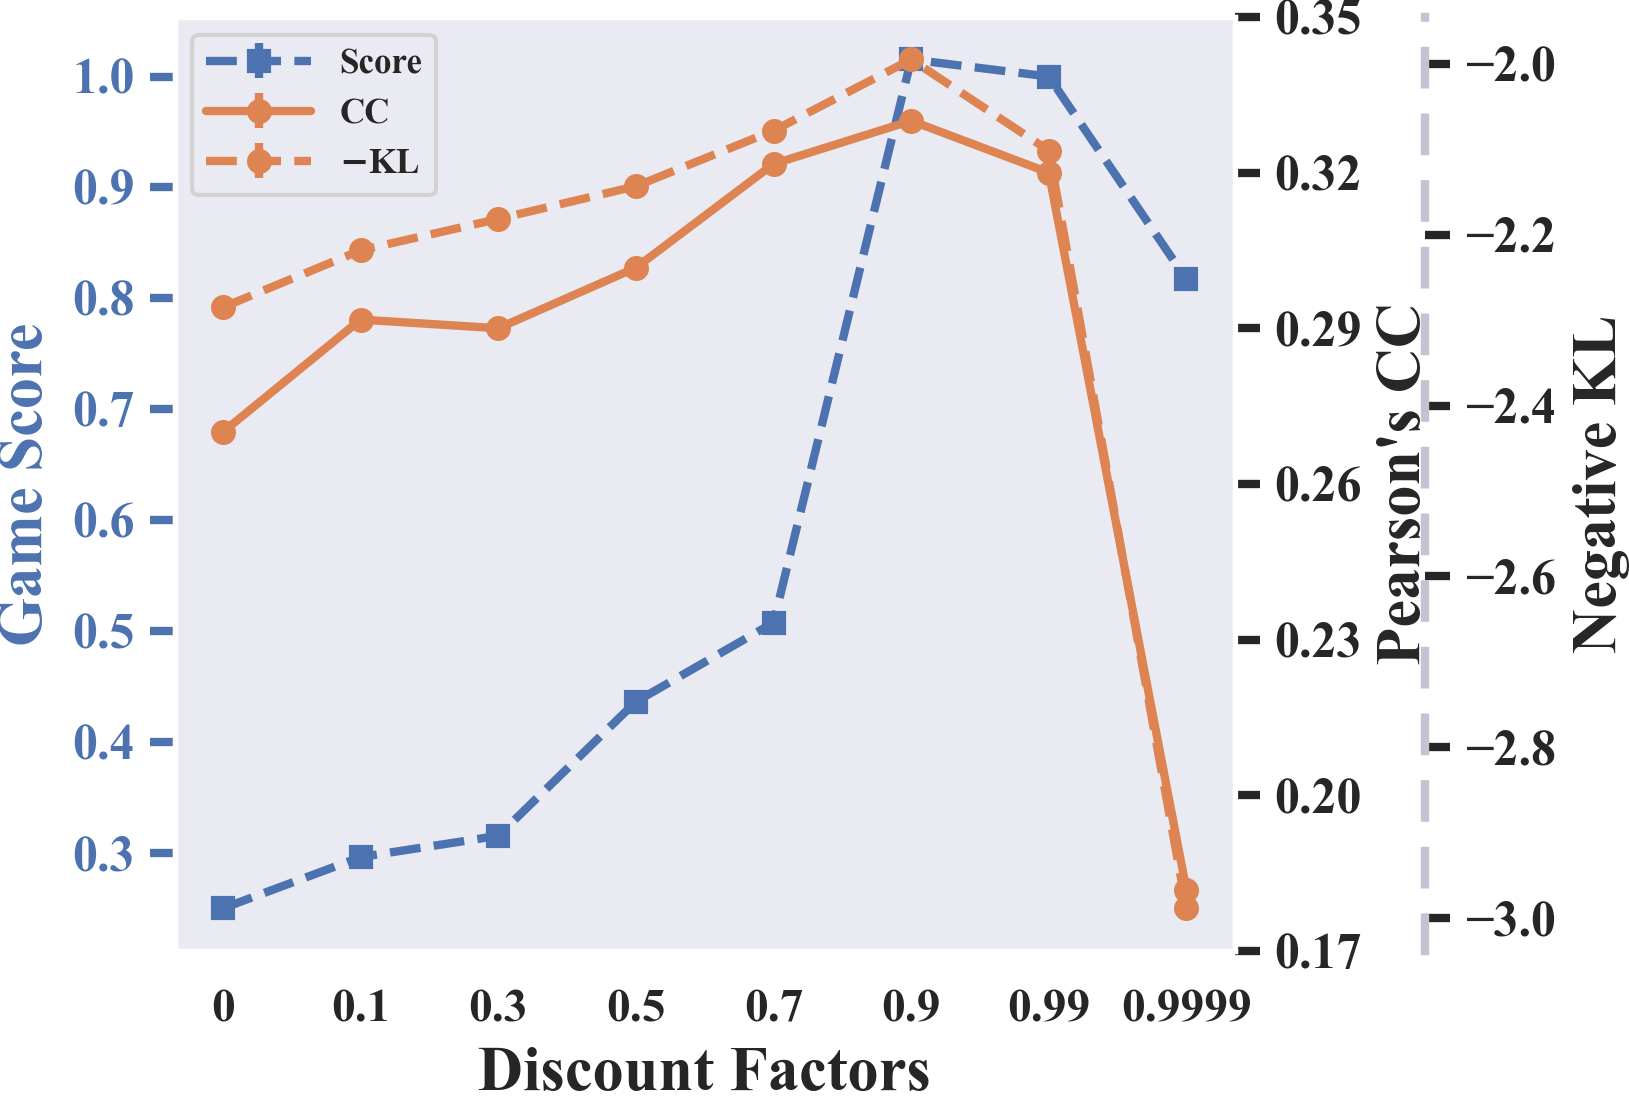
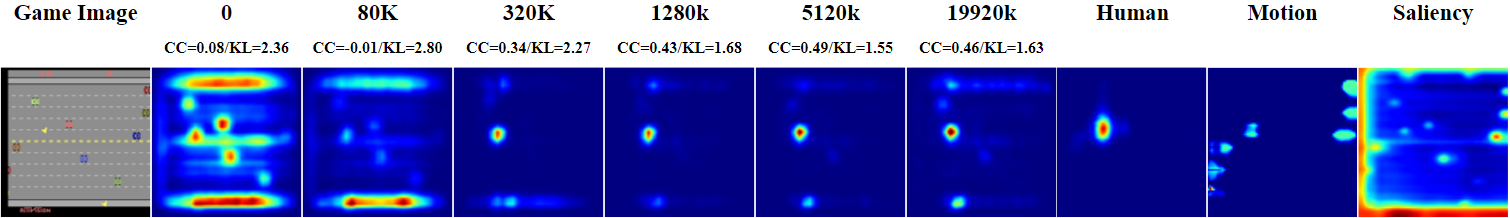
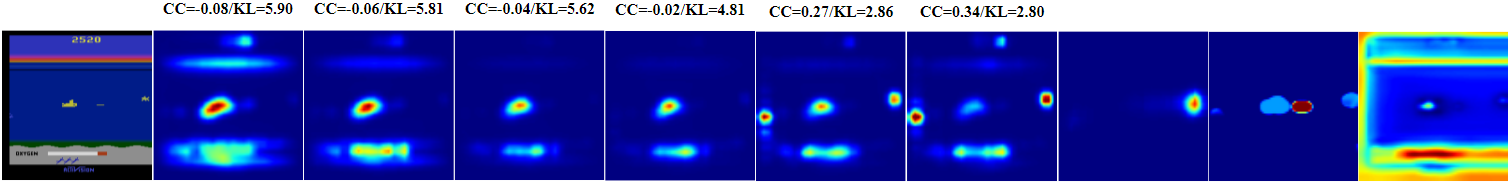
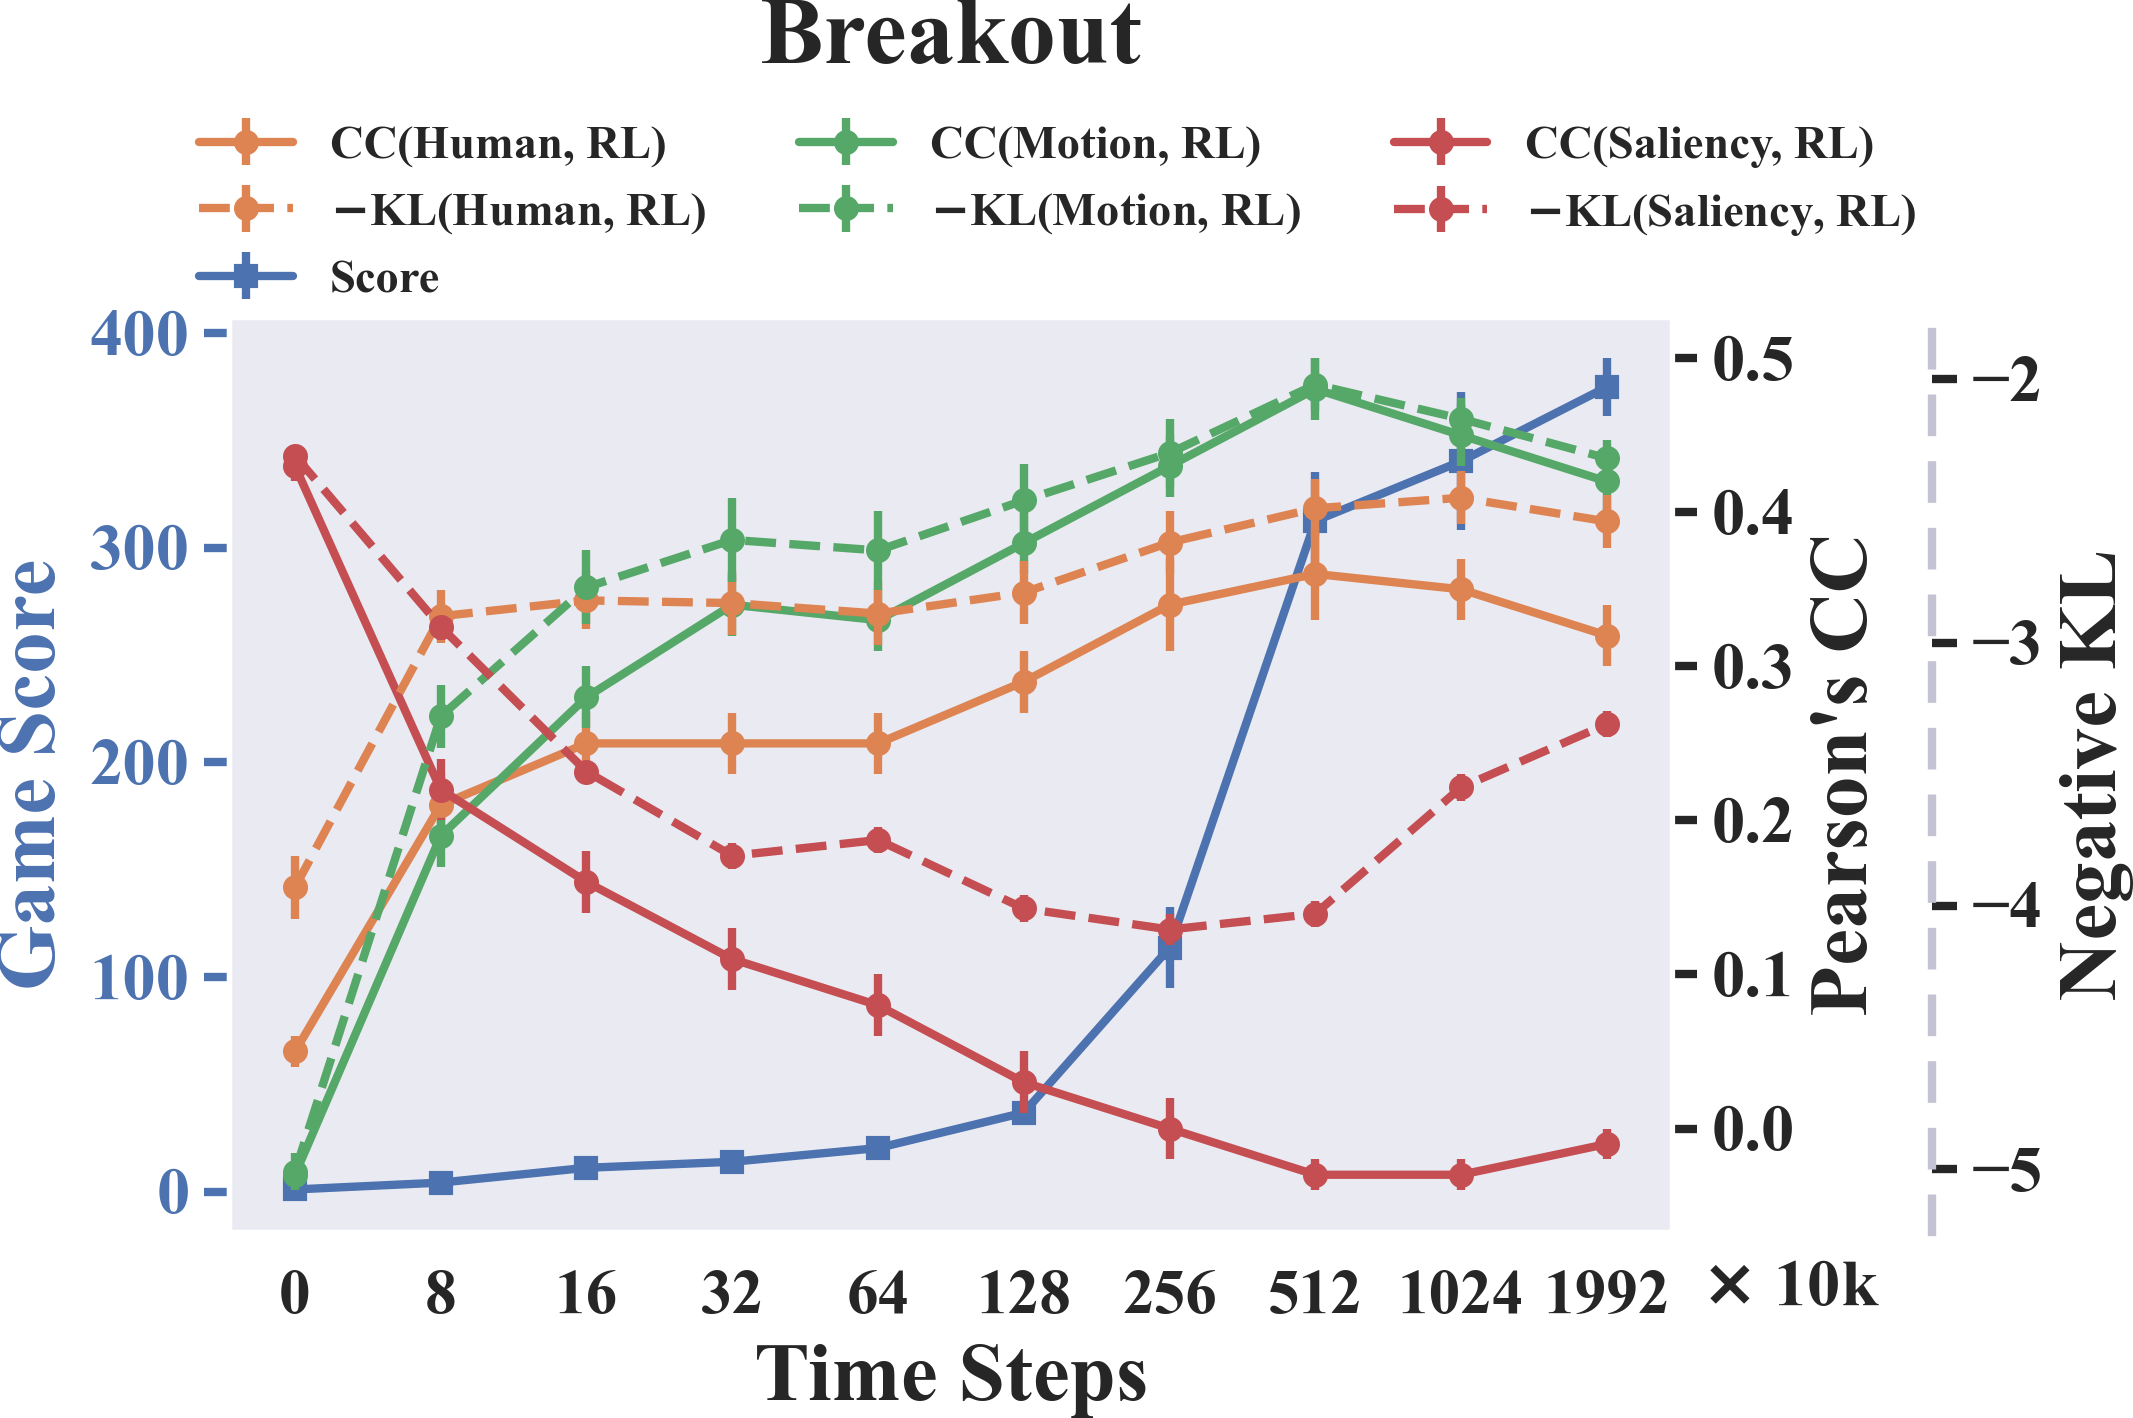
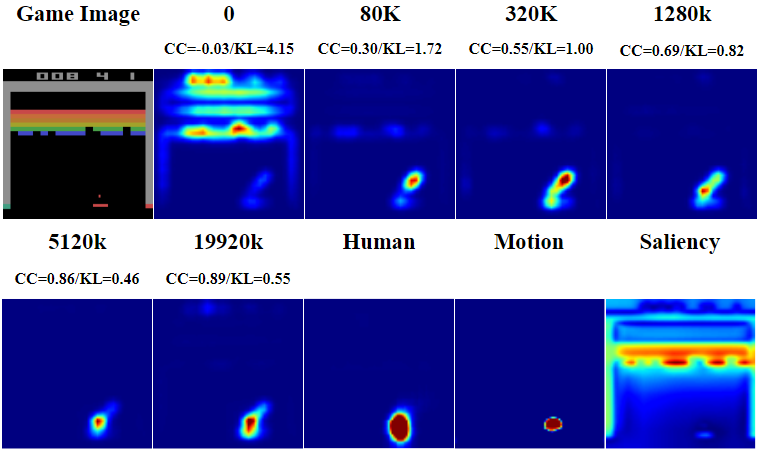
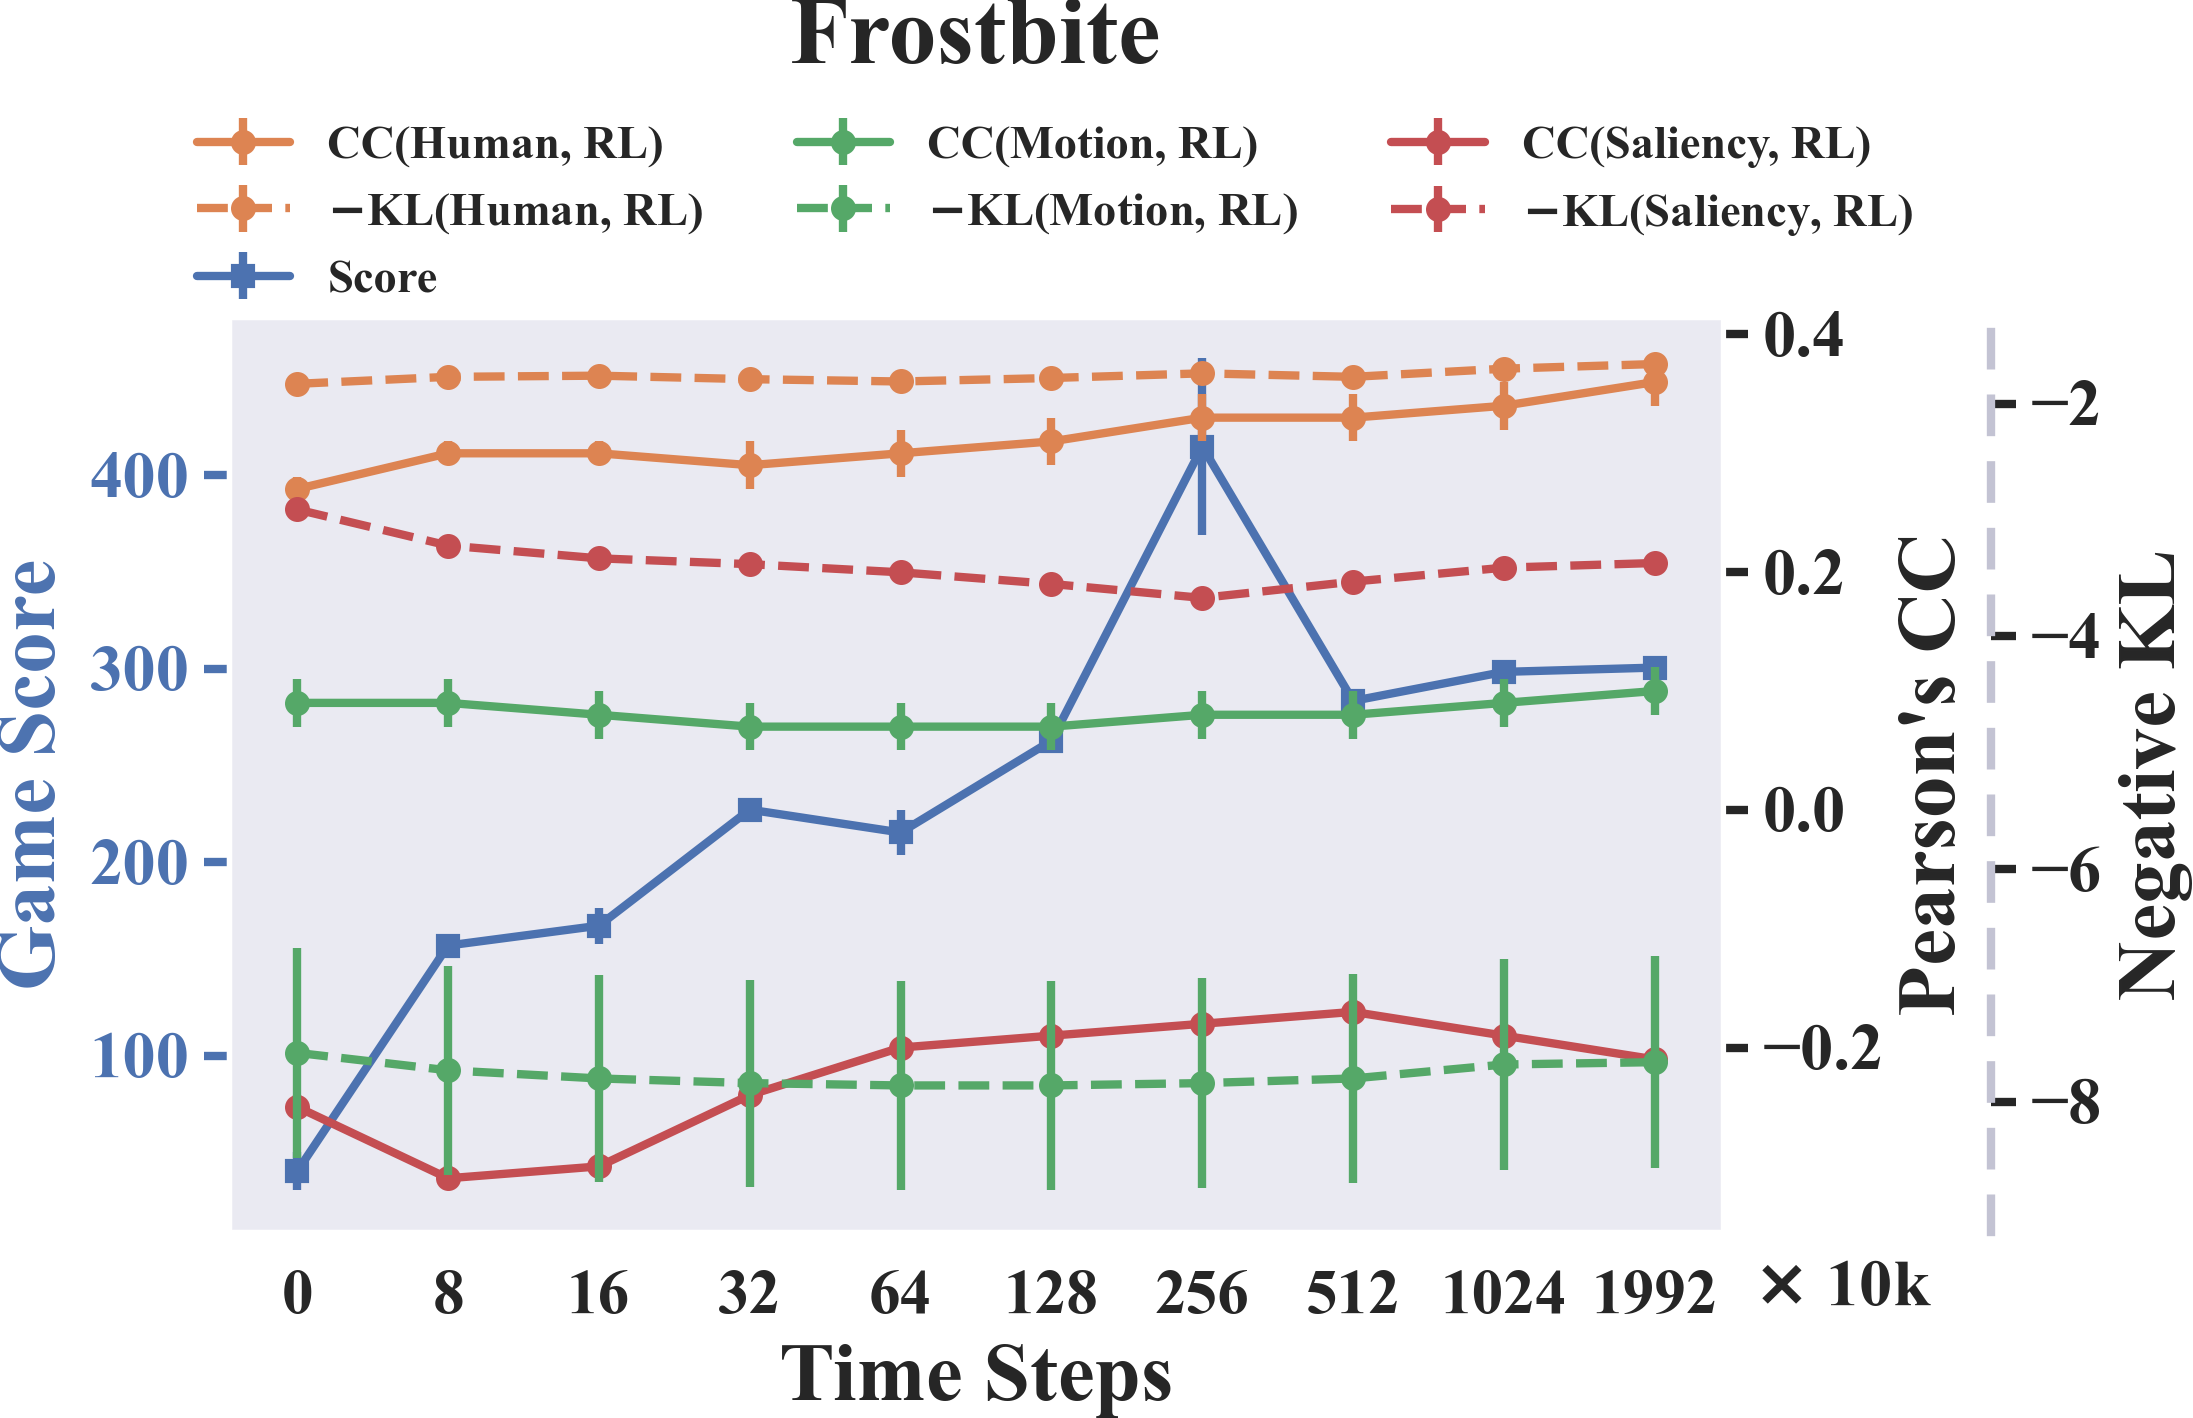
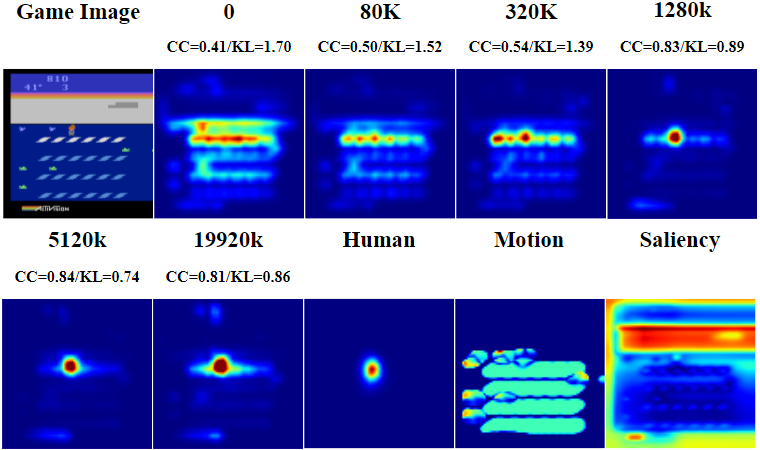
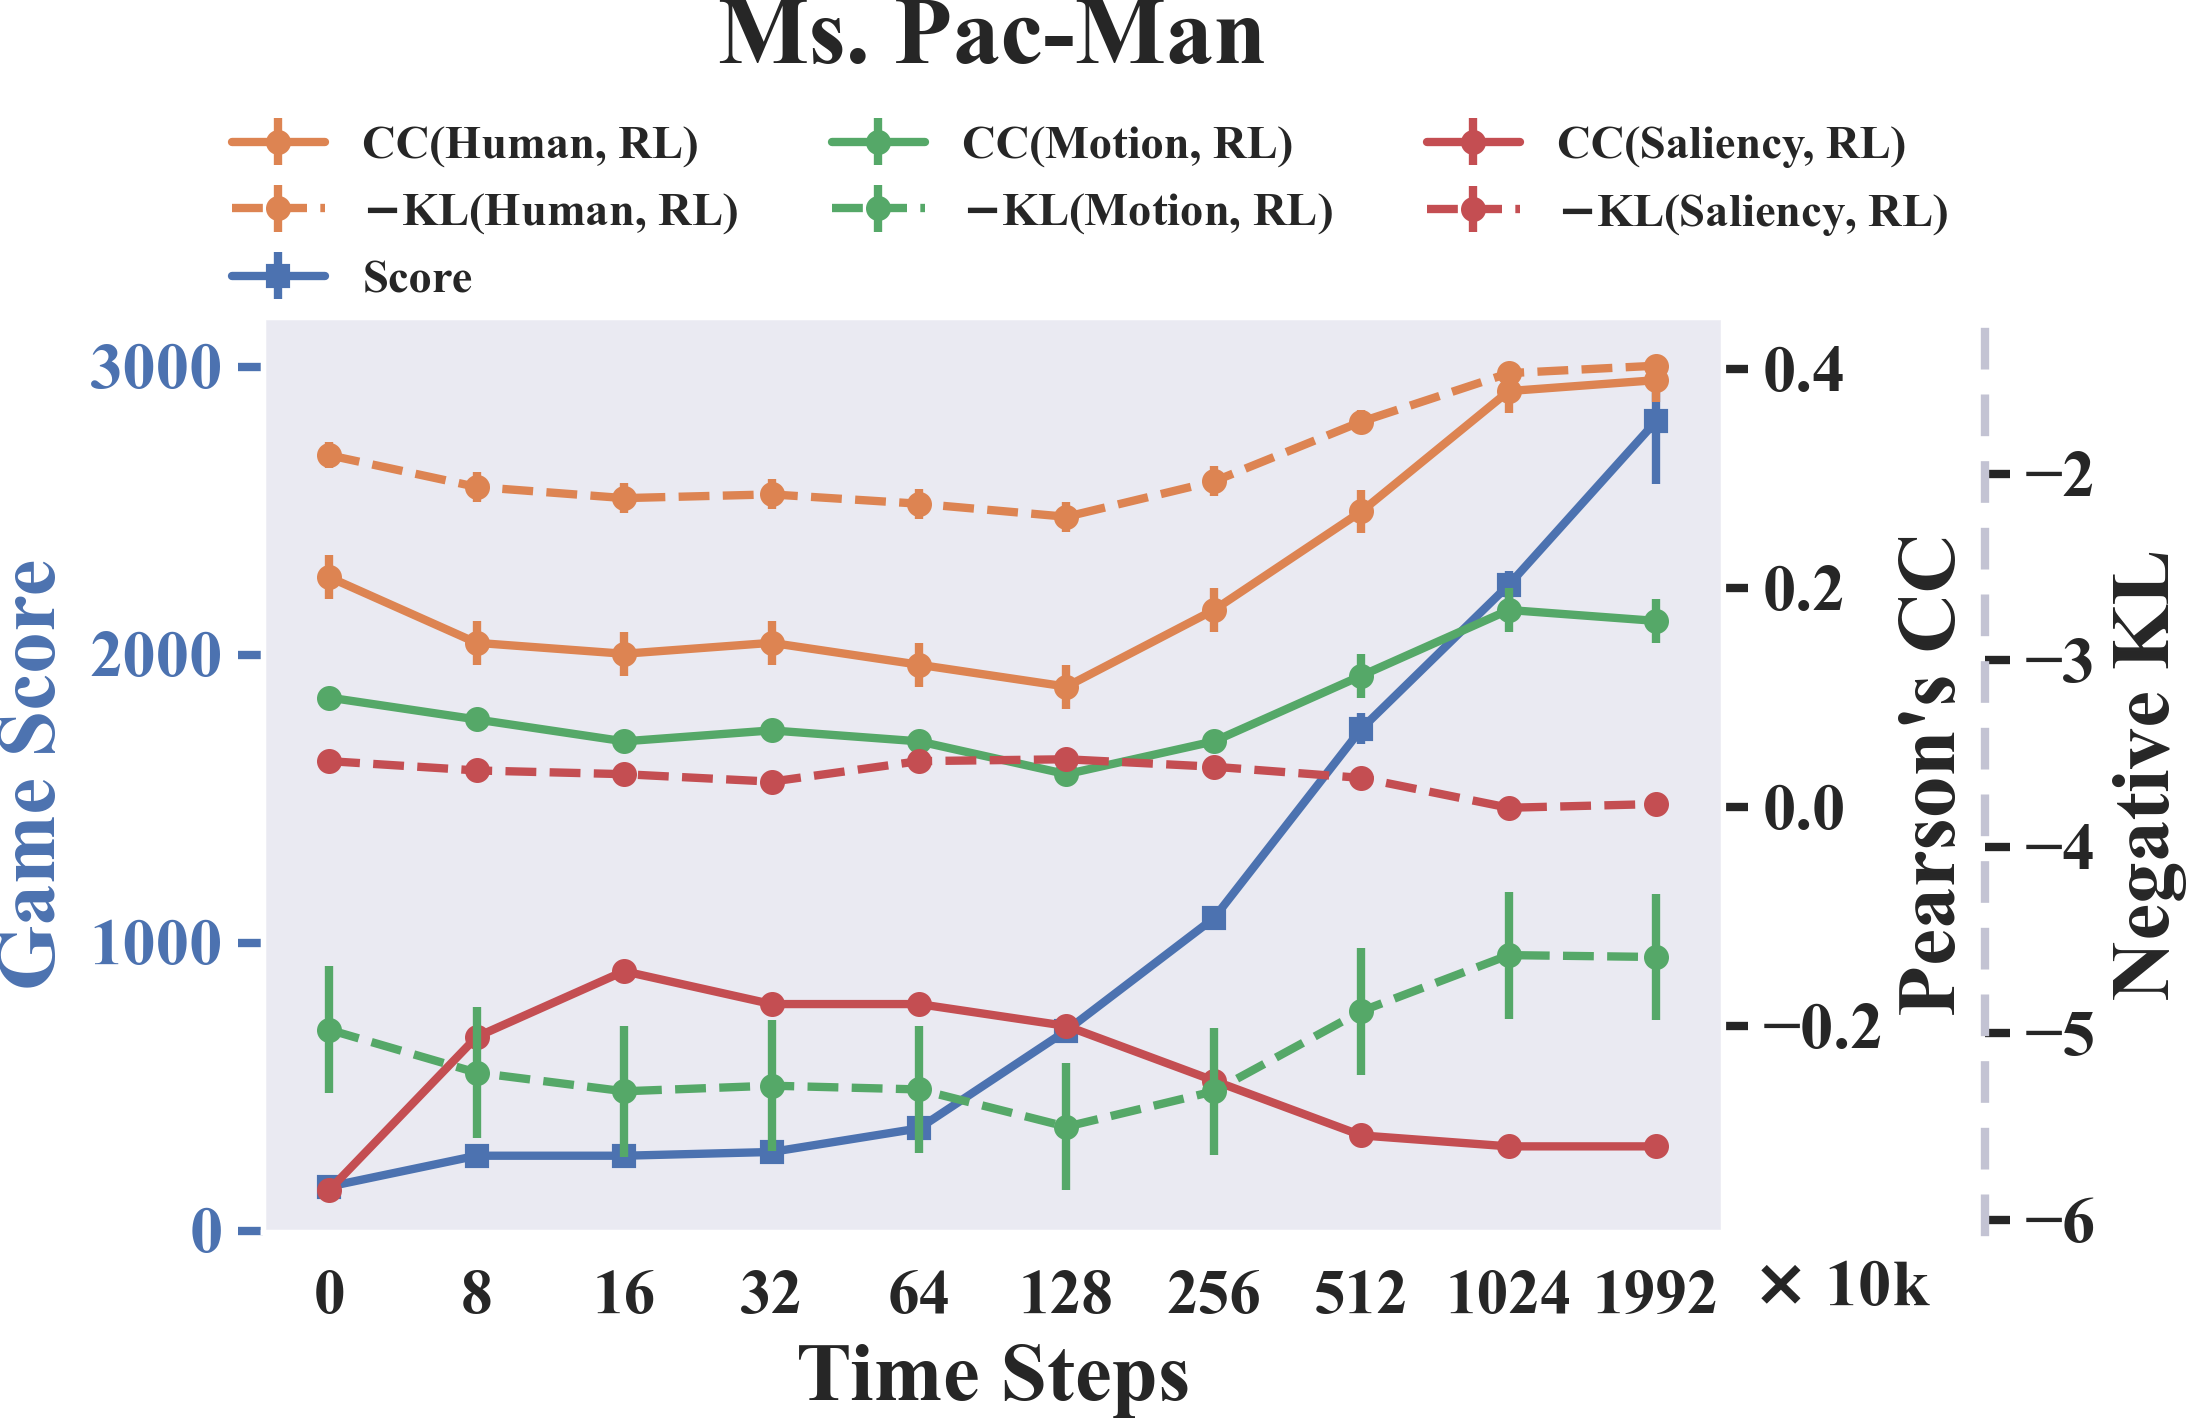
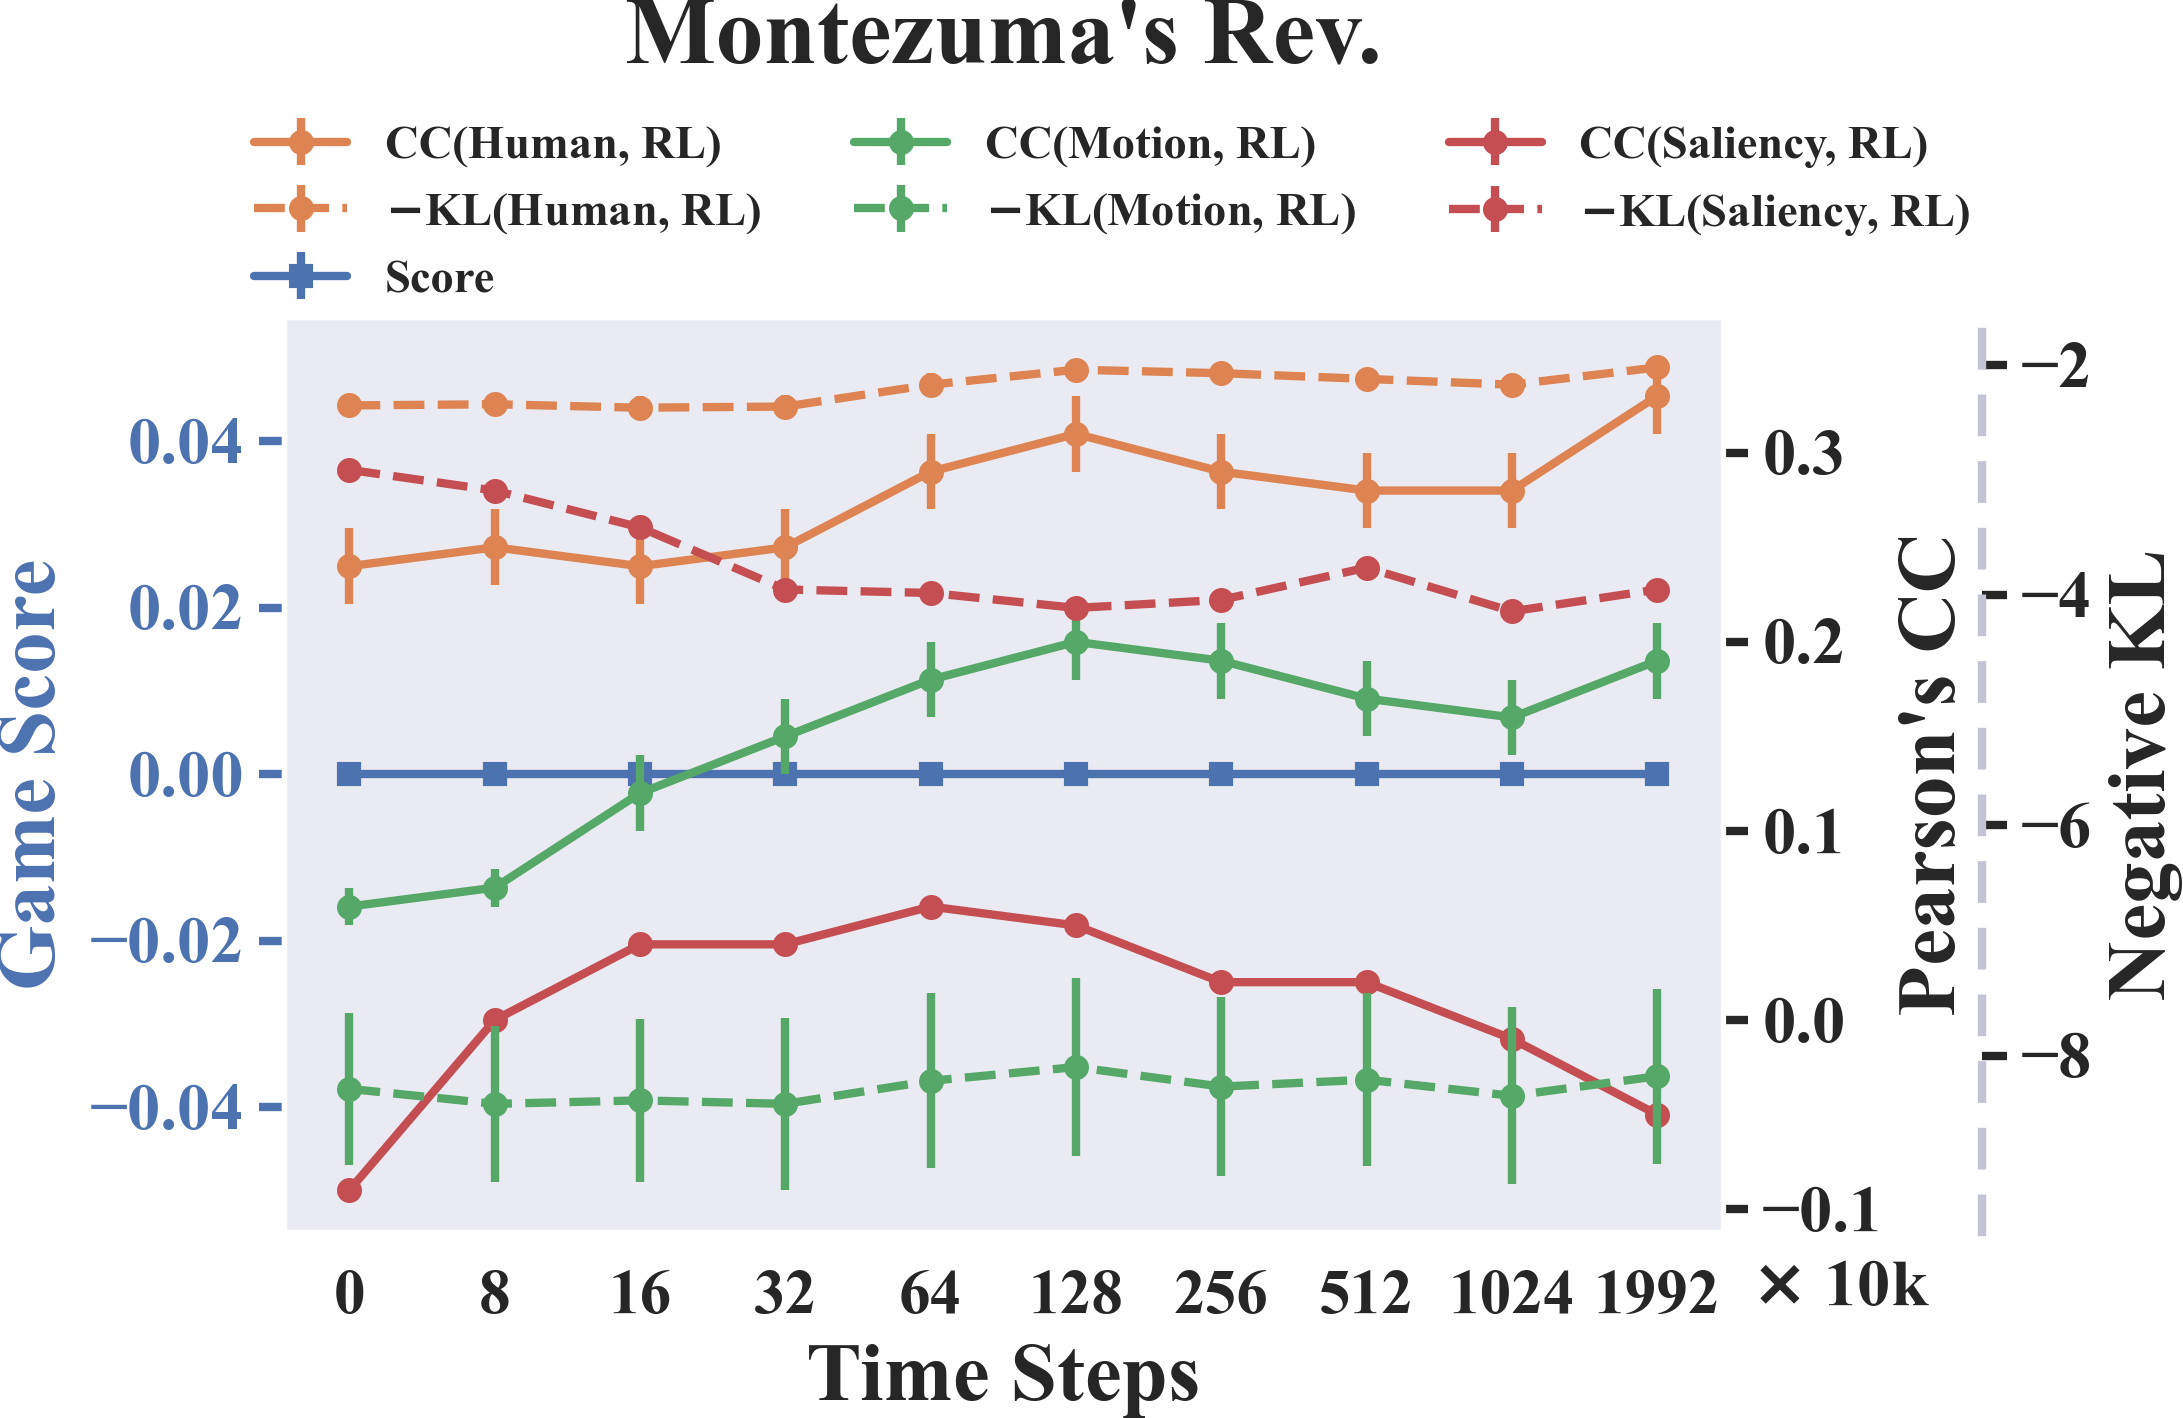
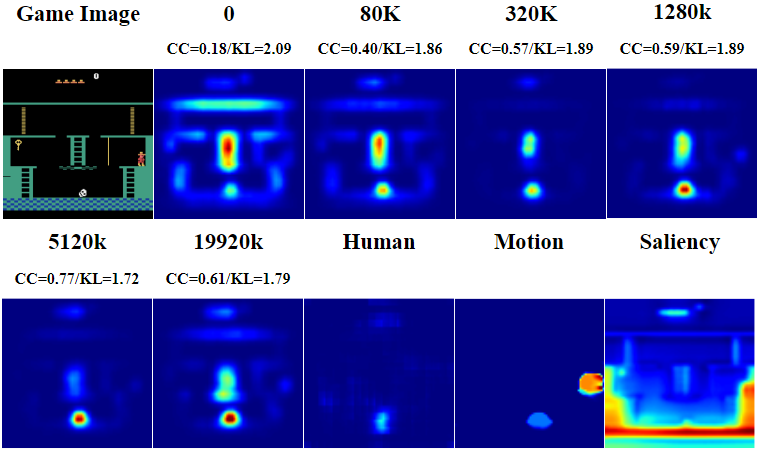
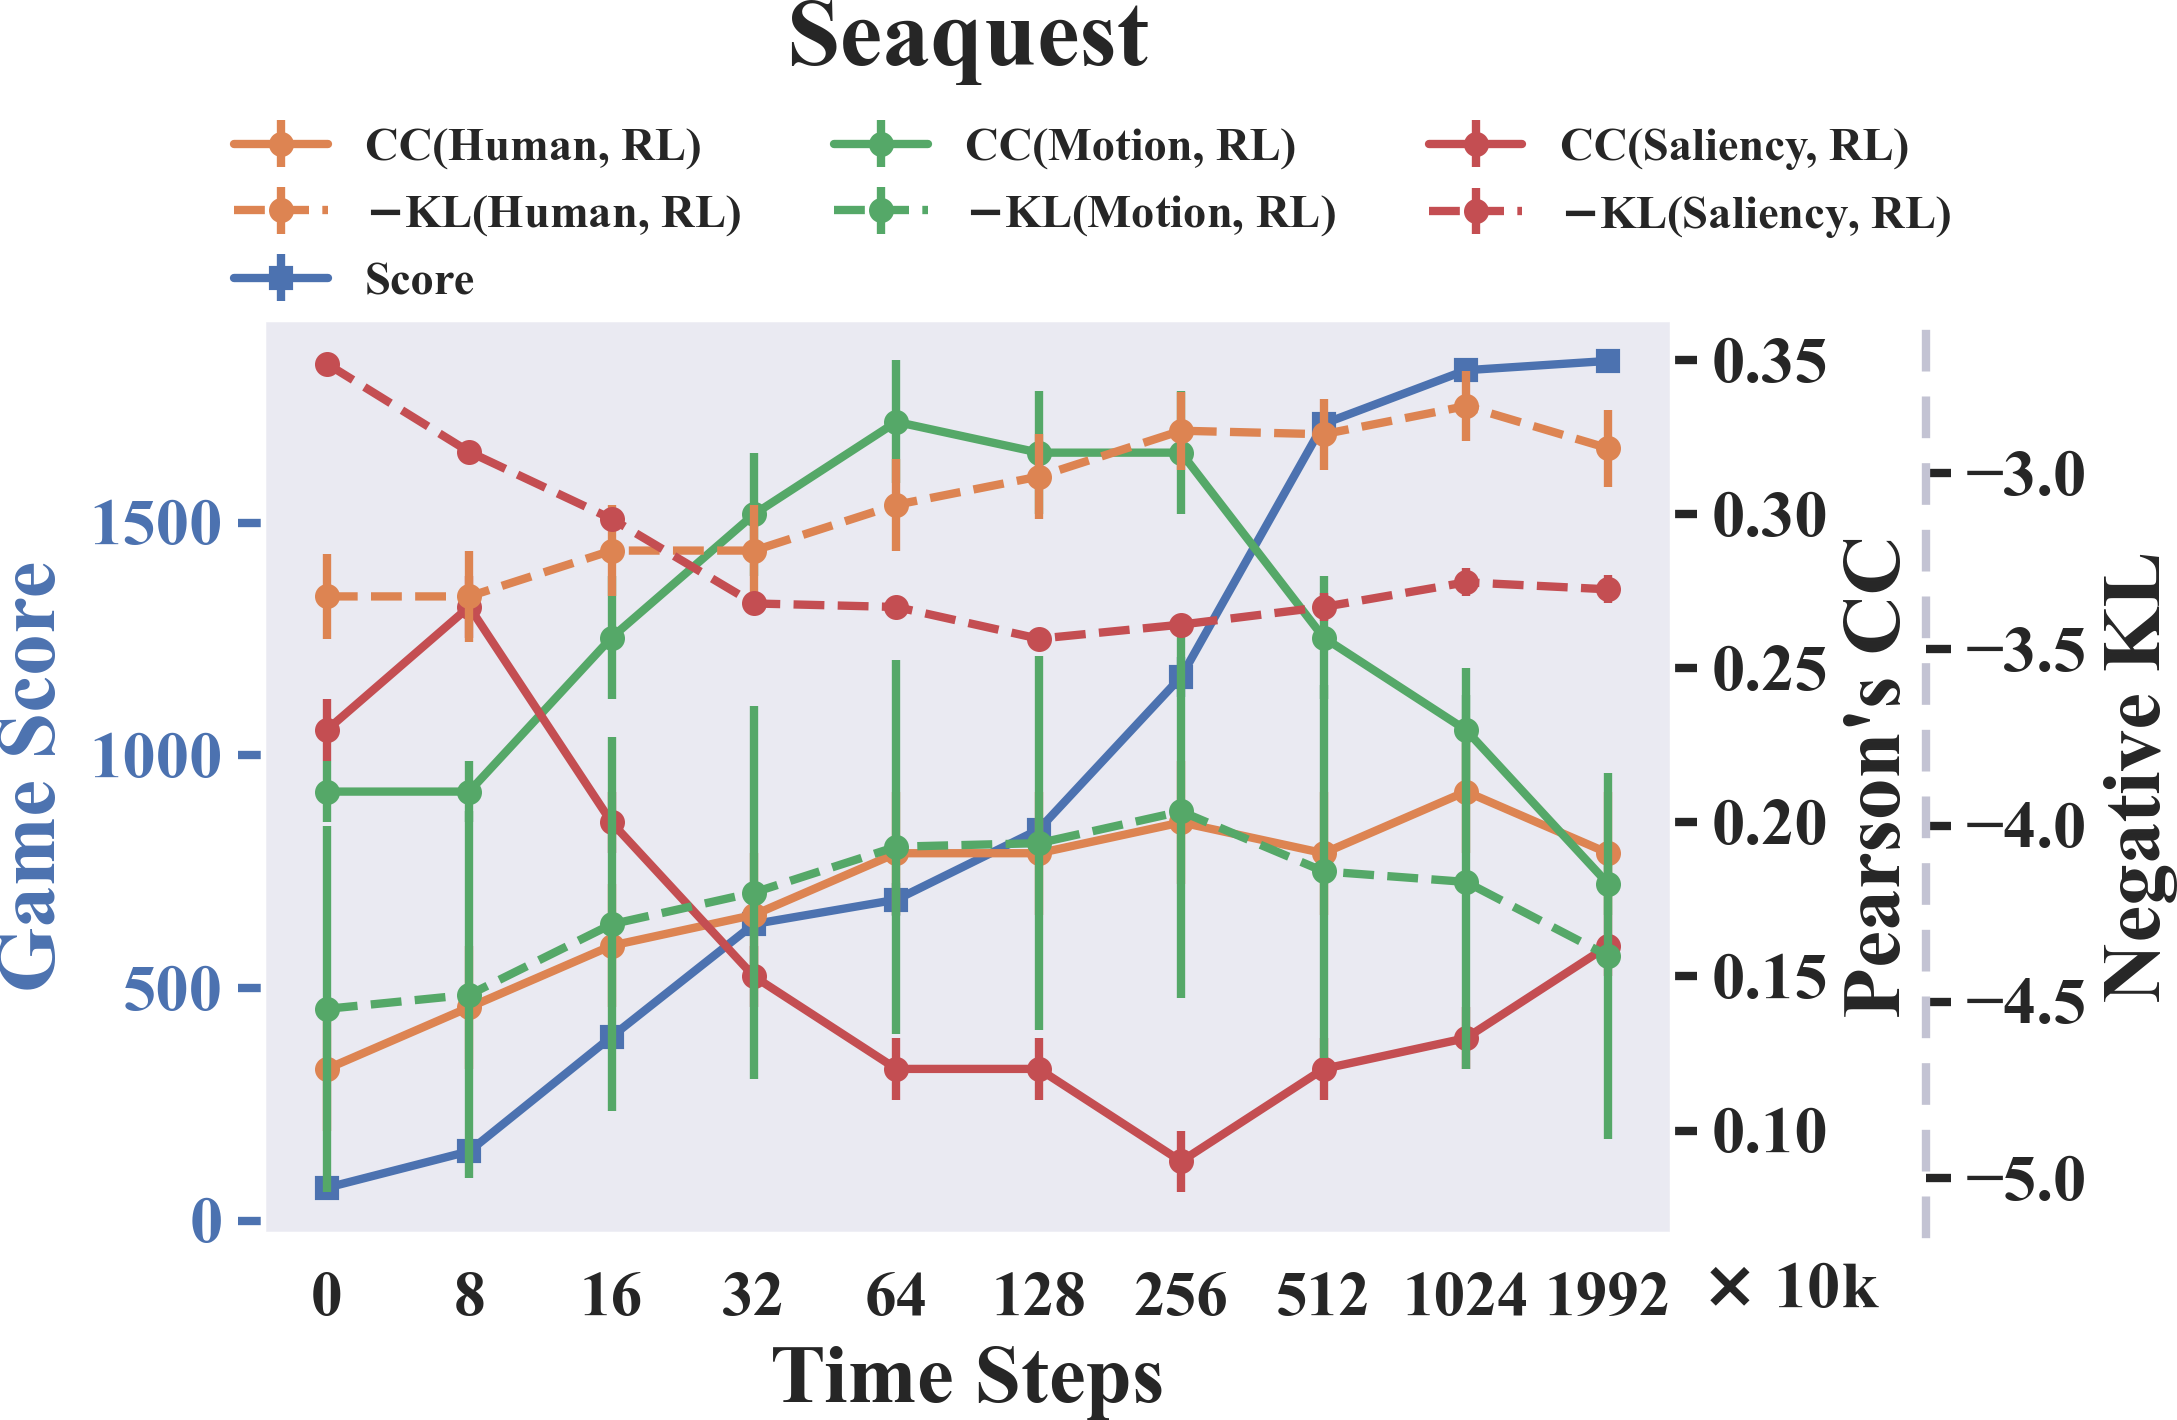
Fig. 1a shows the aggregated results for all games. CC values and (negative) KL values between human and RL increase during learning, indicating that the RL agents’ attention gradually becomes more human-like. We visualize the change of RL attention and human attention in Fig. 2. Networks without any training (time step 0) have saliency maps that are positively correlated with humans (CC). For example, the second column in Fig. 2 shows that these networks are already sensitive to low-level salient visual features without any learning, which is consistent with previous findings [81, 23]. Overall, human and RL saliency maps are more positively correlated after training (CC; CC: ; KL: ), meanwhile RL attention is more similar to human attention than to the control models (higher average CC/-KL values after training across all games).
We also show aggregated game performance in normalized game scores in Fig. 1a. For each game, we normalize the game scores obtained during learning (averaged over 50 episodes) by dividing them by the final scores. We find a strong positive correlation between the human CC/KL values and the game score (average Pearson’s correlation coefficient of ). The correlations for all games are statistically significant (, Appendix 2), indicating that small changes in similarity with human attention are reliable predictors of performance change. For comparison, the correlation values between CC/KL and game score for motion baseline are , for saliency baseline are .
This result sheds light on an important research topic: bottom-up versus top-down attention. The two sides debate how much human or machine attention is driven by bottom-up image features captured by the saliency model [33], and how much it is driven by top-down task signals such as reward [62, 8]. Our result suggests that learning is a key factor in this debate. In the early stages, attention is more driven by image features, indicated by the higher similarity between RL attention and saliency baseline. Then top-down reward signals shape the attention during learning by making reward-associated objects more salient and irrelevant objects less salient, as shown in Fig. 2.
4.2 RL versus human attention: Discount factors
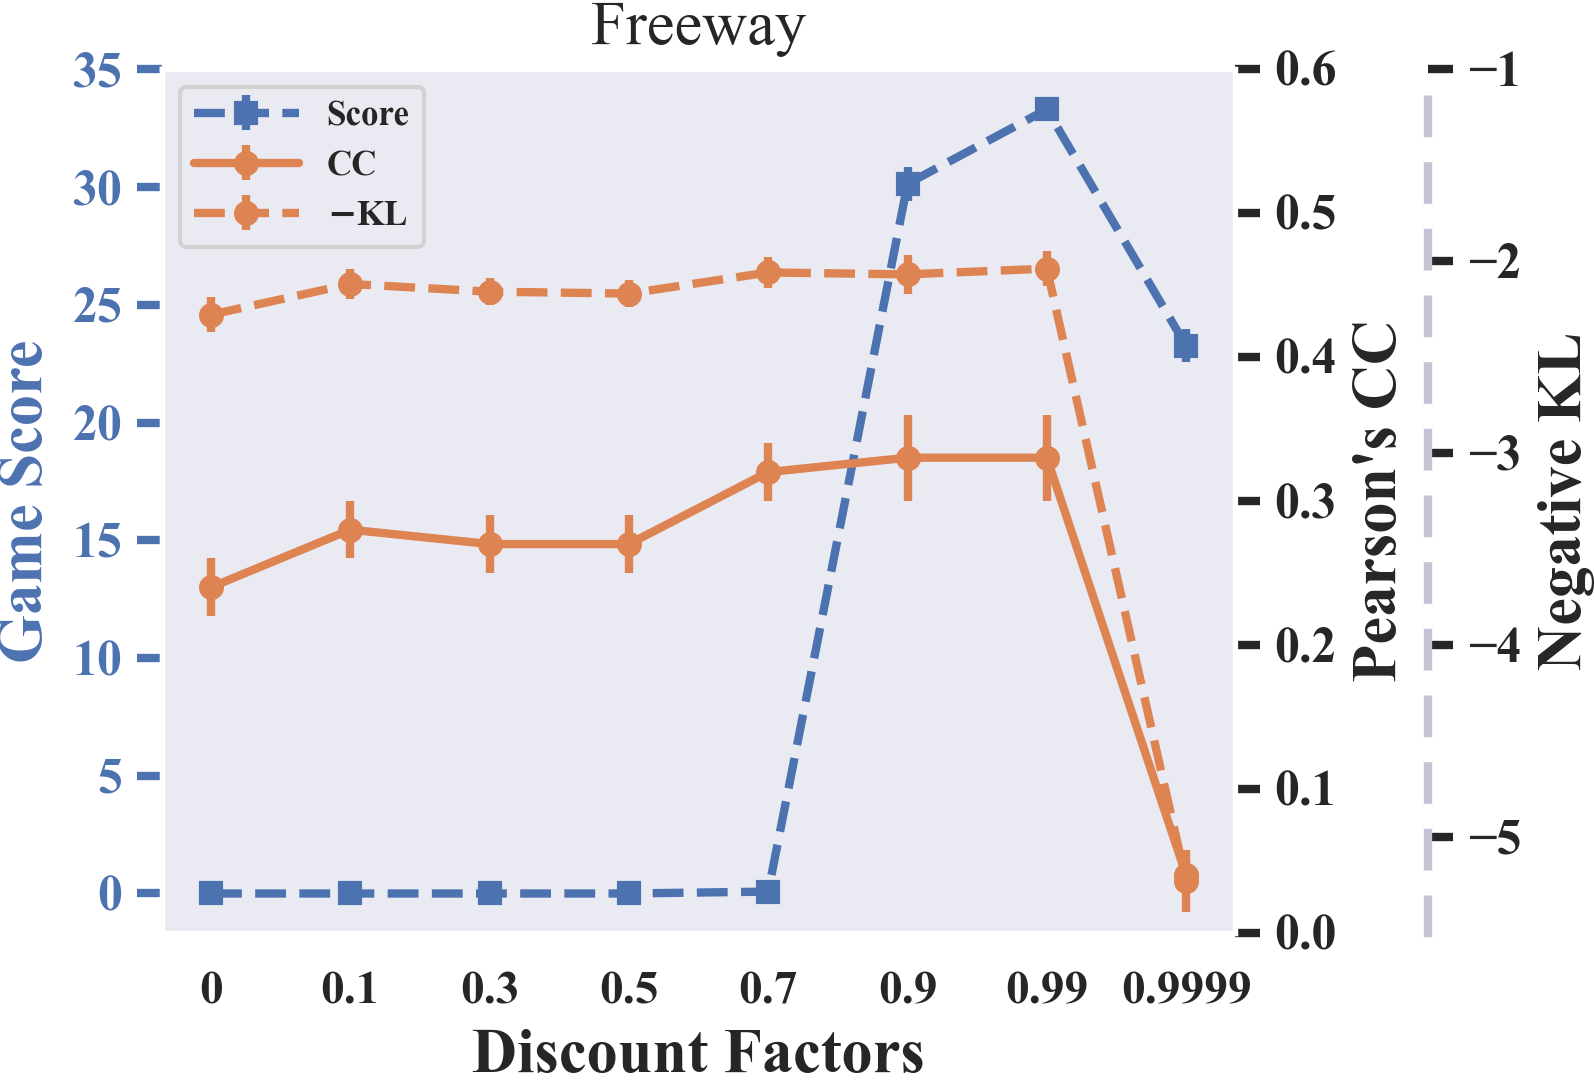
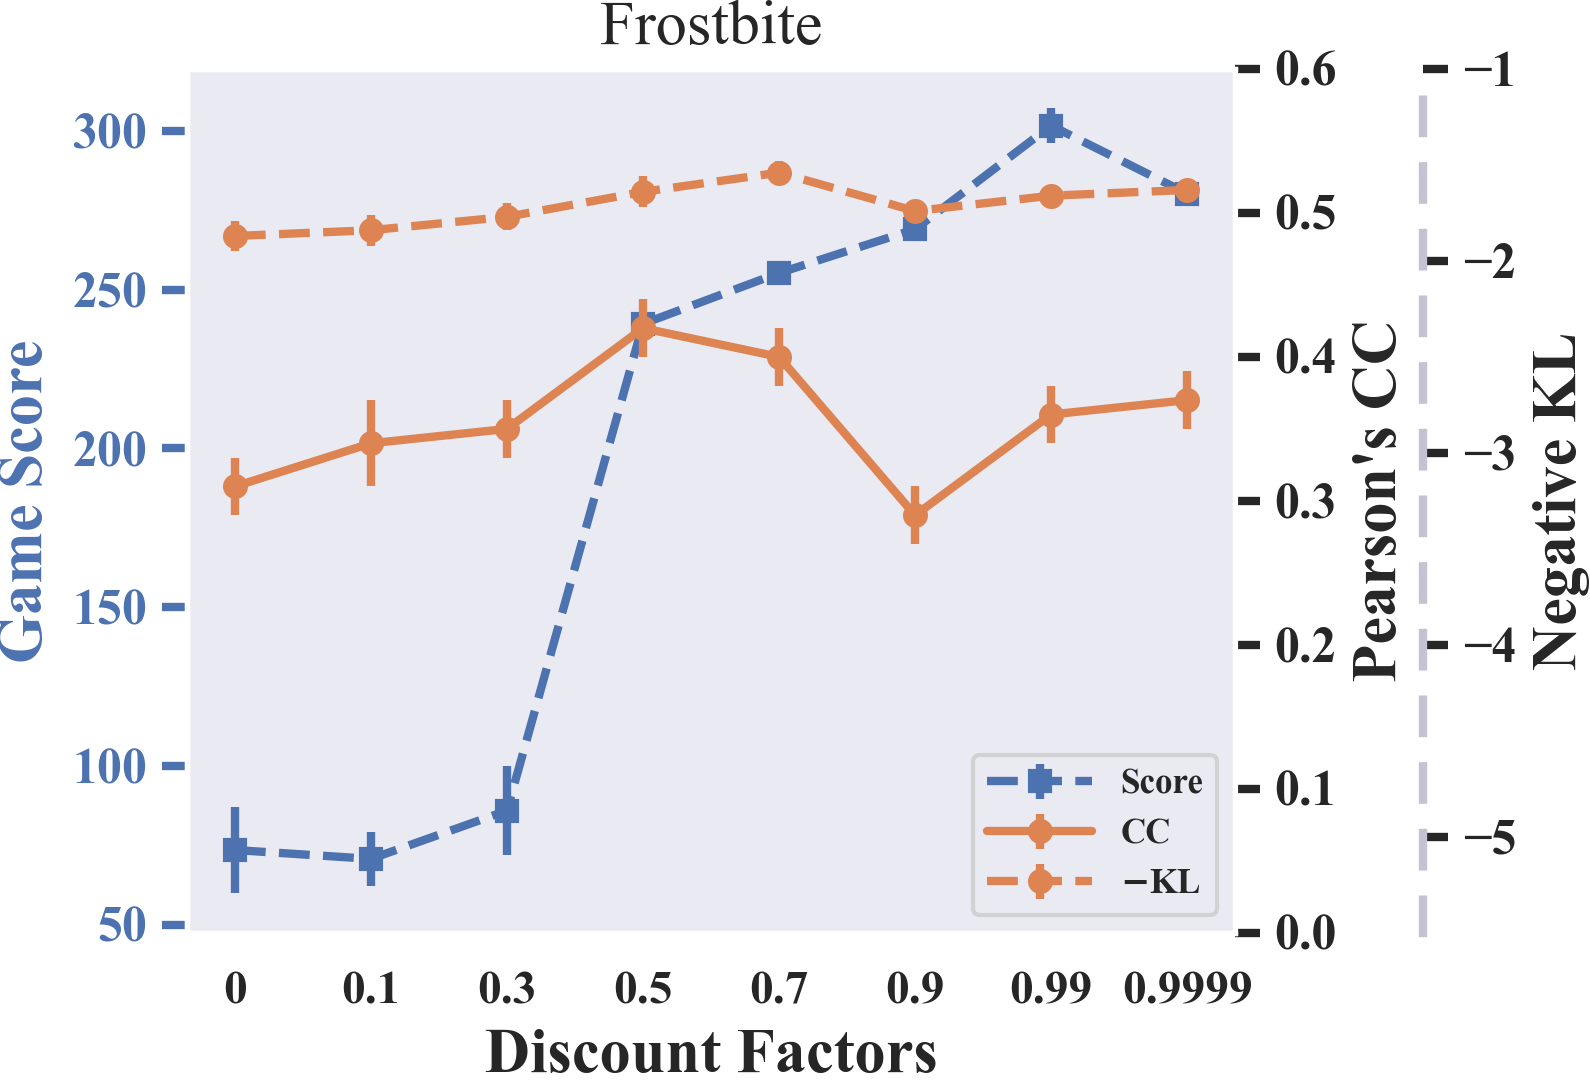
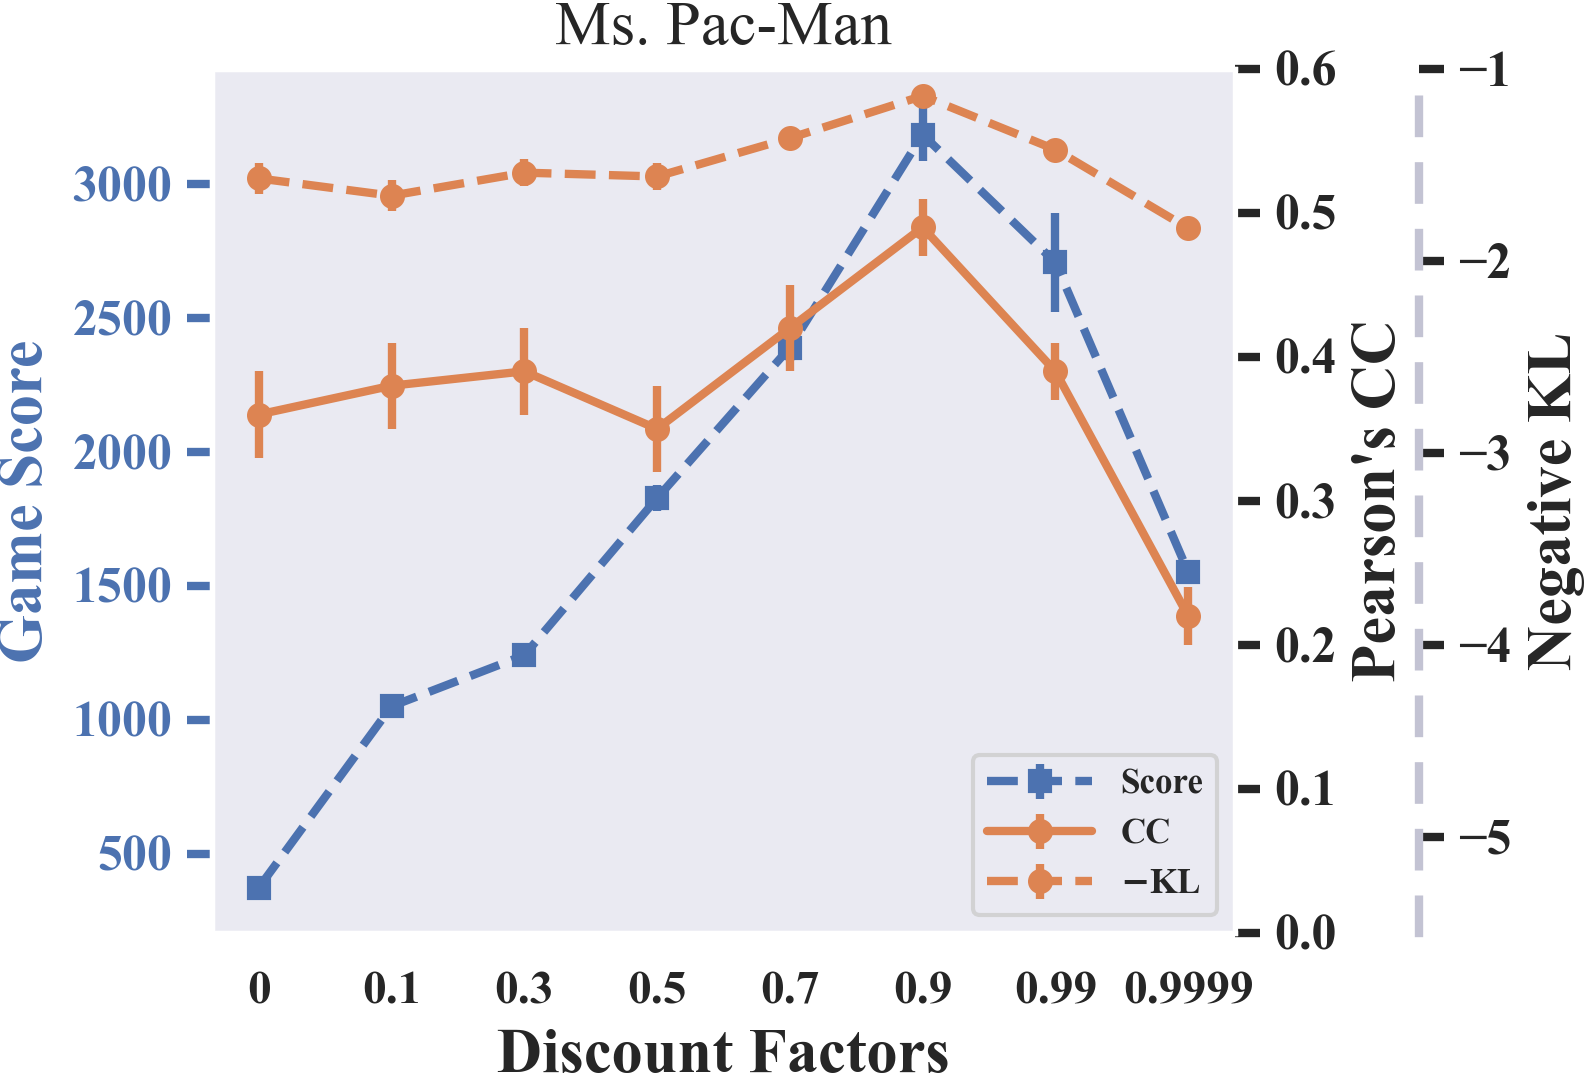
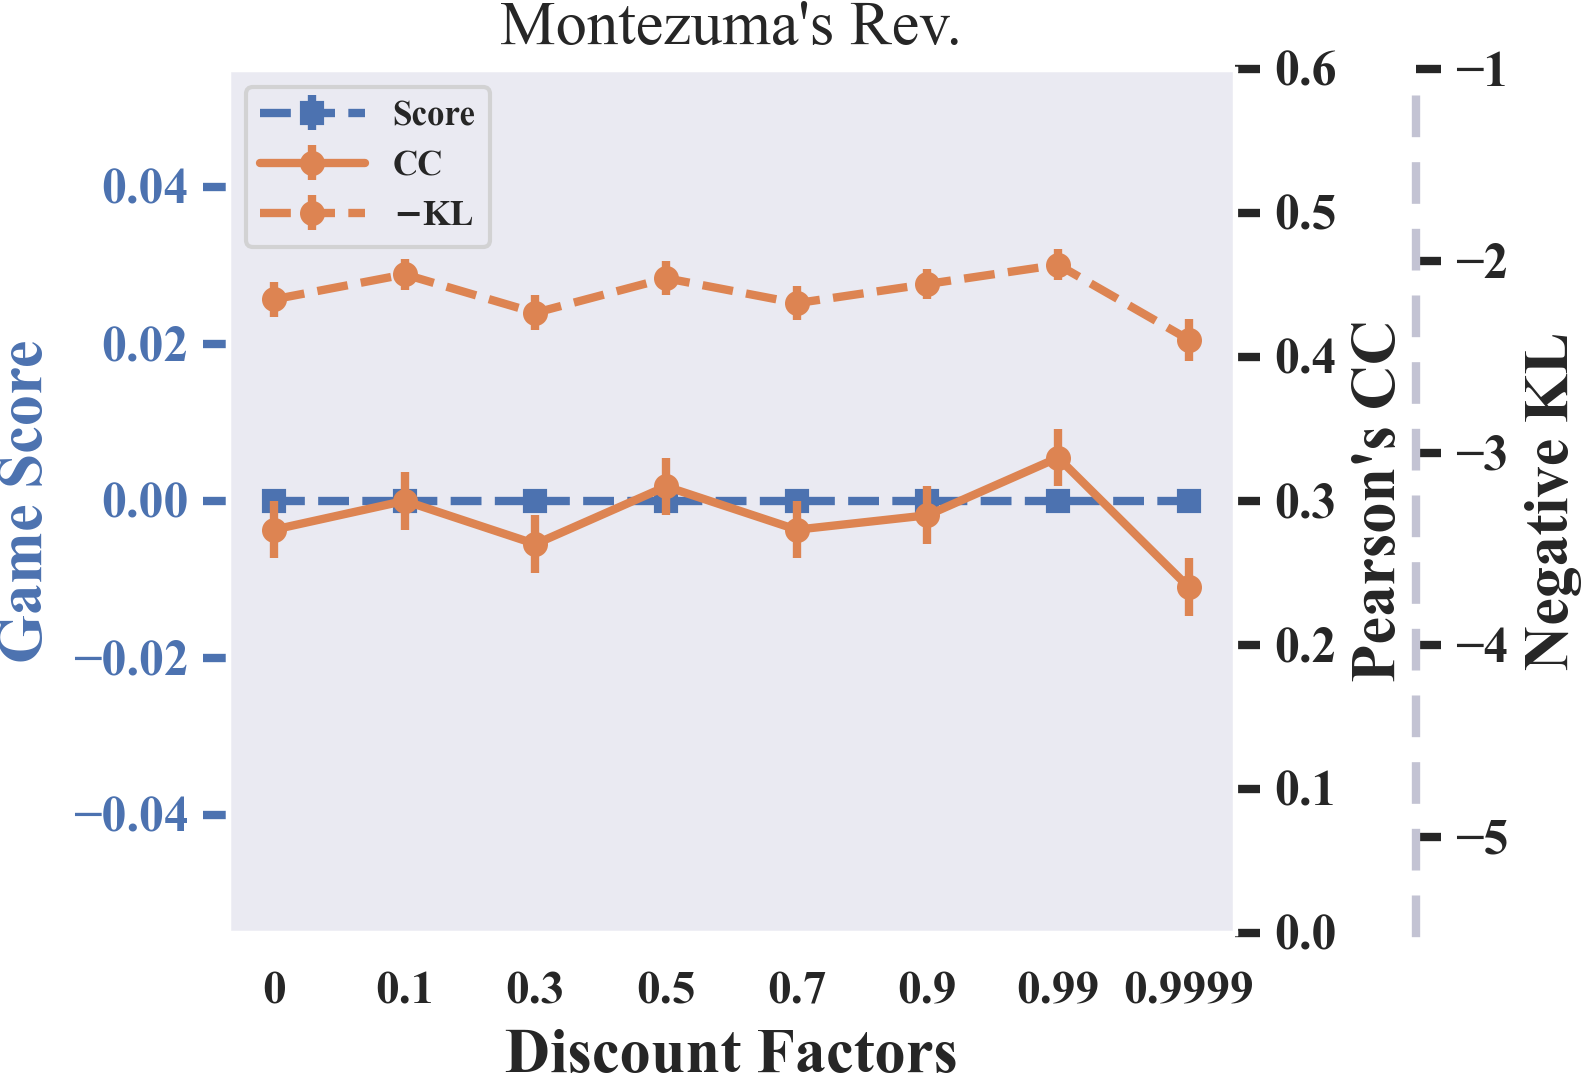
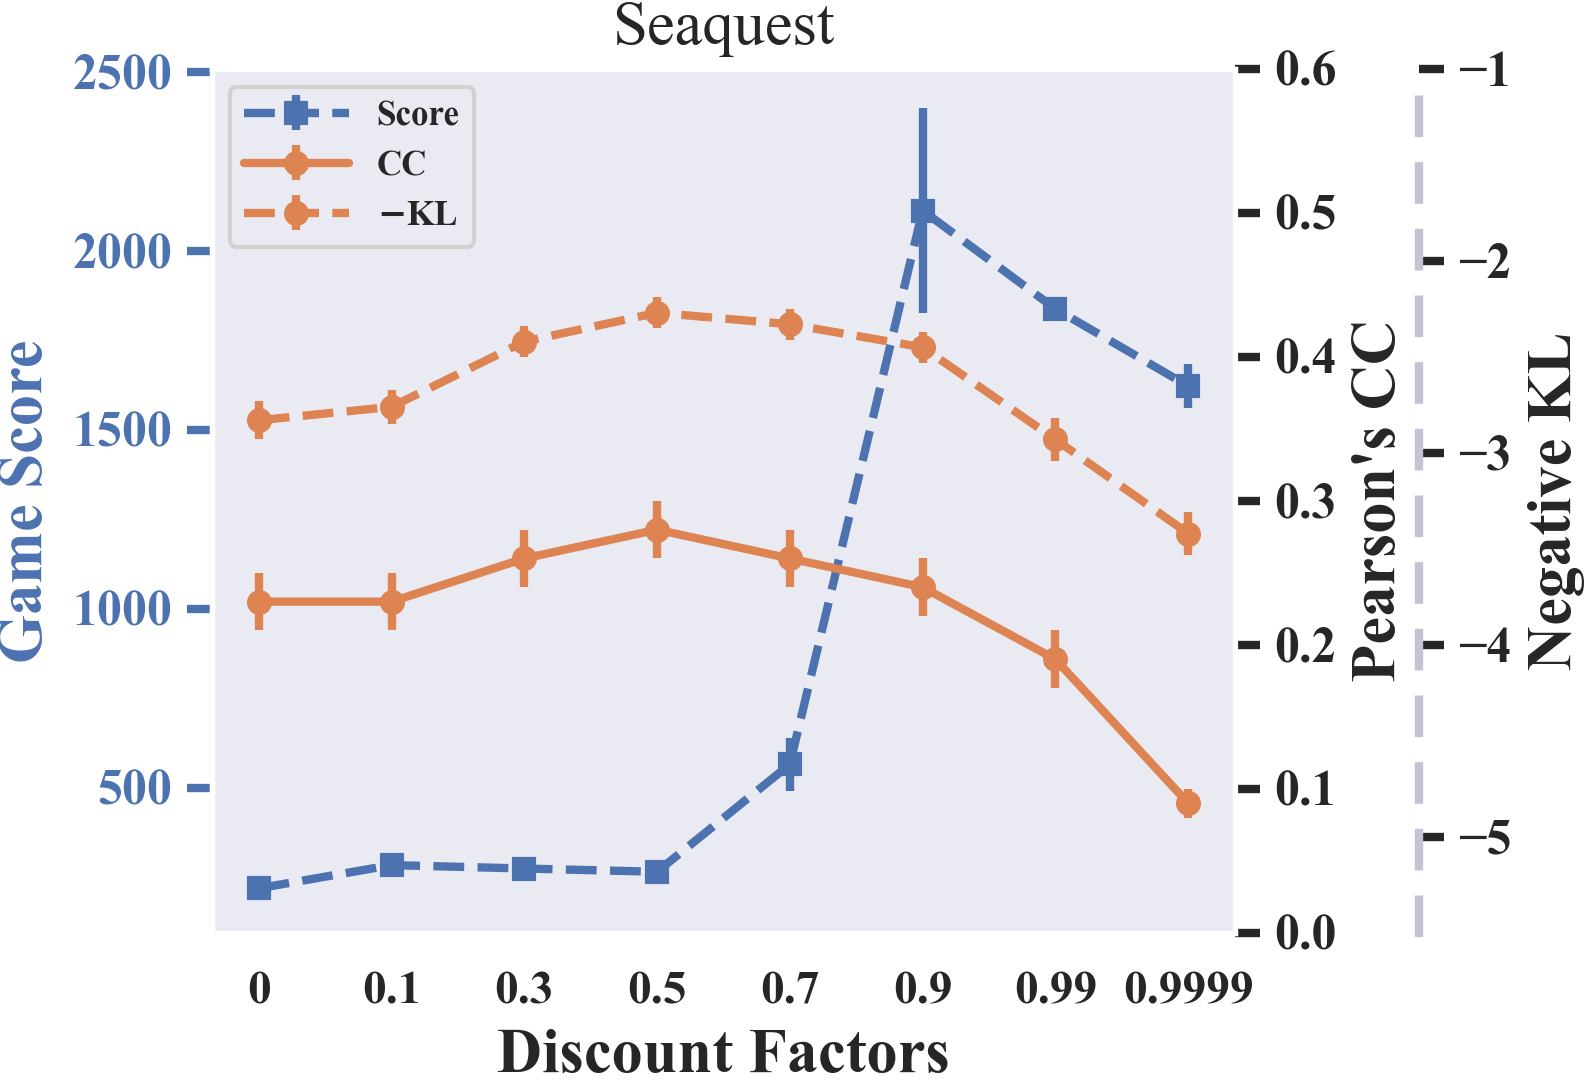
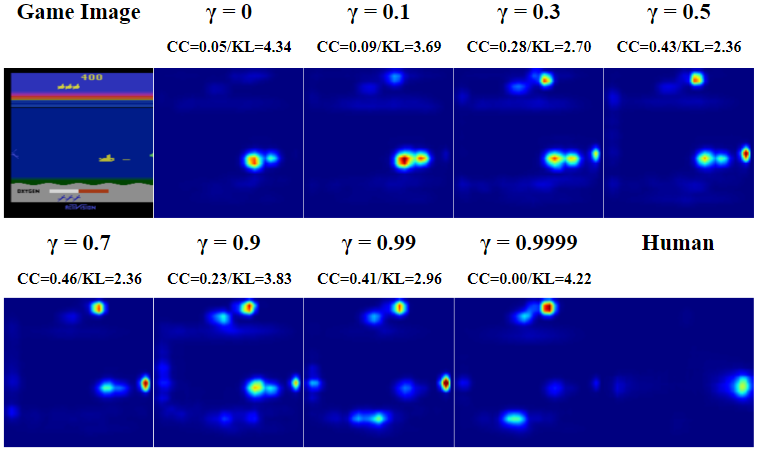
We then analyze how hyperparameters of the PPO algorithm affect the attention of the trained agents. We have seen that reward shapes attention during training, therefore a reasonable hypothesis is that varying reward-related parameters will likely affect attention. One of the parameters we can vary in these games is the discount factor , which determines how much the RL agent weighs future reward over immediate reward. The default is for all games [30]. We train PPO agents with and generate saliency maps on the standard image set. For each value, we normalize the game score by dividing it by the score obtained by the agent.
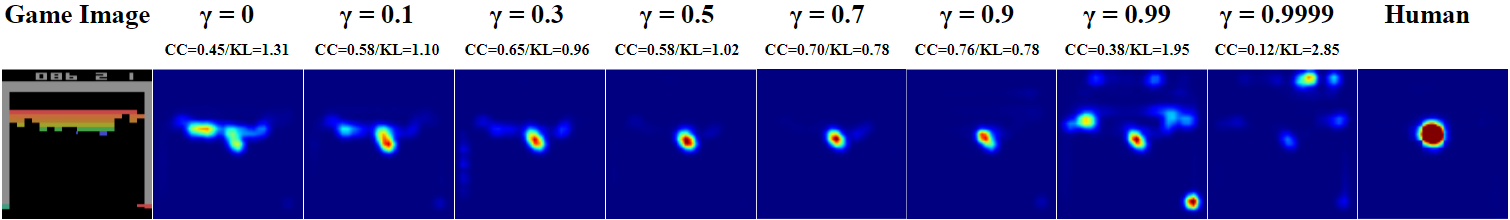
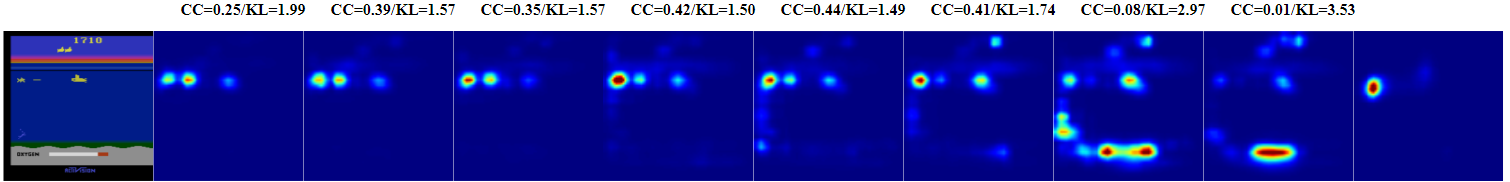
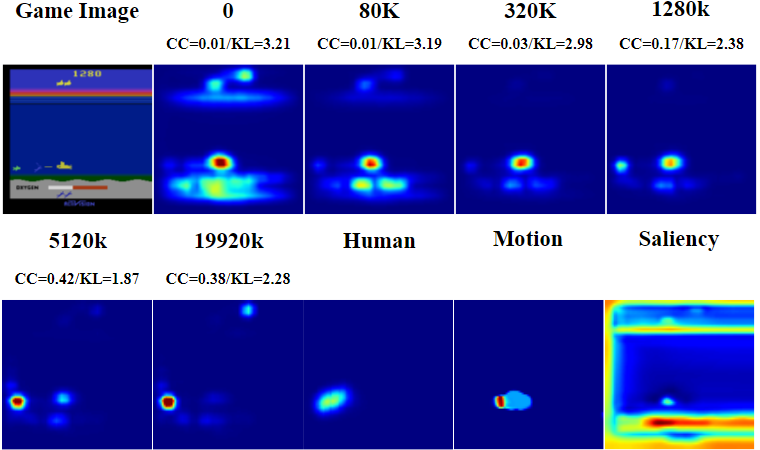
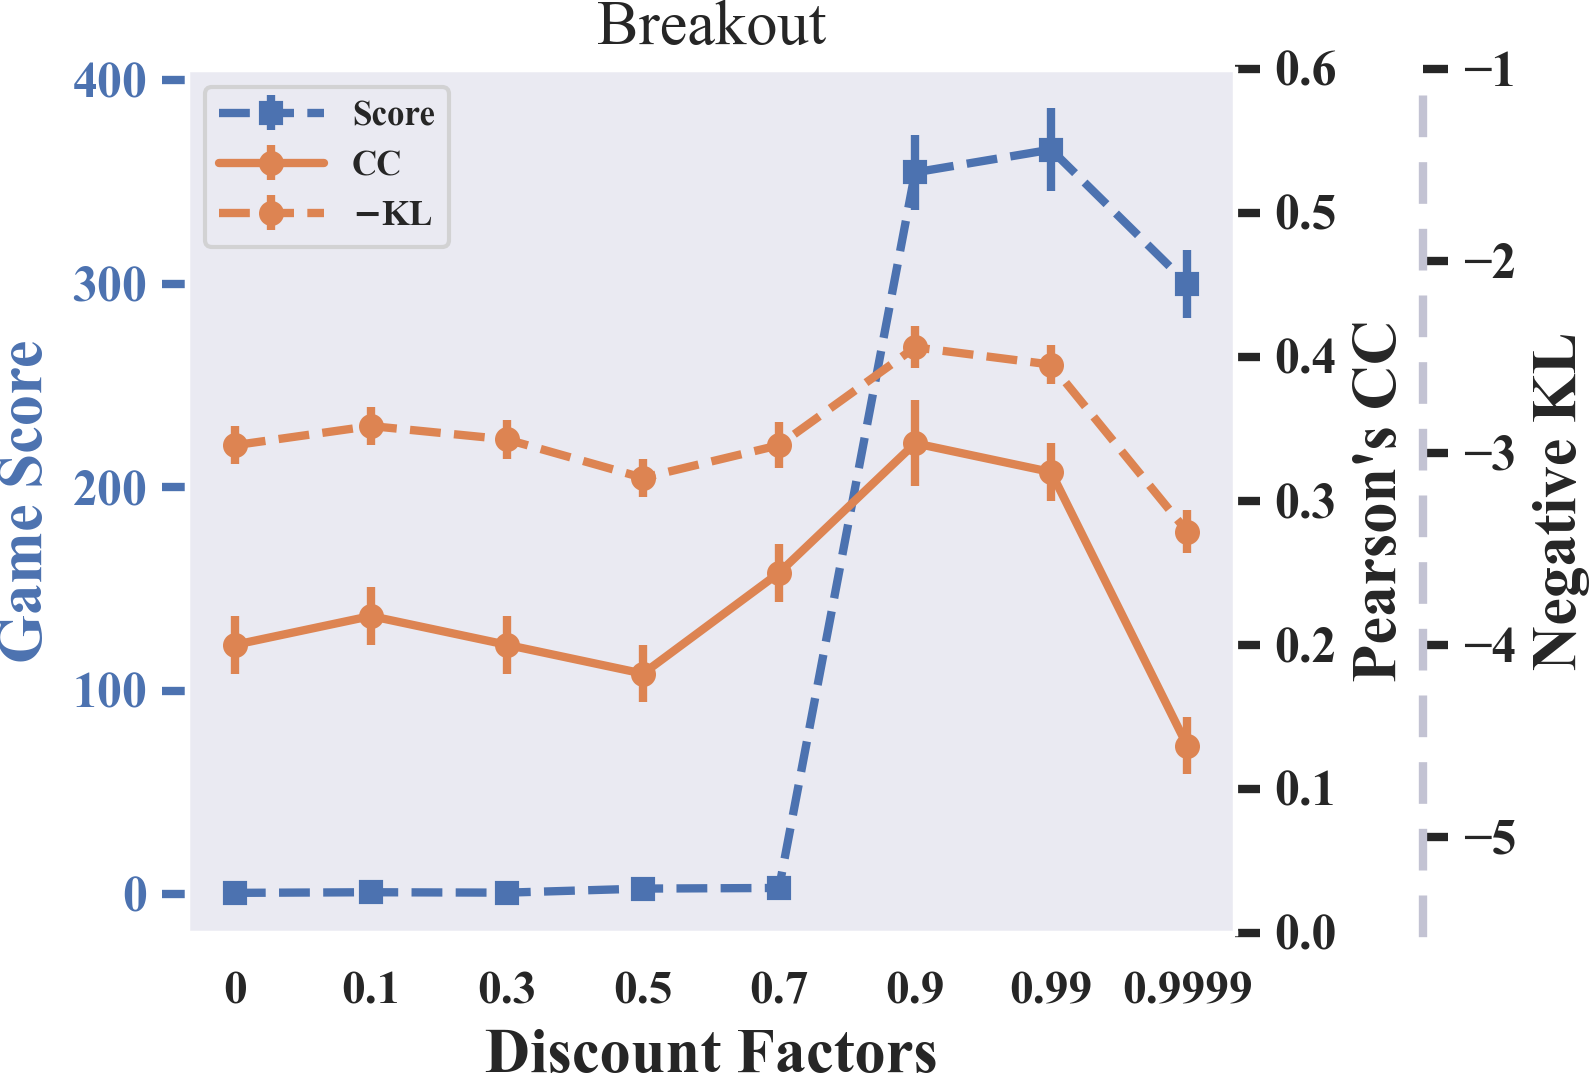
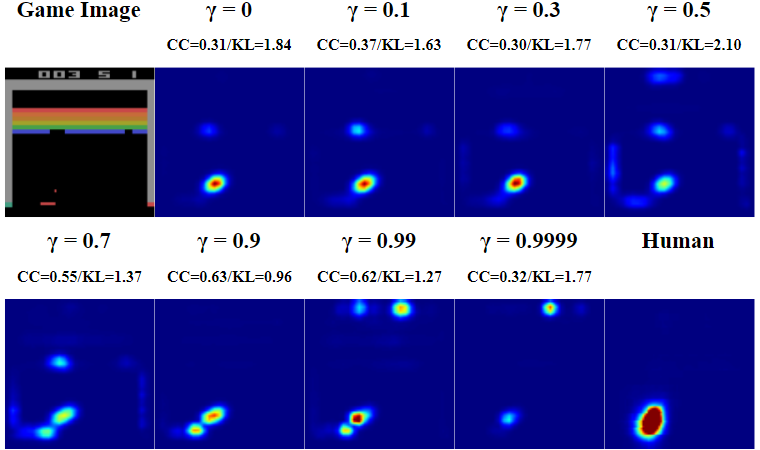
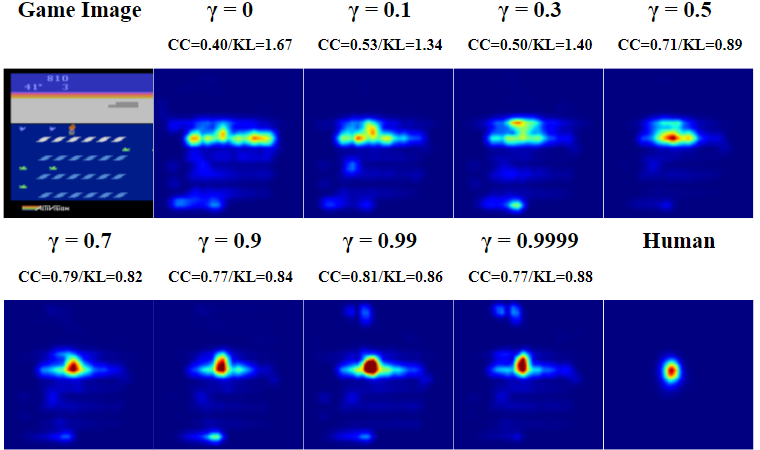
The results are shown in Fig. 1b. Overall, RL attention is most similar to human’s when . Beyond that, RL agents learn to attend to objects that matter only in the long run. For example, Fig. 3a shows that in Breakout, RL attention is primarily on the ball (immediate effector) when . When , however, it focuses on the number of lives, which does not indicate the end of the game until much later. With an intermediate value of , the agent attends to both groups of objects. On the contrary, humans rarely attend to long-term objects. This is because human attention is limited, so we have to keep those objects in the working memory and revisit them at lower frequencies (e.g., [75, 38]). Therefore, these long-term objects do not show up in our human attention model, and thus the less similar attention at larger discount factors.
Although in most games, the best game performance is achieved with default , Fig. 1b shows that the best performance across games is obtained at . In Seaquest, the agent with achieves higher score than the default agent. Fig. 3b shows that with a lower , the agent can focus, like humans, on an immediate threat from the left. Setting or distracts the agent to attend to the oxygen bar at the bottom that is important in the long run but less urgent now. A similar result was found for Ms.Pac-Man with an higher score from the agent than the agent.
This result suggests that deviating from the default can lead to better performance. Atari games are episodic tasks with true , but lower values often lead to better performance in practice [65, 48]111Strictly speaking, is a property of the MDP, not of the agent. Performance across MDPs with different s are not directly comparable in this sense. Varying discount factor and clipping reward are common reward engineering designs that alter the true MDP return to achieve better performance in practice.. Fig. 1b shows that agents perform poorly. We have verified that all agents (5 random seeds) converged after 200M samples, although to sub-optimal policies (Appendix 3). One reason for this deviation may be that being a little myopic helps the agent focus on the most urgent targets. This result provides another reason, from a perception perspective, for why RL agents need to adjust their planning horizon by reducing the discount factor–confirming the theoretical results provided by [37].
4.3 RL versus human attention: Failure states
We now turn to the second research question that concerns explainability in deep RL: Why do deep RL agents make mistakes? During training, RL agents must learn to both identify relevant objects (perception) and make the correct decisions based on that information (policy). This leads to two types of states where RL agents could make mistakes: (1) they fail to attend to the right objects, and (2) they attend to the right objects but make the wrong decisions. Since human attention can be used to identify important visual features, can we use human attention to distinguish these two types of mistakes? To answer this question, we compile a failure image set by recording the game frames right before the RL agents lose a “life” which incurs a large penalty. We locate 100 such instances for each game. Freeway is excluded since the PPO agent learned a policy that is nearly optimal.
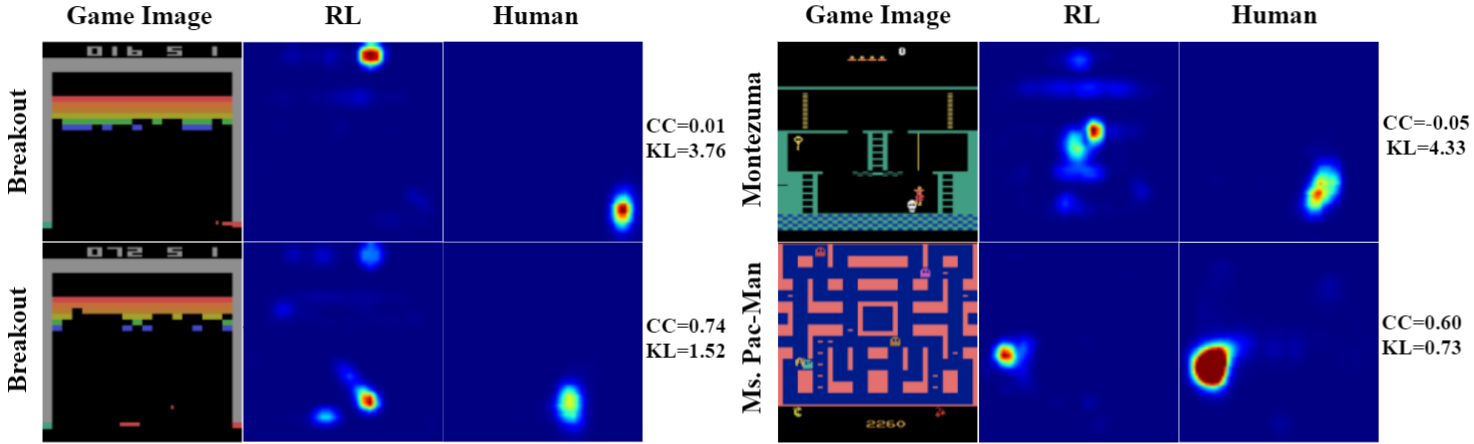
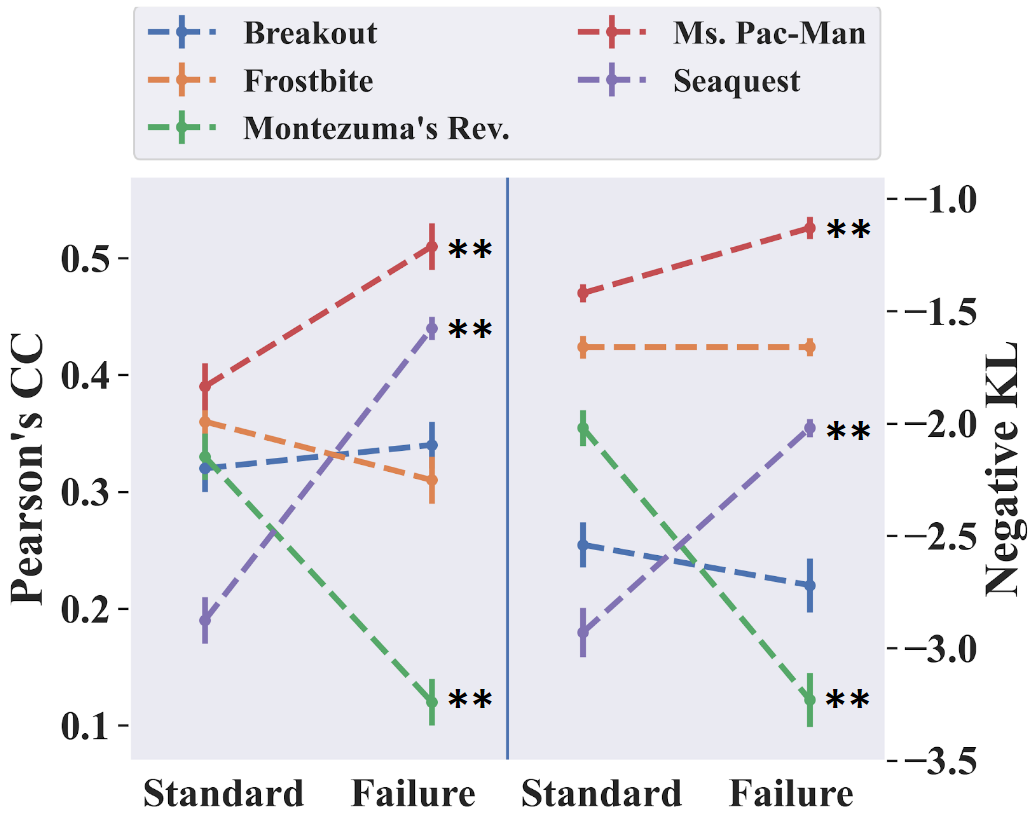
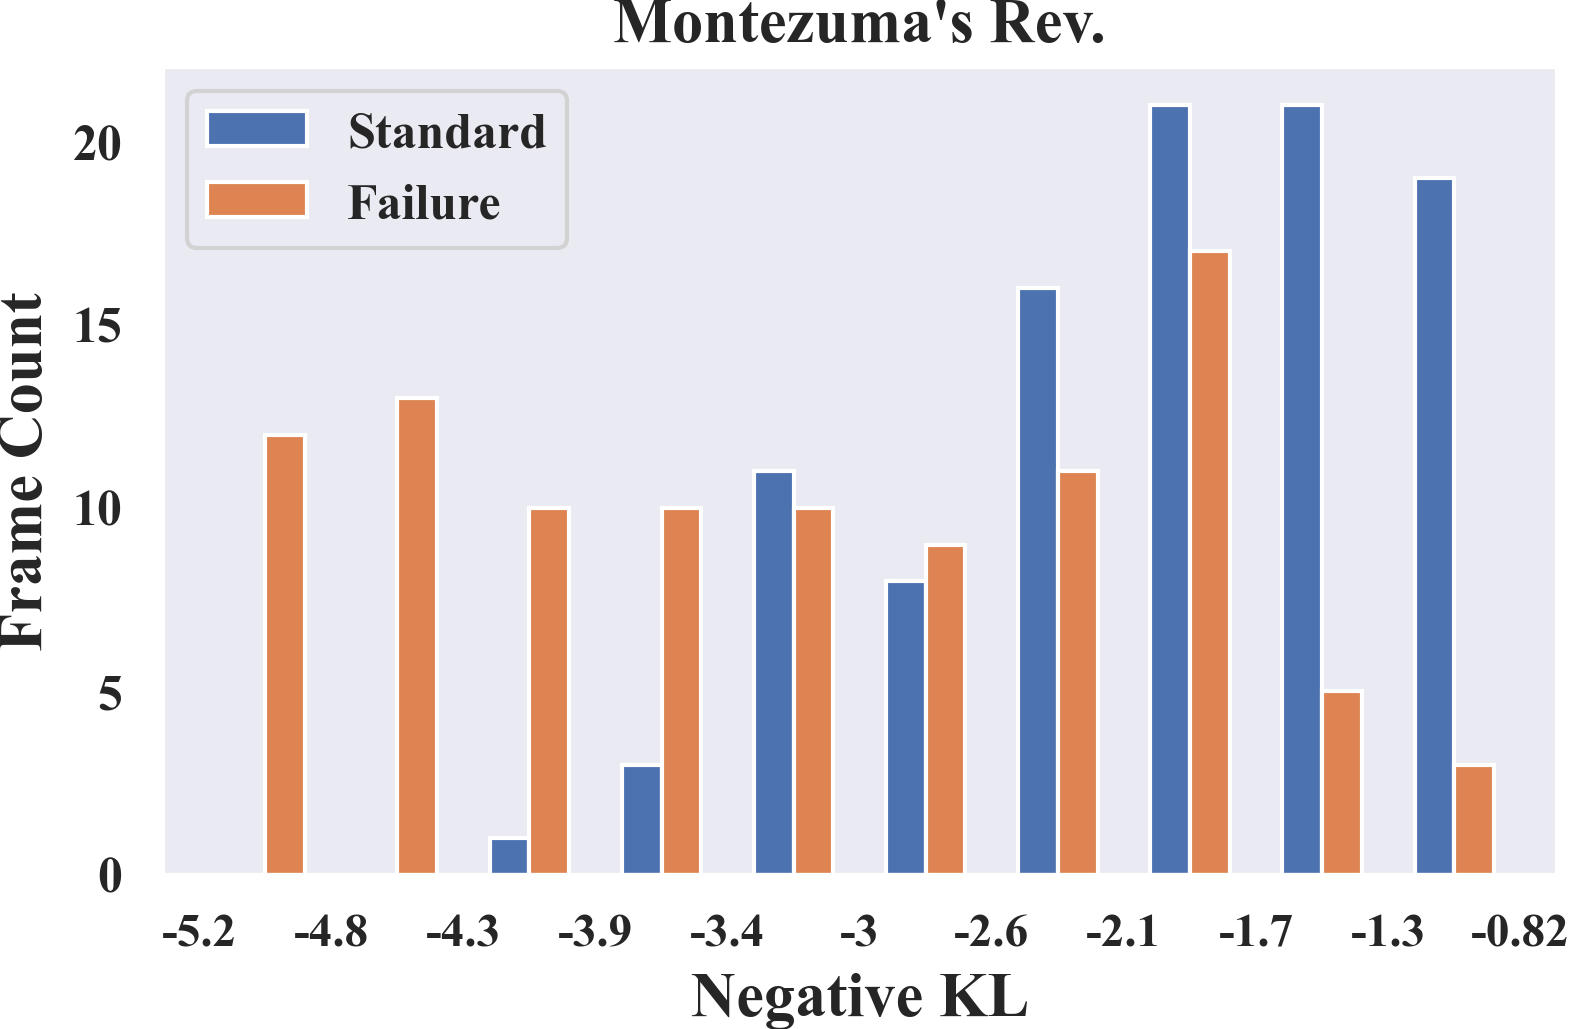
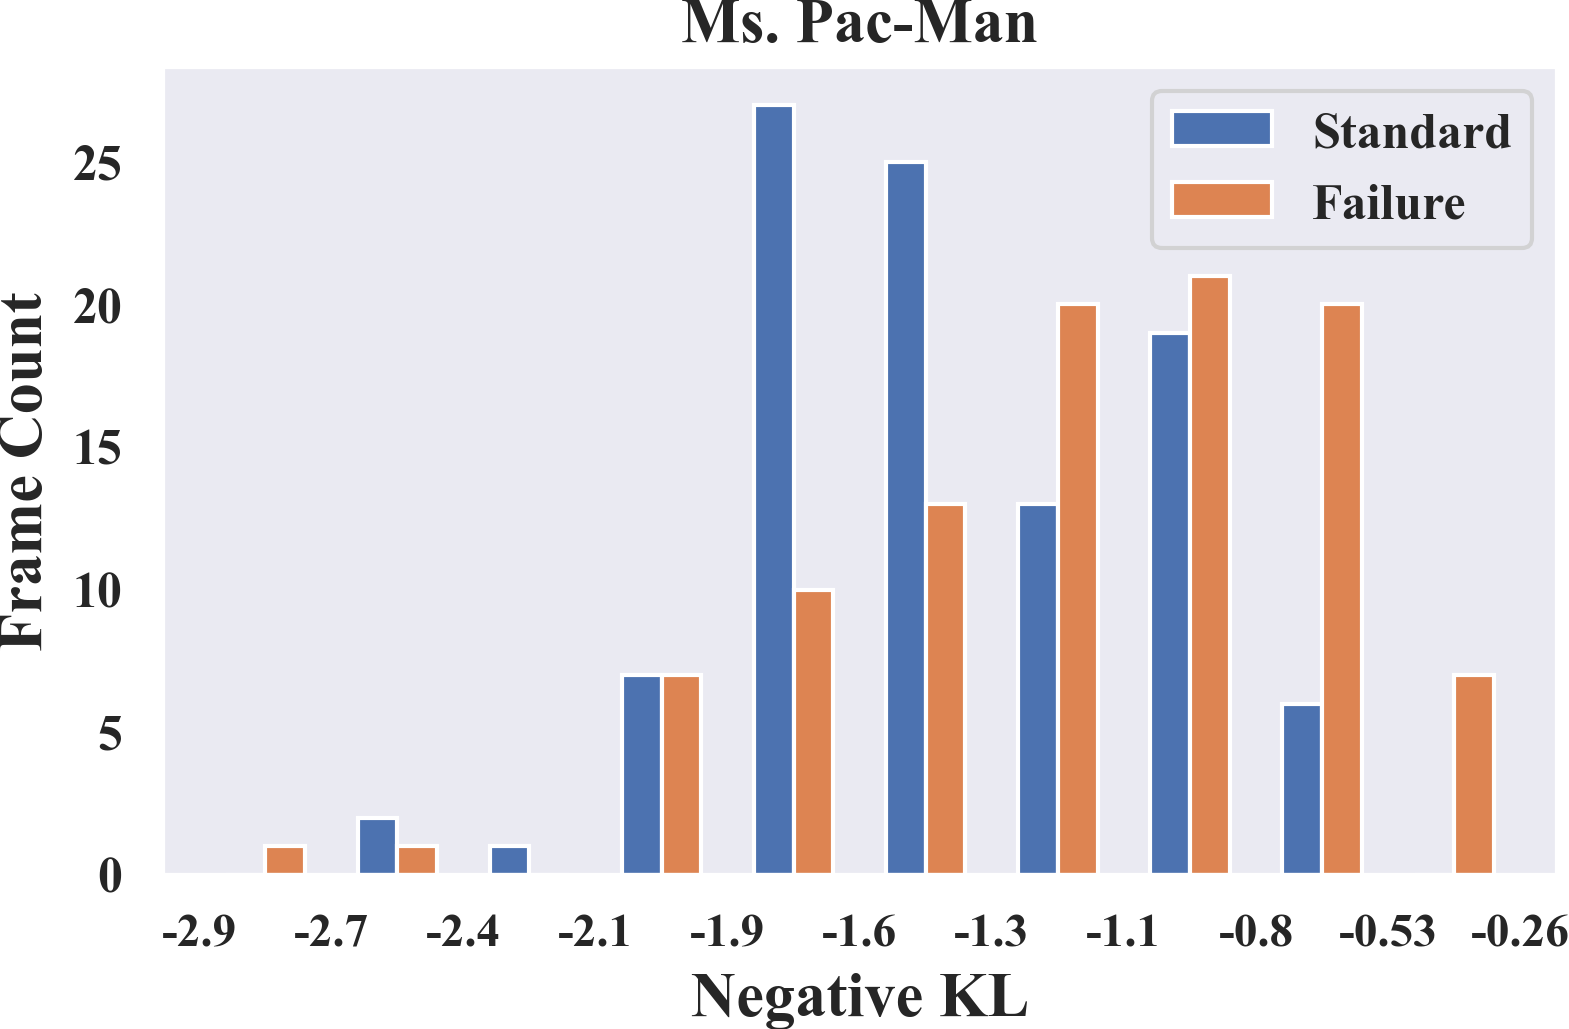
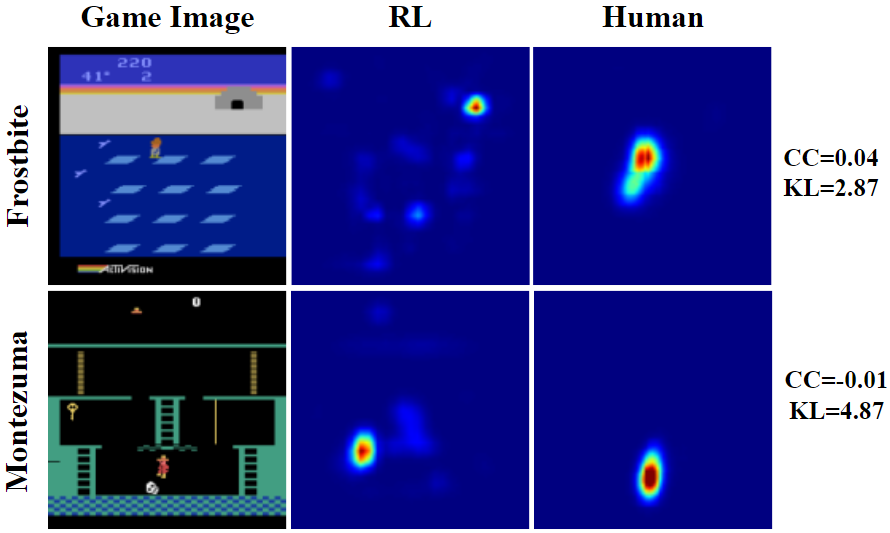
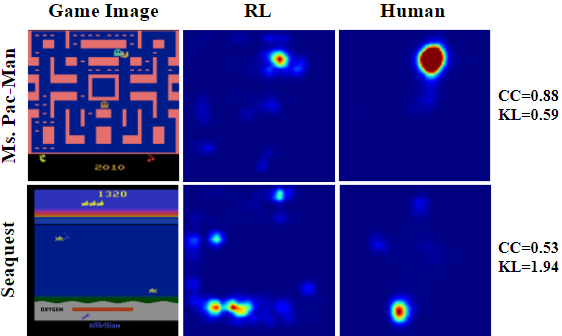
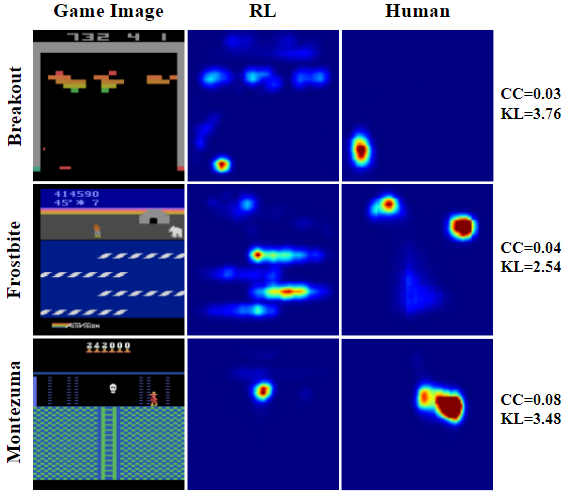
Fig. 4a illustrates the two types of failure states for Breakout (left column). In the first case, RL attention is extremely different from human’s because it does not attend to the ball as the human model does. This lack of attention on task-relevant objects likely contributes to its failure. In the second case, the agent and the human model have highly similar attention maps because both attend to the ball. However, the agent fails to save the ball (which can still be saved), indicating that it has learned a suboptimal policy despite good perception. Following this method, we can use human attention as a reference to quantitatively interpret RL failure cases: if RL attention is in general less similar to human attention in failure than in normal states, then the model less frequently attends to task-relevant objects (“bad perception"); if it is more similar, then the model is not making the correct decisions despite the correct visual information (“bad policy").
Fig. 4b shows the quantitative results for all games. For Montezuma’s Revenge, the RL attention in failure states becomes less similar to human attention compared to the standard image set, indicated by significantly decreased CC/KL values. Fig. 4c shows the (negative) KL histogram of 100 failure states vs. normal states. We can see that in the failure states the RL agents are more likely to neglect human attended regions. Fig. 4a shows that the agent fails to attend to the enemy as the human does. With the same amount of training, the Montezuma agents do not learn to identify task-relevant objects in the game. In other words, they do not learn to parse out the semantics and structures of the game. This suggests that Montezuma’s Revenge is perceptually more difficult for the agents.
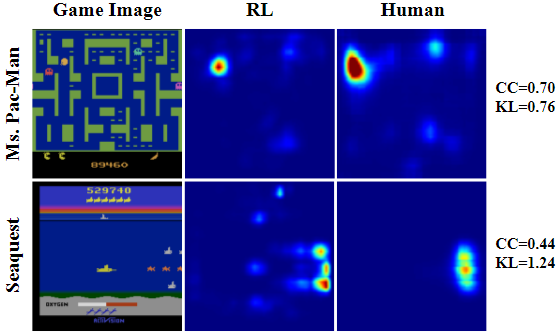
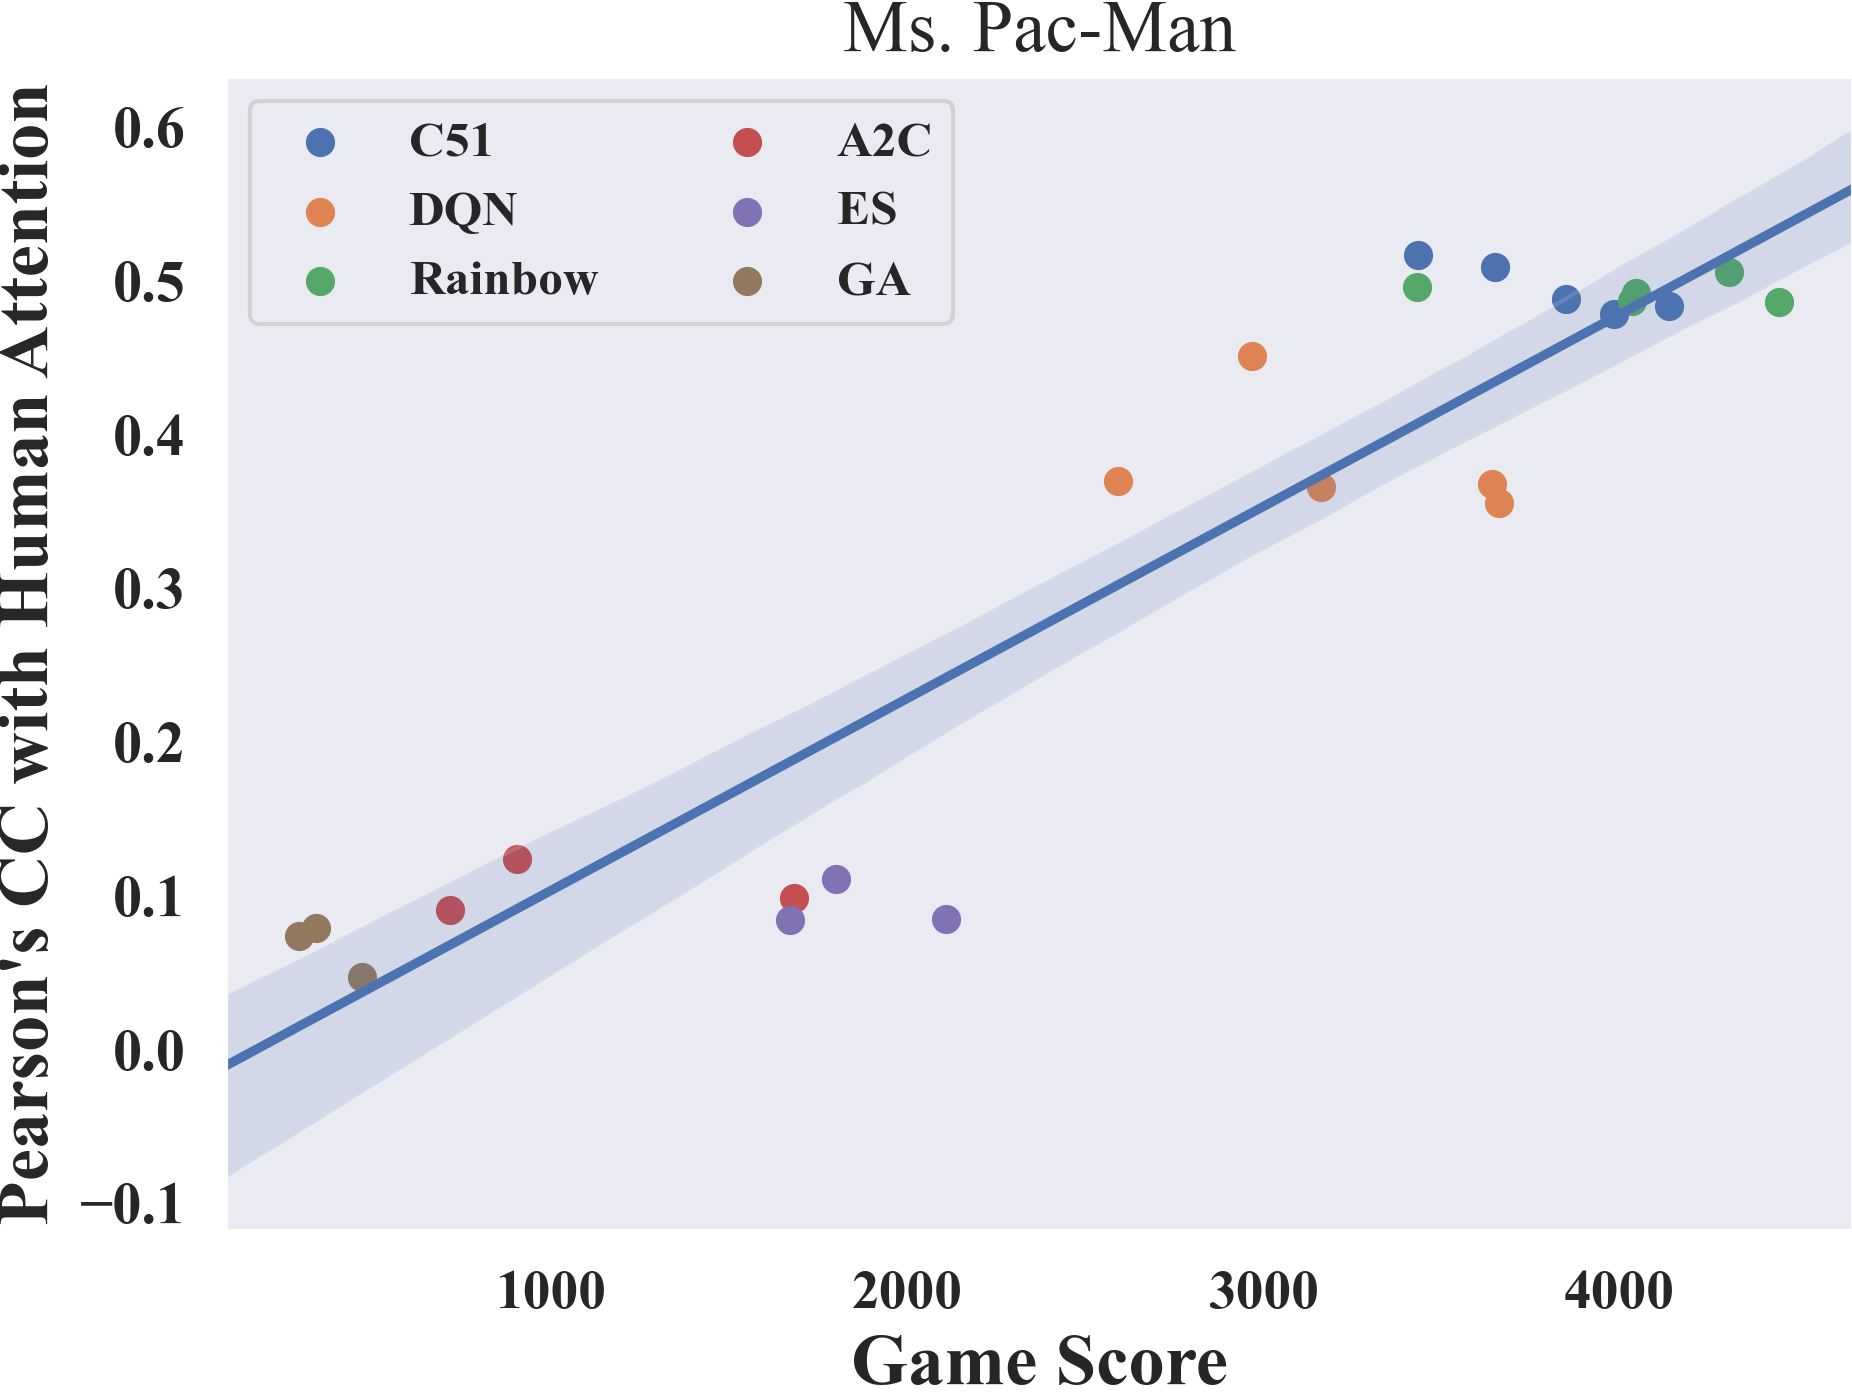
On the contrary, in the failure states for Ms. Pac-Man and Seaquest (Fig. 4b), attention maps of RL agents and humans are more similar than in the normal states. Fig. 4d shows the (negative) KL histogram of 100 failure states vs. normal states from Ms. Pac-Man, in which humans and RL agents are more likely to agree on the objects to attend to in failure states. An example frame is shown on the bottom of Fig. 4a: the agent attends to the Pac-Man and the enemy ghost similarly to humans, but it makes the wrong decision and runs into the ghost. Compared with Montezuma’s revenge, Ms. Pac-Man is perceptually easier for the agents.
We conclude that similarity measurements with human attention may help identify and interpret the failures made by RL agents, as well as identifying tasks that are more perceptually difficult to learn for the agents.
4.4 RL versus human attention: Unseen data
Next, we study whether the RL agent’s attention generalizes to unseen states. The unseen states are late-game states obtained from human experts’ data [88] which RL agents have not encountered (i.e., above the agents’ best score; score threshold for each game can be found in Appendix 5). We refer to this set as the unseen image set (100 images per game). Again, Freeway is excluded since the agent is nearly optimal.
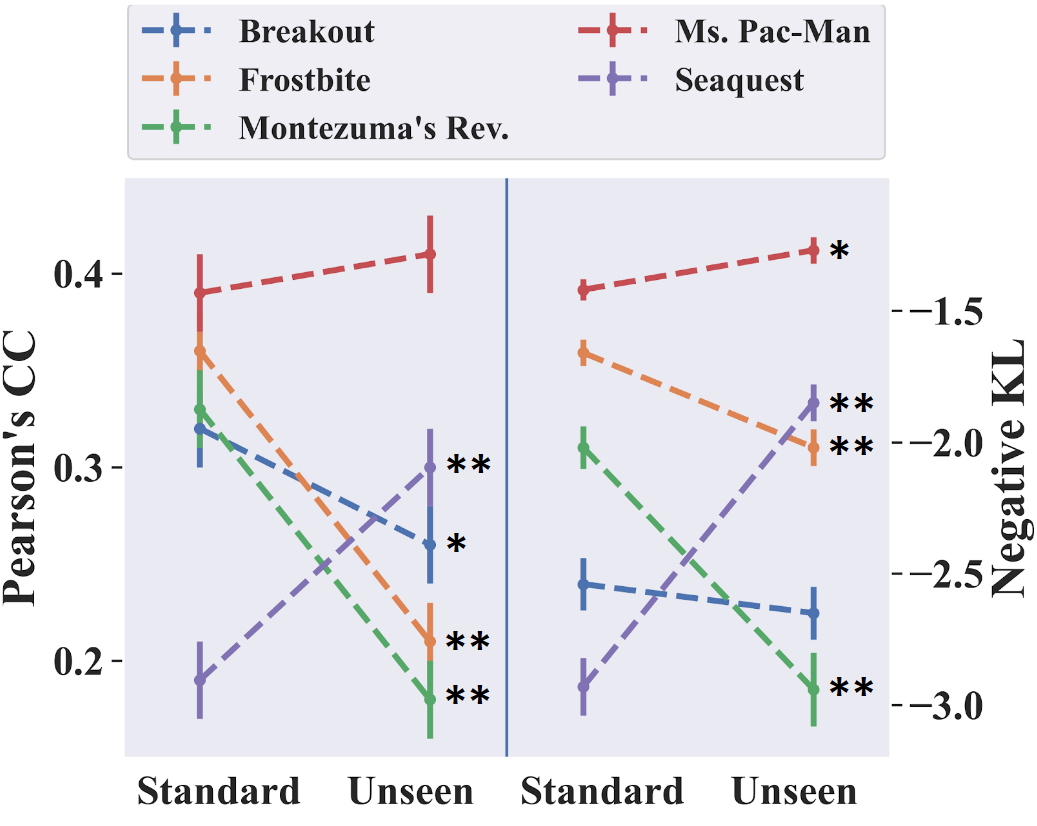
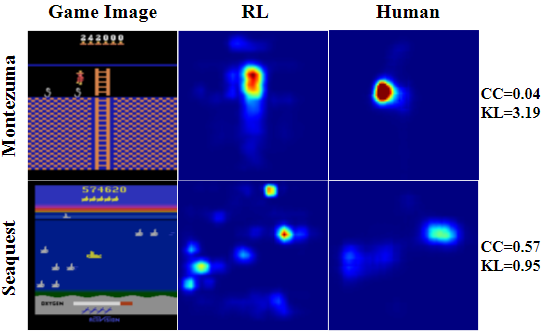
Fig. 5a shows the results. For Frostbite and Montezuma’s Revenge, the similarities drop significantly. One reason for this drop may be the presence of new objects that the agents have never encountered in the unseen states. Fig. 5b shows an example for Montezuma’s Revenge. The agents attended to the ladder, a previously seen object, but failed to attend to a new enemy object on the left like the human did. For Seaquest and Ms. Pac-Man, on the other hand, RL attention and human attention are more similar on unseen data. Compared with the game structure in Montezuma’s Revenge, Seaquest and Ms. Pac-Man do not have new objects in the unseen states–the objects only move faster and appear in larger numbers. However, this alone only supports a lack of decrease in attention similarity. We suspect the increase in similarity may be due to dangerous states similar to those in Section 4.3, but more controlled experiments (e.g., suggested in [3]) are required to further interpret this result. Breakout is an interesting case. The CC value drops significantly in unseen states whereas the negative KL value does not change much. The similar KL values may be attributed to the maintained attention on the ball and paddle in unseen states, whereas the decreasing CC values may be due to unseen spatial layouts of the bricks. Again, more controlled studies are required to confirm this. More examples are in Appendix 5.
The results suggest that one of the first obstacles to achieving expert human-level performance for certain games is the perception challenge–the agents need to learn to recognize, attend to, and then learn to act upon new objects. This is easy for humans due to their prior knowledge but challenging for RL agents [41, 76, 18]. For the other games without novel objects, the agent’s attention is fairly generalizable and it needs to learn a good policy for challenging states.
4.5 Other Atari agents
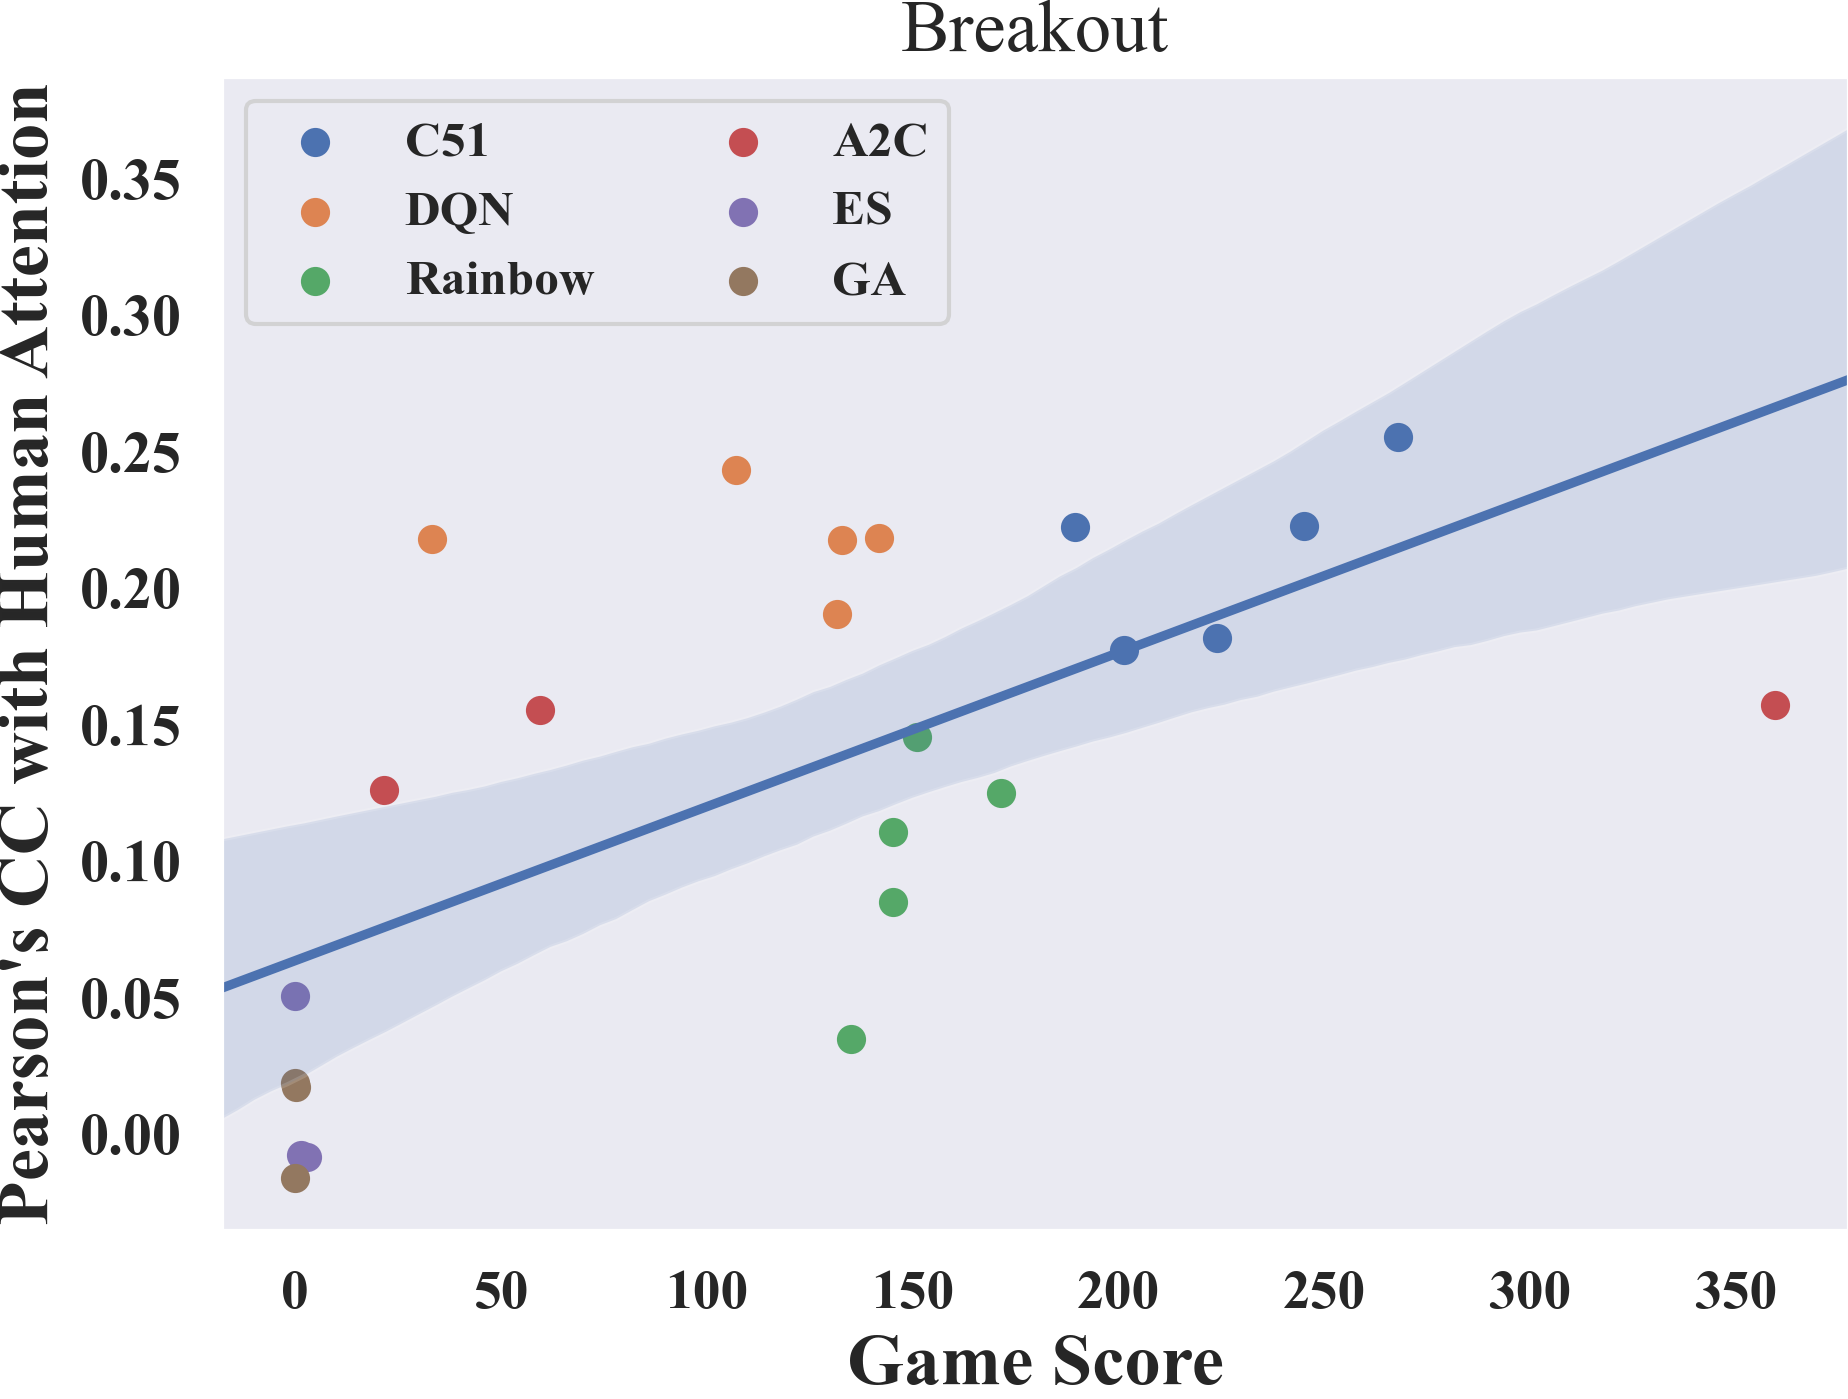
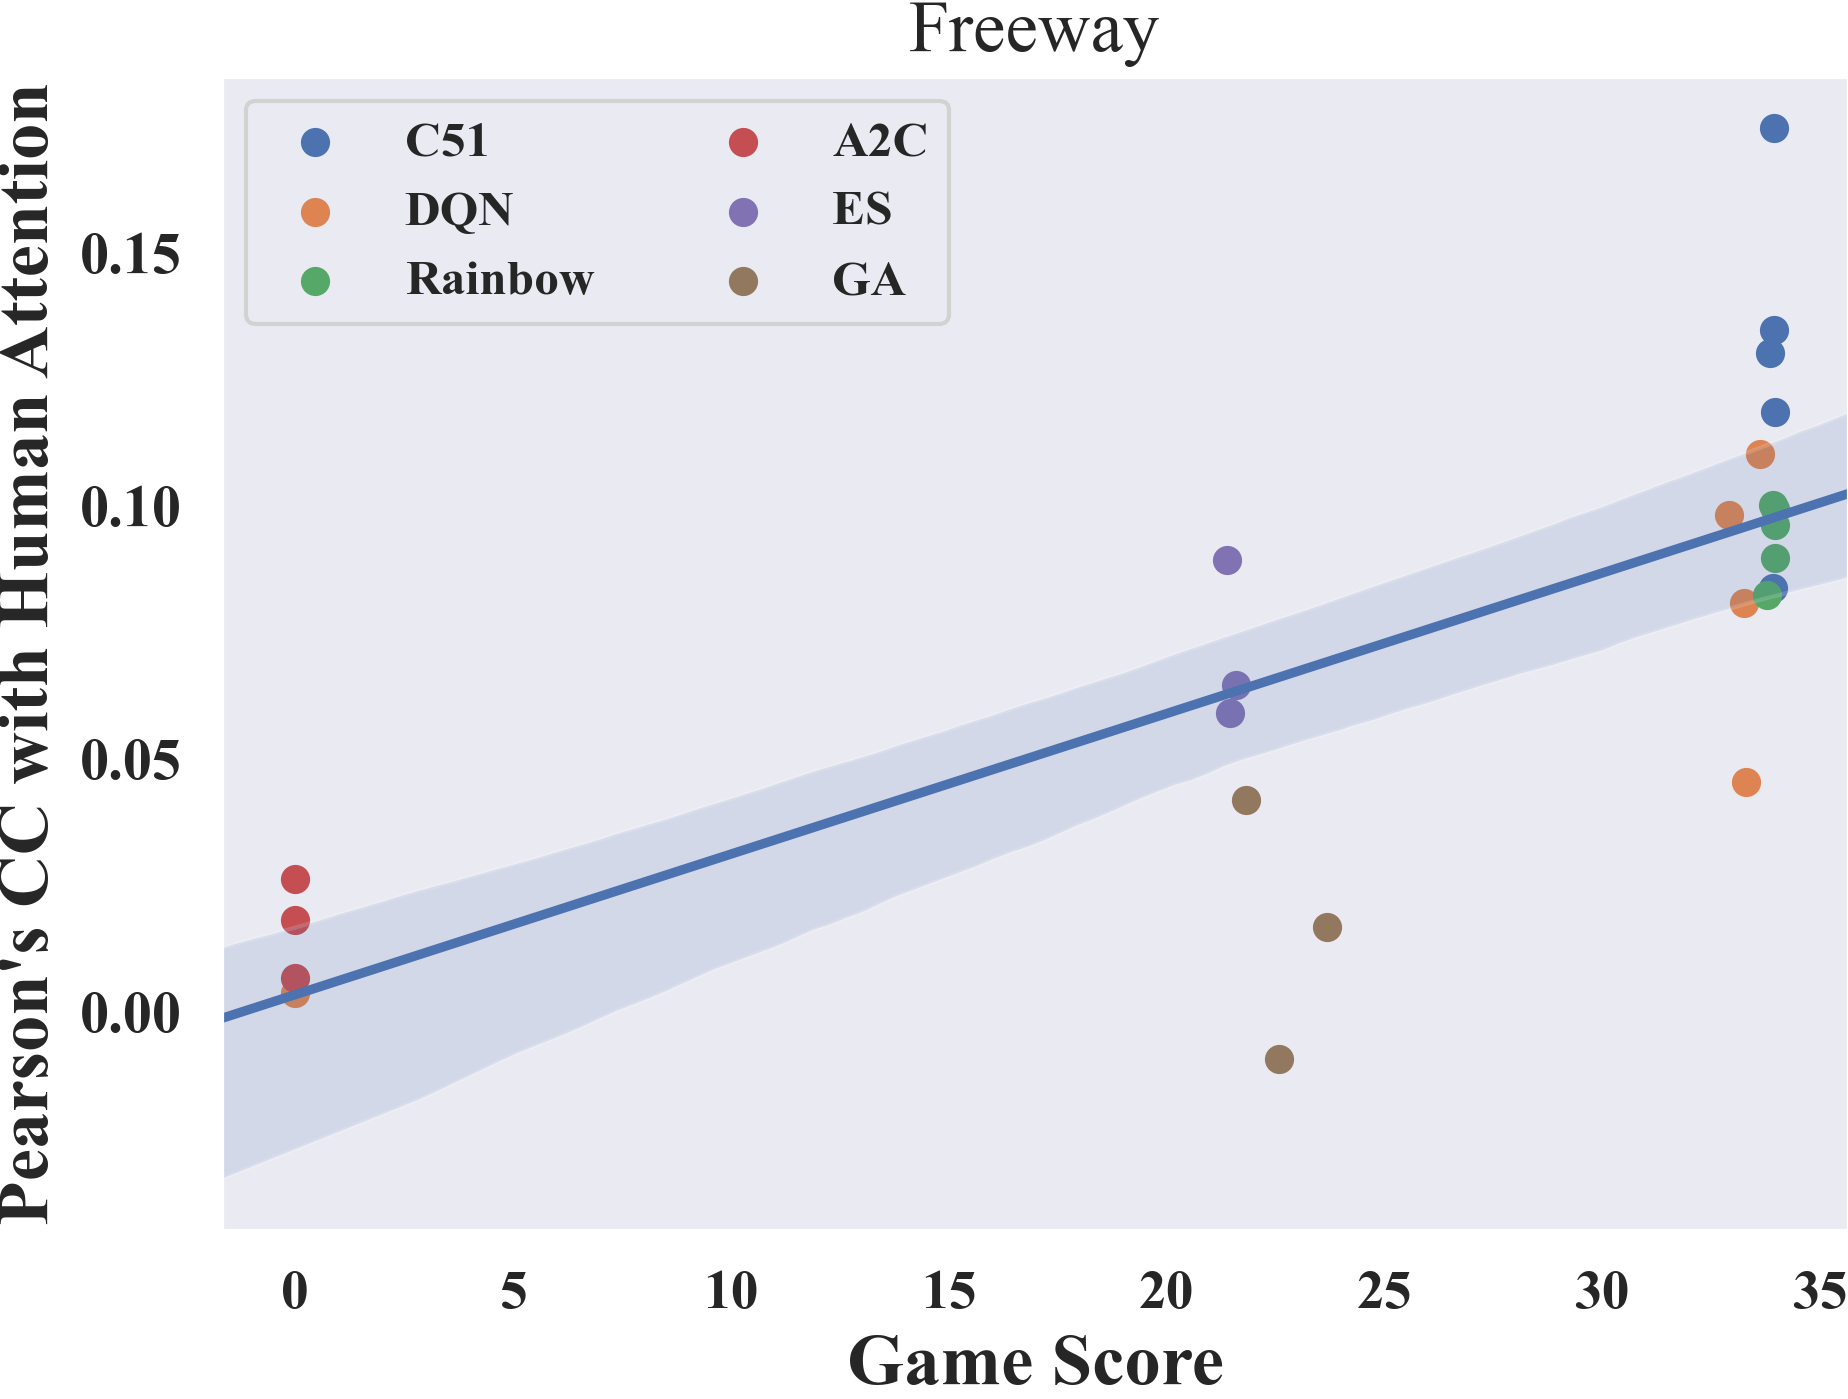
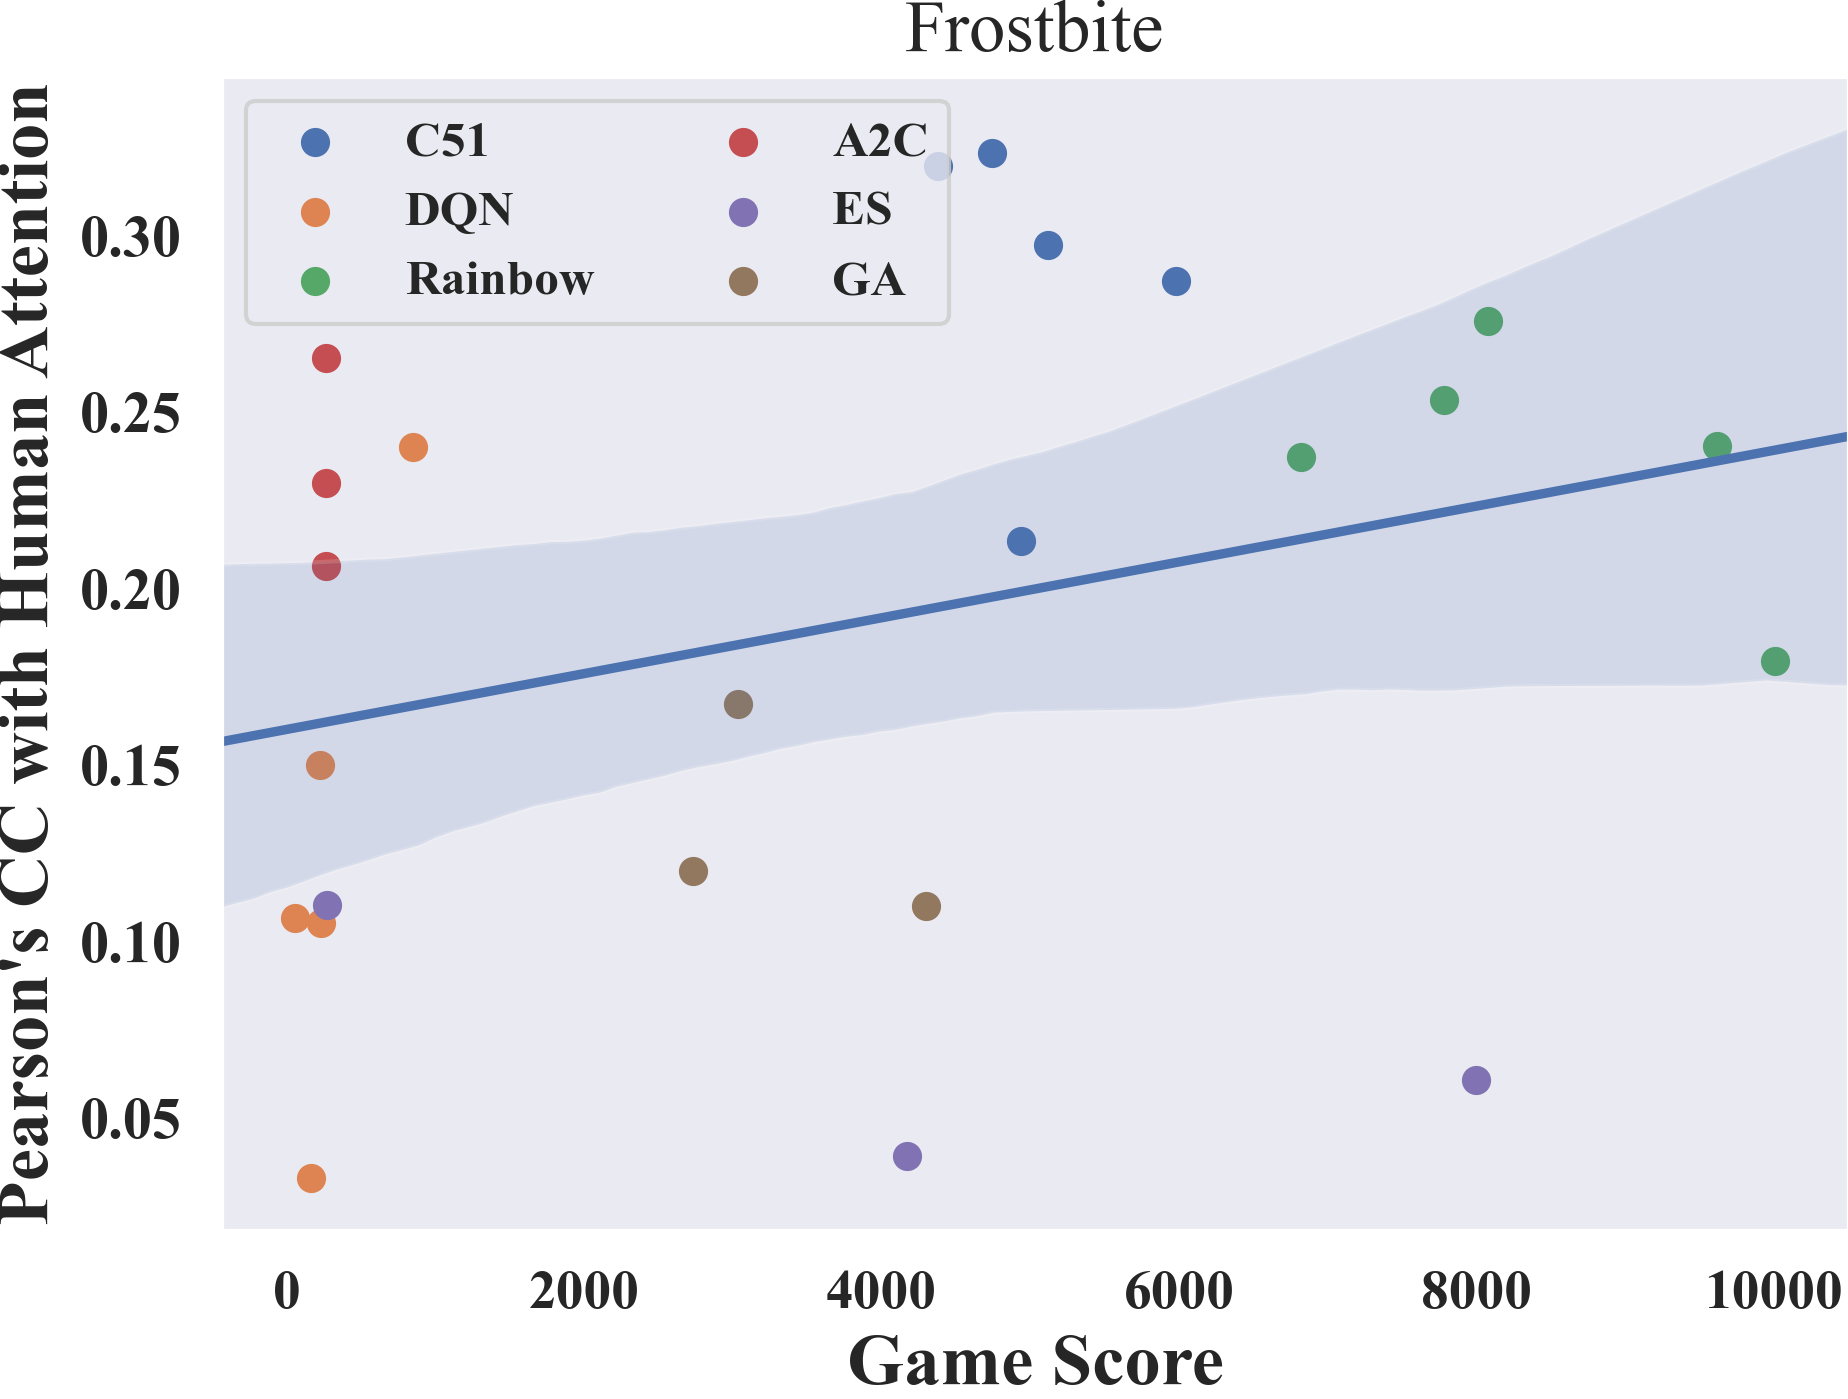
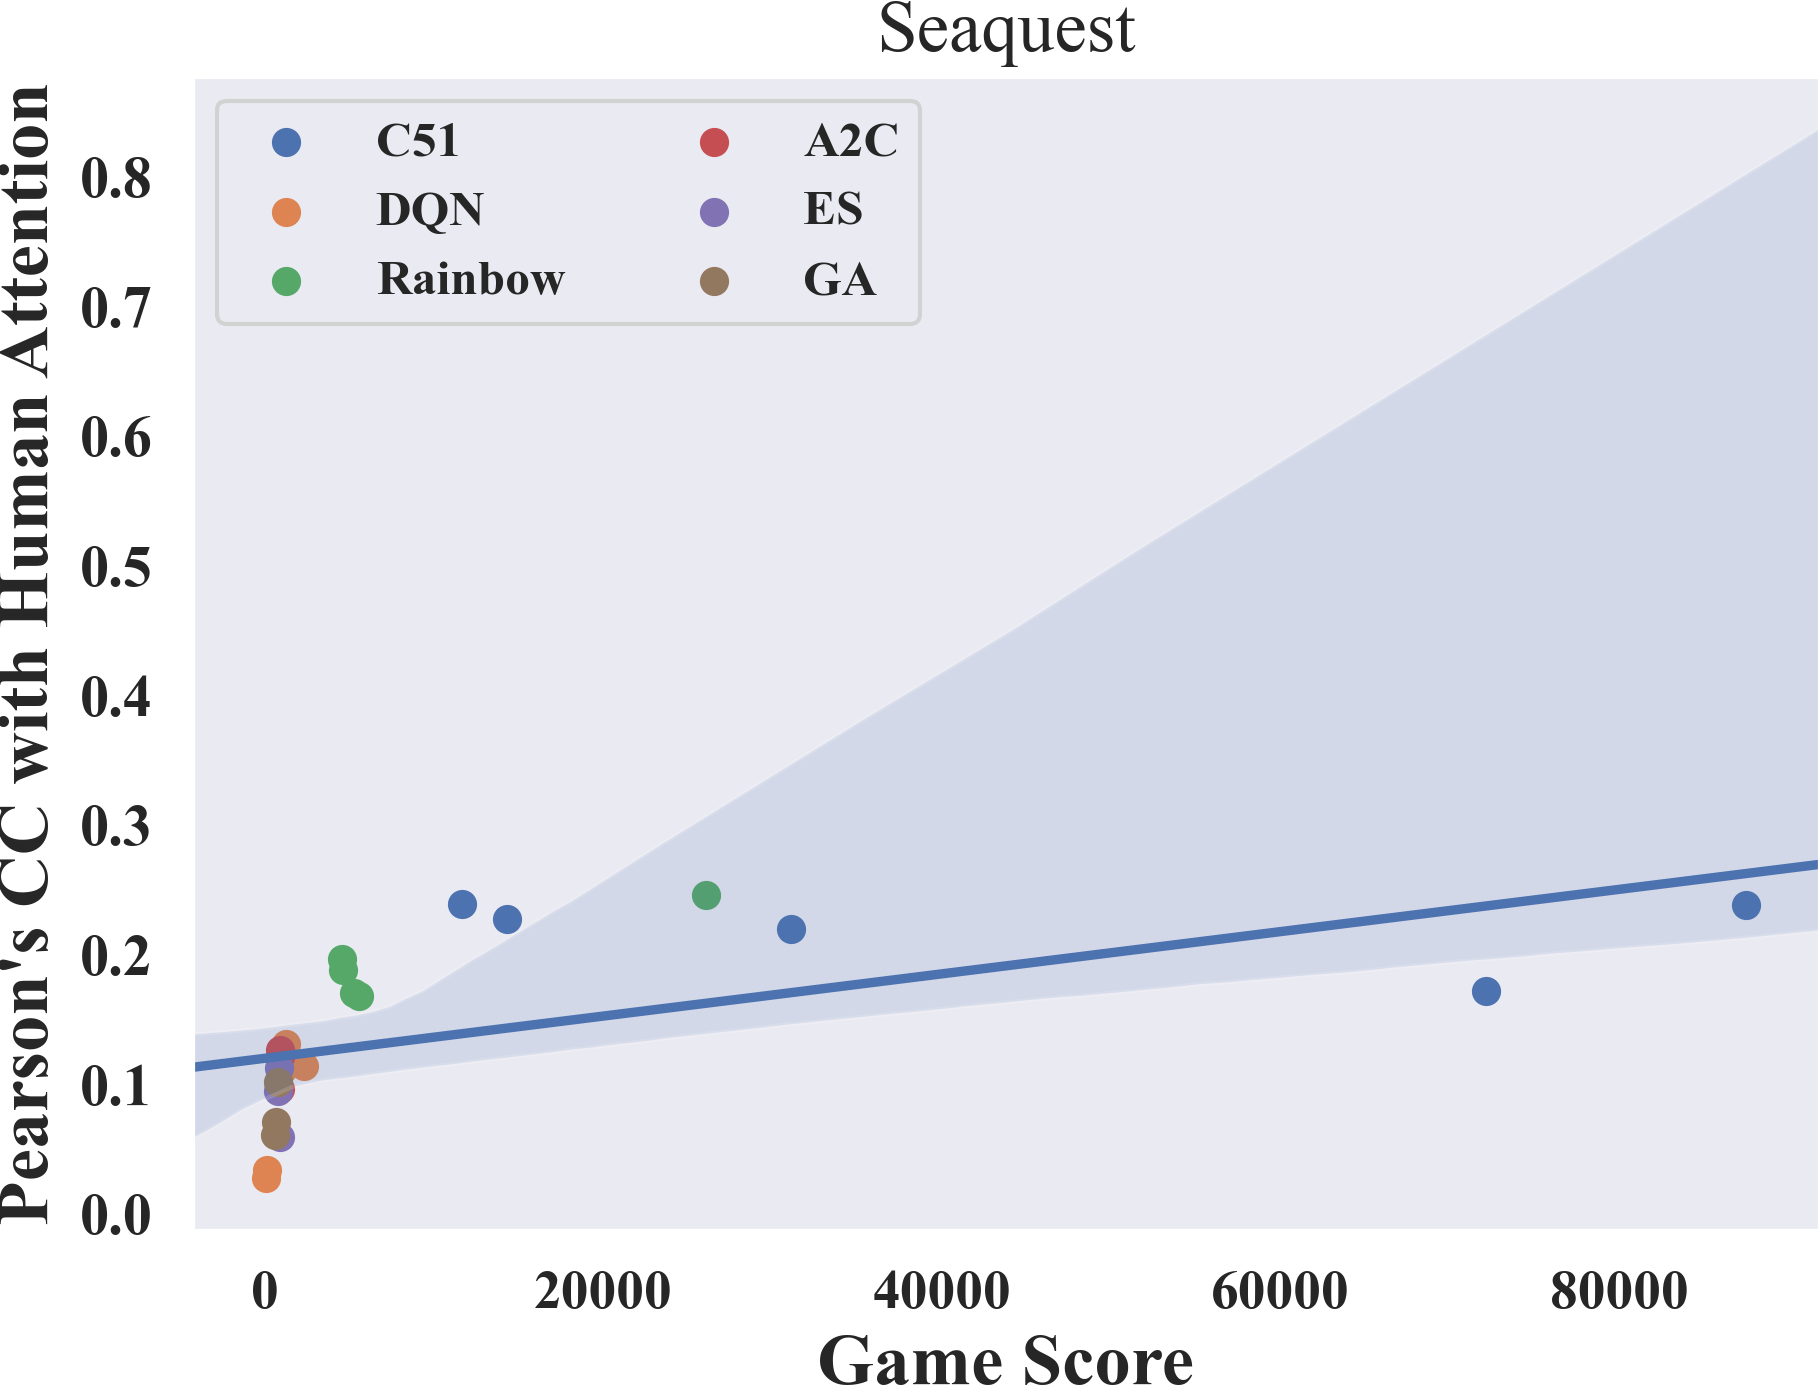
The above analyses were done for a particular RL algorithm–PPO. Next we apply our method to other RL algorithms, including C51 [5], Rainbow [28], DQN [48], and A2C [47], as well as two evolutionary algorithms, GA [71] and ES [63]. We use trained models from Dopamine [11] and Atari Model Zoo [72] in which each algorithm has 3-5 trained models. There is a strong positive correlation between model performance (in terms of the game score, averaged over 50 episodes each) and similarity measurement (in terms of CC with human attention on the standard image set). The average correlation coefficient for five games is (excluding Montezuma since most algorithms have zero scores). The results for individual games can be found in Appendix 6. This result suggests that the overall positive correlation between model performance and similarity with human attention generalizes to other deep RL algorithms. Although not performed in this work due to resource limitations, future studies should run experiments on the effect of learning and discount factors to further confirm our findings.
5 Discussion
We provide visual explanations for deep RL agents using human experts’ attention as a reference. We have discussed how RL attention develops and becomes more human-like during training, and how varying the discount factor affects learned attention. We show that human attention can be useful in diagnosing an RL agent’s failures. We also identify challenges in closing the performance gap between human experts and RL agents in the unseen states experiment. Our analysis is restricted to saliency map comparisons, but other approaches are possible for measuring the similarity of representations learned by different RL agents [79]. Our human attention models, all compiled datasets, and tools for comparing RL attention with human attention are made available for future research in this direction.
When interpreting the results, it is important to keep in mind the limitations of saliency-based explainable RL methods [73, 1]. Recent studies have shown that saliency maps are more exploratory rather than explanatory [3]. To infer causal explanations, one can start with using saliency maps to build falsifiable hypotheses, and perform counterfactual evaluations of these hypotheses, e.g., by manipulating states to generate counterfactual semantic conditions [3]. Our framework helps direct researchers’ efforts towards data that deviate from human attention patterns, from which useful hypotheses are more likely to arise.
For researchers who are interested in RL algorithms, we have gained at least three important insights. First, since the task performance and similarity to human attention are highly correlated, one could use human attention as prior knowledge to guide the learning process of RL agents, e.g., by encouraging them to attend to the correct objects early in the learning process. This could be especially helpful for games like Seaquest, in which the agent has not learned to focus on the right object after 5120k time steps (Fig. 2). Two human studies using Atari games suggested that prior knowledge, such as perceptual prior, is why humans learn faster and better in these games [76, 18]. Then the next question is how to incorporate human attention into DNNs–which has been studied in several computer vision tasks [59]. Our results indicate that humans typically attend to fewer regions than RL agents do. Therefore a desirable loss function should encourage the agents to focus on the regions that humans attend to, but would not penalize the agents for attending to more regions [64].
Second, our results provide visual explanations for the agents’ performance when varying the discount factors and highlight the importance of choosing proper planning horizons with appropriate discount factors. Recent works confirm this by showing that it is beneficial to have an adaptive discount factor [4] or multiple discount factors [21].
Third, failure analysis could identify tasks and states where RL agent’s attention drastically differs from expert humans. In a human-in-the-loop RL paradigm, these states may need human intervention or correction. By using our method for comparing human and RL attention, researchers may diagnose their algorithms with the states of their interest.
For researchers who are interested in using RL as models for cognition, it is perhaps both surprising and encouraging to see that RL agents trained from scratch with only images and reward signals can develop attention maps that are similar to humans, especially when considering that they have very little prior knowledge. This result is similar to previous research that shows CNNs trained from image classification tasks can learn features that are similar to the ones in the visual cortex [19, 80, 81]. Consistent with previous findings, we show that model task performance and feature similarity are highly correlated [81]. Our results are complementary to the recent findings using human brain imaging data when playing Atari games [13], suggesting that deep RLs can learn biologically plausible representations and can be used as models for human gaze, decision, and brain activities.
Multiple factors are important for interpreting our results and could explain the remaining differences between human attention and RL attention. The first one regards the nature of human attention. Humans store information in memory and do not need to constantly move their eyes to attend to all task-relevant objects. To complete the human attention map, in addition to gaze data (overt attention), one will need to retrieve human covert attention from brain activity data, a technique that became possible recently [43, 13]. Another factor is the human intrinsic reward. Humans are likely to have internal reward functions that are different from the ones provided by the game environment, and reward is known to affect attention [62, 43]. Hypothetically specific algorithmic or network architecture designs that capture important cognitive aspects of human decision-making could lead to more similar saliency maps.
A closely related research direction compares a human player’s policy with an RL agent’s learned policy [49] which could further allow us to better understand the similarities and differences between humans and RL agents. However, as we have shown here, the difference in decisions could be due to perception, which needs to be considered while comparing policies. Our approach lays the groundwork for future research in this direction.
6 Ethics statement
Our work studies how attentional mechanisms of humans and decision-making reinforcement learning agents are similar or different. The hope is that our work will help us better understand the differences and similarities between humans and AI. Comparing humans with AIs allows us to better understand their strengths and limitations. The study involves collecting and modeling human eye-tracking data. We have removed all personally identifiable information such that the private information of human subjects is protected.
Acknowledgments and Disclosure of Funding
This work is supported by NIH Grant EY05729; A portion of this work has taken place in the Learning Agents Research Group (LARG) at UT Austin. LARG research is supported in part by NSF (CPS-1739964, IIS-1724157, FAIN-2019844), ONR (N00014-18-2243), ARO (W911NF-19-2-0333), DARPA, Lockheed Martin, GM, Bosch, and UT Austin’s Good Systems grand challenge. Peter Stone serves as the Executive Director of Sony AI America and receives financial compensation for this work. The terms of this arrangement have been reviewed and approved by the University of Texas at Austin in accordance with its policy on objectivity in research.
References
- [1] Julius Adebayo, Justin Gilmer, Michael Muelly, Ian Goodfellow, Moritz Hardt, and Been Kim. Sanity checks for saliency maps. In Proceedings of the 32nd International Conference on Neural Information Processing Systems, pages 9525–9536, 2018.
- [2] Alnour Alharin, Thanh-Nam Doan, and Mina Sartipi. Reinforcement learning interpretation methods: A survey. IEEE Access, 8:171058–171077, 2020.
- [3] Akanksha Atrey, Kaleigh Clary, and David Jensen. Exploratory not explanatory: Counterfactual analysis of saliency maps for deep reinforcement learning. In International Conference on Learning Representations, 2019.
- [4] Adrià Puigdomènech Badia, Bilal Piot, Steven Kapturowski, Pablo Sprechmann, Alex Vitvitskyi, Zhaohan Daniel Guo, and Charles Blundell. Agent57: Outperforming the atari human benchmark. In International Conference on Machine Learning, pages 507–517. PMLR, 2020.
- [5] Marc G Bellemare, Will Dabney, and Rémi Munos. A distributional perspective on reinforcement learning. In International Conference on Machine Learning, pages 449–458. PMLR, 2017.
- [6] Marc G Bellemare, Yavar Naddaf, Joel Veness, and Michael Bowling. The arcade learning environment: An evaluation platform for general agents. Journal of Artificial Intelligence Research, 47:253–279, 2013.
- [7] Ali Borji, Ming-Ming Cheng, Huaizu Jiang, and Jia Li. Salient object detection: A benchmark. IEEE Transactions on Image Processing, 24(12):5706–5722, 2015.
- [8] Ali Borji and Laurent Itti. Defending yarbus: Eye movements reveal observers’ task. Journal of Vision, 14(3):29–29, 2014.
- [9] Zoya Bylinskii, Tilke Judd, Aude Oliva, Antonio Torralba, and Frédo Durand. What do different evaluation metrics tell us about saliency models? IEEE Transactions on Pattern Analysis and Machine Intelligence, 41(3):740–757, 2019.
- [10] Zoya Bylinskii, Adrià Recasens, Ali Borji, Aude Oliva, Antonio Torralba, and Frédo Durand. Where should saliency models look next? In European Conference on Computer Vision (ECCV), pages 809–824. Springer, 2016.
- [11] Pablo Samuel Castro, Subhodeep Moitra, Carles Gelada, Saurabh Kumar, and Marc G. Bellemare. Dopamine: A Research Framework for Deep Reinforcement Learning. 2018.
- [12] Aditya Chattopadhay, Anirban Sarkar, Prantik Howlader, and Vineeth N Balasubramanian. Grad-cam++: Generalized gradient-based visual explanations for deep convolutional networks. In 2018 IEEE Winter Conference on Applications of Computer Vision (WACV), pages 839–847. IEEE, 2018.
- [13] Logan Cross, Jeff Cockburn, Yisong Yue, and John P O’Doherty. Using deep reinforcement learning to reveal how the brain encodes abstract state-space representations in high-dimensional environments. Neuron, 2020.
- [14] Piotr Dabkowski and Yarin Gal. Real time image saliency for black box classifiers. In Advances in Neural Information Processing Systems, pages 6967–6976, 2017.
- [15] Abhishek Das, Harsh Agrawal, Larry Zitnick, Devi Parikh, and Dhruv Batra. Human attention in visual question answering: Do humans and deep networks look at the same regions? Computer Vision and Image Understanding, 163:90–100, 2017.
- [16] Tao Deng, Hongmei Yan, Long Qin, Thuyen Ngo, and BS Manjunath. How do drivers allocate their potential attention? driving fixation prediction via convolutional neural networks. IEEE Transactions on Intelligent Transportation Systems, 2019.
- [17] Gabriel Diaz, Joseph Cooper, Constantin Rothkopf, and Mary Hayhoe. Saccades to future ball location reveal memory-based prediction in a virtual-reality interception task. Journal of Vision, 13(1):20–20, 2013.
- [18] Rachit Dubey, Pulkit Agrawal, Deepak Pathak, Thomas L Griffiths, and Alexei A Efros. Investigating human priors for playing video games. arXiv preprint arXiv:1802.10217, 2018.
- [19] Michael Eickenberg, Alexandre Gramfort, Gaël Varoquaux, and Bertrand Thirion. Seeing it all: Convolutional network layers map the function of the human visual system. NeuroImage, 152:184–194, 2017.
- [20] Gunnar Farnebäck. Two-frame motion estimation based on polynomial expansion. Image analysis, pages 363–370, 2003.
- [21] William Fedus, Carles Gelada, Yoshua Bengio, Marc G Bellemare, and Hugo Larochelle. Hyperbolic discounting and learning over multiple horizons. arXiv preprint arXiv:1902.06865, 2019.
- [22] Ruth C Fong and Andrea Vedaldi. Interpretable explanations of black boxes by meaningful perturbation. In Proceedings of the IEEE International Conference on Computer Vision, pages 3429–3437, 2017.
- [23] Samuel Greydanus, Anurag Koul, Jonathan Dodge, and Alan Fern. Visualizing and understanding atari agents. In International Conference on Machine Learning, pages 1792–1801, 2018.
- [24] Christopher Grimm, Dilip Arumugam, Siddharth Karamcheti, David Abel, Lawson LS Wong, and Michael L Littman. Modeling latent attention within neural networks. arXiv preprint arXiv:1706.00536, 2017.
- [25] Piyush Gupta, Nikaash Puri, Sukriti Verma, Sameer Singh, Dhruv Kayastha, Shripad Deshmukh, and Balaji Krishnamurthy. Explain your move: Understanding agent actions using focused feature saliency. arXiv preprint arXiv:1912.12191, 2019.
- [26] Sen He, Hamed R Tavakoli, Ali Borji, Yang Mi, and Nicolas Pugeault. Understanding and visualizing deep visual saliency models. In Proceedings of the IEEE Conference on Computer Vision and Pattern Recognition, pages 10206–10215, 2019.
- [27] Sen He, Hamed R Tavakoli, Ali Borji, and Nicolas Pugeault. Human attention in image captioning: Dataset and analysis. In Proceedings of the IEEE International Conference on Computer Vision, pages 8529–8538, 2019.
- [28] Matteo Hessel, Joseph Modayil, Hado Van Hasselt, Tom Schaul, Georg Ostrovski, Will Dabney, Dan Horgan, Bilal Piot, Mohammad Azar, and David Silver. Rainbow: Combining improvements in deep reinforcement learning. In Thirty-Second AAAI Conference on Artificial Intelligence, 2018.
- [29] Alexandre Heuillet, Fabien Couthouis, and Natalia Díaz-Rodríguez. Explainability in deep reinforcement learning. Knowledge-Based Systems, page 106685, 2020.
- [30] Ashley Hill, Antonin Raffin, Maximilian Ernestus, Adam Gleave, Anssi Kanervisto, Rene Traore, Prafulla Dhariwal, Christopher Hesse, Oleg Klimov, Alex Nichol, Matthias Plappert, Alec Radford, John Schulman, Szymon Sidor, and Yuhuai Wu. Stable baselines. https://github.com/hill-a/stable-baselines, 2018.
- [31] Tobias Huber, Benedikt Limmer, and Elisabeth André. Benchmarking perturbation-based saliency maps for explaining deep reinforcement learning agents. arXiv preprint arXiv:2101.07312, 2021.
- [32] Alexander G Huth, Wendy A De Heer, Thomas L Griffiths, Frédéric E Theunissen, and Jack L Gallant. Natural speech reveals the semantic maps that tile human cerebral cortex. Nature, 532(7600):453–458, 2016.
- [33] Laurent Itti, Christof Koch, and Ernst Niebur. A model of saliency-based visual attention for rapid scene analysis. IEEE Transactions on Pattern Analysis & Machine Intelligence, (11):1254–1259, 1998.
- [34] Rahul Iyer, Yuezhang Li, Huao Li, Michael Lewis, Ramitha Sundar, and Katia Sycara. Transparency and explanation in deep reinforcement learning neural networks. In Proceedings of the 2018 AAAI/ACM Conference on AI, Ethics, and Society, pages 144–150, 2018.
- [35] Shailee Jain and Alexander Huth. Incorporating context into language encoding models for fmri. In Advances in Neural Information Processing Systems, pages 6628–6637, 2018.
- [36] Theo Jaunet, Romain Vuillemot, and Christian Wolf. Drlviz: Understanding decisions and memory in deep reinforcement learning. arXiv preprint arXiv:1909.02982, 2019.
- [37] Nan Jiang, Alex Kulesza, Satinder Singh, and Richard Lewis. The dependence of effective planning horizon on model accuracy. In Proceedings of the 2015 International Conference on Autonomous Agents and Multiagent Systems, pages 1181–1189, 2015.
- [38] Leif Johnson, Brian Sullivan, Mary Hayhoe, and Dana Ballard. Predicting human visuomotor behaviour in a driving task. Philosophical Transactions of the Royal Society B: Biological Sciences, 369(1636):20130044, 2014.
- [39] Ho-Taek Joo and Kyung-Joong Kim. Visualization of deep reinforcement learning using grad-cam: How ai plays atari games? In 2019 IEEE Conference on Games (CoG), pages 1–2. IEEE, 2019.
- [40] Qiuxia Lai, Wenguan Wang, Salman Khan, Jianbing Shen, Hanqiu Sun, and Ling Shao. Humantextit vs machine attention in neural networks: A comparative study. arXiv preprint arXiv:1906.08764, 2019.
- [41] Brenden M Lake, Tomer D Ullman, Joshua B Tenenbaum, and Samuel J Gershman. Building machines that learn and think like people. Behavioral and Brain Sciences, 40, 2017.
- [42] Olivier Le Meur and Thierry Baccino. Methods for comparing scanpaths and saliency maps: strengths and weaknesses. Behavior research methods, 45(1):251–266, 2013.
- [43] Yuan Chang Leong, Angela Radulescu, Reka Daniel, Vivian DeWoskin, and Yael Niv. Dynamic interaction between reinforcement learning and attention in multidimensional environments. Neuron, 93(2):451–463, 2017.
- [44] Yin Li, Miao Liu, and James M Rehg. In the eye of beholder: Joint learning of gaze and actions in first person video. In European Conference on Computer Vision (ECCV), pages 619–635, 2018.
- [45] Aravindh Mahendran and Andrea Vedaldi. Visualizing deep convolutional neural networks using natural pre-images. International Journal of Computer Vision, 120(3):233–255, 2016.
- [46] Josh Merel, Diego Aldarondo, Jesse Marshall, Yuval Tassa, Greg Wayne, and Bence Ölveczky. Deep neuroethology of a virtual rodent. arXiv preprint arXiv:1911.09451, 2019.
- [47] Volodymyr Mnih, Adria Puigdomenech Badia, Mehdi Mirza, Alex Graves, Timothy Lillicrap, Tim Harley, David Silver, and Koray Kavukcuoglu. Asynchronous methods for deep reinforcement learning. In International conference on machine learning, pages 1928–1937, 2016.
- [48] Volodymyr Mnih, Koray Kavukcuoglu, David Silver, Andrei A Rusu, Joel Veness, Marc G Bellemare, Alex Graves, Martin Riedmiller, Andreas K Fidjeland, Georg Ostrovski, et al. Human-level control through deep reinforcement learning. Nature, 518(7540):529–533, 2015.
- [49] Steven Moore and John C Stamper. Exploring expertise through visualizing agent policies and human strategies in open-ended games. In EDM (Workshops), pages 30–37, 2019.
- [50] Alexander Mott, Daniel Zoran, Mike Chrzanowski, Daan Wierstra, and Danilo Jimenez Rezende. Towards interpretable reinforcement learning using attention augmented agents. In Advances in Neural Information Processing Systems, pages 12329–12338, 2019.
- [51] Sajad Mousavi, Michael Schukat, Enda Howley, Ali Borji, and Nasser Mozayani. Learning to predict where to look in interactive environments using deep recurrent q-learning. arXiv preprint arXiv:1612.05753, 2016.
- [52] Satya M Muddamsetty, Mohammad NS Jahromi, Andreea E Ciontos, Laura M Fenoy, and Thomas B Moeslund. Introducing and assessing the explainable ai (xai) method: Sidu. arXiv preprint arXiv:2101.10710, 2021.
- [53] Tam V Nguyen, Qi Zhao, and Shuicheng Yan. Attentive systems: A survey. International Journal of Computer Vision, 126(1):86–110, 2018.
- [54] Dmitry Nikulin, Anastasia Ianina, Vladimir Aliev, and Sergey Nikolenko. Free-lunch saliency via attention in atari agents. arXiv preprint arXiv:1908.02511, 2019.
- [55] Andrea Palazzi, Davide Abati, Simone Calderara, Francesco Solera, and Rita Cucchiara. Predicting the driver’s focus of attention: the dr (eye) ve project. IEEE Transactions on Pattern Analysis and Machine Intelligence, 2018.
- [56] Michael I Posner. Orienting of attention. Quarterly Journal of Experimental Psychology, 32(1):3–25, 1980.
- [57] Erika Puiutta and Eric MSP Veith. Explainable reinforcement learning: A survey. In International Cross-Domain Conference for Machine Learning and Knowledge Extraction, pages 77–95. Springer, 2020.
- [58] Nikaash Puri, Sukriti Verma, Piyush Gupta, Dhruv Kayastha, Shripad Deshmukh, Balaji Krishnamurthy, and Sameer Singh. Explain your move: Understanding agent actions using specific and relevant feature attribution. In International Conference on Learning Representations, 2019.
- [59] LAI Qiuxia, Salman Khan, Yongwei Nie, Sun Hanqiu, Jianbing Shen, and Ling Shao. Understanding more about human and machine attention in deep neural networks. IEEE Transactions on Multimedia, 2020.
- [60] Marco Tulio Ribeiro, Sameer Singh, and Carlos Guestrin. " why should i trust you?" explaining the predictions of any classifier. In Proceedings of the 22nd ACM SIGKDD International Conference on Knowledge Discovery and Data Mining, pages 1135–1144, 2016.
- [61] DA Robinson. The mechanics of human saccadic eye movement. The Journal of physiology, 174(2):245–264, 1964.
- [62] Constantin A Rothkopf, Dana H Ballard, and Mary M Hayhoe. Task and context determine where you look. Journal of Vision, 7(14):16–16, 2007.
- [63] Tim Salimans, Jonathan Ho, Xi Chen, Szymon Sidor, and Ilya Sutskever. Evolution strategies as a scalable alternative to reinforcement learning. arXiv preprint arXiv:1703.03864, 2017.
- [64] Akanksha Saran, Ruohan Zhang, Elaine Schaertl Short, and Scott Niekum. Efficiently guiding imitation learning algorithms with human gaze. arXiv preprint arXiv:2002.12500, 2020.
- [65] John Schulman, Filip Wolski, Prafulla Dhariwal, Alec Radford, and Oleg Klimov. Proximal policy optimization algorithms. arXiv preprint arXiv:1707.06347, 2017.
- [66] Ramprasaath R Selvaraju, Michael Cogswell, Abhishek Das, Ramakrishna Vedantam, Devi Parikh, and Dhruv Batra. Grad-cam: Visual explanations from deep networks via gradient-based localization. In Proceedings of the IEEE International Conference on Computer Vision, pages 618–626, 2017.
- [67] Wenjie Shi, Zhuoyuan Wang, Shiji Song, and Gao Huang. Self-supervised discovering of causal features: Towards interpretable reinforcement learning. arXiv preprint arXiv:2003.07069, 2020.
- [68] Avanti Shrikumar, Peyton Greenside, and Anshul Kundaje. Learning important features through propagating activation differences. In Proceedings of the 34th International Conference on Machine Learning-Volume 70, pages 3145–3153. JMLR. org, 2017.
- [69] Karen Simonyan, Andrea Vedaldi, and Andrew Zisserman. Deep inside convolutional networks: Visualising image classification models and saliency maps. arXiv preprint arXiv:1312.6034, 2013.
- [70] Jost Tobias Springenberg, Alexey Dosovitskiy, Thomas Brox, and Martin Riedmiller. Striving for simplicity: The all convolutional net. arXiv preprint arXiv:1412.6806, 2014.
- [71] Felipe Petroski Such, Vashisht Madhavan, Edoardo Conti, Joel Lehman, Kenneth O Stanley, and Jeff Clune. Deep neuroevolution: Genetic algorithms are a competitive alternative for training deep neural networks for reinforcement learning. arXiv preprint arXiv:1712.06567, 2017.
- [72] Felipe Petroski Such, Vashisht Madhavan, Rosanne Liu, Rui Wang, Pablo Samuel Castro, Yulun Li, Jiale Zhi, Ludwig Schubert, Marc G Bellemare, Jeff Clune, et al. An atari model zoo for analyzing, visualizing, and comparing deep reinforcement learning agents. In Proceedings of the 28th International Joint Conference on Artificial Intelligence, pages 3260–3267. AAAI Press, 2019.
- [73] Mukund Sundararajan, Ankur Taly, and Qiqi Yan. Axiomatic attribution for deep networks. In Proceedings of the 34th International Conference on Machine Learning-Volume 70, pages 3319–3328. JMLR. org, 2017.
- [74] Hamed R Tavakoli, Rakshith Shetty, Ali Borji, and Jorma Laaksonen. Paying attention to descriptions generated by image captioning models. In Proceedings of the IEEE International Conference on Computer Vision, pages 2487–2496, 2017.
- [75] Jan Theeuwes, Artem Belopolsky, and Christian NL Olivers. Interactions between working memory, attention and eye movements. Acta psychologica, 132(2):106–114, 2009.
- [76] Pedro A Tsividis, Thomas Pouncy, Jacqueline L Xu, Joshua B Tenenbaum, and Samuel J Gershman. Human learning in atari. 2017.
- [77] Junpeng Wang, Liang Gou, Han-Wei Shen, and Hao Yang. Dqnviz: A visual analytics approach to understand deep q-networks. IEEE Transactions on Visualization and Computer Graphics, 25(1):288–298, 2018.
- [78] Laurens Weitkamp, Elise van der Pol, and Zeynep Akata. Visual rationalizations in deep reinforcement learning for atari games. In Benelux Conference on Artificial Intelligence, pages 151–165. Springer, 2018.
- [79] Erik Wijmans, Julian Straub, Dhruv Batra, Irfan Essa, Judy Hoffman, and Ari Morcos. Analyzing visual representations in embodied navigation tasks. arXiv preprint arXiv:2003.05993, 2020.
- [80] Daniel L Yamins, Ha Hong, Charles Cadieu, and James J DiCarlo. Hierarchical modular optimization of convolutional networks achieves representations similar to macaque it and human ventral stream. In Advances in Neural Information Processing Systems, pages 3093–3101, 2013.
- [81] Daniel LK Yamins, Ha Hong, Charles F Cadieu, Ethan A Solomon, Darren Seibert, and James J DiCarlo. Performance-optimized hierarchical models predict neural responses in higher visual cortex. Proceedings of the National Academy of Sciences, 111(23):8619–8624, 2014.
- [82] Zhao Yang, Song Bai, Li Zhang, and Philip HS Torr. Learn to interpret atari agents. arXiv preprint arXiv:1812.11276, 2018.
- [83] Matthew D Zeiler. Adadelta: an adaptive learning rate method. arXiv preprint arXiv:1212.5701, 2012.
- [84] Matthew D Zeiler and Rob Fergus. Visualizing and understanding convolutional networks. In European Conference on Computer Vision (ECCV), pages 818–833. Springer, 2014.
- [85] Jianming Zhang, Sarah Adel Bargal, Zhe Lin, Jonathan Brandt, Xiaohui Shen, and Stan Sclaroff. Top-down neural attention by excitation backprop. International Journal of Computer Vision, 126(10):1084–1102, 2018.
- [86] Ruohan Zhang, Zhuode Liu, Luxin Zhang, Jake A Whritner, Karl S Muller, Mary M Hayhoe, and Dana H Ballard. Agil: Learning attention from human for visuomotor tasks. In European Conference on Computer Vision (ECCV), pages 692–707. Springer, 2018.
- [87] Ruohan Zhang, Akanksha Saran, Bo Liu, Yifeng Zhu, Sihang Guo, Scott Niekum, Dana Ballard, and Mary Hayhoe. Human gaze assisted artificial intelligence: A review. In IJCAI: proceedings of the conference, volume 2020, page 4951. NIH Public Access, 2020.
- [88] Ruohan Zhang, Calen Walshe, Zhuode Liu, Lin Guan, Karl S Muller, Jake A Whritner, Luxin Zhang, Mary M Hayhoe, and Dana H Ballard. Atari-head: Atari human eye-tracking and demonstration dataset. In Thirty-Fourth AAAI Conference on Artificial Intelligence. AAAI Press, 2020.
- [89] Bolei Zhou, Aditya Khosla, Agata Lapedriza, Aude Oliva, and Antonio Torralba. Learning deep features for discriminative localization. In Proceedings of the IEEE Conference on Computer Vision and Pattern Recognition, pages 2921–2929, 2016.
- [90] Luisa M Zintgraf, Taco S Cohen, Tameem Adel, and Max Welling. Visualizing deep neural network decisions: Prediction difference analysis. arXiv preprint arXiv:1702.04595, 2017.
Appendix 1: Implementations Details
Human Gaze Prediction Models
In order to get human saliency maps for the data generated by reinforcement learning (RL) agents, we need a model that can predict human attention. We have found that the accuracy of such a model is critical for making attention comparison meaningful. Here we discuss details for implementing human attention models. The data we use is from the Atari-HEAD dataset [88]222Available for download at: https://zenodo.org/record/3451402. The trained models and network architecture will be made available online. The prediction results for each individual game is shown in Table 1.
-
•
Input image preprocessing: The images are reshaped from to with bilinear interpolation and converted into grayscale. Then we scale the pixel values to be in the range of by dividing them by 255. So the inputs are consistent with the inputs to the reinforcement learning agents.
- •
-
•
Model architecture: The human gaze prediction model is adapted from [88]. The network has three convolution layers followed by three deconvolution layers. Their parameters are as follows:
-
–
Convolution layer 1: 32 filters, kernel size , stride , followed by relu activation, batch normalization, and dropout.
-
–
Convolution layer 2: 64 filters, kernel size , stride , followed by relu activation, batch normalization, and dropout.
-
–
Convolution layer 3: 64 filters, kernel size , stride , followed by relu activation, batch normalization, and dropout.
-
–
Deconvolution layer 1: 64 filters, kernel size , stride , followed by relu activation, batch normalization, and dropout.
-
–
Deconvolution layer 2: 64 filters, kernel size , stride , followed by relu activation, batch normalization, and dropout.
-
–
Deconvolution layer 3: 1 filter, kernel size , stride , followed by a softmax layer.
The network is implemented using Tensorflow 1.8.0 and Keras 2.1.5. The same deep network architecture and hyperparameters are used for all games.
-
–
-
•
Optimizer: The optimizer is Adadelta which is a method with adaptive learning rate [83]. We use learning rate , decay rate , and , batch size , number of training epochs .
-
•
Data: For each game, we use approximately 80% gaze data (16 trials) for training and 20% (4 trials) for testing. For this dataset, two adjacent images or gaze positions are highly correlated. We avoid putting one frame in the training set and its neighboring frame in the testing set by using complete trials as the testing set. This makes sure that the data belonging to the same trajectory will not end up in both training and testing.
-
•
Hardware: Training was conducted on server clusters with NVIDIA GTX 1080 and 1080Ti GPUs.
| Breakout | Freeway | Frostbite | Ms.Pac-Man | Montezuma | Seaquest | |
|---|---|---|---|---|---|---|
| AUC | 0.973 | 0.977 | 0.962 | 0.984 | 0.947 | 0.964 |
| CC | 0.575 | 0.627 | 0.515 | 0.666 | 0.447 | 0.546 |
| KL | 1.302 | 1.205 | 1.555 | 1.027 | 1.882 | 1.495 |
Motion and Saliency Baselines
We include two attention models in addition to human gaze. The first one captures the motion information, measured by Farneback optical flow between two consecutive images [20]. The function is implemented as follows:
import cv2
import numpy as np
# The function is: calcOpticalFlowFarneback(prev_img, next_img, flow,
# pyr_scale, levels, winsize, iterations, poly_n, poly_sigma, flags)
flow = cv2.calcOpticalFlowFarneback(prev, cur, None, 0.5, 3, 15, 3, 5, 1.1,
cv2.OPTFLOW_FARNEBACK_GAUSSIAN)
# we only use the information of magnitude
fx, fy = flow[:,:,0], flow[:,:,1]
flow = np.sqrt(fx*fx+fy*fy)
The second model captures salient low-level image features, including color, orientation, and intensity (weighted equally), computed by the classic Itti-Koch saliency model [33]. We use the Python implementation provided by https://github.com/akisatok/pySaliencyMap without modification except image dimensions.
Appendix 2: The Effects of Learning on Attention
In Appendix 2 to 5, we will show statistics and example images of each game. Atari games have very different reward mechanisms, visual features, and dynamics. Hence, it is often difficult to find an RL algorithm that works best for all games. We hope that, by showing results for individual games, researchers will gain insights into why a particular algorithm (like PPO here) performs well or poorly for a particular game.
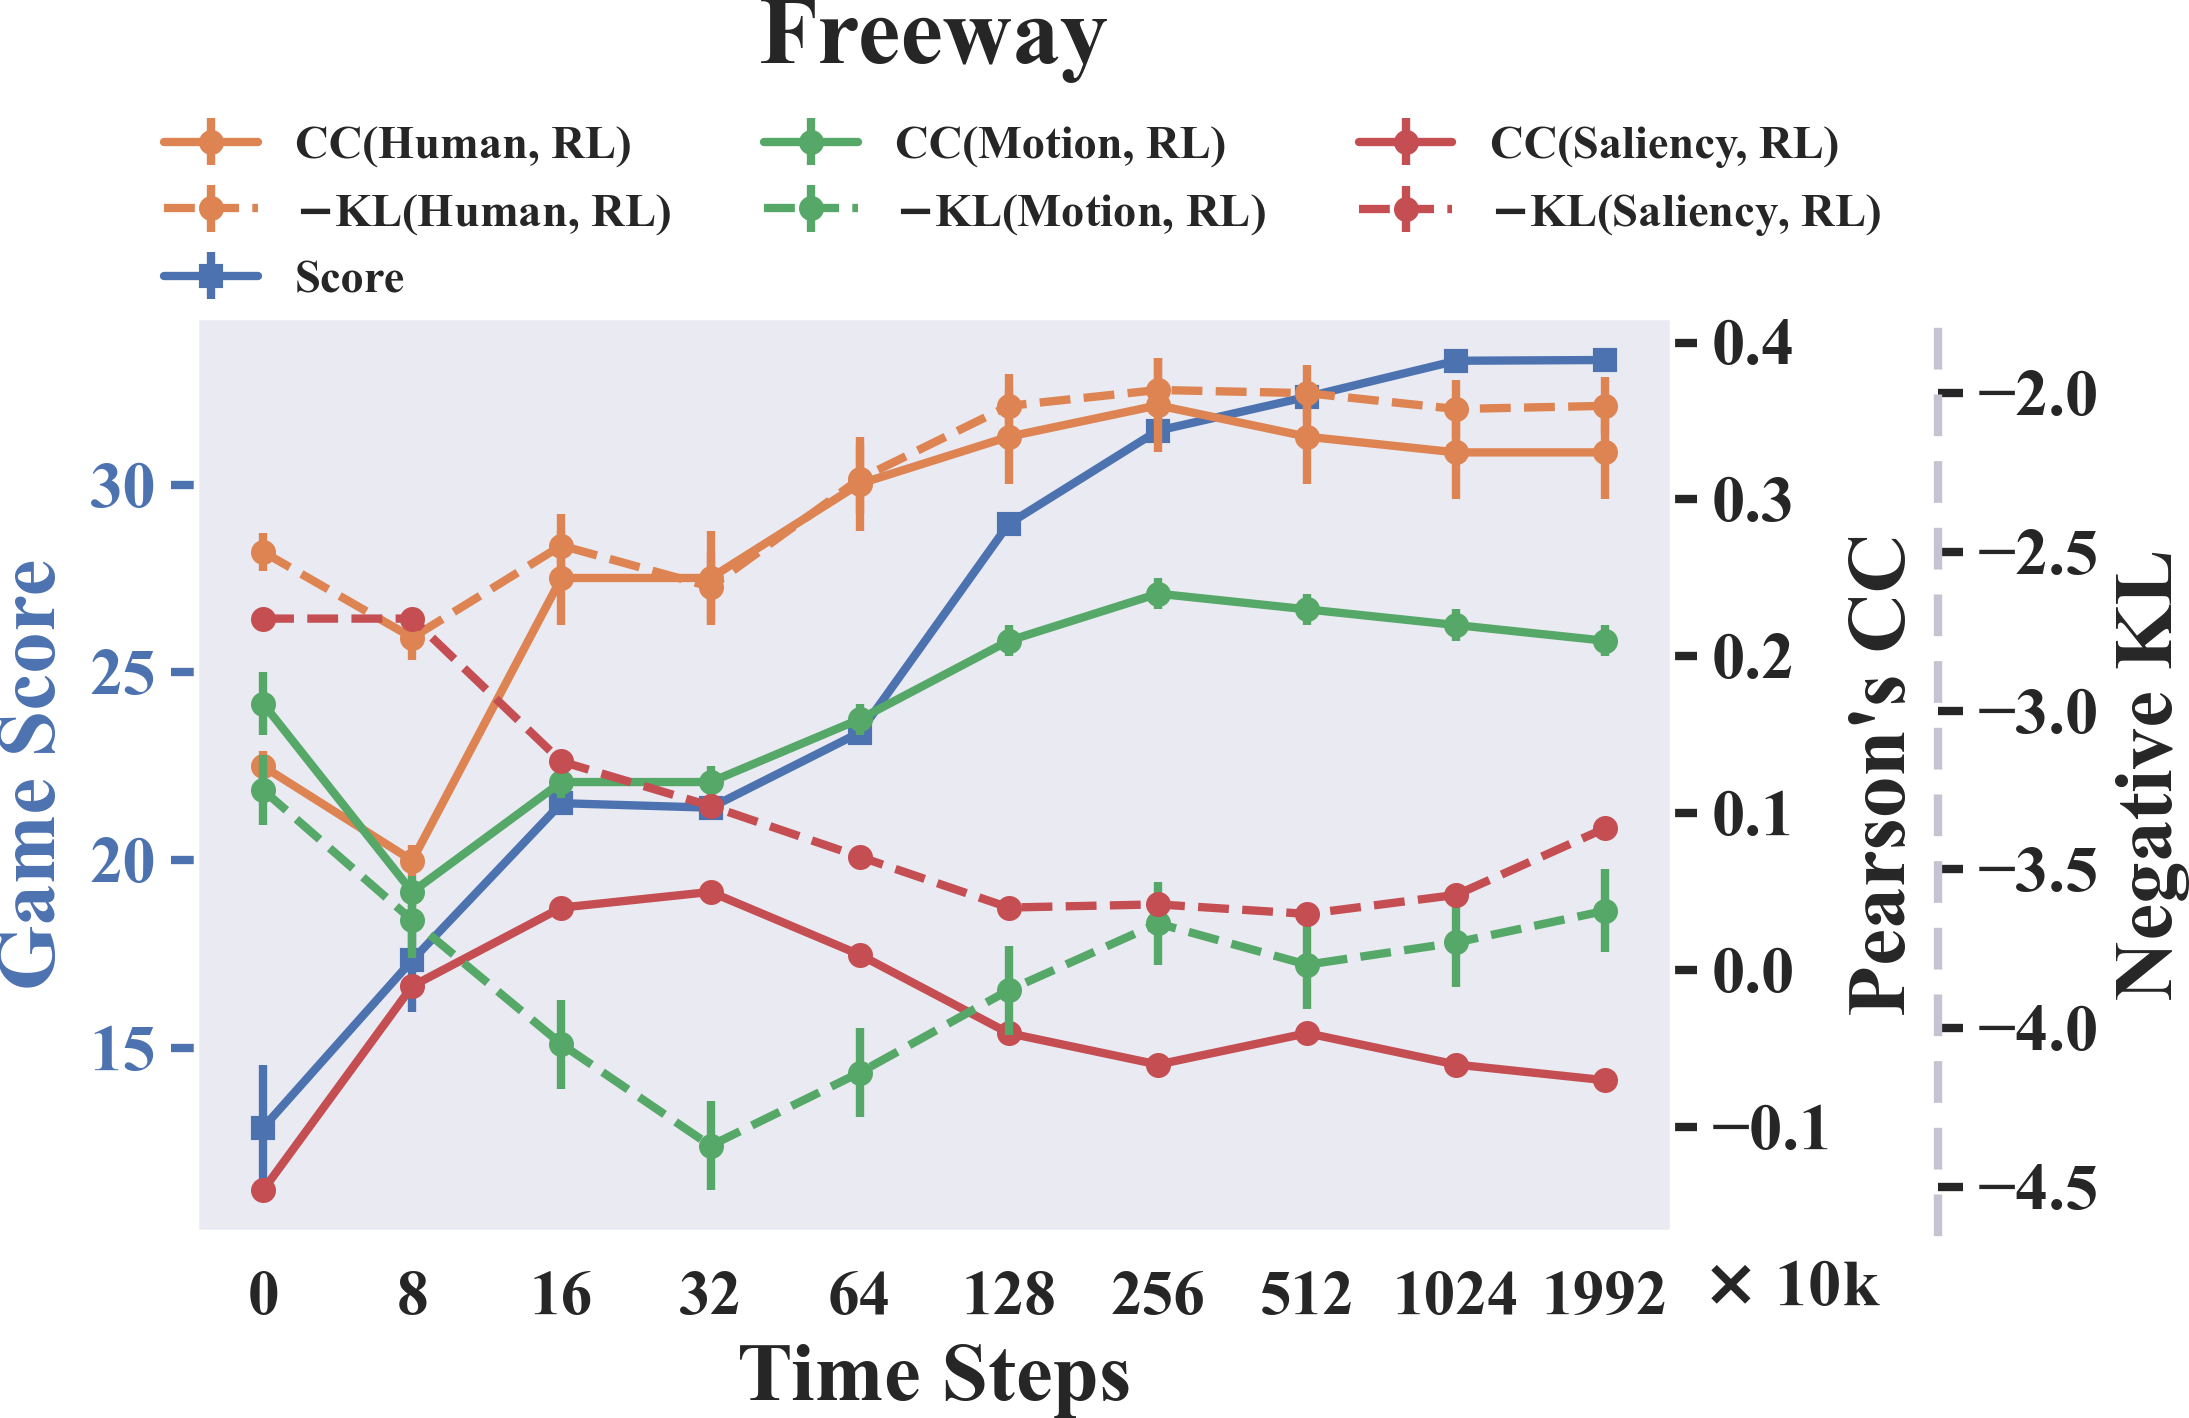
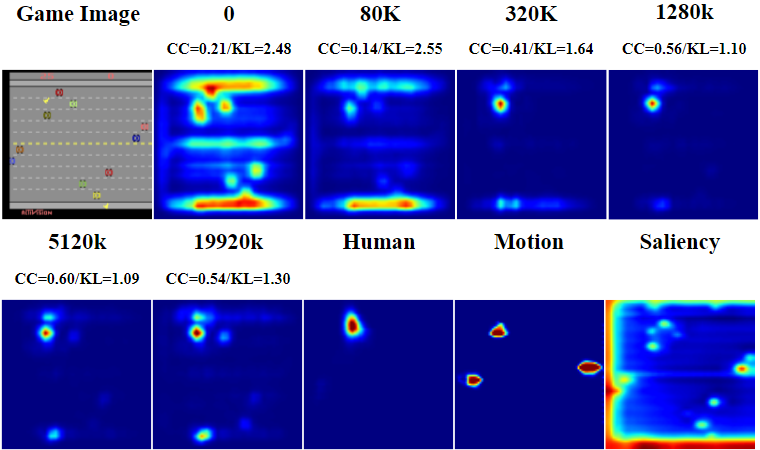
In Figure 1 to 6 we show how the attention of the RL agent (PPO) evolves over time compared to human attention. Part (a) of each figure shows the similarity metrics: Pearson’s Correlation Coefficient (CC) and negative Kullback-Leibler Divergence (KL) values over training time steps. The values are averaged over 100 images in the standard image set (as described in section 3.3). (a) also shows the game scores (averaged over 50 episodes) over training time steps. Part (b) of each figure shows an example game image. It also includes the average saliency maps of the RL agents during training and a human saliency map predicted by the human model for the selected game image. Note that KL values are negated for better visualization.

Appendix 3: The Effects of Discount Factors on Attention
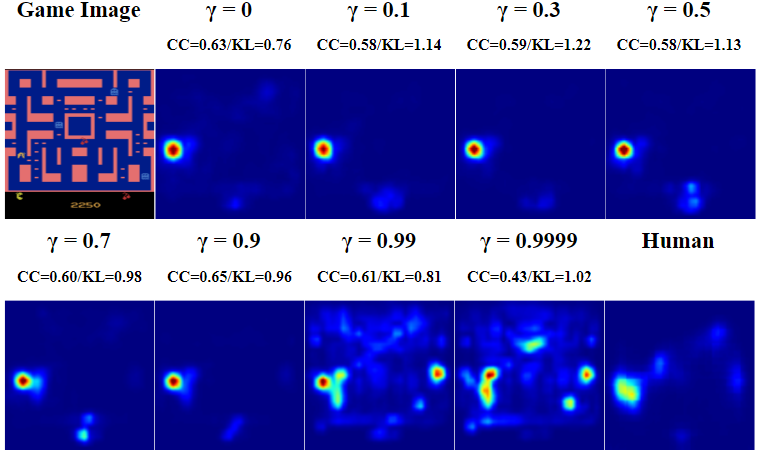
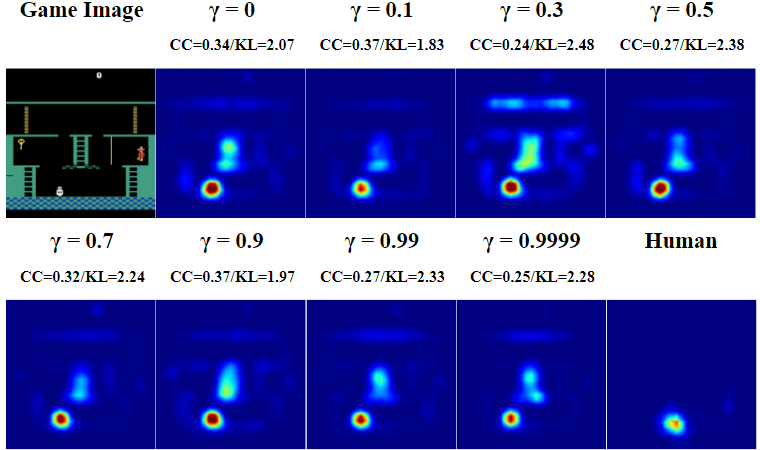
Similar to Appendix 2, Figure 7 to 12 shows how the attention of the RL agent (PPO) changes when we vary the discount factor, compared to human attention. is the default value for most RL algorithms [30, 65]. Each Figure (a) shows the similarity metrics: CC and negative KL values over different discount factors. The values are averaged over 100 images in the standard image set. (a) also shows the game scores (averaged over 50 episodes) over discount factors. Each Figure (b) shows an example game image, RL agents’ saliency maps with different discount factors , and human saliency map predicted by the human model. Note that KL values are negated for better visualization.

Appendix 4: Failure States Analysis
Figures 13 and 14 show RL agents’ saliency maps compared to human’s in failure states. These states are game frames right before the RL agent loses a “life” which incurs a large penalty in Atari games. This analysis is helpful in answering the question: Did RL agents make mistakes because they fail to attend to the right objects, or did they attend to the right objects but make wrong decisions? Figure 13 shows the games that belong to the former case, and Figure 14 shows the games that belong to the latter case. Freeway is excluded here since the PPO agent learned a policy that is nearly optimal.
Appendix 5: Generalizing to Unseen Data
This sections lists the parameters and figures when comparing RL agents’ and human’s saliency maps in unseen states. The unseen states are late-game states obtained from human experts’ which RL agents have not encountered (above the agents’ best score). The goal is to see whether RL agents’ attention can reasonably generalize to these unseen states. Table 2 shows the score threshold for choosing late-game states in each game and Figure 15 to 16 show RL agents’ saliency maps compared to human’s in the unseen states. Again, Freeway is excluded here since the PPO agent learned a policy that is nearly optimal.
| Game | Score Threshold |
|---|---|
| Breakout | 350 |
| Freeway | - |
| Frostbite | 320 |
| MontezumaRevenge | 0 |
| MsPacman | 3000 |
| Seaquest | 1800 |
| SpaceInvaders | 2000 |
Appendix 6: Other Deep RL Algorithms
There is a positive correlation between model performance (in terms of the game score, averaged over 50 episodes each) and similarity (in terms of CC on the standard image set) with human attention. Fig. 22 shows the result for Breakout, Freeway, Frostbite, and Seaquest (Ms.Pac-Man’s result is in the main text). Montezuma’s Revenge is excluded because most algorithms have a score of zero. Note algorithms such as DQN outputs state-action values instead of policy hence they will attend to game scores at the top or the bottom of the screen. In order to ensure a fair comparison for policy-based and value-based algorithms, we ignore attention that is on game scores when doing comparisons (by cropping out that part of the image when calculating the similarity), following the standard approach [23, 25, 31].
Appendix 7: The Effects of Learning and Discount Factors on Attention using Human Data
In this work, for experiments that we can use either RL or human data, we focused on the explainable RL issue and performed the analyses using RL data in the main text. Here we have performed the same analyses on the effects of learning and discount factors using human states and eye fixation data to confirm that using human data does not affect our main conclusions.
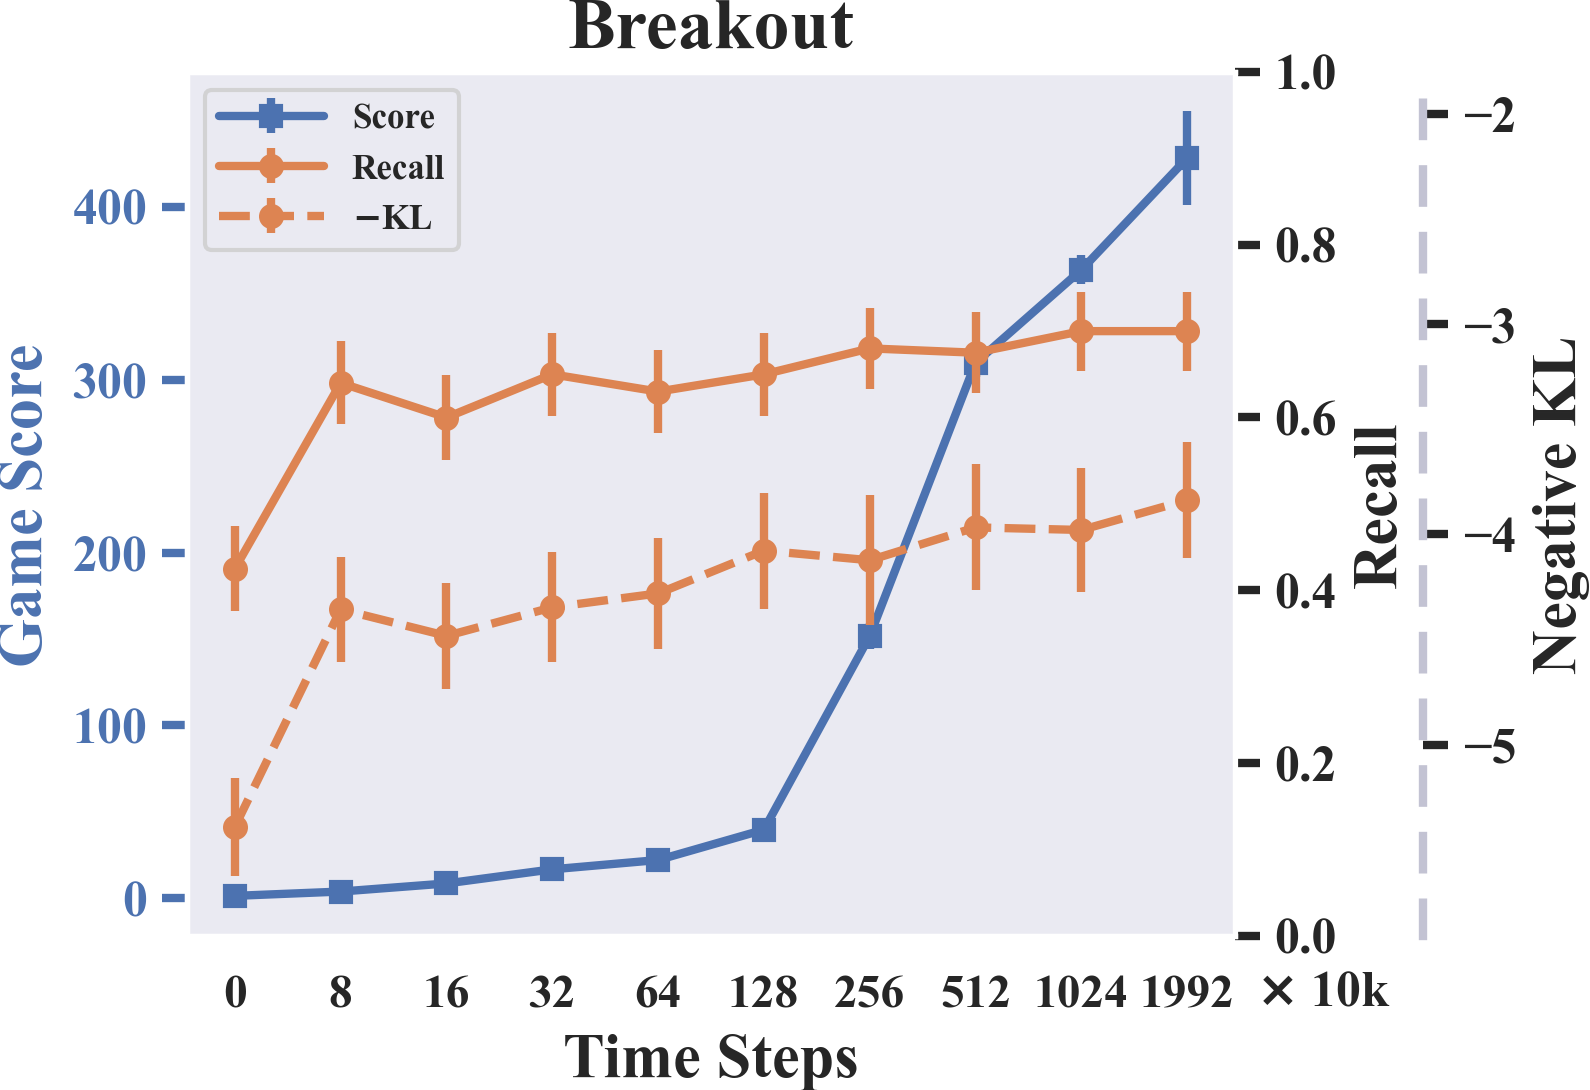
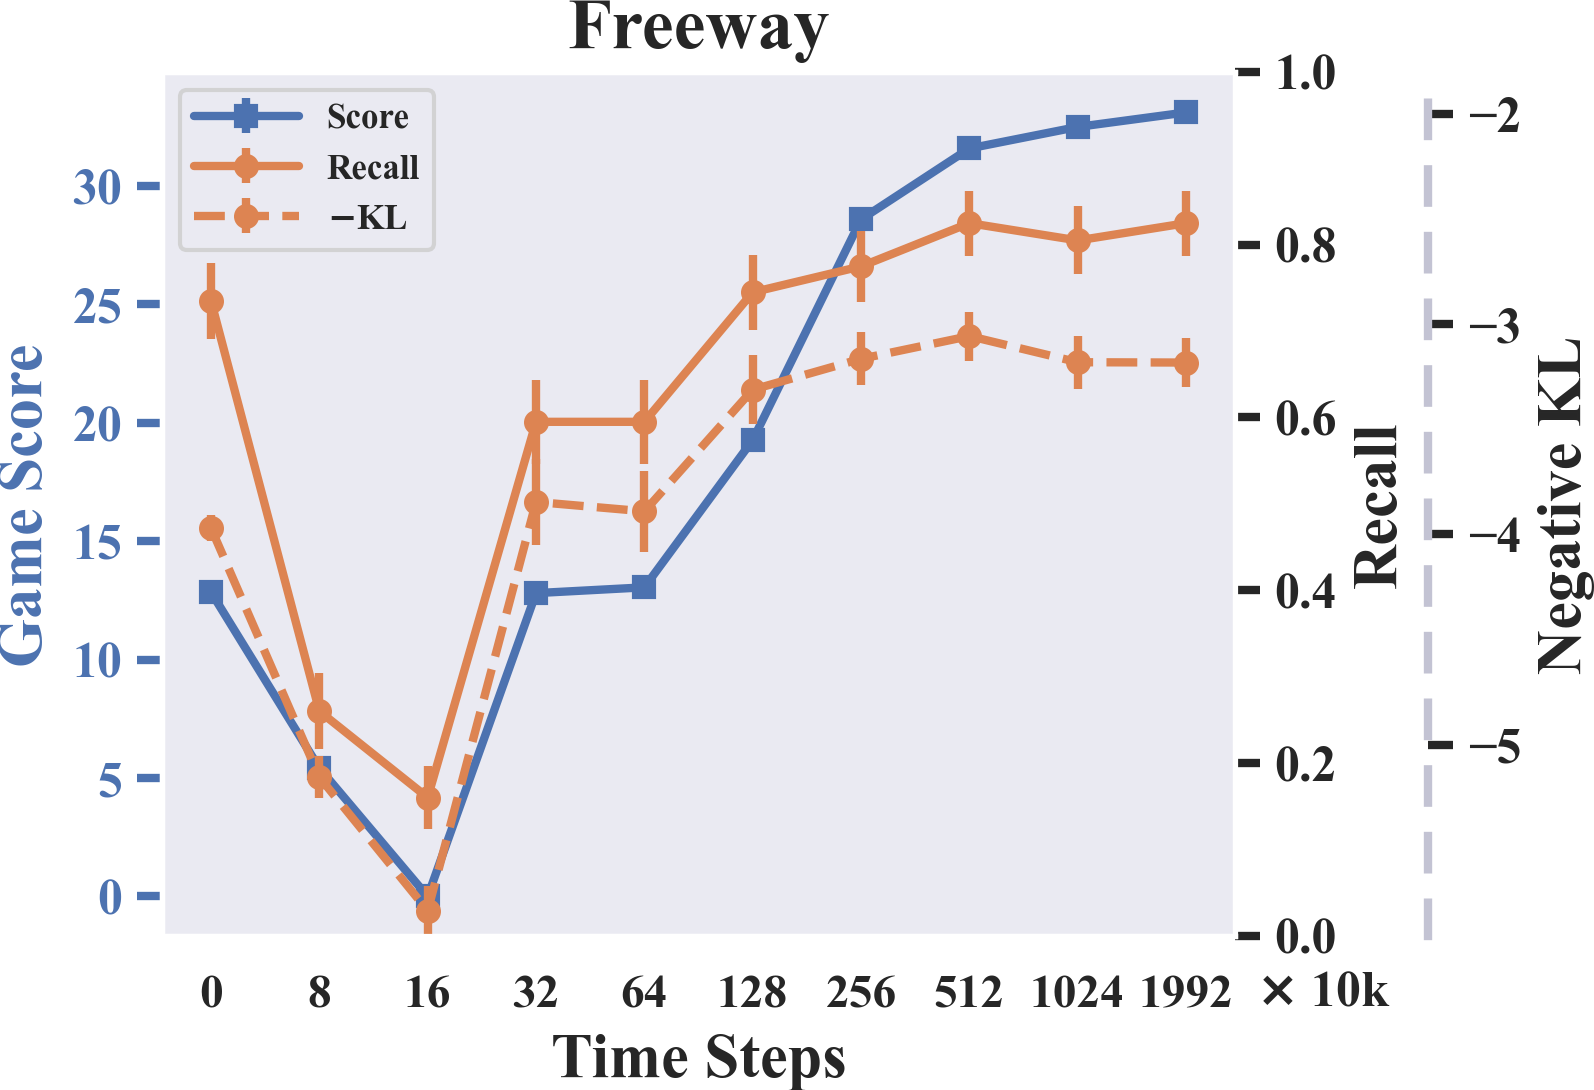
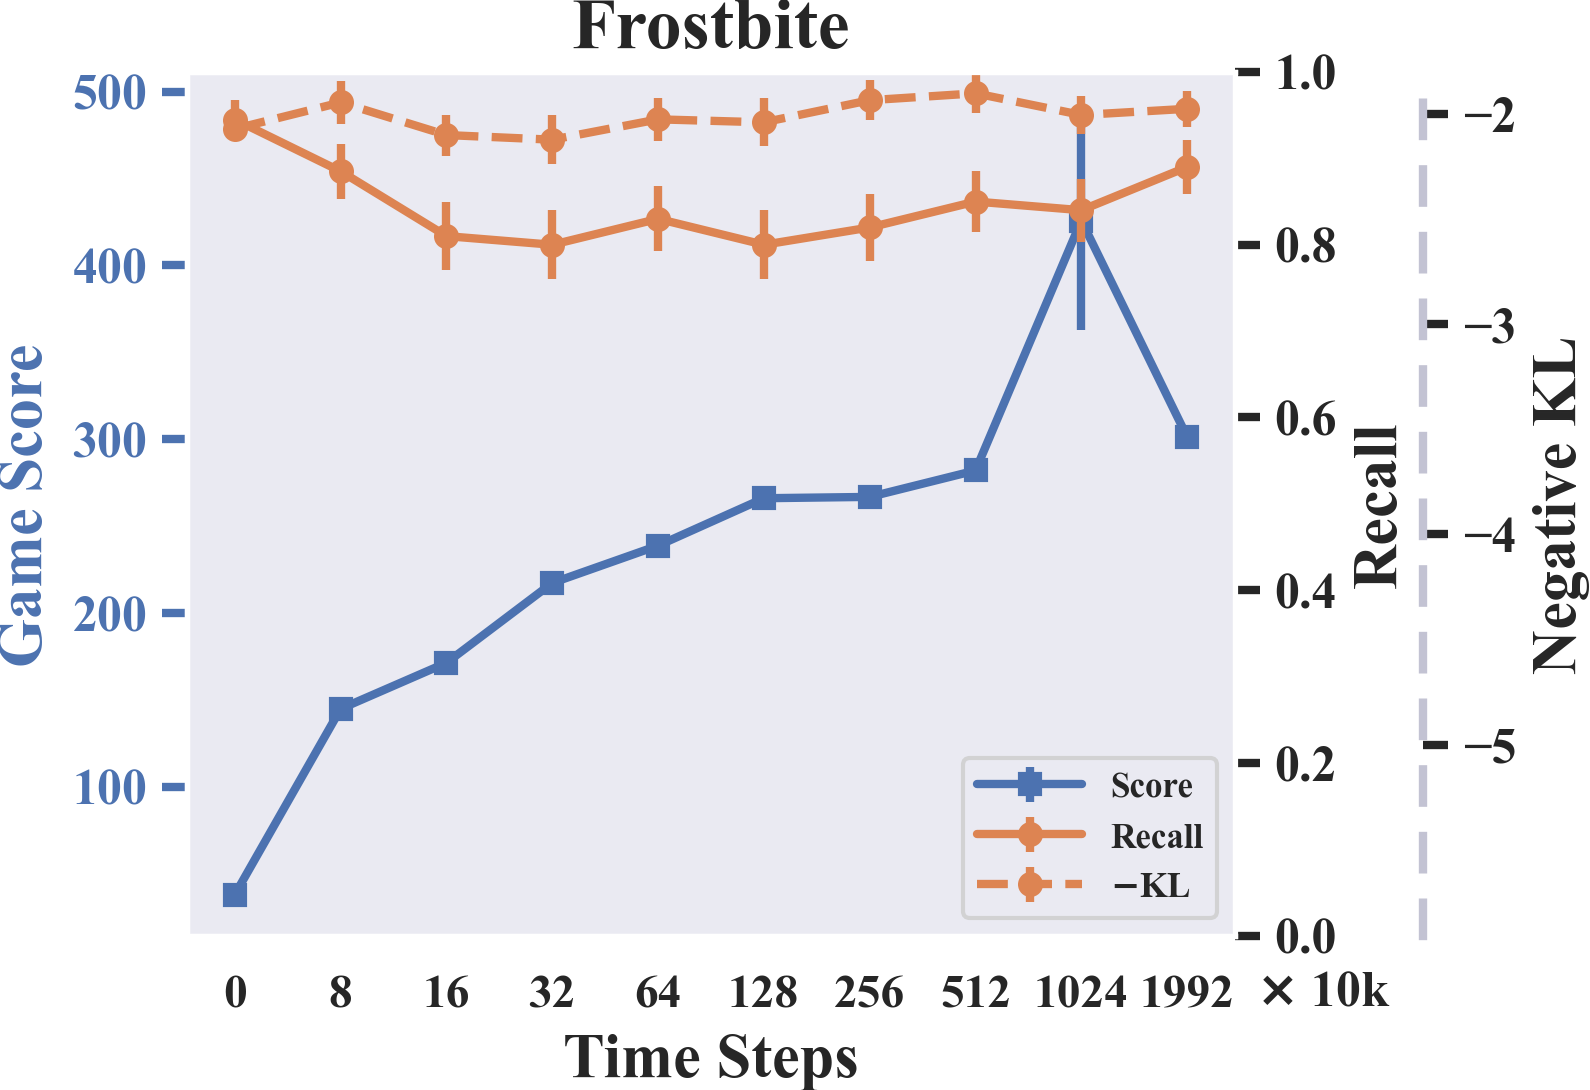
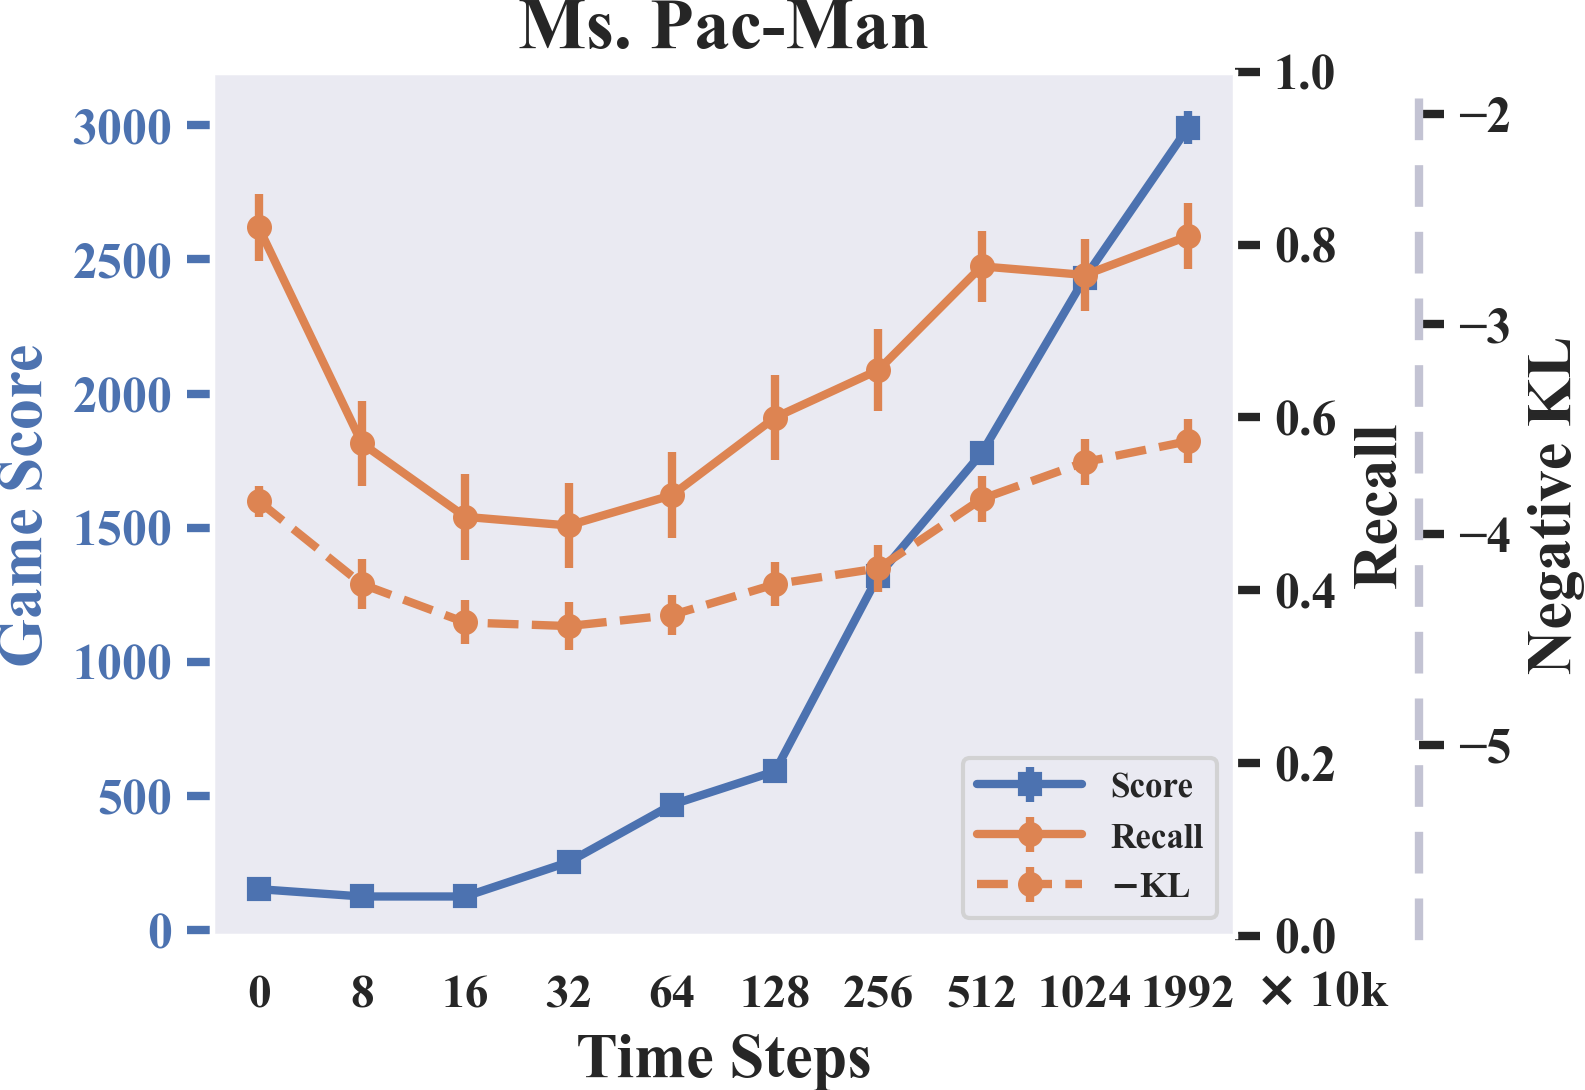
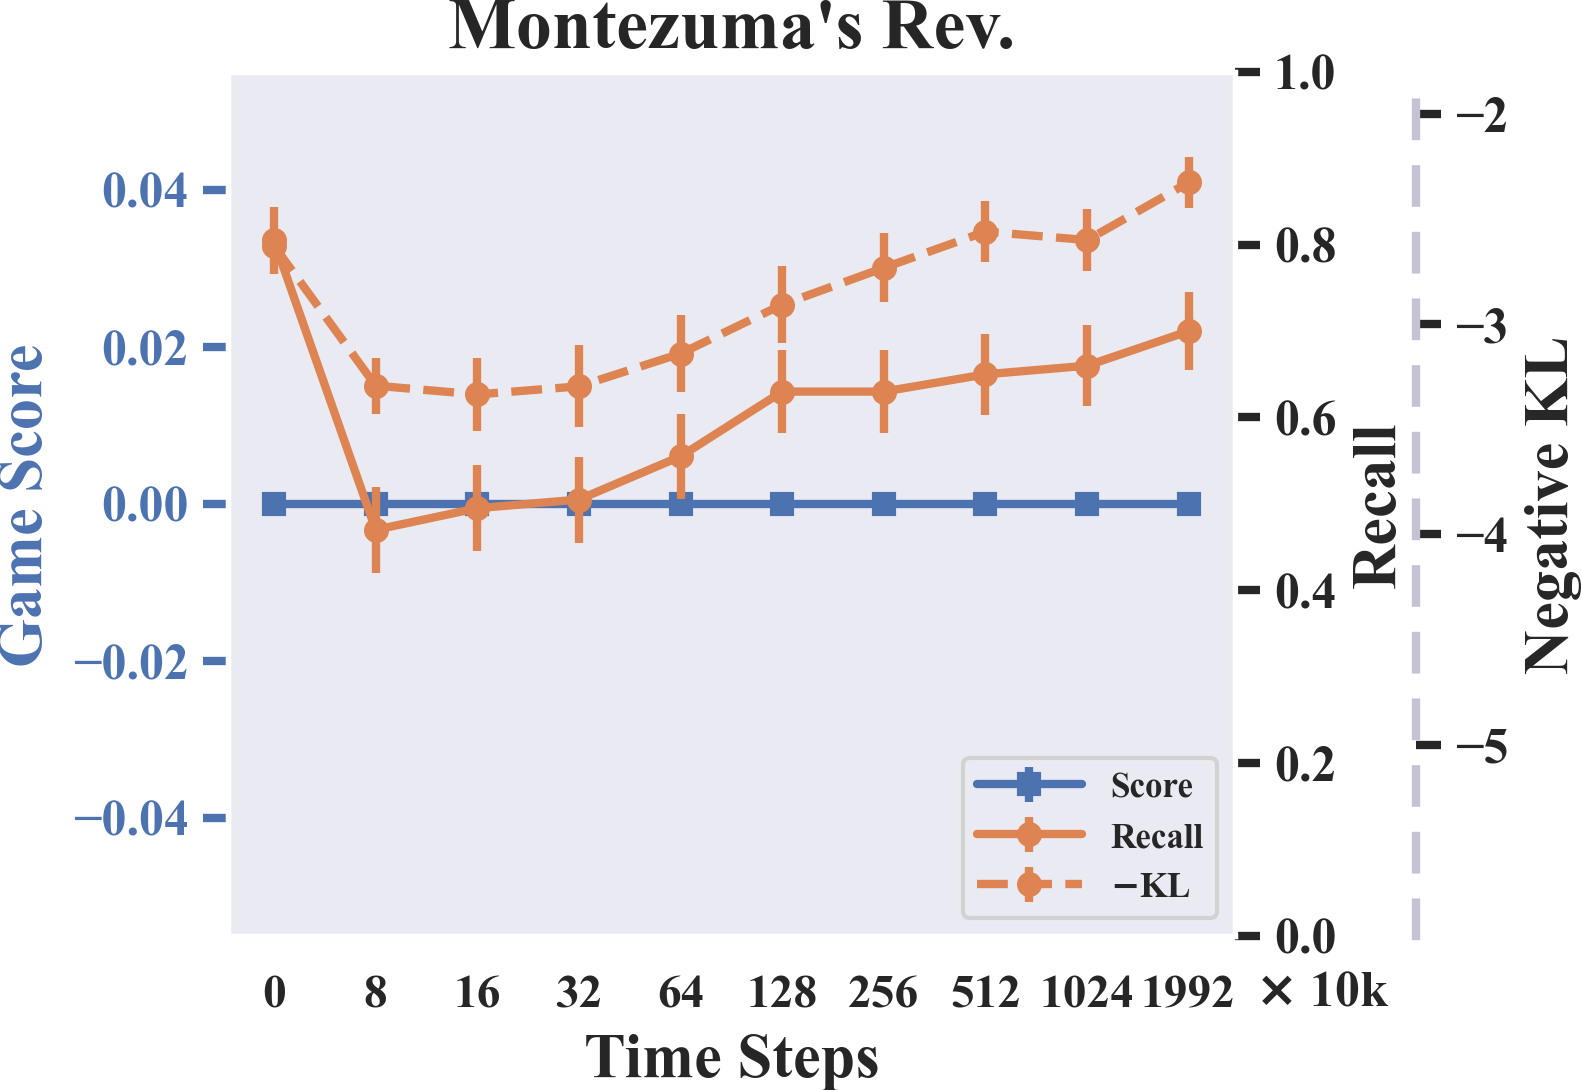
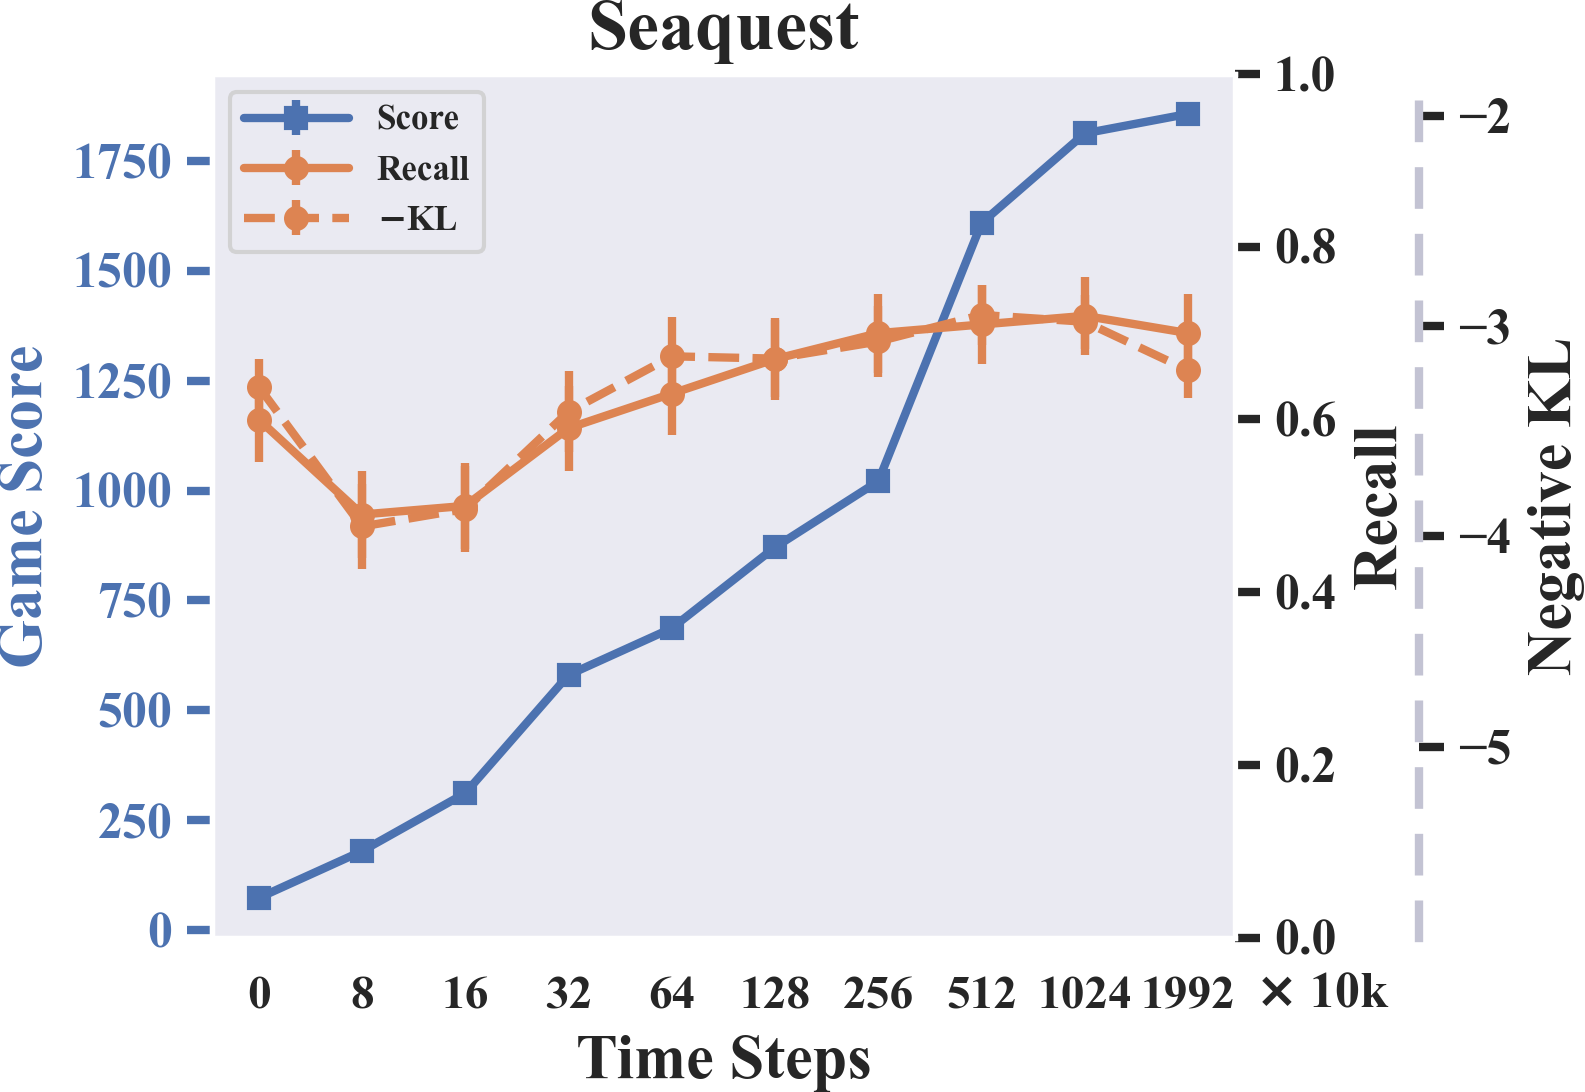
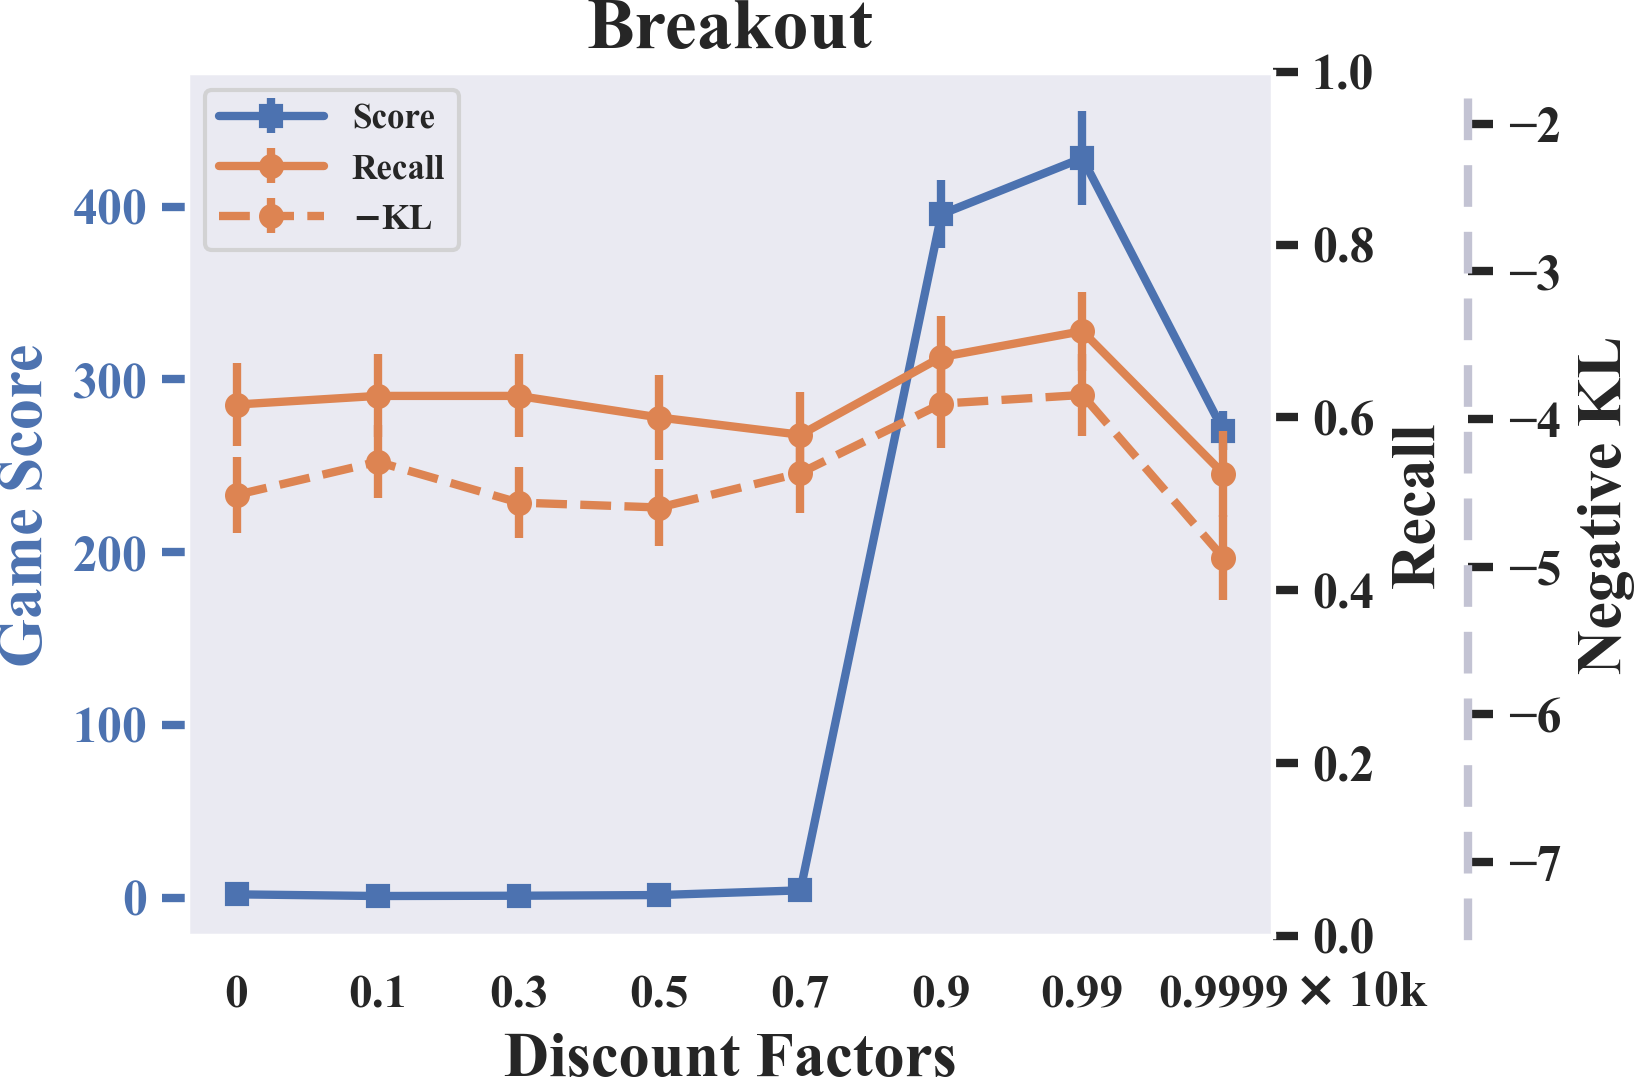
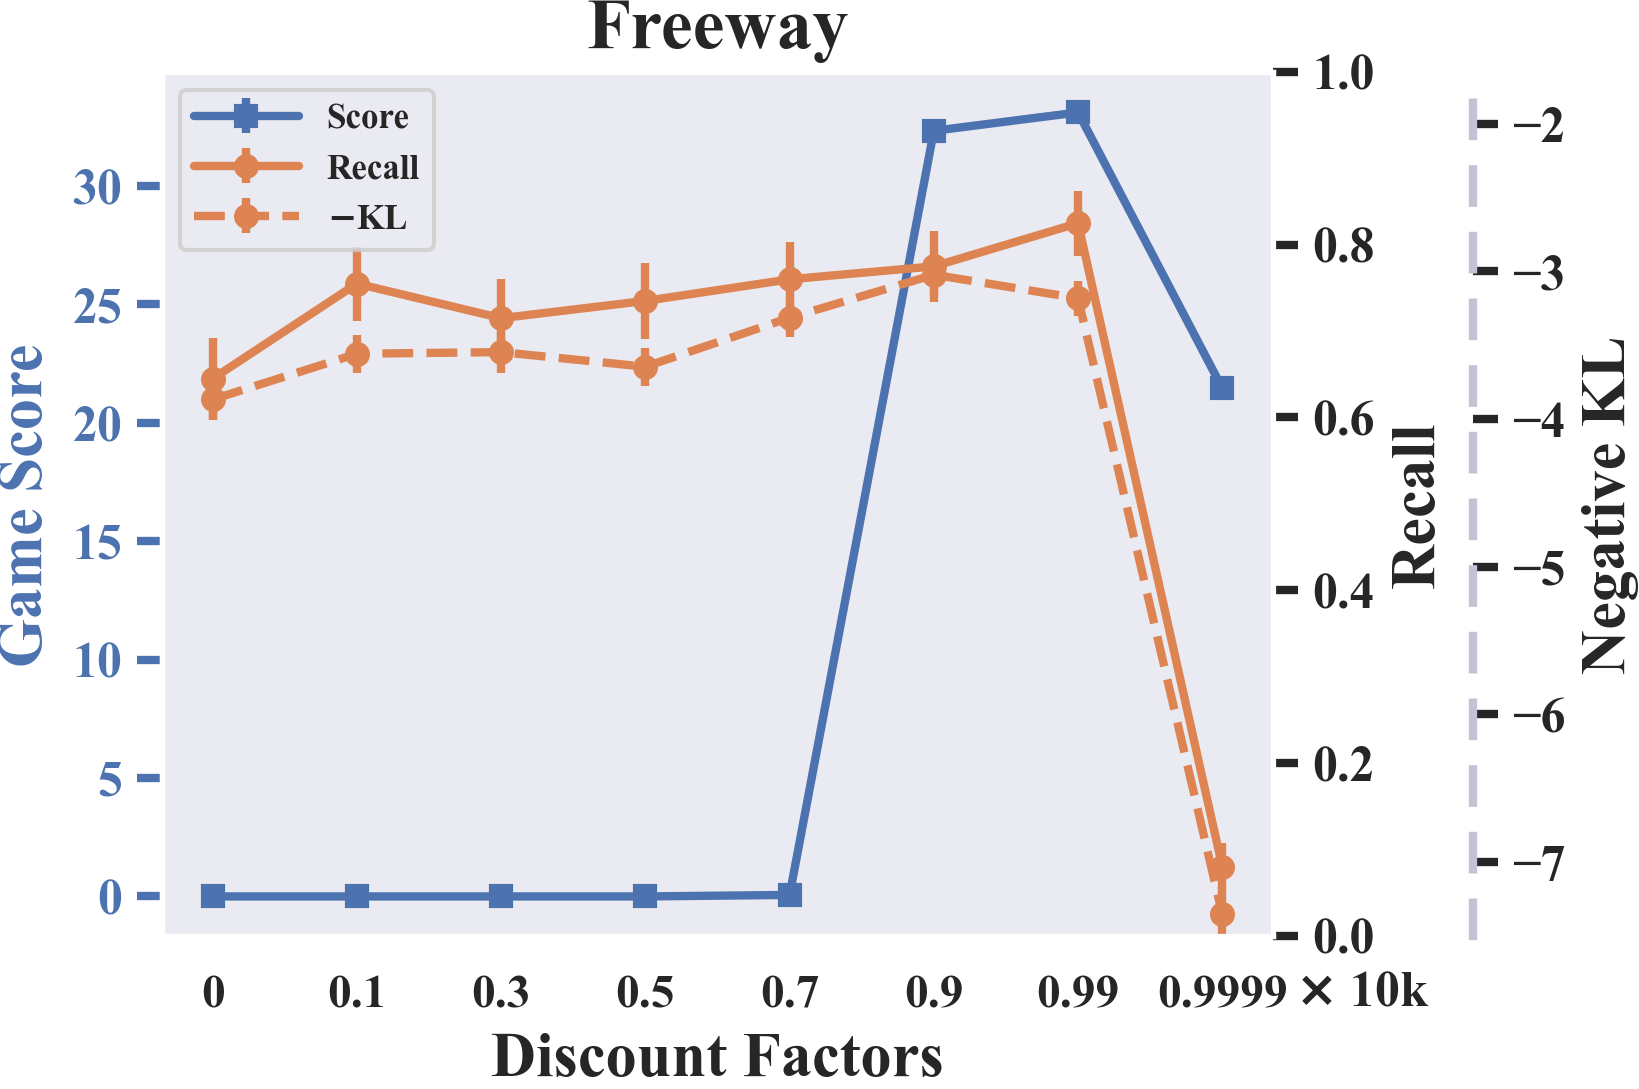
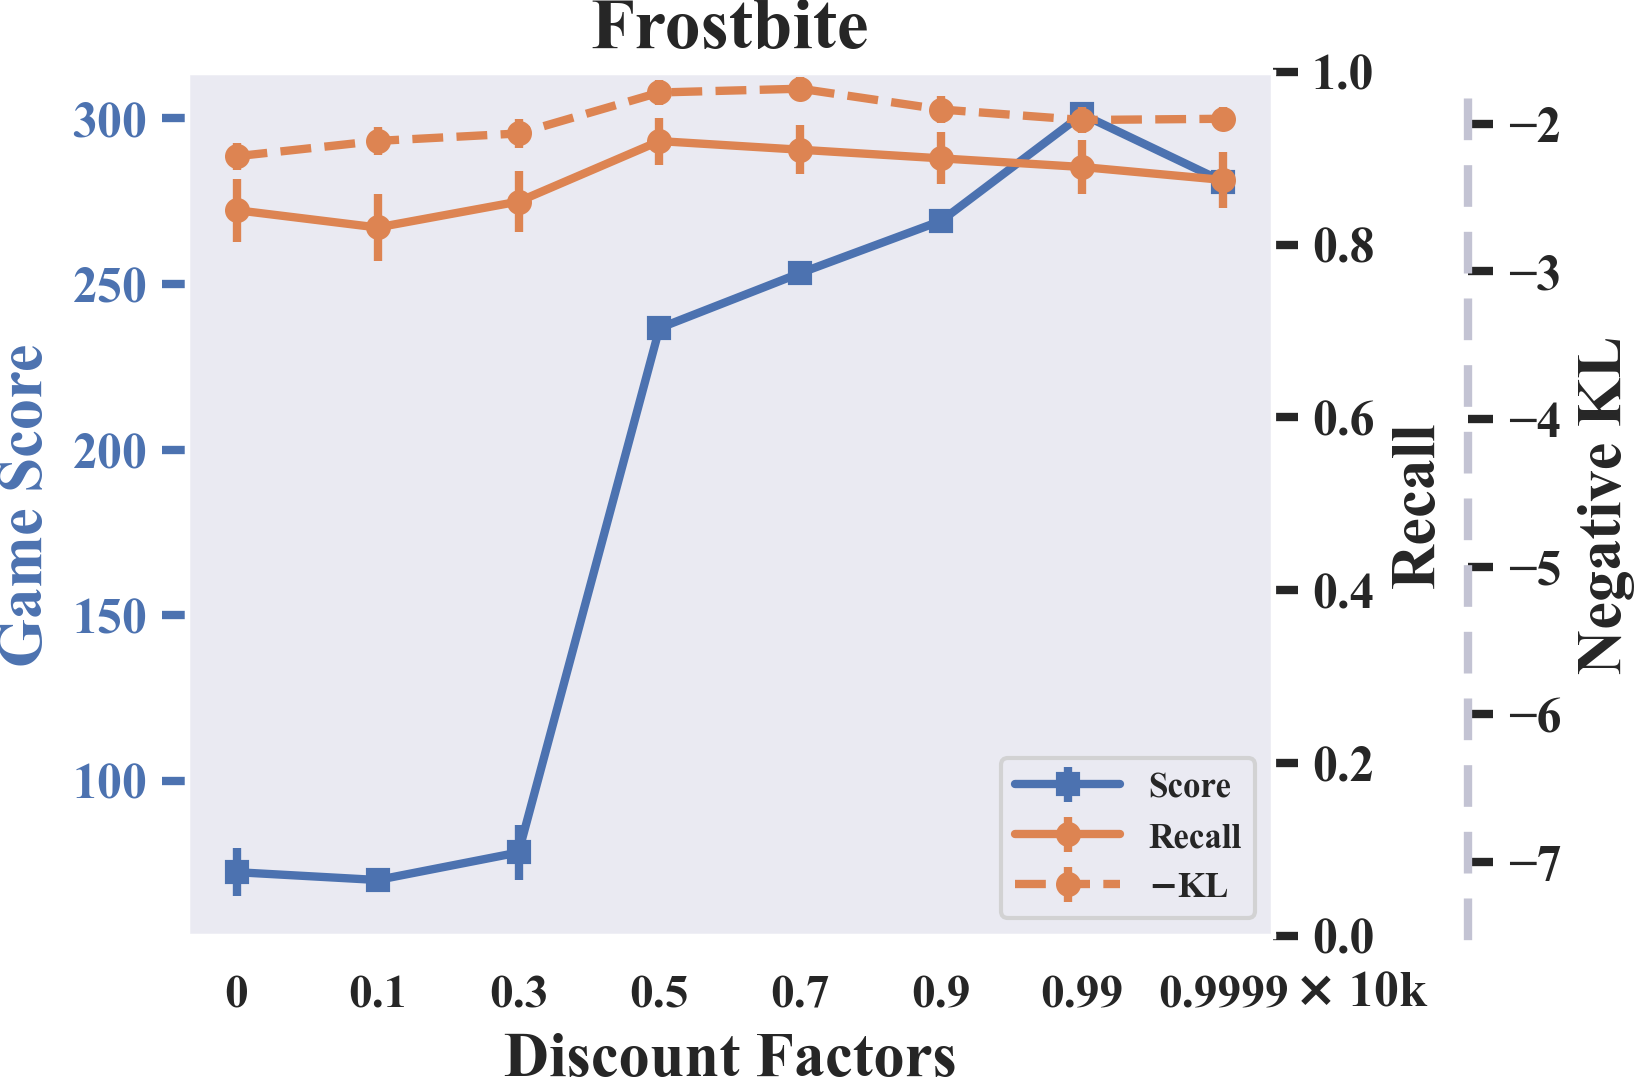
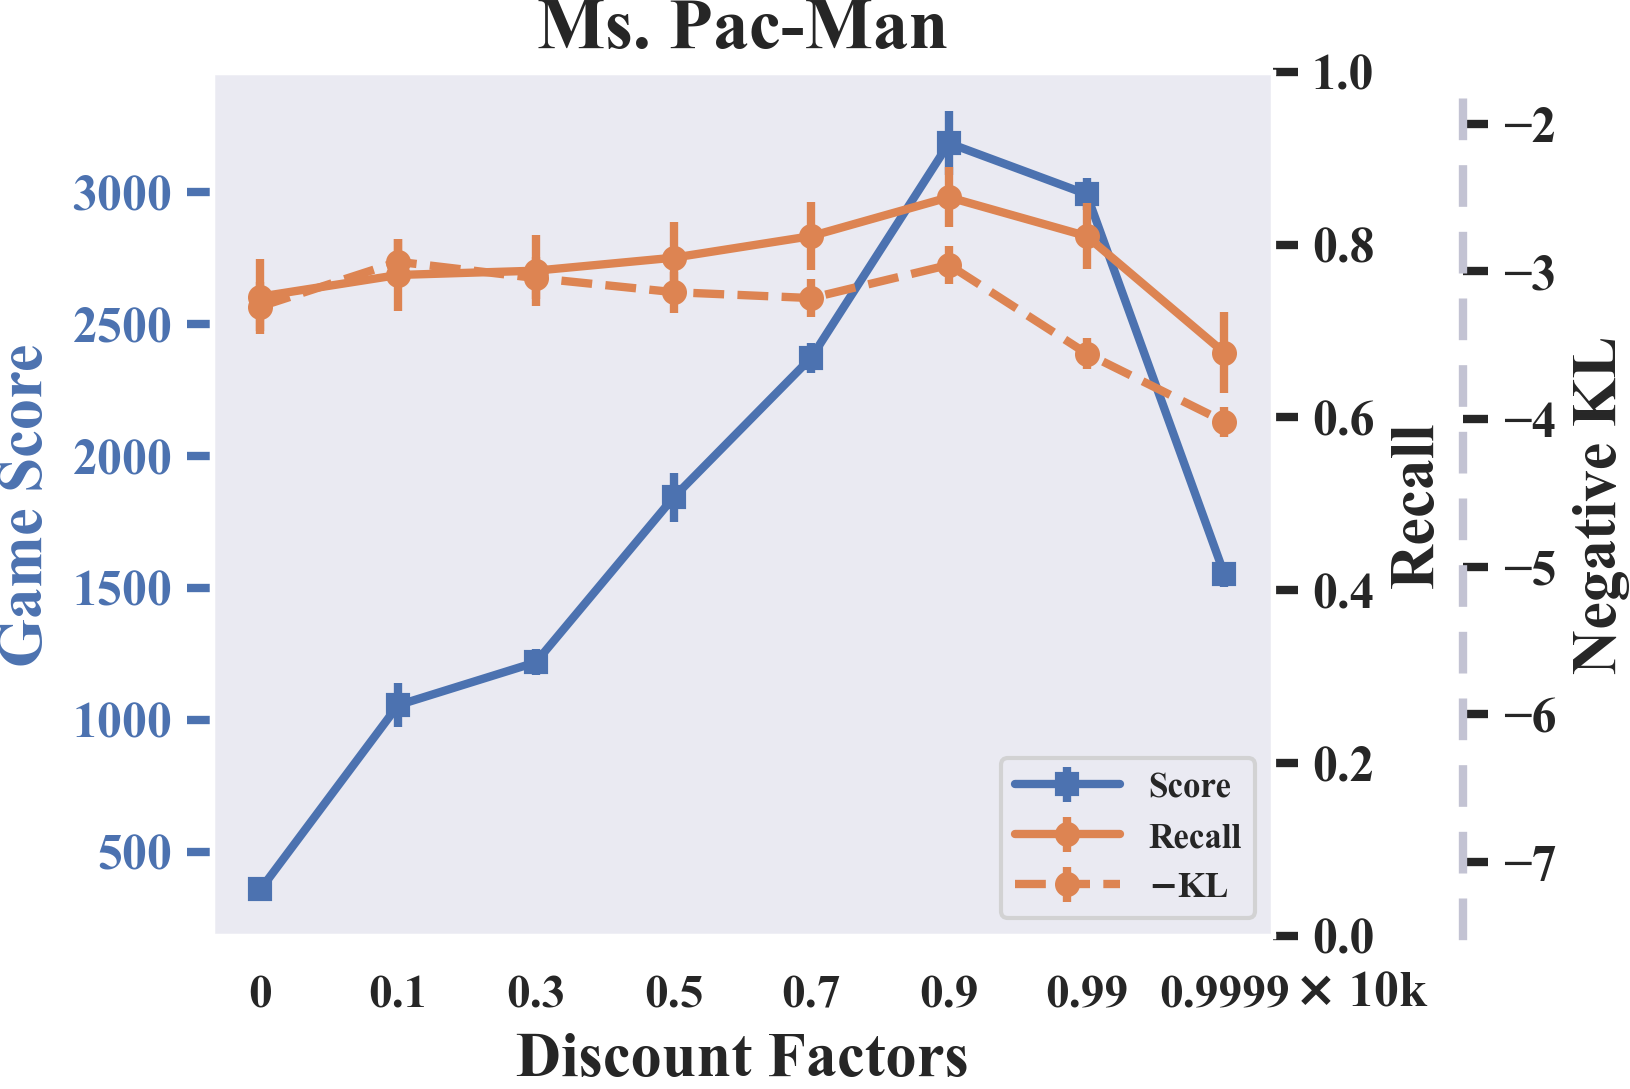
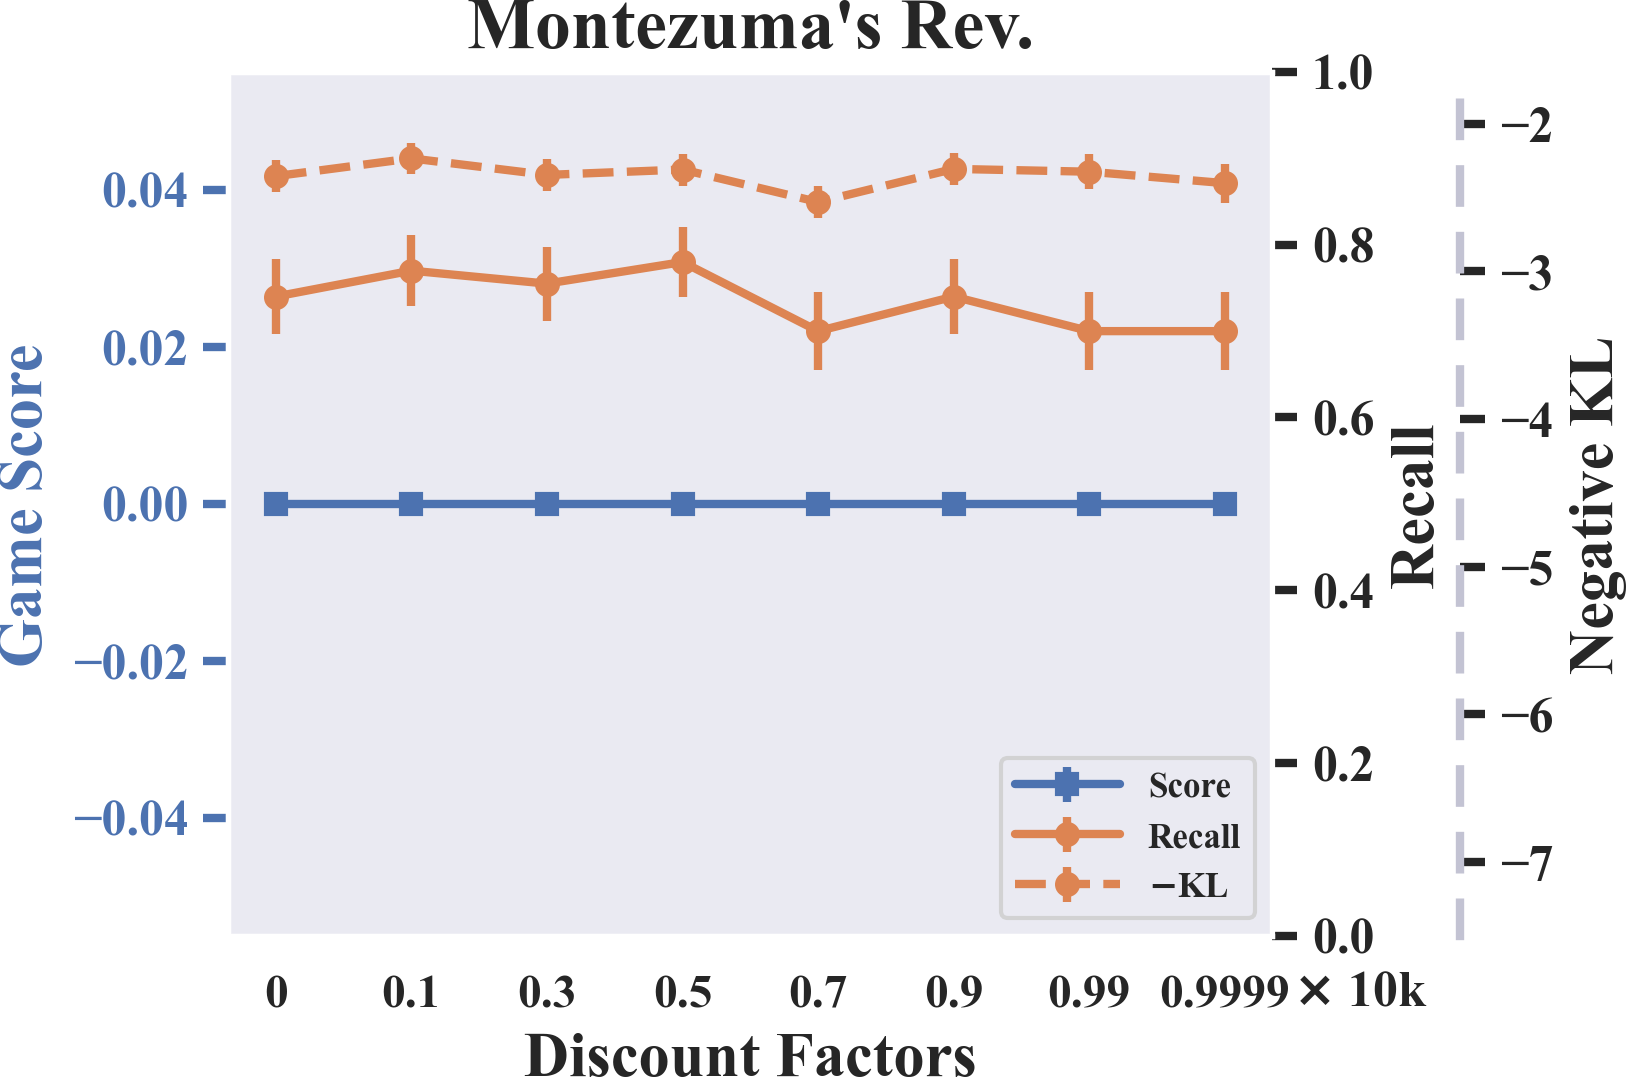
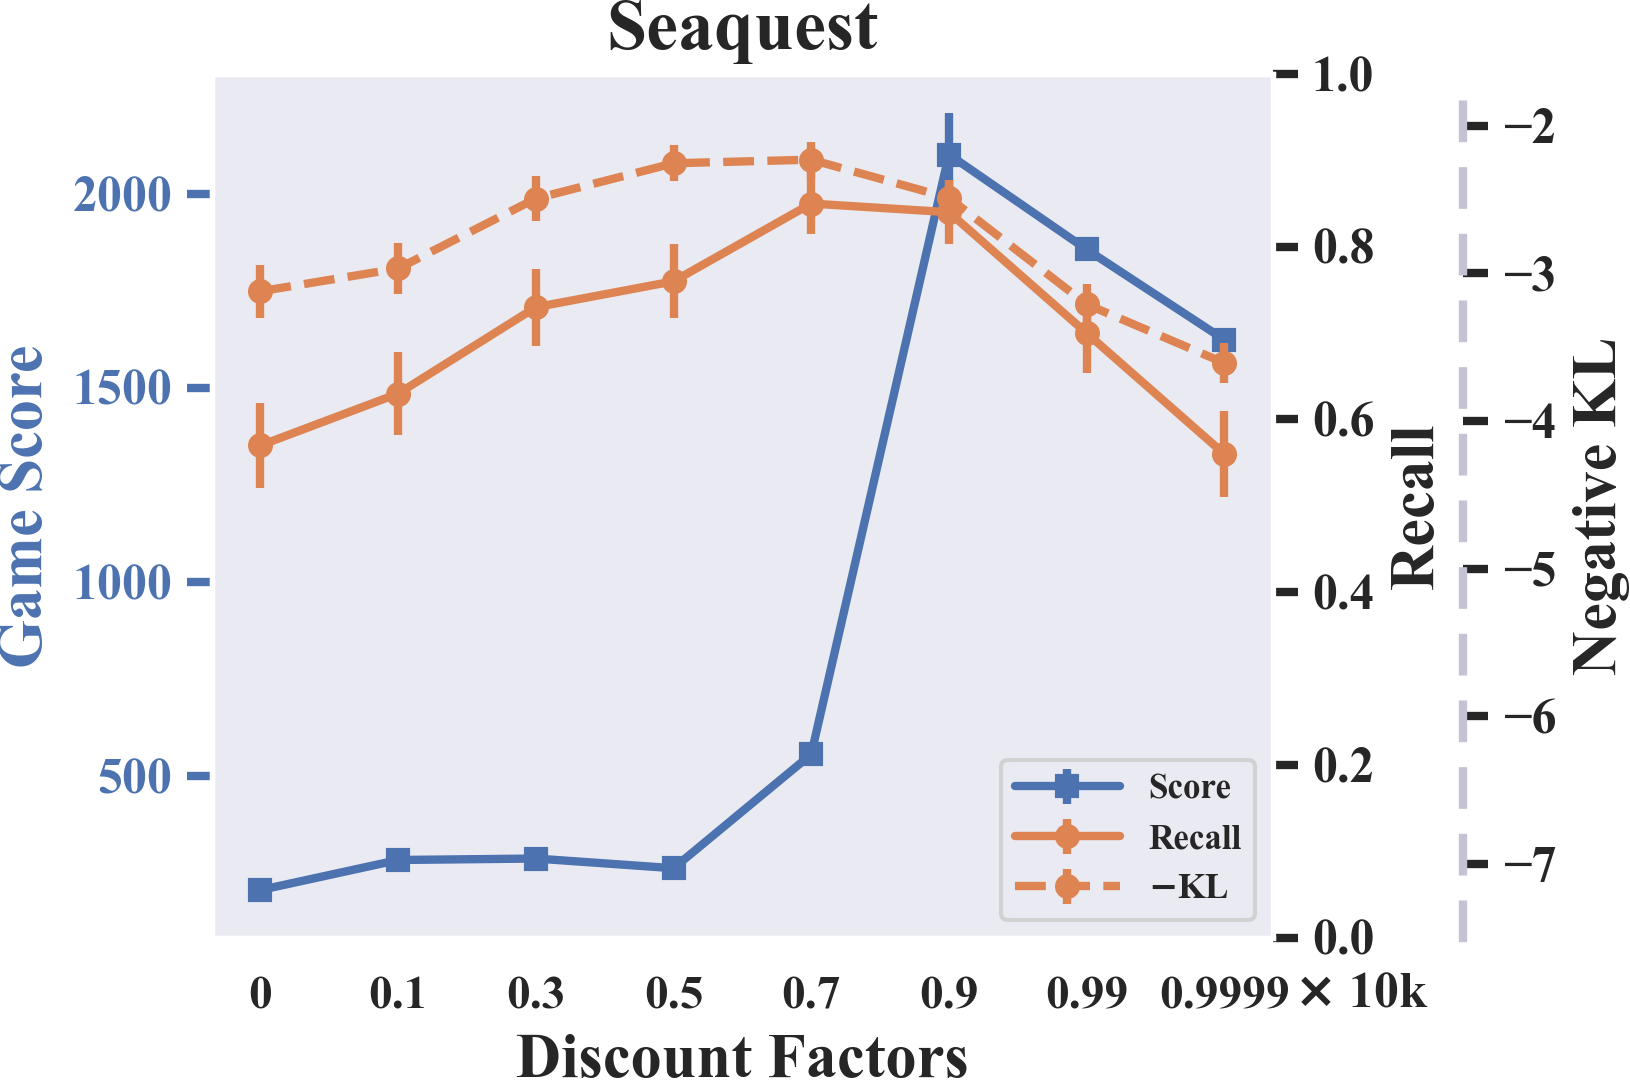
Instead of using raw gaze positions as in all the previous works [86, 88], we extract human fixation locations using the software provided by the Eyelink eye tracker333Available at https://www.sr-research.com/data-viewer/. Fixational eye movements are to maintain current gaze location by fixating our eyes onto and inspect the object of interest. Therefore fixations are more meaningful for indicating human visual attention. Since fixations are discrete gaze locations, recall could be used to compare pixel-base human attention maps. It is defined by the following formula:
| (4) |
where a pixel is counted as a positive prediction if the normalized RL attention value is greater than the probability of randomly choosing a pixel from the frame (in our case, , where all attention maps are in size ), and negative prediction otherwise. For the KL comparison, we treated human fixation maps as distributions by placing Gaussian blurs centered at the fixation location, with of one to two visual degrees of the human visual field.
The results are shown in Figures. 23 and 24. By comparing these results to those presented in Appendix 3 and 4, we show that using human data does not affect our main conclusions. The RL agents’ attention becomes more similar to humans’ during the learning process. The agents’ attention was most similar to human attention around .