Quasiparticle self-consistent band structures and high-pressure phase transitions of LiGaO2 and NaGaO2
Abstract
Quasi-particle self-consistent calculations are presented for the band structures of LiGaO2 and NaGaO2 in the orthorhombic tetrahedrally coordinated crystal structures, which are closely related to the wurtzite structure of ZnO. Symmetry labeling of the bands near the gap is carried out and effective mass tensors are extracted for the conduction band minimum and crystal field split valence band maxima at . The gap is found to be direct at and is 5.81 eV in LiGaO2 and 5.46 eV in NaGaO2. Electron-phonon coupling zero-point normalization is estimated to lower these gaps by about 0.2 eV. Optical response functions are calculated within the independent particle long wavelength limit and show the expected anisotropy of the absorption onsets due to the crystal field splitting of the VBM. The results show that both materials are promising candidates as ultrawide gap semiconductors with wurtzite based tetrahedrally bonded crystal structures. Direct transitions from the lowest conduction band to higher bands, relevant to n-type doped material and transparent conduction applications are found to start only above 3.9 eV and are allowed for only one polarization, and several higher band transitions are forbidden by symmetry. Alternative crystal structures, such as and a rocksalt type phase with tetragonally distorted spacegroup, both with octahedral coordination of the cations are also investigated. They are found to have higher energy but about 20 % smaller volume per formula unit. The transition pressures to these phases are determined and for LiGaO2 found to be in good agreement with experimental studies. The phase also has a comparably high but slightly indirect band gap while the rocksalt type phase if found to have a considerably smaller gap of about 3.1 eV in LiGaO2 and 1.0 eV in NaGaO2.
I Introduction
LiGaO2 is a transparent ceramic material which has been considered for piezoelectricNanamatsu et al. (1972); Gupta et al. (1976); Boonchun and Lambrecht (2010) and non-linear optical applications Rashkeev et al. (1999) in the past and can be grown in bulk single crystal form,Marezio (1965); Ishii et al. (1998) which has among other led to its use as closely lattice matched substrateSakurada et al. (2007) for GaN epitaxial growth. It can be viewed as a I-III-VI2 analog of the II-VI material ZnO with a wurtzite based crystal structure, consisting of an ordered arrangement of the Li and Ga atoms on the cation sublattice of the wurtzite. In particular it has the spacegroup. Mixed alloy systems of ZnO and LiGaO2 and ZnO/LiGaO2 heterojunctions have also been studied.Omata et al. (2008, 2011); Ohkubo et al. (2002)
Although mostly considered an insulating material, it has recently been proposed that LiGaO2 can be doped n-type with Si or Ge, which would make it promising for ultrawide gap semiconductor applications.Boonchun and Lambrecht (2011); Boonchun et al. (2019); Dabsamut et al. (2020); Lenyk et al. (2018); Skachkov et al. (2020) From this point of view it may have some advantages relative to the now widely pursued -Ga2O3.Sasaki et al. (2013); Green et al. (2016) It has a simpler crystal structure with all atoms tetrahedrally coordinated and it appears to have an even wider band gap.
However, the band gap is not yet fully established. While experiments indicate a gap of about 5.3-5.6 eV, a prior calculations predicted an even larger gap of 6.25 eV.Boonchun and Lambrecht (2011) Optical absorption data give a direct gap of 5.5 eV Wolan and Hoflund (1998); Ohkubo et al. (2002) to 5.26 eV Chen et al. (2014) while X-ray absorption and emission data Johnson et al. (2011) gives a gap of 5.6 eV. Boonchun and LambrechtBoonchun and Lambrecht (2011) tried to explain their band gap overestimate compared to experiment in terms of temperature dependence of the gaps and zero-point motion correction by electron-phonon coupling. However, at that time no accurate predictions of these effects were possible. Since then, we have found in various other systems that k-point and basis set convergence can significantly affect the QS band gap results.Ratnaparkhe and Lambrecht (2020, 2017) In this paper we re-evaluate the band structure of LiGaO2 with well-converged quasiparticle self-consistent calculations and review the estimates of the electron-phonon coupling effects.
Secondly, we consider a related material of the same family, NaGaO2 to evaluate the possibility of band gap tuning by varying the alkali metal component. One of the practical problems found in the past with LiGaO2 as substrate is the ionic mobility of Li, which tends to easily diffuse. In particular for high-power applications with at high temperature or in the presence of strong electric fields, ion mobility might be expected to be a problem. Therefore replacing it by a less diffusive element Na might be beneficial. Indeed one of the main attractive features of ultrawide gap semiconductors is their large breakdown field. But then we also need to ensure that these high fields do not lead to ionic diffusion or loss of Li from the system.
The known ground state structure of LiGaO2 is the structure,Marezio (1965) for which the prototype is -NaFeO2. In this standard setting of the space group, with , and in relation to the wurtzite hexagonal lattice constants. Note that in some previous literature,Boonchun and Lambrecht (2010) the lattice constants and are reversed, in which case the space group setting is . The notation corresponds to a glide mirror plane with two glides, or to a glide plane with one glide along the indicated direction, so in the notation is in the plane and in the plane and in both cases indicates a two-fold screw-axis along .
However, it is also worthwhile to study the competing -NaFeO2 structure, which has spacegroup . In that structure, all atoms are octahedrally coordinated and the structure can be viewed as a layered structure. According to Materials Project (MP)MP this structure has higher energy than the structure for LiGaO2 by 61 meV/atom. This structure is commonly found in many ABO2 systems with metallic elements functioning as cations. For example this structure is found for LiCoO2, a well known battery material, in which the Li content can to some extent be varied by chemical or electrochemical means. Since NaGaO2 has not been reported to the best of our knowledge, it is important to check the relative stability of the two structures and determine the energetic preference for octahedral vs. tetrahedral coordination of the Ga and alkali elements Li and Na. We therefore here also study the band structures and relative stability of the two structures. In LiGaO2, disordered rocksalt phases have also been reported and these are also considered here.
Finally, besides the electronic band structure, which is here provided in more detail than in Ref. Boonchun and Lambrecht, 2011, we also study the interband transition response functions related to optical absorption.
II Computational methods
The calculations in this work are done using the full-potential linearized muffin-tin orbital (FP-LMTO) all-electron method within either density functional theory (DFT) or many-body-perturbation theory (MBPT) context. The FP-LMTO method is used as implemented in the questaal package,que ; Pashov et al. (2019) and based on the work by Methfessel et al Methfessel et al. (2000) and since then improved to allow for inclusion of augmented plane waves as additional basis functions,Kotani and van Schilfgaarde (2010) which allows for a systematic check of the basis set convergence. We start our calculations from the structures available at the Materials Project (MP) MP and then check the smallness of the residual forces within FP-LMTO or further relax the atomic positions. For materials not yet available in MP, we used the Quantum Espresso code Giannozzi et al. (2009) to relax the atomic positions and lattice constants simultaneously before additional testing with FP-LMTO.As DFT functional, we use the Perdew-Burke-Ernzerhof (PBE)Perdew et al. (1996) generalized gradient approximation (GGA).
A main advantage of the questaal package is that it has one of the few all-electron implementations of the MBPT method. Here and refer to the one-particle Green’s function and screened Coulomb interaction ,Hedin (1965); Hedin and Lundqvist (1969) which define the self-energy operator in a schematic notation. Furthermore, this implementation uses a mixed-product-interstitial-plane-wave basis instead of only plane waves to represent all two-point quantities, such as the bare Coulomb interaction , screened Coulomb interaction , polarization propagator and inverse dielectric response function . This representation is far more efficient to represent the response and does not require one to include as many high-energy empty bands for convergence. Details of the implementation can be found in Kotani et al Kotani et al. (2007) and Ref. Pashov et al., 2019.
The method is here used in the quasiparticle self-consistent version, known as QS. In this approach, the energy dependent is replaced by an energy-independent Hermitian average , represented in the basis of initial eigenstates, where is the DFT starting Hamiltonian. The is then added to the Hamiltonian in each iteration, providing a new Green’s function from which a new and is obtained in the next step. At convergence, the eigenvalues of the Kohn-Sham Hamiltonian are equal to the quasiparticle energies. Hence the name quasiparticle self-consistent. In other words, we are here focused on obtaining the real quasiparticle energies, independent of the DFT starting point, rather than the full energy dependent complex self-energy or Green’s function which would contain a more comprehensive description of the quasiparticle spectral function.
Thanks to the atom-centered LMTO basis set, to which the self-energy can be converted, a natural route to interpolating the self-energy eigenvalue shifts to other k-points than the mesh on which is calculated is available. Hence -accuracy energy bands and effective masses are obtained along the symmetry lines, or, on a fine mesh for density of states or optical response functions, without the need for the computationally expensive evaluation of on an equally fine mesh. Nonetheless, the k-mesh on which the self-energy is determined is important for convergence. One finds that a coarse mesh tends to give larger band gaps.Kotani et al. (2007); van Schilfgaarde et al. (2006); Ratnaparkhe and Lambrecht (2020) Also important are a large basis set including typically angular momentum channels for two sets of smoothed Hankel function envelopes of the LMTOs as well as additional local orbitals to represent either semi-core states or higher lying conduction band contributions to the partial waves of the same angular momentum character within the muffin-tin sphere partial.
We here used and k-meshes on which the is calculated for the structure to check convergence and a mesh for the and structures.
III Results
III.1 Structural properties and stability of LiGaO2
| 4a positions | ||||
|---|---|---|---|---|
| operation | ||||
| Expt. Marezio (1965) | ||||
| (Å) | (Å) | (Å) | (Å3) | |
| 5.407 | 6.405 | 5.021 | 43.471 | |
| 1.6884 | 1.5678 | 3.2025 | ||
| atom | Wyckoff | |||
| Li | 4a | 0.0793 | 0.6267 | 0.0064 |
| Ga | 4a | 0.0821 | 0.1263 | 0.0000 |
| OLi | 4a | 0.0934 | 0.6388 | 0.3927 |
| OGa | 4a | 0.0697 | 0.1121 | 0.3708 |
| bond lengths (Å) | ||||
| Ga-O | Ga-O | Ga-O | Ga-O | |
| 1.865 | 1.851 | 1.837 | 1.858 | |
| Li-O | Li-O | Li-O | Li-O | |
| 2.007 | 2.005 | 1.998 | 1.957 | |
| GGA-PBEMP | ||||
| (Å) | (Å) | (Å) | (Å3) | |
| 5.4665 | 6.4570 | 5.094 | 44.952 | |
| 1.6932 | 1.5778 | 3.228 | ||
| atom | Wyckoff | |||
| Li | 4a | 0.0823 | 0.6244 | 0.0001 |
| Ga | 4a | 0.0811 | 0.1261 | 0.0046 |
| OLi | 4a | 0.0928 | 0.6382 | 0.3959 |
| OGa | 4a | 0.0688 | 0.1125 | 0.3726 |
| bond lenths (Å) | ||||
| Ga-O | Ga-O | Ga-O | Ga-O | |
| 1.878 | 1.877 | 1.868 | 1.870 | |
| Li-O | Li-O | Li-O | Li-O | |
| 2.019 | 2.018 | 2.016 | 1.998 | |
We start by examining the calculated and experimental structural parameters of LiGaO2 in the structure in Table 1. This table also shows which symmetry operations link the different equivalent atoms of the Wyckoff position. Here, is the twofold screw axis along located at the origin. The is a double glide plane perpendicular to and with glides by and which occurs at and therefore also involves a shift by . The is a single-glide plane perpendicular to with shift by but it occurs at and hence also involves a shift by . Here the Cartesian axes are chosen along respectively.
We here compare the experimental structural parameters with the calculated ones within the PBE-GGA density functional from Materials Project.MP The reduced coordinates within that model were verified using the FP-LMTO method and agree to . We can see that PBE overestimates each of the lattice constants by about 1 % and hence the volume by 3 %. Interestingly, it overestimates Ga-O bond lenths slightly more than Li-O bond lengths. Also it overestimates aby about 1.4 % and and by about 0.8 %. Each cation has four different bond lengths to oxygen, for example Ga-O means the bond length between Ga and the OLi type O in the -direction. We can see that the Li-O bond lengths are significantly larger than the Ga-O bond lengths. The ratio in the undistorted wurtzite structure derived structure would be , but here is reduced to 1.69. This implies that the 120∘ angle between two wurtzite lattice vectors in the plane has here increased to 122∘.
| Li | Ga | O | |
| Wyckoff | 1a | 1b | 2c |
| reduc. coord. | |||
| Calculated | |||
| (Å) | (Å3) | ||
| 5.173 | 33.138∘ | 36.824 | 0.2415 |
| bond lengths (Å) | Li-O | Ga-O | |
| 2.171 | 2.026 | ||
| ExperimentMarezio and Remeika (1965) | |||
| (Å) | (Å3) | ||
| 5.1066 | 33.12∘ | 35.394 | 0.2417 |
| bond lengths (Å) | Li-O | Ga-O | |
| 2.14 | 2.00 | ||
Next, we discuss the structural stability relative to the structure. Note that in the structure, the cations have octahedral coordination and form a layered structure with alternating Li and Ga containing layers. We start again from the structural parameters of the Materials Project,MP which are optimized within the GGA-PBE density functional. The structural parameters of are given in Table 2. Clearly, the volume per formula unit in this structure is significantly (18 %) lower than in the structure, meaning that this phase can be stabilized under pressure. Interestingly, both Ga-O and Li-O bond lengths are larger in the octahedral environment. This structure is known as -LiGaO2 and its structure was determined by Marezio and Remeika Marezio and Remeika (1965).
Yet, another form of LiGaO2 is known as -LiGaO2 and has a rocksalt-like structure with tetragonal distortion. In this phase, LiGaO2 is also octahedrally coordinated and the Li and Ga occur in a disordered way in the Wyckoff positions of space group with equal probability. Instead, a closely related structure, is considered in MPMP . This is an ordered distorted rocksalt modification. It consist of alternating layers of Li and Ga in the rocksalt structure along one of the cubic axes, say the [001] axis. This axis now becomes the -axis after distortion. The lattice constants and atomic positions of this phase from MPMP are given in Table 3. Note that in this structure the Li-O and Ga-O bond lengths are fixed to be perpendicular to and parallel to . This is unfavorable from the point of view that the bond lengths cannot be individually optimized for each species. The experimental disordered rocksalt-like structure according to Lei et al Lei et al. (2010) has lattice constants of Å and Å and hence , close to the ideal . In contrast, the ratio in is reduced to 1.286. Following Lei et al Lei et al. (2010) a disordered cubic rocksalt phase with space group also exists and is designated as -LiGaO2. It has a lattice constant of 4.1134 Å. All these phases have close volumes per formula unit of about 34.8 Å3.
| atom | Wyckoff | |||
|---|---|---|---|---|
| Li | 1c | 0.5 | 0.5 | 0.0 |
| Ga | 1b | 0.0 | 0.5 | 0.0 |
| O | 1a | 0.0 | 0.0 | 0.0 |
| O | 1d | 0.5 | 0.5 | 0.5 |
| lattice constants (Å) | ||||
| 3.002 | 3.861 | 34.807 | ||
| bond lengths (Å) | ||||
| 1.930 | 2.123 |
| property | |||
|---|---|---|---|
| (Å3) | 36.297 | 44.424 | 34.712 |
| (eV/f.u.) | 21.91 | 22.30 | 21.62 |
| (GPa) | 166 | 130 | 1615 |
| 4.6 | 4.2 | 5.0 | |
| (GPa) | 8.3 | 13.9 |
We calculated the total energies of the , and phases as function of volume, keeping the ratios of the lattice constants (shape of the cell) and internal parameters fixed within the GGA-PBE functional with the FP-LMTO method. In order to compare the energies accurately, we used the same muffin-tin radii for the three structures, chosen to be touching in the structure at 0.94 compression of the lattice constants. This avoids overlap of the spheres in the other structures. We included augmented plane waves in the basis set up to 3 Ry and used a large basis set on Li and Ga and also included the Ga- semi-core states as bands. We found the energy difference between the and phases at their equilibrium volume to be converged to 0.1 eV by increasing the cut-off of the augmented plane waves to 4 Ry.
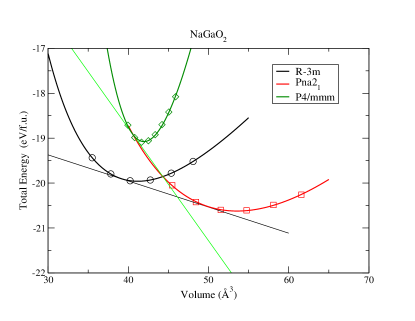
The energy-volume curves and common tangent constructions are shown in Fig.1. The energy volume curves were fitted to the Murnaghan equation of state and the latter was used to determine the transition pressure from the common-tangent rule or equivalently, setting the enthalpy, equal for two different phases . The equation of state fitted parameters are given in Table 4. The energy difference between the and phases amounts to 97.5 meV/atom which is somewhat larger than the value given in MPMP of 61 meV. The phase is found to have higher energy than the , namely 170 meV/atom higher than the phase but occurs at minimum energy volume of 34.7 Å3 close to that of the phase. The bulk moduli might be somewhat overestimated because we did not allow the structure to relax at each volume. Prior work found a bulk modulus of 95 GPa for the structureBoonchun and Lambrecht (2010); Lei et al. (2013) a 142.29 GPa in .Lei et al. (2013)
Phase transitions of the -LiGaO2 to the form and other disordered rocksalt type forms have been studied by Raman spectroscopy.Lei et al. (2013, 2010) At 14 GPa a transition is found to the structure, which is closely related to the rocksalt structure. This is very close to our value of the transition to the phase. According to Lei et al Lei et al. (2013), the -phase can be prepapred from the -phase at 7 GPa and 1000∘C. This is compatible with the transition pressure found here between the and phase of 8.3 GPa. From our convergence studies we estimate our value to have an uncertainty of a few GPa, in particular because we calculated our energy-volume curves without relaxing the internal parameters or shape of the cell. Our calculations predict that the transition to should occur first but kinetic reasons could prevent this and once at higher pressure, the transition may then proceed already to the rocksalt type phase.Lei et al. (2013)
III.2 Band structure of LiGaO2 in structure
For our band structure investigations of LiGaO2 in the structure, we used the experimental lattice parameters and atomic positions from Marezio et al Marezio (1965). For completeness they are given in Table 1.
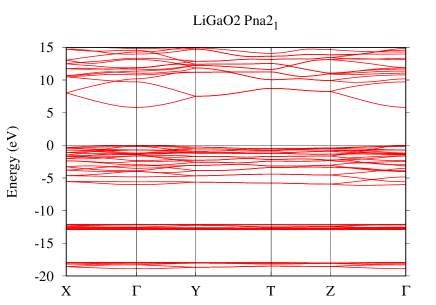
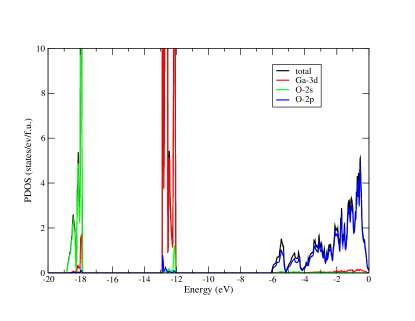
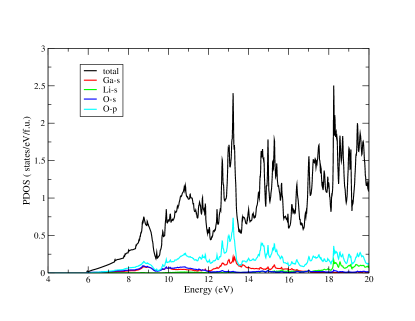
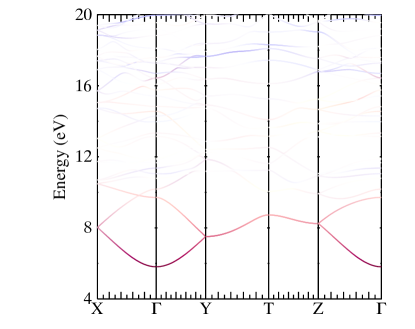
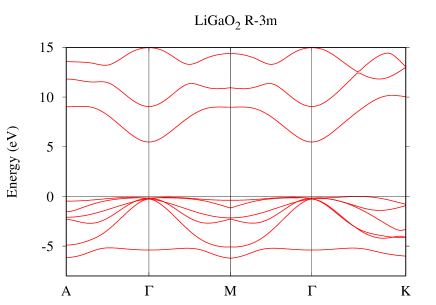
The band structure of LiGaO2 in QSGW is shown on a large energy scale in Fig. 2. The density of states resolved in various partial densities of state (PDOS) are shown in Fig. 3 both in the conduction band and the valence band region. This shows that the lowest set of narrow bands at about 19 eV are the O- derived bands and the ones at about 12 eV below the VBM are the Ga- derived bands. The next set of bands between eV and 0 eV are the O- dominated band. In the conduction bands we see also significant oxygen contributions because these are antibonding bands. It shows that the conduction band minimum has more Ga- contribution and the main Li- only occurs at significantly higher energy, above 18 eV. This is consistent with the high electropositivity of Li. This can also be seen in the colored band plot in Fig. 4.
| chem | Koster | functions | ||||
|---|---|---|---|---|---|---|
| 1 | 1 | 1 | 1 | , ,, | ||
| 1 | 1 | 1 | 1 | |||
| 1 | 1 | 1 | 1 | , | ||
| 1 | 1 | 1 | 1 | , |
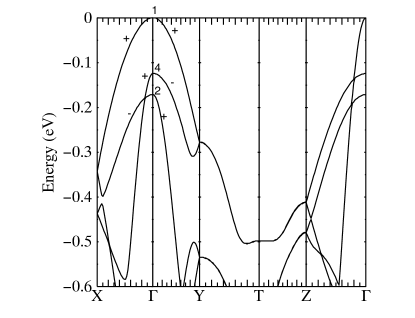
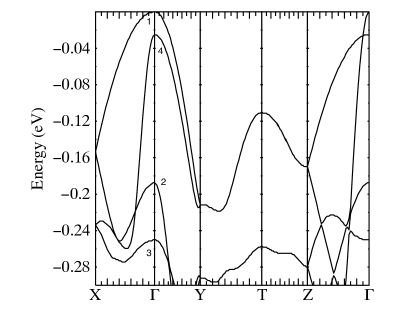
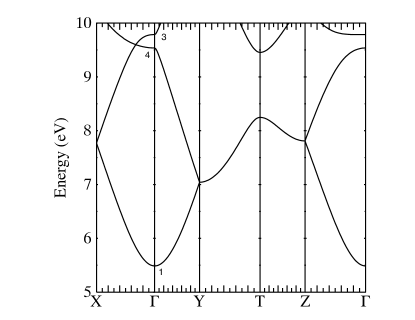
Next we show a zoom in on the region near the conduction band minimum and valence band maximum in Fig. 5. The bands are symmetry labeled according to the character table given in Table 5, following the Koster et al Koster et al. (1963) notation. The band gap is direct at and is 5.81 eV. The conduction band minimum (CBM) is found at and shows a strongly dispersive band with low effective mass as is typical for cation--like CBMs. The valence band maximum (VBM) is also at but shows crystal field splitting compared to the three-fold degenerate -like state seen in cubic zincblende materials. Compared to wurtzite which has only split from states, there is here a full splitting in three levels even without spin-orbit coupling.
We can see that the CBM has symmetry, consistent with its dominant -like character. The VBM also has symmetry, separated by 124 meV from the band and the latter separated by 48 meV from the next . Since correspond to respectively, this implies that optical transitions from the VBM to the CBM are dipole allowed for , from the band for and for the band for . These lead to different onsets of absorption as confirmed by our calculations of the optical response discussed below.
Along the direction, only the mirror symmetry leaves the -point invariant and the states can thus be labeled as even, , or odd, , with respect to that mirror plane. From the character table, one can easily see that and are compatible with and , are compatible with along this direction. Therefore the second and third valence band (counting down from the top) are allowed to cross along . Likewise along , only the mirror survives. The compatibility relations are now , . On the other hand, along the group of stays and hence the symmetry labeling at also applies along the axis. Since the top three bands have different symmetry label they are allowed cross along this line.
In the conduction band we have only labeled the bands at since the labels along the three orthogonal directions from is already clear from the previous paragraph. We can see that there is a large gap of 3.90 between the CBM and next conduction band (CBM2), which is of symmetry. This is favorable for transparent conductor applications since only light with photon energy larger than 3.9 eV (wavelength nm) and with polarization would be absorbed by electrons near the conduction band minimum introduced by n-type doping. The next CBM3 has symmetry which is dipole forbidden for any light polarization. The first allowed transitions from the CBM for would only occur to the CBM4 band of symmetry at 4.98 eV. The lowest conduction band at of symmetry is CBM7 at 5.85 eV.
| band | irrep | (eV) | |||
|---|---|---|---|---|---|
| CBM | 5.81 | 0.39 | 0.39 | 0.41 | |
| VBM1 | 0 | 3.85 | 3.50 | 0.42 | |
| VBM2 | 0.45 | 3.50 | 3.80 | ||
| VBM3 | 3.15 | 0.58 | 3.80 |
Because of the orthorhombic symmetry the mass tensors at each band at are diagonal with a different mass in each of the directions. These are given in Table 6. One can see that the conduction band mass is small and close to isotropic. The valence bands each have one light mass and and two heavy mass directions. The light mass is in the direction corresponding to the symmetry of the band, for example it is in the direction for the band, in the direction for the band and in the direction for the band.
We also performed calculations including spin-orbit coupling. The valence band maximum is then still split in three levels and the difference from the calculation without spin-orbit coupling was found to be negligible. In the parent compound ZnO, spin-orbit splitting plays an important role because of the antibonding contribution from the Zn- orbitals in the VBM. In fact, it leads to an effectively negative spin-orbit splitting parameter of the VBM in that case.Lambrecht et al. (2002) In LiGaO2, however the Ga- orbitals lie significantly lower, reducing this negative contribution and hence apparently almost completely cancelling the positive but already small contribution of the O- orbitals.
| method | ||||
|---|---|---|---|---|
| LDABoonchun and Lambrecht (2010) Berry | ||||
| GGA | ||||
| 0.8 | ||||
| 0.8 | ||||
| 0.8 rescaling | ||||
| Expt. Tumėnas et al. (2017) | ||||
| Expt. Nanamatsu et al. (1972) |
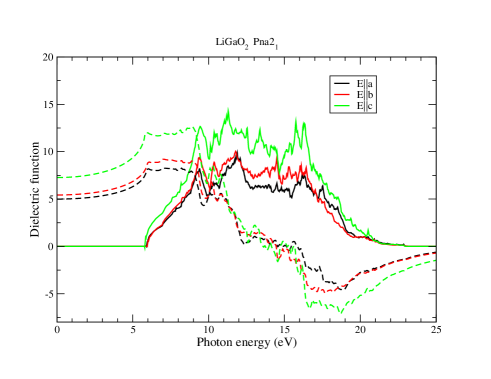
The optical response functions were calculated within the long-wavelength limit and independent particle approximation. In other words, they include vertical band-to-band transitions including the dipole matrix elements but no local field or excitonic effects. In this case the imaginary part of the dielectric function is given by
| (1) | |||||
with the band eigenvalues, the Bloch eigenstates, the Fermi function occupation factors of these states. It uses matrix elements of the velocity operator , which differ from the momentum matrix elements because of the non-local contribution of the self-energy operator to the Hamiltonian. The real part is obtained from a Kramers-Kronig transformation and the optical absorption coefficient is given by with the index of refraction given by .
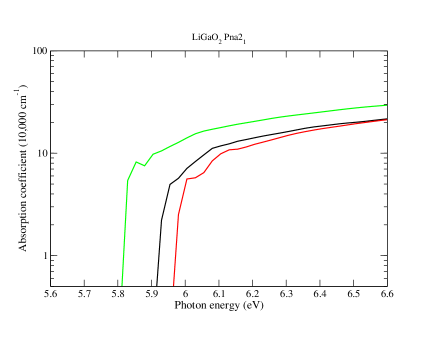
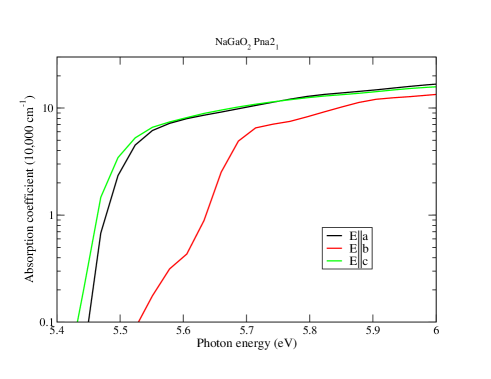
The imaginary and real parts of the dielectric function are shown in Fig. 6 and the absorption coefficient is shown on a log scale near the onset of absorption in Fig. 7. It shows the different absorption onsets for different polarization consistent with the symmetry analysis present above.
The values of correspond to the and can be compared with the results obtained from a Berry-phase calculation in LDA in Boonchun and Lambrecht.Boonchun and Lambrecht (2010) This comparison is given in Table 7 along with our values both based on the GGA and the QS 0.8 band structure. The Berry phase calculations in principle includes local field corrections which tend to reduce the value by about 5 %. In spite of this our GGA values are smaller than the ones in Ref. Boonchun and Lambrecht, 2010. The increase in gap due to QS is expected to reduce the dielectric constant (because energy denoninators in the expression for are increased) when applied in a naive way without taking into account the matrix element rescaling, from the non-local contribution to the velocity operator from the self-energy. This is indicated in the table by the . However when including the contribution the dielectric constant is in fact increased. Instead of using the explicitly calculated one can also use the rescaling rule proposed by Levine and Allan Levine and Allan (1989) in the context of a scissor correction. One then rescales the matrix elements by a factor . This apparently restores values close to the GGA. Finally, we compare to experimental values. Interestingly, the GGA results seem to be in better agreement with the experiment but we should caution that this could be due to a compensation of errors because we did not include local field or excitonic effects here.
| GGA | QS | 0.8 | Expt. | ||
|---|---|---|---|---|---|
| At expt. | 3.363 | 6.363 | 5.81 | 5.6 | 5.26-5.5 |
| at PBE | 3.201 | 6.245 | 5.69 | 5.5 |
Let us now focus on the band gap in Table8. First, in terms of k-convergence of the , the gap obtained with a mesh is 5.804 eV while that with a mesh it is 5.812 eV, showing that we have reached convergence to 0.01 eV in terms of k-convergence. The full QS gaps are 6.35 and 6.36 eV with and respectively. One can see that the corrections to the GGA band structure are significant. Also, we find a gap of 5.8 eV in fair agreement with experiments when adding a 0.8 correction factor to the . This is known as the 0.8 approximation. It takes into account that within QS, the polarization propagator does not include electron-hole interaction effects, or ladder diagrams, which typically leads to an underestimate of the screening. Although including such effects has recently become possible in the Bethe-Salpeter-Equation (BSE) approachCunningham et al. (2018), it is still prohibitively time and memory consuming for as system like the present one with 16 atoms per cell. On the other hand for many known cases, this under screening by the random phase approximation (RPA) was found to be about 20 % as documented in Ref. Bhandari et al., 2018. Hence the commonly used 0.8 correction factor.
While a full calculation of the zero point motion correction to the gap by electron phonon coupling is time consuming, we can make at least some estimate of this effect following the approach of Ref. Lambrecht et al., 2017. In a highly ionic material, the main effect comes from the lattice polarization correction (LPC), which is essentially the polaronic shift of the band edges. Its origin can be viewed as the contribution to the screening from the lattice polarization in the long-wavelength limit. For a material with a single LO phonon, this shift is given byLambrecht et al. (2017)
| (2) |
where is a polaron length defined in terms of the effective mass of the electrons for the conduction band shift and holes for the valence band shift and is the longitudinal optical phonon. The dimensionless polaronic coupling factor is and the dielectric constants at frequencies high above the phonons but well below the gap is and the static dielectric constant below the phonon modes is . The factor 1/2 in this equation was obtained by applying a cut-off to the wave vector of order while the classic Fröhlich estimate of the polaronic shift does not include such a cut-off. We obtain an upper limit to this correction by calculating the contribution from the highest energy optical phonon. The phonons in LiGaO2 were calculated in Boonchun et al Boonchun and Lambrecht (2010) and this paper also provides values for the dielectric constants needed here. Averaging over the , and phonons, we take an estimate of cm-1. Averaging the dielectric constants over directions, we obtain , . The factor then amounts to 0.146. Now using a hole mass of about we obtain with the Bohr radius. The expected shift is then about 0.14 eV. The conduction band shift should be significantly smaller because the electron effective mass is only 0.33 giving an , giving a shift of 0.05 eV at most. This gives an estimated gap correction of 0.2 eV form the highest frequency LO phonons. When multiple infrared active phonons are present, each phonon has a separate contribution to the factor according to the Lyddane-Sachs-Teller relation but also each long-range Fröhlich type electron-phonon coupling parameter depends on the eigenvector of the phonon.Verdi and Giustino (2015) It does becomes much more difficult to make an estimate. The above should be viewed only as an order of magnitude estimate of the effect. Including this estimate of a negative shift of a few 0.1 eV of the electron phonon coupling zero-point motion correction, our gap is in excellent agreement with the experimental value. The remaining discrepancy of our value with the most recent experimental determination of 5.26 eV is probably due to this measurement being done at room temperature.
It is also of interest to check how the QS correction of the gap is split over the valence and conduction band edges. We find in the approximation that the VBM shifts down from the GGA value by 1.321 eV while the CBM shifts up by 1.128 eV, thus giving a gap correction of 2.449 eV. This is related to the Ga- contribution to the VBM. The Ga- bands are found to shift down by about 2 eV in the approximation compared to GGA. This reduces the antibonding contribution of the Ga- to the VBM and hence shifts down the VBM significantly. The O- bands also shift down by about 1.7 eV.
We note that at the PBE calculated lattice constants, the GGA gap is 0.12 eV smaller. This is because the larger lattice constant typically leads to lower covalent interactions and hence a lower band gap. Since volume in GGA is about 3 % overestimated, this allows us to estimate the band gap deformation potential eV.
III.3 LiGaO2 in and structures.
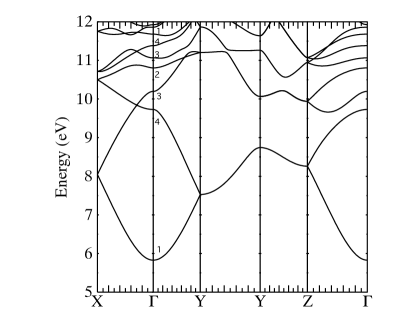
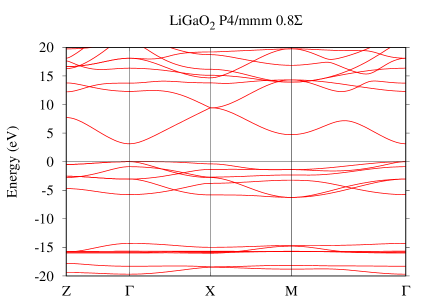
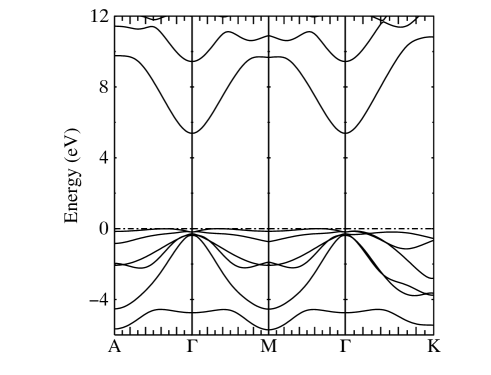
The band structure of the structure of LiGaO2 was calculated in the 0.8 QS approximation and is shown in Fig. 8. Although we use here the primitive cell of we plot the bands along symmetry lines of the conventional hexagonal cell, where lie in the plane and lies at the Brillouin zone edge along the direction above . This allows one to see the symmetries more easily. We can see that the band gap in this structure is slightly indirect, because the VBM occurs along while the CBM remains at . The direct gap at is 5.65 eV while the indirect gap is 5.47 eV. The O- and Ga- bands occur at about the same energies as in the structure.
The band structure in the structure is shown in Fig 9 in the approximation. It is seen to have a direct gap but with significantly smaller value of 3.129 eV.
III.4 Structure and stability of NaGaO2
| (Å) | (Å) | (Å) | (Å3) | |
|---|---|---|---|---|
| 5.6138 | 7.2377 | 5.3895 | 54.746 | |
| 1.5513 | 1.4893 | 3.6189 | ||
| atom | Wyckoff | |||
| Na | 4a | 0.0717 | 0.6223 | 0.0128 |
| Ga | 4a | 0.0630 | 0.1262 | 0.0005 |
| ONa | 4a | 0.1149 | 0.6632 | 0.5822 |
| OGa | 4a | 0.0400 | 0.08923 | 0.6559 |
| bond lenths (Å) | ||||
| Ga-O | Ga-O | Ga-O | Ga-O | |
| 1.875 | 1.864 | 1.880 | 1.875 | |
| Na-O | Na-O | Na-O | Na-O | |
| 2.357 | 2.346 | 2.312 | 2.325 | |
| Na | Ga | O | |
| Wyckoff | 1a | 1b | 2c |
| reduc. coord. | |||
| (Å) | (Å3) | ||
| 5.675 | 30.892∘ | 42.742 | 0.2326 |
| bond lengths (Å) | Li-O | Ga-O | |
| 2.389 | 2.047 |
| atom | Wyckoff | |||
|---|---|---|---|---|
| Na | 1c | 0.5 | 0.5 | 0.0 |
| Ga | 1b | 0.0 | 0.5 | 0.0 |
| O | 1a | 0.0 | 0.0 | 0.0 |
| O | 1d | 0.5 | 0.5 | 0.5 |
| lattice constants (Å) | ||||
| 3.189 | 4.177 | 42.498 | ||
| bond lengths (Å) | ||||
| 2.088 | 2.255 |
| property | |||
|---|---|---|---|
| (Å3) | 41.19 | 53.35 | 42.50 |
| (eV/f.u.) | 19.96 | 20.62 | 19.08 |
| (GPa) | 161 | 116 | 1047 |
| 4.5 | 4.3 | 5.0 | |
| (GPa) | 13.0 | 40.0 |
The structural parameters of NaGaO2 were initially taken from Materials Project and subsequently relaxed within the GGA-PBE approximation using the questaal and Quantum Espresso codes. They are given in Table 9.
We see that the is significantly smaller than the ideal value of , indicating that the angle between and has increased from 120∘ to 129∘. The Na-O bond lengths are larger than the Li-O bond lengths while the Ga-O bond length is about the same as in LiGaO2. As expected, the volume per formula unit is somewhat larger than in LiGaO2.
The optimized structural parameters of the structure are given in Table 10. We find this structure to have a volume per formula unit that is 22% smaller than the structure and to be 165 meV/atom higher in energy. It is is thus again a high-pressure phase. Using the energy-volume curves shown in Fig. 10 we find a transition pressure of 13 GPa. This is comparable but slightly higher than in LiGaO2. Both are close to the transition from wurtzite ZnO to rocksalt ZnO, which occurs at about 9 GPa. The structure was optimized first as function of and then the equation of state was determined keeping the fixed. The Murnaghan fit parameters and transition pressure from the phase are given in Table 12.
III.5 Band structure of NaGaO2 in structure
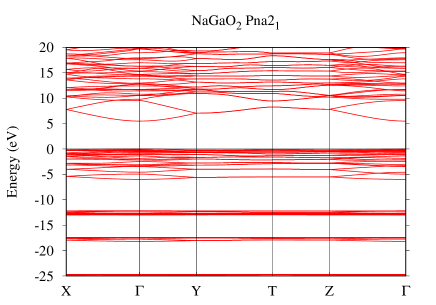
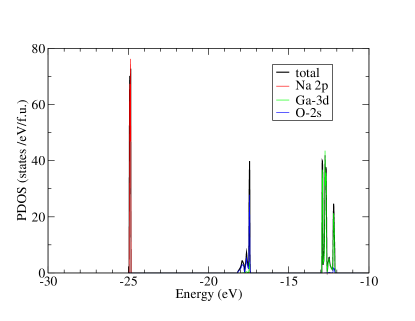
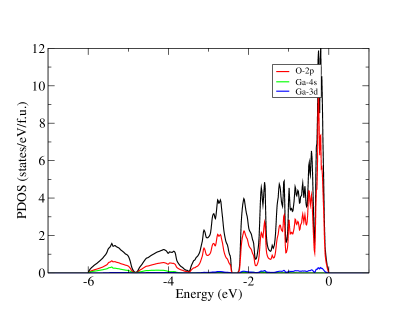
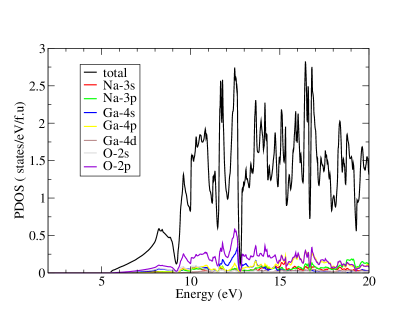
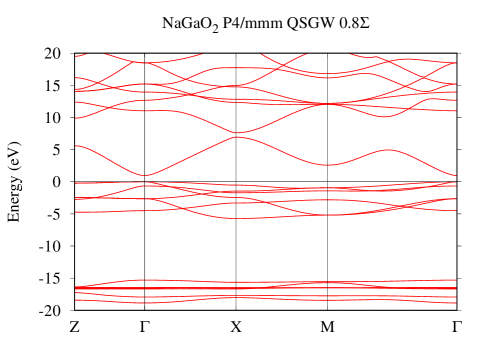
The large energy scale band structure of NaGaO2 is shown in Fig. 11. The partial densities of states in the valence and conduction band region are given in Fig. 12. They show similar to LiGaO2 that the Ga- bands lie above the O- ones and that the Na contribution to the conduction band PDOS occurs mainly well above the conduction band minimum, while the latter is dominated by Ga-. This is also shown in Fig. 13 which shows the Ga- and Na- contributions to the conduction bands. In addition, the Na- semicore levels are seen to lie at about eV.
| band | irrep | (eV) | |||
|---|---|---|---|---|---|
| CBM | 5.486 | 0.33 | 0.35 | 0.35 | |
| VBM1 | 0 | 6.8 | 2.7 | 0.5 | |
| VBM2 | 0.5 | 2.7 | 9.5 | ||
| VBM3 | 3.4 | 0.6 | 3.1 |
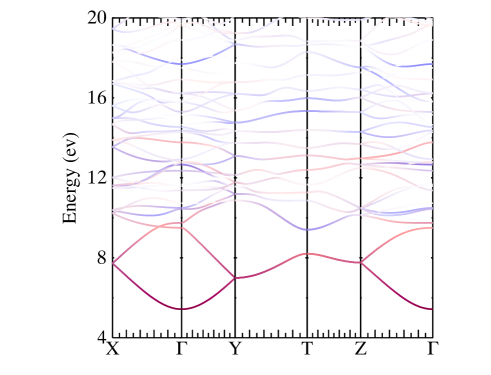
A zoom in on the valence band maximum and conduction band minimum range are shown in Fig. 14. The band splittings of the VBM and corresponding effective mass tensor components are given in Table 13. The band gap is only slightly lower than for LiGaO2 with a value of 5.49 eV in the 0.8 approximation and 2.88 eV in the GGA approximation. The shift of the individual band edges between GGA and 0.8 is eV in the valence band and 1.12 eV in the conduction band. The band gap is probably still slightly overestimated because of the GGA overestimate of the lattice constant. Including a zero-point motion correction similar to LiGaO2 and a lowering of gap by the deformation potential correction, we estimate that the gap is 5.1 eV, which is only slightly lower than in LiGaO2 and still significantly higher than in -Ga2O3.
The dielectric functions and optical absorption are given in Figs. 15,16. They confirm the analysis of the optical anisotropy of the absorption onset based on the symmetry labeled valence bands. An interesting difference from LiGaO2 is that in NaGaO2, the and polarization onsets of absorption are close to each other while the onset is larger. In contrast in LiGaO2 the and onsets are close but both larger than the onset. Thus for light incident on the basal plane (the -plane) there will be a larger anisotropy in the plane between the two polarizations and for NaGaO2 than for LiGaO2. On the other hand, in terms of transparent conductor applications, we again see a large splitting between the lowest and next higher conduction band of 4.07 eV, even larger than in LiGaO2.
The dielectric constant (diagonal) tensor components and directional average are given in Table 14 in different approximations. The trends are similar to the LiGaO2 case. This suggests that the QS calculation including the contribution to the matrix elements is an overestimate, perhaps because of neglecting local field effects. The renormalization of the matrix elements gives values close to the GGA and is likely a more realistic estimate.
| method | ||||
|---|---|---|---|---|
| GGA | ||||
| 0.8 | ||||
| 0.8 | ||||
| 0.8 rescaling |

III.6 Band structure of NaGaO2 in and structures.
The band structure of NaGaO2 in the structure is shown in Fig. 17. The band gap is again indirect and equal to 5.38 eV while the direct gap at is 5.57 eV. On the other hand, in the structure the gap is much smaller. In fact, in GGA, there is a band overlap and in the 0.8 QSGW approximation, the gap is only 0.965 eV. Interestingly, in this case the Ga- and O- band hybridize.

IV Conclusions
In this paper we studied the band structures of LiGaO2 and NaGaO2 in three different crystal structures, the ambient pressure equilibrium tetrahedrally bonded and the high-pressure octahedral and hypothetical rocksalt type phase, all using the QS method. The tetrahedrally bonded structure, which is a cation ordered supercell of the parent wurtzite structure is found in both cases to have lower energy than the octahedrally coordinated structure, which is found to be a high-pressure phase with about 20 % smaller volume per formula unit. The materials are ultra-wide band gap semiconductors with gaps of 5.8 eV (LiGaO2) and 5.5 eV (NaGaO2) in the structure, not including zero-point motion corrections, which are estimated to be of order eV. The gap in the high-pressure phase are of similar magnitude but slightly indirect. The valence band is split in three levels due to the orthorhombic crystal field splitting and lead to anisotropy of the optical absorption onset. Effective mass tensors of the top three valence bands and the conduction band were calculated. In view of previous work, indicating that LiGaO2 can be n-type doped by Si or Ge, we consider both materials to be promising as ultrawide gap semiconductors for transparent conductor and high-power transistors. In particular, the conduction band symmetry labeling indicates that no optical transitions can occur between the bottom of the conduction band (when n-type doped) to higher conduction bands for energies less than 4.0 eV. As part of this study, we also determined the transition pressures from the tetrahedrally coordinated to the octahedrally coordinated phase and a rocksalt type phase and found these to agree well with experiments for LiGaO2.
References
- Nanamatsu et al. (1972) S. Nanamatsu, K. Doi, and M. Takahashi, Japanese Journal of Applied Physics 11, 816 (1972).
- Gupta et al. (1976) S. N. Gupta, J. F. Vetelino, V. B. Jipson, and J. C. Field, Journal of Applied Physics 47, 858 (1976).
- Boonchun and Lambrecht (2010) A. Boonchun and W. R. L. Lambrecht, Phys. Rev. B 81, 235214 (2010).
- Rashkeev et al. (1999) S. N. Rashkeev, S. Limpijumnong, and W. R. L. Lambrecht, J. Opt. Soc. Am. B 16, 2217 (1999).
- Marezio (1965) M. Marezio, Acta Crystallographica 18, 481 (1965).
- Ishii et al. (1998) T. Ishii, Y. Tazoh, and S. Miyazawa, J. Crystal Growth 186, 409 (1998).
- Sakurada et al. (2007) K. Sakurada, A. Kobayashi, Y. Kawaguchi, J. Ohta, and H. Fujioka, Applied Physics Letters 90, 211913 (2007), https://doi.org/10.1063/1.2737928 .
- Omata et al. (2008) T. Omata, K. Tanaka, A. Tazuke, K. Nose, and S. Otsuka-Yao-Matsuo, J. Appl. Phys. 103, 083706 (2008).
- Omata et al. (2011) T. Omata, M. Kita, K. Nose, K. Tachibana, and S. Otsuka-Yao-Matsuo, Jpn. J. Appl. Phys. 50, 031102 (2011).
- Ohkubo et al. (2002) I. Ohkubo, C. Hirose, K. Tamura, J. Nishii, H. Saito, H. Koinuma, P. Ahemt, T. Chikyow, T. Ishii, S. Miyazawa, Y. Segawa, T. Fukumura, and M. Kawasaki, Journal of Applied Physics 92, 5587 (2002).
- Boonchun and Lambrecht (2011) A. Boonchun and W. R. L. Lambrecht, in Oxide-based Materials and Devices II, Proceedings of SPIE, Vol. 7940, edited by F. H. Terani, D. C. Look, and D. J. Rogers, International Society for Optics and Photonics (SPIE, 2011) pp. 129–134.
- Boonchun et al. (2019) A. Boonchun, K. Dabsamut, and W. R. L. Lambrecht, Journal of Applied Physics 126, 155703 (2019).
- Dabsamut et al. (2020) K. Dabsamut, A. Boonchun, and W. R. L. Lambrecht, Journal of Physics D: Applied Physics (2020).
- Lenyk et al. (2018) C. A. Lenyk, M. S. Holston, B. E. Kananen, L. E. Halliburton, and N. C. Giles, Journal of Applied Physics 124, 135702 (2018).
- Skachkov et al. (2020) D. Skachkov, W. R. L. Lambrecht, K. Dabsamut, and A. Boonchun, Journal of Physics D: Applied Physics 53, 17LT01 (2020).
- Sasaki et al. (2013) K. Sasaki, M. Higashiwaki, A. Kuramata, T. Masui, and S. Yamakoshi, J. Cryst. Growth 378, 591 (2013), the 17th International Conference on Molecular Beam Epitaxy.
- Green et al. (2016) A. J. Green, K. D. Chabak, E. R. Heller, R. C. Fitch, M. Baldini, A. Fiedler, K. Irmscher, G. Wagner, Z. Galazka, S. E. Tetlak, A. Crespo, K. Leedy, and G. H. Jessen, IEEE Electron Device Letters 37, 902 (2016).
- Wolan and Hoflund (1998) J. T. Wolan and G. B. Hoflund, J. Vac. Sci. Tech. A 16, 3414 (1998).
- Chen et al. (2014) C. Chen, C.-A. Li, S.-H. Yu, and M. M. Chou, Journal of Crystal Growth 402, 325 (2014).
- Johnson et al. (2011) N. W. Johnson, J. A. McLeod, and A. Moewes, Journal of Physics: Condensed Matter 23, 445501 (2011).
- Ratnaparkhe and Lambrecht (2020) A. Ratnaparkhe and W. R. L. Lambrecht, Physica Status Solidi (b) 257, 1900317 (2020).
- Ratnaparkhe and Lambrecht (2017) A. Ratnaparkhe and W. R. L. Lambrecht, Applied Physics Letters 110, 132103 (2017).
- (23) MP, https://materialsproject.org/.
- (24) http://www.questaal.org/.
- Pashov et al. (2019) D. Pashov, S. Acharya, W. R. Lambrecht, J. Jackson, K. D. Belashchenko, A. Chantis, F. Jamet, and M. van Schilfgaarde, Computer Physics Communications , 107065 (2019).
- Methfessel et al. (2000) M. Methfessel, M. van Schilfgaarde, and R. A. Casali, in Electronic Structure and Physical Properties of Solids. The Use of the LMTO Method, Lecture Notes in Physics, Vol. 535, edited by H. Dreyssé (Berlin Springer Verlag, 2000) p. 114.
- Kotani and van Schilfgaarde (2010) T. Kotani and M. van Schilfgaarde, Phys. Rev. B 81, 125117 (2010).
- Giannozzi et al. (2009) P. Giannozzi, S. Baroni, N. Bonini, M. Calandra, R. Car, C. Cavazzoni, D. Ceresoli, G. L. Chiarotti, M. Cococcioni, I. Dabo, A. D. Corso, S. de Gironcoli, S. Fabris, G. Fratesi, R. Gebauer, U. Gerstmann, C. Gougoussis, A. Kokalj, M. Lazzeri, L. Martin-Samos, N. Marzari, F. Mauri, R. Mazzarello, S. Paolini, A. Pasquarello, L. Paulatto, C. Sbraccia, S. Scandolo, G. Sclauzero, A. P. Seitsonen, A. Smogunov, P. Umari, and R. M. Wentzcovitch, Journal of Physics: Condensed Matter 21, 395502 (2009).
- Perdew et al. (1996) J. P. Perdew, K. Burke, and M. Ernzerhof, Phys. Rev. Lett. 77, 3865 (1996).
- Hedin (1965) L. Hedin, Phys. Rev. 139, A796 (1965).
- Hedin and Lundqvist (1969) L. Hedin and S. Lundqvist, in Solid State Physics, Advanced in Research and Applications, Vol. 23, edited by F. Seitz, D. Turnbull, and H. Ehrenreich (Academic Press, New York, 1969) pp. 1–181.
- Kotani et al. (2007) T. Kotani, M. van Schilfgaarde, and S. V. Faleev, Phys.Rev. B 76, 165106 (2007).
- van Schilfgaarde et al. (2006) M. van Schilfgaarde, T. Kotani, and S. V. Faleev, Phys.Rev. B 74, 245125 (2006).
- Marezio and Remeika (1965) M. Marezio and J. Remeika, Journal of Physics and Chemistry of Solids 26, 1277 (1965).
- Lei et al. (2010) L. Lei, T. Irifune, T. Shinmei, H. Ohfuji, and L. Fang, Journal of Applied Physics 108, 083531 (2010).
- Lei et al. (2013) L. Lei, H. Ohfuji, J. Qin, X. Zhang, F. Wang, and T. Irifune, Solid State Communications 164, 6 (2013).
- Koster et al. (1963) G. F. Koster, J. O. Dimmock, R. G. Wheeler, and H. Statz, Properties of the Thirty-Two Point Groups (MIT Press, Cambridge, MA, 1963).
- Lambrecht et al. (2002) W. R. L. Lambrecht, A. V. Rodina, S. Limpijumnong, B. Segall, and B. K. Meyer, Phys. Rev. B 65, 075207 (2002).
- Tumėnas et al. (2017) S. Tumėnas, P. Mackonis, R. Nedzinskas, L. Trinkler, B. Berzina, V. Korsaks, L. Chang, and M. Chou, Applied Surface Science 421, 837 (2017).
- Levine and Allan (1989) Z. H. Levine and D. C. Allan, Phys. Rev. Lett. 63, 1719 (1989).
- Cunningham et al. (2018) B. Cunningham, M. Grüning, P. Azarhoosh, D. Pashov, and M. van Schilfgaarde, Phys. Rev. Materials 2, 034603 (2018).
- Bhandari et al. (2018) C. Bhandari, M. van Schilfgaarde, T. Kotani, and W. R. L. Lambrecht, Phys. Rev. Materials 2, 013807 (2018).
- Lambrecht et al. (2017) W. R. L. Lambrecht, C. Bhandari, and M. van Schilfgaarde, Phys. Rev. Materials 1, 043802 (2017).
- Verdi and Giustino (2015) C. Verdi and F. Giustino, Phys. Rev. Lett. 115, 176401 (2015).