Surveying the X-ray Behavior of Novae as They Emit -rays
Abstract
The detection of GeV -ray emission from Galactic novae by Fermi-LAT has become routine since 2010, and is generally associated with shocks internal to the nova ejecta. These shocks are also expected to heat plasma to K, resulting in detectable X-ray emission. In this paper, we investigate 13 -ray emitting novae observed with the Neil Gehrels Swift Observatory, searching for 1–10 keV X-ray emission concurrent with -ray detections. We also analyze -ray observations of novae V407 Lup (2016) and V357 Mus (2018). We find that most novae do eventually show X-ray evidence of hot shocked plasma, but not until the -rays have faded below detectability. We suggest that the delayed rise of the X-ray emission is due to large absorbing columns and/or X-ray suppression by corrugated shock fronts. The only nova in our sample with a concurrent X-ray/-ray detection is also the only embedded nova (V407 Cyg). This exception supports a scenario where novae with giant companions produce shocks with external circumbinary material and are characterized by lower density environments, in comparison with novae with dwarf companions where shocks occur internal to the dense ejecta.
1 Introduction
A classical nova is a transient event involving an accreting white dwarf in a binary star system (e.g., Bode & Evans 2008). Once the pressure and temperature at the base of the accreted envelope reach a critical level, a thermonuclear runaway is triggered on the surface of the white dwarf, leading to the ejection of at least part of the envelope. Typically, M⊙ of material is ejected at velocities ranging between 500 and 5,000 km s-1 (e.g., Payne-Gaposchkin, 1957; Gallagher & Starrfield, 1978; Yaron et al., 2005). Remnants of the accreted envelope remain on the white dwarf’s surface and continue nuclear burning for weeks to years after the thermonuclear runaway ends, bathing the ejecta with luminous ionizing radiation from within ( erg s-1; Wolf et al. 2013). Early in the nova’s evolution, the ejecta are optically thick, and as the thermal emission from the white dwarf diffuses through the ejecta, the nova’s spectral energy distribution peaks in the optical band. As the ejecta expand, their density drops, they become more optically-thin, and the peak of the nova’s spectral energy distribution moves blueward (Gallagher & Code, 1974). When the white dwarf is finally revealed, the nova is considered a supersoft X-ray source (emitting at photon energies keV), and it will remain in this state for days–years, until the residual fuel is all burnt (Krautter, 2008; Schwarz et al., 2011; Page & Osborne, 2014; Osborne, 2015). After a period of time, accretion will resume and the process restarts. All novae are theorized to recur, but some novae have been observed to erupt more than once during our observational records; these are known as recurrent novae.
The discovery of GeV -rays from nova V407 Cyg with the Large Area Telescope (LAT) on the Fermi Gamma-Ray Space Telescope (henceforth Fermi) has opened the door for a whole new realm of nova research (Abdo et al., 2010). At first, the -rays were thought to be the result of the ejecta interacting with the dense wind of V407 Cyg’s Mira giant companion, and not a feature of typical nova systems (e.g., Munari et al., 2011; Nelson et al., 2012a). However, the discovery of -rays from V959 Mon, V1324 Sco, and V339 Del with Fermi-LAT in the following years revealed that V407 Cyg was not a singular case (Ackermann et al., 2014). Unlike V407 Cyg, these systems contain main-sequence companions, so the -rays could not be coming from the ejecta interacting with a dense circumbinary medium.
Since 2013, even more novae with main sequence companions have been detected in the GeV -ray band. These observations reveal that shocks are common in nova eruptions and that they are energetically important (Li et al., 2017b; Aydi et al., 2020a). As the majority of Fermi-detected novae have dwarf (rather than giant) companions and low-density circumbinary material, the -ray emitting shocks must be internal to the nova ejecta. From high-resolution radio imaging of the nova V959 Mon, it was found that these shocks may occur at the interface between a slow, dense, equatorial torus and a fast biconical wind (Chomiuk et al., 2014). The shocks produced at these interfaces accelerate particles to relativistic speeds via the diffusive shock mechanism and lead to GeV -ray emission (Metzger et al., 2015). These internal shocks have velocities 1000 km s-1, and consequently heat the post-shock gas to temperatures of K, which emits relatively hard (1 keV; compared to the supersoft component) X-rays. Even before -rays were detected in novae, hard X-ray emission was observed and interpreted as an indication of shock interaction (e.g., Mukai & Ishida 2001; Mukai et al. 2008).
In the last two decades, the X-ray Telescope (XRT; Burrows et al. 2005) on the Neil Gehrels Swift Observatory (hereafter Swift; Gehrels et al. 2004) has been instrumental in providing observations for novae in the 0.3 – 10 keV band at relatively high cadence (e.g., Page et al. 2019). For example, V407 Cyg showed hard X-ray emission during its first months of evolution concurrent with the -ray producing phase; as with the -rays, this is likely a result of the nova ejecta interacting with the secondary’s wind (Abdo et al., 2010; Orlando & Drake, 2012; Nelson et al., 2012b).
The hard X-ray behavior of classical novae with main sequence companions is less clear, especially while -rays are being detected. Swift observed V1324 Sco while GeV -rays were detected, but failed to detect any X-rays (Finzell et al., 2018). Based on this non-detection, Metzger et al. (2014) theorized that the X-ray emission from classical novae during the -ray period would be absorbed by the initially dense ejecta. These absorbed X-rays are then reprocessed and re-emitted as UV and optical photons, contributing to the luminosity in those bands (supporting this hypothesis, correlated -ray and optical light curves have been observed in two novae to date; Li et al. 2017b; Aydi et al. 2020a). Once the ejecta expand enough and the optical depth decreases, X-rays are allowed through.
Similar to V1324 Sco, there are hints from other novae that 1–10 keV X-rays were not detectable by Swift until 1 month after eruption (e.g., Shore et al. 2016, Mason et al. 2018), but the X-ray light curves were not explicitly discussed in the context of -rays and shocks. Interestingly, harder X-rays (10 keV) from novae have begun to be detected with NuSTAR concurrent with -rays (Nelson et al., 2019; Aydi et al., 2020b; Sokolovsky et al., 2020a), but at surprisingly low fluxes (the implications of these observations will be discussed in Section 4). Despite the rapid response and agility of Swift that make it ideal for observations during the early weeks of nova eruptions (when novae are bright in GeV -rays), no systematic study has been carried out of Swift-XRT observations of -ray detected novae. It is the goal of this paper to test if all classical novae are faint in the 1–10 keV X-ray band during -ray detection.
| Nova | Time | Time | -ray Flux | Photon index | Reference |
|---|---|---|---|---|---|
| (MJD) | (MJD) | (10-7 photon s-1 cm-2) | |||
| V392 Per | 58238bbDue to Fermi-LAT downtime, data are not available for MJD 58224-58238. When observations resumed on MJD 58238, V392 Per was immediately detected. The -ray flux is calculated over MJD 58238–58246. | 58246 | 10,11 | ||
| V906 Car | 58216aaDue to Fermi-LAT downtime, the start time of -ray detection for V906 Car was not captured, and the end time is only constrained to be within a date range. The -ray flux is calculated over MJD 58216–58239. | 58239–58250aaDue to Fermi-LAT downtime, the start time of -ray detection for V906 Car was not captured, and the end time is only constrained to be within a date range. The -ray flux is calculated over MJD 58216–58239. | 9 | ||
| V357 Mus | 58129 | 58156 | 8, This work | ||
| V549 Vel | 58037 | 58070 | 6,7 | ||
| V5856 Sgr | 57700 | 57715 | 5 | ||
| V5855 Sgr | 57686 | 57712 | 4 | ||
| V407 Lup | 57657 | 57660 | 3, This work | ||
| V5668 Sgr | 57105 | 57158 | 2 | ||
| V1369 Cen | 56634 | 56672 | 2 | ||
| V339 Del | 56520 | 56547 | 1 | ||
| V959 Mon | 56097 | 56119 | 1 | ||
| V1324 Sco | 56093 | 56110 | 1 | ||
| V407 Cyg | 55265 | 55287 | 1 |
Previous studies have been carried out on large collections of novae in the supersoft X-ray phase using observations from Swift-XRT, including Ness et al. (2007); Schwarz et al. (2011), and Page et al. (2019). However, systematic studies of the harder X-ray component, or the X-ray behavior of -ray detected novae, are lacking. In this paper, we present a systematic study of 13 Galactic novae which have been detected by Fermi-LAT between 2010 and 2018 and have been observed by Swift-XRT. In Section 2 we discuss the sample selection and the multi-wavelength properties of the novae in our sample. Fermi-LAT data for most novae in our sample have already been published, but we present the first -ray analysis of novae V407 Lup and V357 Mus. In Section 3 we present the Swift-XRT observations, emphasizing the hard X-ray emission during the -ray detection phase. In Section 4 we discuss what can be learned about nova shocks from observations concurrent with -rays, and in Section 5 we conclude.
2 Our Sample of -ray Detected Novae
2.1 Sample Selection
In this paper, we analyze all Galactic novae observed by Fermi-LAT between 2010 and 2018 that have a time-integrated detection significance over the period of -ray emission. Details of the sample are listed in Table 1. Despite hints that they produced -ray emission, we do not include novae V745 Sco, V697 Car, or V1535 Sco in our sample because their Fermi-LAT detections were 3 significance (Franckowiak et al., 2018).
2.2 -ray Properties
Parameterizations of the -ray light curves for our 13 novae are provided in Table 1, taken from references listed therein. Time and time denote the time range during which -rays are detected at 2 significance when binning Fermi-LAT light curves with 1-day cadence. The -ray flux column lists the average flux over this time period, fitting a single power law to the data over the energy range 100 MeV. Table 1 also lists the photon index for a single power law fit to the Fermi-LAT data with energy 100 MeV:
| (1) |
where is the number of photons, is the photon energy, and is the photon index. Although a single power law may not be the most physically motivated model, it is the simplest (most justified in cases of low S/N), and most widely quoted in studies of the various novae. It is sufficient for estimating -ray luminosities to the precision required for this study; modelling with a more complex exponentially-cutoff power law spectrum yields fluxes 75–85% that of a simple power law (Ackermann et al., 2014).
The -ray detections of novae V407 Lup and V357 Mus have been announced in Cheung et al. (2016a) and Li et al. (2018b) respectively, but a full analysis of their light curves has not yet been published. We therefore provide this analysis here, in the following sub-sections.
2.2.1 Fermi-LAT data reduction
We downloaded the LAT data (Pass 8, Release 3, Version 2 with the instrument response functions of P8R3_SOURCE_V2) from the data server at the Fermi Science Support Center (FSSC). For data reduction and analysis, we used fermitools (version 1.0.5) with fermitools-data (version 0.17)111https://fermi.gsfc.nasa.gov/ssc/data/analysis/software/. For data selection, we used a region of interest on each side, centered on the nova. Events with the class evclass=128 (i.e., SOURCE class) and the type evtype=3 (i.e., reconstructed tracks FRONT and BACK) were selected. We excluded events with zenith angles larger than to avoid contamination from the Earth’s limb. The selected events also had to be taken during good time intervals, which fulfils the gtmktime filter (DATA_QUAL0)&&(LAT_CONFIG==1).
Next, we performed binned likelihood analysis on the selected LAT data. For each nova, a -ray emission model for the whole region of interest was built using all of the 4FGL cataloged sources located within of the optical position (The Fermi-LAT collaboration, 2019). As the two novae were the brightest -ray sources in the fields (within at least 5 degrees according to the preliminary results), we only freed the normalization parameters for those cataloged sources located less than 1 degree from the targets. In addition, the Galactic diffuse emission and the extragalactic isotropic diffuse emission were included by using the Pass 8 background models gll_iem_v07.fits and iso_P8R3_SOURCE_V2_v1.txt, respectively, which were allowed to vary during the fitting process.
2.2.2 -rays from V407 Lup
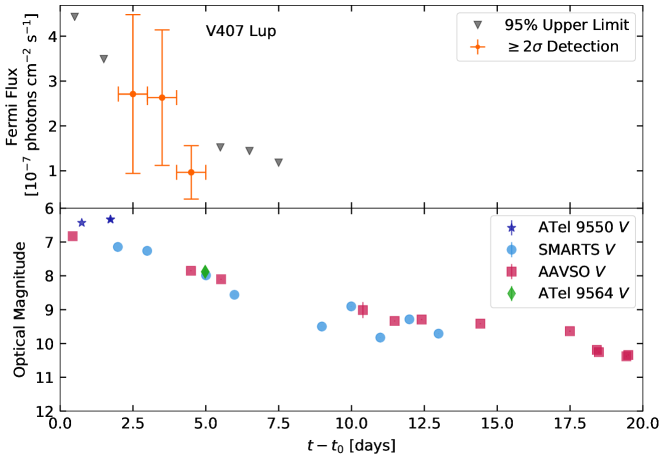
Nova V407 Lup (ASASSN-16kt) was discovered by the All-Sky Automated Survey for Supernovae (ASAS-SN) on 2016 September 24.0 UT at = 9.1 (Stanek et al. 2016; Aydi et al. 2018b). The nova was first detected in -rays on the same day as its optical discovery but did not reach a significance of 3 until the next day, when the detection significance reached (with a Test Statistic ). The average flux over the detection duration was photon s-1 cm2. A single power-law fit gives a photon index of .
The -ray light curve, shown in the top panel of Figure 1, shows a decrease in flux, completely fading below the LAT detection limit by 5 days after discovery. This makes V407 Lup’s -ray duration the shortest known to date for a nova (Table 1). The bottom panel of Figure 1 shows the optical behavior of V407 Lup in the V-band during and shortly after the -ray period. This light curve is constructed from publicly available photometry from the American Association of Variable Star Observers (AAVSO; Kafka 2020) and the Stony Brook/SMARTS Atlas (SMARTS photometry can be found at Ref.222http://www.astro.sunysb.edu/fwalter/SMARTS/NovaAtlas/; Walter et al. 2012), along with Chen et al. (2016) and Prieto (2016). The optical light curve rapidly declines alongside the -rays, exhibiting the shortest value of any nova in our sample (Table 2). The light curve shows what could possibly be a lag in the -ray emission compared to the optical. However, the date of the optical peak as estimated by Aydi et al. (2018a) is MJD 58656.4, implying that the first 3 -ray detection lags the optical peak by only 0.6 days. Based on the cadence of the optical and -ray observations, which is around 0.5 days, this delay may be insignificant. A delay between the optical and -ray emission, if it exists, would have significant implications on our understanding of shock formation and -ray emission in novae (see e.g., Metzger et al. 2015 and Aydi et al. 2020a).
2.2.3 -rays from V357 Mus
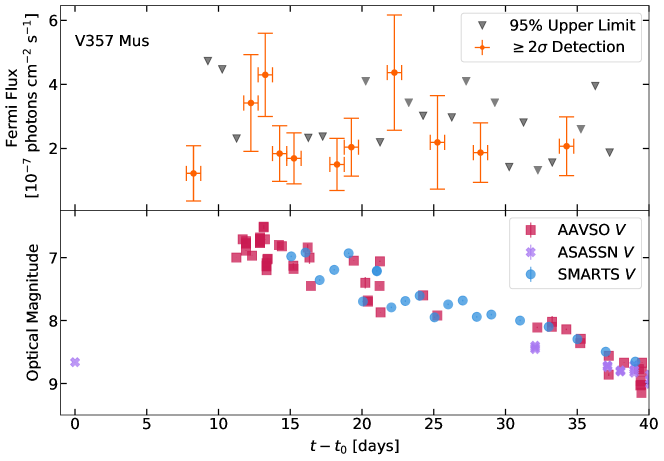
Nova V357 Mus was discovered in the optical on 2018 Jan 14.5 UT at 7 mag (Kaufman et al., 2018). It was first detected in -rays eight days later (Li et al., 2018b). The average 100 MeV flux over the detection period was photon s-1 cm2, and the photon index from fitting a single power law was . The detection significance was over this period (with a Test Statistic ).
The -ray light curve is shown in the top panel of Figure 2. There may be variability of a factor of 2 in the light curve, but the low S/N makes it challenging to confidently measure this variability. The corresponding optical light curve is shown in the bottom panel of Figure 2, with data from ASAS-SN (Shappee et al., 2014), the Stony Brook/SMARTS Atlas, and AAVSO. The nova was detected by ASAS-SN on the rise to optical maximum but quickly became so bright that it saturated the detectors. Observations resumed around day 10 when amateur observers found the nova and began taking data (Kaufman et al., 2018). The nova likely reached a magnitude brighter than 6 mag at optical maximum (which was sometime between 0–10 days after the ASAS-SN pre-maximum detection). While the cadence and S/N of the -ray and optical light curves are not high enough to confirm, this nova may show evidence of correlated variation between the optical and -ray light curves, similar to the two brightest -ray novae V906 Car (Aydi et al., 2020a) and V5856 Sgr (Li et al., 2017b).
| Name | aaDate of first observation in eruption. | aaDate of first observation in eruption. | Discovery Magbb band, unless otherwise noted. | Dust? | Spec. Class | FWHM | Distance | N(H) | ||
|---|---|---|---|---|---|---|---|---|---|---|
| (MJD) | (Date, UT) | (mag) | (mag) | (Y/N) | (days) | (km s-1) | (kpc) | ( cm-2) | ||
| V392 Per | 58237.47 (1) | 2018-04-29.47 (1) | 6.2 (1) | 5.6 (2) | - | 3 (29) | Fe II (2) | 4700 (2) | 4.1 (25) | 3.40.4 (2) |
| V906 Car | 58193.03 (28) | 2018-03-16.03 (28) | 10ccImage was saturated. (3) | 5.9 (28) | Y (28) | 44 (28) | Fe II (28) | 1500 (2) | 4.0 (28) | 3.10.4 (2) |
| V357 Mus | 58121.24 (4) | 2018-01-3.24 (4) | 7.0 (5) | 7.0 (5) | - | 40 (2) | Fe II (5) | 1200 (2) | 3.2 (2) | 4.20.8 (2) |
| V549 Vel | 58020.39 (6) | 2017-09-24.39 (6) | 11.3 (6) | 9.1 (2) | - | 90 (2) | Fe II (7) | 2300200 (2) | 4 (2) | 9.01.0 (2) |
| V5856 Sgr | 57686.02 (8) | 2016-10-25.02 (8) | 13.7 (9) | 5.4 (8) | - | 10 (8) | Fe II (8) | 1600 (2) | 2.5 (2) | 3.10.4 (2) |
| V5855 Sgr | 57681.38 (11) | 2016-10-20.84 (11) | 10.7ddImage was obtained in an unfiltered optical band. (11) | 7.5 (11) | - | 17 (2) | Fe II (12) | 200200 (2) | 4.5 (11) | — |
| V407 Lup | 57655.00 (13) | 2016-09-24.00 (13) | 9.1 (13) | 5.6 (14) | N (2) | 31 (5) | He/N (14) | 2900100 (2) | 4.20.5 (2) | 9.01.2 (2) |
| V5668 Sgr | 57096.63 (15) | 2015-03-15.63 (15) | 6.0ddImage was obtained in an unfiltered optical band. (15) | 4.4 (16) | Y (17) | 752 (2) | Fe II (2) | 1300100 (2) | 2.80.5 (2) | 5.90.8 (2) |
| V1369 Cen | 56628.69 (18) | 2013-12-2.69 (18) | 5.5ddImage was obtained in an unfiltered optical band. (18) | 3.3 (2) | Y (2) | 402 (2) | Fe II (2) | 1200100 (2) | 1.00.4 (2) | 0.60.1 (2) |
| V339 Del | 56518.58 (19) | 2013-08-14.58 (19) | 6.8ddImage was obtained in an unfiltered optical band. (19) | 4.3 (2) | N (2) | 111 (2) | Fe II (2) | 1700100 (2) | 4.91 (2) | 1.70.4 (2) |
| V959 Mon | 56097.00 (20) | 2012-06-19.00 (20) | 9.9 (2) | N/AffOptical maximum was during solar conjunction, so was missed (27) | N (2) | 10 (2) | He/N (21) | 2000200 (2) | 1.40.4 (26) | 3.40.4 (2) |
| V1324 Sco | 56069.80 (22) | 2012-05-22.80 (22) | 18.5eeImage was obtained in the band. (23) | 9.8 (2) | Y (22) | 24 (29) | Fe II (22) | 1900200 (2) | 6.5 (29) | 10.10.7 (2) |
| V407 Cyg | 55265.81 (24) | 2010-03-10.81 (24) | 6.8ddImage was obtained in an unfiltered optical band. (24) | 7.1 (24) | - | 5.9 (24) | He/N (24) | 1400100 (2) | 3.40.5 (2) | 5.60.8 (2) |
2.3 Optical Properties
Table 2 presents the main characteristics of the novae in our sample, some of which are compiled from the literature (with references given in parentheses following each table entry) and others estimated for the first time here. It includes date of first detection in eruption () in MJD and UT, optical magnitude at , peak magnitude in the -band (), and the time for the optical light curve to decline by two magnitudes from maximum (). The peak magnitude and are determined from reports in the literature or derived in this work using publicly available photometry from the AAVSO, ASAS-SN, and the Stony Brook/SMARTS Atlas. is measured as the duration between the first peak and the last time the nova reaches two magnitudes fainter than the peak.
We also list whether or not the nova formed dust based on reports in the literature or examining publicly available optical and near-infrared (NIR) photometry, particularly from SMARTS and AAVSO, to search for dust dips in the optical light and/or IR excess. For some novae, we cannot tell if the nova has formed dust or not due to lack of multi-band photometric follow-up.
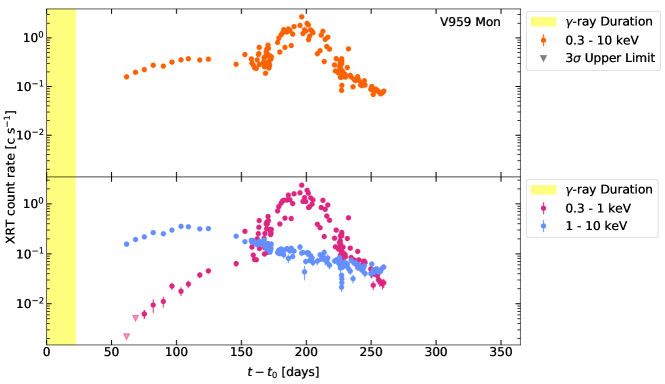
We give the spectroscopic class (Fe ii or He/N; Williams 1992) and the Full Width at Half Maximum (FWHM) of Balmer emission lines after optical peak. The spectroscopic classes are based on previous reports in the literature or determined based on spectra obtained around optical peak (). These spectra are either publicly available spectra from the Astronomical Ring for Access to Spectroscopy (ARAS333http://www.astrosurf.com/aras/Aras_DataBase/Novae.htm; Teyssier 2019) or from our private database. The FWHM are measured from the same spectra by fitting a single Gaussian profile to the Balmer emission lines. Nova V959 Mon is an exception since this nova was discovered in optical 56 days after its -ray detection by Fermi-LAT due to solar conjunction. The optical spectrum we use to determine the FWHM has been obtained 3 days after its optical discovery (around 60 days after optical peak, given that for most novae the -ray detection occurs near optical peak).
We also use high-resolution optical spectroscopy to estimate the Galactic column density towards each nova. Again, these spectra are either from ARAS or from our private database, and are obtained near the light curve peak. We measure the equivalent widths of some diffuse interstellar bands (DIBs) and use the empirical relations of Friedman et al. (2011) to derive an estimate of . is then derived assuming an extinction law of = 3.1. This is converted into an absorbing column density, , using the relation from Bahramian et al. (2015): = () .
We also list distance estimates to the novae in our sample. For novae without an accurate distance estimate in the literature, we estimate the distance using our derived extinction values, along with the 3D Galactic reddening maps of Chen et al. (2019).
In our nova sample, one system is known to have a Mira giant secondary, namely V407 Cyg. The other 12 novae in the sample are likely systems with dwarf secondaries and will be designated as “classical novae” in the rest of the paper. However, it should be noted that V392 Per was recently found to have a mildly-evolved secondary star, with a binary orbital period of 3.4 days (Munari et al., 2020), implying that V392 Per may be a “bridge” object between embedded novae with dense circumstellar material and classical novae with low-density surroundings.
3 X-Ray Light Curves
3.1 Swift-XRT observations
The Swift-XRT data products generator (Evans et al., 2007, 2009) was used to produce X-ray (0.3–10 keV) light curves for all the novae in our sample. The same tool was also used to divide the XRT flux into soft (0.3–1.0 keV) and hard (1–10 keV) X-ray bands. Once the data products were generated, the X-ray count rates were filtered to separate the significant detections from the upper limits. Observations with less than 3 confidence on their count rates were considered upper limits. We quote 3 upper limits throughout this paper, calculated using the uncertainty on the count rate.
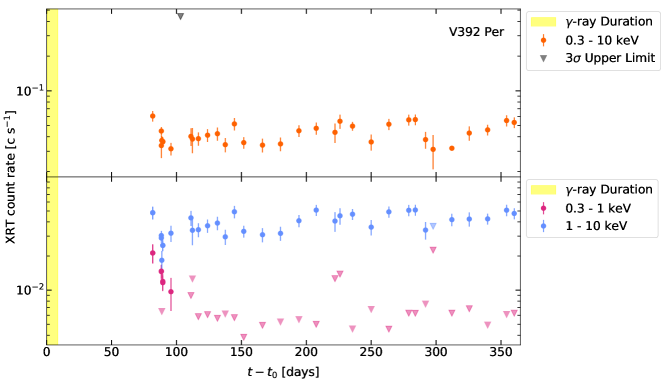
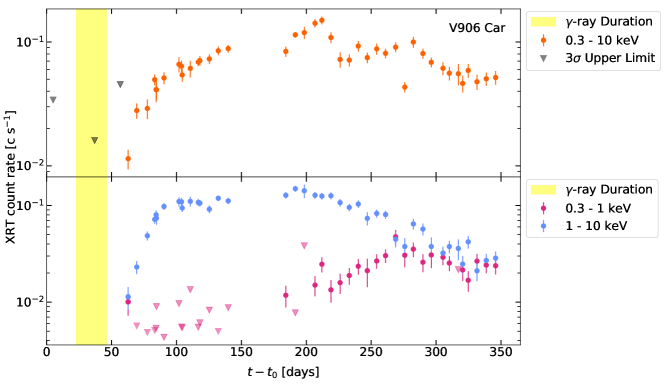
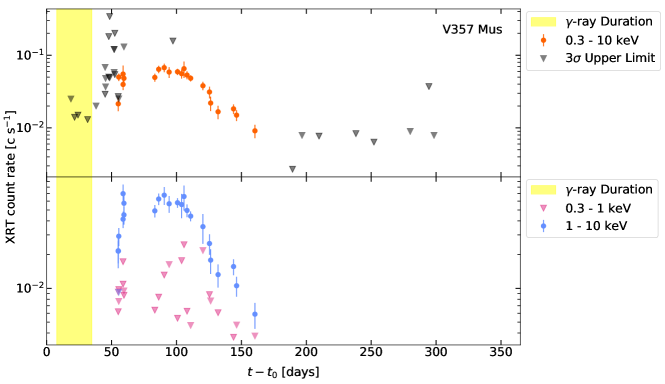
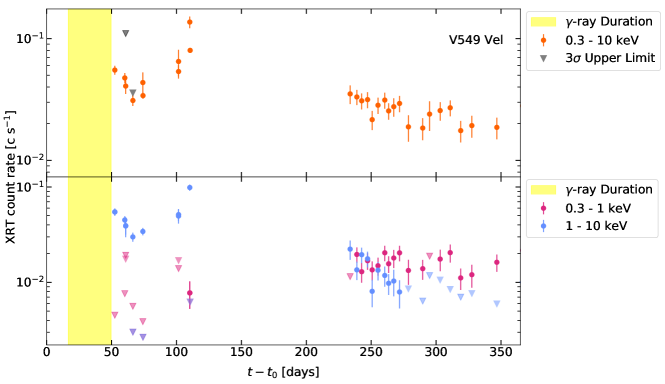
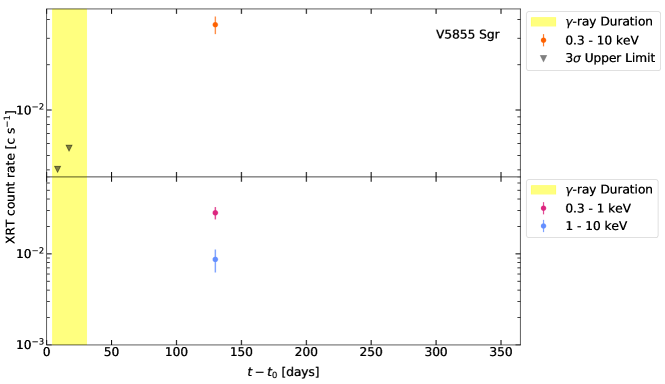
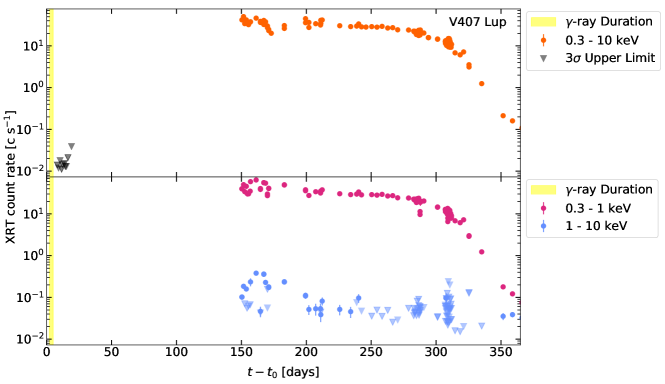
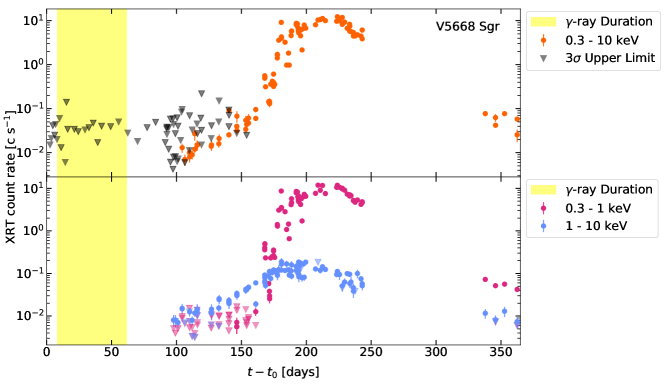
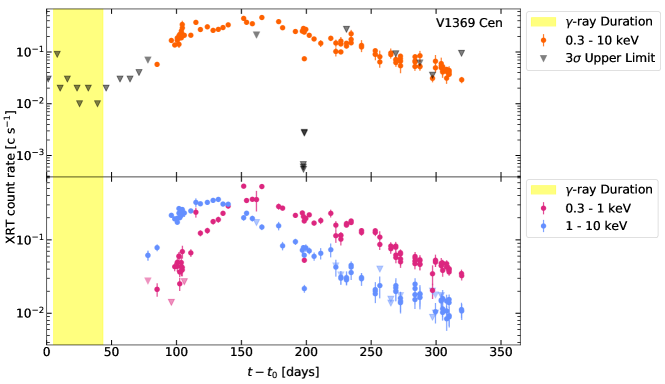
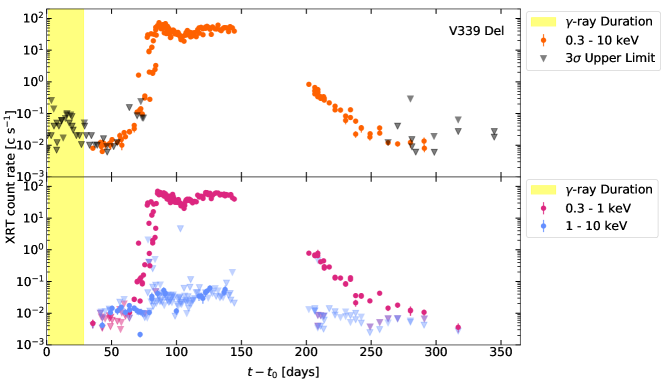
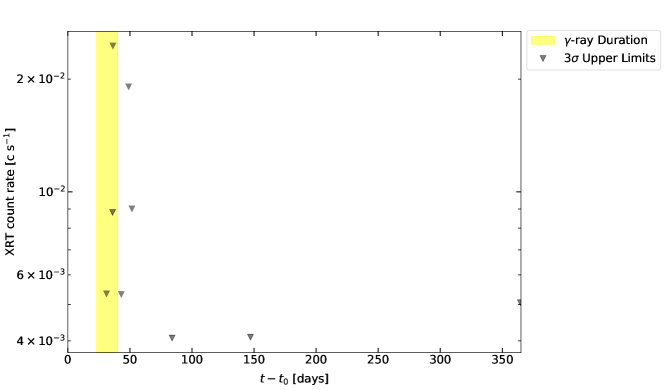
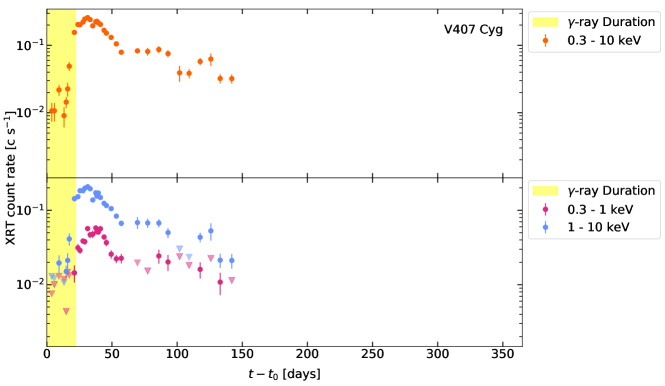
In Figures A.1–A.13, we present the Swift X-ray (0.3–10 keV) light curves of all the novae in our sample. In each figure’s top panel, we plot the total XRT count rate, while the bottom panel distinguishes the light curves in the soft and hard bands. The time range of the Fermi-LAT -ray detection is marked as a yellow bar, and the light curves focus on the first year following nova discovery.
There are Swift observations concurrent with Fermi-LAT -ray detections for 9 of the 13 novae in our sample. Unfortunately, for some of the Fermi-detected novae, Swift observations were not obtained until long after discovery, and were therefore only detected after the end of the Fermi detection. Early observations were limited by solar conjunction for V392 Per, V959 Mon, and V549 Vel.
Many -ray detected novae are very optically bright, and lead to optical loading of the XRT if observed in photon counting mode444https://www.swift.ac.uk/analysis/xrt/optical_loading.php. Therefore, some Swift/XRT observations early in our targets’ eruptions were obtained in the less sensitive windowed timing mode. This affects observations of V906 Car, V357 Mus, V1369 Cen, V5668 Sgr, and V5856 Sgr. The supplementary online tables list information on each observation used, including the corresponding observation mode.
3.2 Hardness ratio evolution
We derive the hardness ratio () for each Swift-XRT detection using the definition from Schwarz et al. (2011):
| (2) |
where is the count rate in the 0.3 – 1.0 keV range and is the count rate in the 1 – 10 keV range. We also use similar criteria as Schwarz et al. (2011) to classify the X-ray emission: we consider the X-ray emission “hard” if HR , and “soft” if HR .
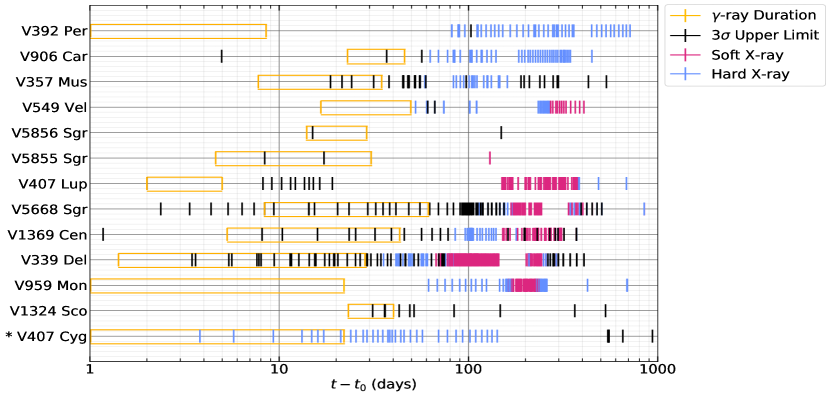
In Figure 3 we present the evolution of the hardness ratio as a function of time since discovery for all the novae in our sample. The plot also shows the duration of the Fermi-LAT -ray detection, represented as a yellow box, to compare with the Swift X-ray observations. Non-detections, denoted as black tick marks in Figure 3, are defined as times when both the hard and soft bands were upper limits. If only one of the bands was detected, this epoch is counted as a detection, and the tick’s color corresponds to the detected band.
The hardness ratio evolution of the novae is quite varied, but the main commonality is the lack of significant X-ray detection during the -ray emission period (with the exception of V407 Cyg).
4 Discussion
4.1 The drivers of hard X-rays in novae
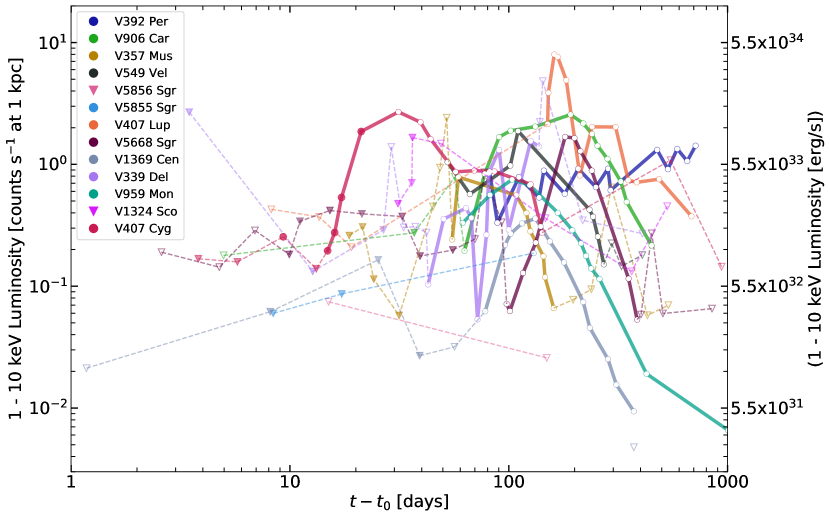
Hard X-ray emission from optically-thin plasma with a temperature of several keV has long been observed in novae and is commonly attributed to shocks (e.g., O’Brien et al., 1994). Figure 4 compares the luminosity light curves in the 1–10 keV range for our nova sample. They have been smoothed to highlight bulk features; see Figures A.1–A.13 for full-cadence light curves. Distances are assumed as listed in Table 2. Count rates are corrected for foreground absorbing columns consistent with the intervening interstellar medium, using the values quoted in Table 2. We do not account for intrinsic absorption (e.g., absorption from the nova ejecta). To make a rough conversion of the Swift-XRT count rate to X-ray flux, we assume a 5 keV thermal bremsstrahlung model (yielding the scale in units of erg s-1 on the right y axis). The unabsorbed fluxes were then corrected for absorption using WebPIMMs as described above and then converted to luminosities scaled at a distance of 1 kpc.
This figure updates a similar plot from Mukai et al. (2008), with the goal of exploring the luminosities and durations of the hard X-ray emission from shocks. Figure 1 in Mukai et al. (2008) shows hard X-ray luminosity as a function of time for 16 novae, but most had very limited time coverage so the duration of hard X-rays was unclear. In our sample, we see that typically the hard X-rays become detectable 1–2 months after the start of eruption, and last several months to a year. The notable exception is V407 Cyg, whose hard X-rays evolve much faster, starting shortly after day 10 (concurrent with -ray detection). This rapid evolution may be attributable to interaction with circumbinary material around the secondary (§4.3); it is notable that other novae with giant companions, RS Oph (Sokoloski et al., 2006; Bode et al., 2006; Mukai et al., 2008), V745 Sco (Page et al., 2015), and V3890 Sgr Page et al. (2020) were all detected in hard X-rays from the first pointed observations. However, RS Oph’s last eruption occurred before the launch of Fermi, so we do not have information on its -ray evolution.
The 1–10 keV X-ray luminosities of novae in Figure 4 peak at erg s-1. While we expect the bulk of the 1–10 keV luminosity to originate from shocked optically thin gas, in some cases it may be dominated by the hard tail of the supersoft component. For example, for moderate absorbing columns cm-2, as expected for the Galactic foreground (Table 2), a erg s-1 blackbody of temperature 90 eV produces 30 times as many counts in the 1–10 keV band555https://heasarc.gsfc.nasa.gov/cgi-bin/Tools/w3pimms/w3pimms.pl as a erg s-1 bremsstrahlung component of temperature 5 keV. Such a hot supersoft component is only expected for a near-Chandrasekhar mass white dwarf (e.g., Osborne et al. 2011), and contamination of the 1–10 keV band depends sensitively on the temperature of the supersoft source. A more typical white dwarf ( 60 eV; Wolf et al. 2013) of a similar luminosity contaminates the 1–10 keV band orders of magnitude less severely, contributing 30% of the 1–10 keV flux.
A detailed analysis of when the supersoft source contributes significantly to the 1–10 keV band would require spectral fitting of the Swift-XRT data and is outside the scope of this paper. However, in the case of a moderate absorbing column, the hardness ratio is a powerful discriminant. For cm-2, the count rate from a supersoft source should be higher in the 0.3–1 keV band compared to the 1–10 keV band. For example, the 1–10 keV X-rays observed from V407 Lup starting around day 150 are likely the hard tail of the supersoft source because the concurrent 0.3–1 keV X-rays are so much brighter (Figure A.7). At higher absorbing columns, the ratio of soft-to-hard X-rays from a supersoft source will be lower. In the case of V339 Del and V1369 Cen, some of the early 1–10 keV X-rays (day 50 and day 80, respectively) could be attributed to the supersoft source beginning to emerge from the absorbing nova ejecta, as the 0.3–1 keV flux is increasing during this time (Figures A.9 and A.10). However, in many of the novae studied here, the 1–10 keV flux is significantly brighter than the 0.3–1 keV flux and relatively stable in time (e.g., Figures A.2, A.3, A.11), implying that the early hard X-rays really are emitted from hot shocked gas.
It is also possible that accretion could be a source of hard X-rays, particularly at late times. This is mainly true for systems with highly magnetized white dwarfs ( G), such as intermediate polars. In such systems, accretion is channeled by the strong magnetic field lines into an accretion column which then slams onto the white dwarf surface at high speeds, increasing the surface temperature and leading to hard X-ray emission (see Warner 1995 for a review). Per example, the hard X-ray emission in Nova V407 Lup around 350 days after eruption is probably due to accretion resuming on the surface of the white dwarf (Figure A.7). This nova occurred in an intermediate-polar system where the white dwarf is highly magnetized (see Aydi et al. 2018b for more details). The luminosity of hard X-ray emission in intermediate polars is usually 1031 – 1034 erg s-1 (Patterson, 1994; Pretorius & Mukai, 2014), which is consistent with the X-ray luminosity of V407 Lup around 2 years after eruption.
Nova V392 Per also shows hard X-ray emission, which is peculiarly constant over a period of more than 250 days (see also Murphy-Glaysher et al. in prep for a more detailed examination of the Swift data). As previously mentioned, this nova was recently found to have a mildly-evolved secondary star (Munari et al., 2020). However, the origin of this constant and extended hard X-ray emission is not clear. While it could be accretion related, it is less likely to be due to shock interaction within the ejecta at this late stage. After the 1998 eruption of nova V2487 Oph, which is characterized by a 1 day orbital period (Anupama, 2013), Hernanz & Sala (2002) found hard X-ray emission more than two years after the eruption with comparable luminosity to that of nova V392 Per ( erg s-1). Hernanz & Sala (2002) attributed this late X-ray emission to accretion resuming on the white dwarf. In addition, Orio et al. (2001)’s study of ROSAT observations of a large number of novae identified late X-ray emission from several novae during quiescence, which they attributed to accretion.
4.2 Novae with dwarf companions are not detected in 1–10 keV X-rays concurrent with -rays
The internal shocks responsible for accelerating particles to relativistic speeds and producing -ray emission have velocities of few thousand km s-1 and are expected to heat the post-shock gas to X-ray temperatures ( K; Metzger et al. 2015). Therefore, it is surprising that we do not detect Swift X-ray emission concurrent with GeV -rays among the classical novae in our sample. Nine of the novae presented here have Swift-XRT observations during their Fermi-LAT detections, and all except V407 Cyg show no X-ray emission during this period. The other four novae did not have Swift observations concurrent with Fermi-LAT detections. In all cases for the classical novae, the first X-ray detection only occurs after the -ray emission falls below the sensitivity limit of Fermi-LAT (Figure 3).
The simplest explanation for the Swift-XRT non-detections during -rays is that the shocks are deeply embedded within the nova ejecta due to their high density (among the highest for astrophysical events: cm-3; see figure 1 in Metzger et al. 2016). Such high densities imply substantial absorbing columns ahead of the shocks, which can absorb photons with energies 10 keV. The other explanation for the X-ray non-detections is that the thermal energy of the shocked material is sapped by cold regions around the shocks before it can be radiated, implying a suppression of the shock’s temperature, i.e., the shocks do not reach X-ray energies (Steinberg & Metzger, 2018). This would lead to a suppression of the X-ray emission that can be detected by Swift.
To constrain the conditions in nova shocks, we compare the Swift-XRT upper limits on the 1–10 keV X-ray luminosity with concurrent GeV -ray luminosities from Fermi-LAT (Figure 5). We convert the time-averaged Fermi-LAT -ray count rates listed in Table 1 to -ray fluxes assuming a single power-law spectrum and photon indices also listed in Table 1. The fluxes are then converted to luminosites over the energy range 100 MeV–300 GeV, assuming the distances in Table 2. The resulting -ray luminosities span a few to a few erg s-1. The X-ray luminosities are as estimated for Figure 4 (§4.1). V392 Per, V549 Vel, V407 Lup, and V959 Mon are not plotted in Figure 5, as there were no X-ray observations during their -ray emitting periods. The -ray luminosities are factors at least to times more luminous than the X-ray upper limits, with most of the novae clustered around . The ratios show a remarkable correlation, but no strong conclusions should be made as the plot is comparing a single data point in the X-rays per each nova to an averaged -ray luminosity over the detection period. The Swift upper limit depth is heavily dependent on exposure time and the background count rate.
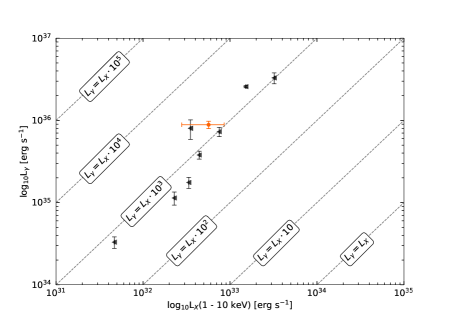
Motivated by Swift non-detections, researchers have begun searching for even harder X-rays during the -ray bright phase using the NuSTAR satellite (Harrison et al., 2013), with instruments on board sensitive to photons with energies up to 79 keV. While softer X-rays are absorbed, harder X-rays 10 keV are expected to escape the dense ejecta, even in the early days of the eruption, due to the decreasing bound-free cross-section at high photon energies (Metzger et al., 2015). Harder X-rays have now been detected with NuSTAR from three classical novae concurrently with -rays, namely V5855 Sgr, V906 Car, and YZ Ret (YZ Ret is not included in our sample as it erupted in 2020; Nelson et al. 2019; Sokolovsky et al. 2020a, b). Spectral analysis of these NuSTAR data show low-luminosity hard X-ray emission ( erg s-1) originating from hot plasma ( keV) and absorbed by large column densities (N(H) cm-2).
Even with these NuSTAR detections corrected for internal absorption, the ratio is still . The high observed with both Swift and NuSTAR is surprising because only a fraction of the shock’s power should be going into producing -rays given the predicted efficiency for particle acceleration (Metzger et al., 2015). Meanwhile, the high post-shock densities imply that the shocks should be radiative, and so the majority of the shock luminosity should be promptly transferred to radiative luminosity, which is naively expected to emerge in the X-ray band (Metzger et al., 2015; Li et al., 2017b; Aydi et al., 2020b). Nelson et al. (2019) and Sokolovsky et al. (2020a) propose several scenarios that could yield a much higher -ray luminosity compared to X-rays, including separate shocks producing the X-rays and -rays, suppression of the X-rays by corrugated shock fronts (Steinberg & Metzger, 2018), remarkably efficient particle acceleration, or that modeling the shocks as radiative is an improper assumption.
Of the 12 classical novae investigated here, 10 eventually show 1–10 keV hard X-ray emission detectable by Swift-XRT. This late emergence of the hard X-ray emission can be partially explained by a drop in the density of the ejecta as they expand—leading to a decrease in the absorbing column ahead of the shocks. But the faint NuSTAR detections imply that it is not only large absorbing columns that are leading to Swift non-detections; the X-ray luminosity is also intrinsically low.
4.3 The exception: novae with giant companions are detected in X-rays concurrent with -rays
Although evolved giant companions are relatively rare in nova-hosting binaries, the first-ever nova detected by Fermi-LAT, V407 Cyg, was accompanied by a Mira giant donor (Abdo et al., 2010). Previous to the nova eruption in 2010, V407 Cyg was well known as a D-type symbiotic star (e.g., Munari et al., 1990; Kolotilov et al., 1998, 2003). The giant donor’s wind was dense, with a mass-loss rate of M⊙ yr-1, resulting in a rich circumbinary medium (Chomiuk et al., 2012).
During its 2010 nova eruption (discovered on 2010 March 10), V407 Cyg displayed faint but detectable X-rays in the first Swift-XRT observations of the nova eruption (four days after nova discovery; Figure A.13, Shore et al. 2011; Nelson et al. 2012a). Over the next 20 days following the nova discovery, the X-ray flux rapidly brightened by a factor of 10. During this same time period, V407 Cyg was detected as a GeV -ray source by Fermi-LAT (Abdo et al., 2010). V407 Cyg is the only nova in our sample with concurrent Swift-XRT and Fermi-LAT detections.
Both the X-rays and the -rays in V407 Cyg are attributed to the interaction of the nova ejecta with the circumbinary medium (Orlando & Drake, 2012; Martin & Dubus, 2013). The X-ray flux rises in the first three weeks because the absorbing column might have dropped, while the X-ray emission measure grows. The absorbing column, even at early times, is never much higher than cm-2 (Nelson et al., 2012a). This can be contrasted with the absorbing columns of cm-2 for the internal shocks observed in classical novae with dwarf companions (e.g., Nelson et al. 2019; Sokolovsky et al. 2020a). Therefore, V407 Cyg hints that X-rays can be detected concurrently with -rays if the nova drives external shocks (i.e., interaction with pre-existing circumbinary material), as opposed to more deeply-absorbed shocks internal to the nova ejecta.
This hypothesis is supported by two additional novae with giant companions that were marginally detected by Fermi-LAT between 2010 and 2018: V745 Sco and V1535 Sco (Franckowiak et al., 2018). Hints of -ray emission from V745 Sco were obtained at 2–3 significance in the first two days of its 2014 nova eruption (Cheung et al., 2014). Bright hard X-ray emission was also observed during this time, with cm-2 (Delgado & Hernanz 2019; again, substantially lower than the absorbing columns observed for shocks in classical novae). Similarly, V1535 Sco was marginally detected in -rays during the first seven days of its 2015 eruption (Franckowiak et al., 2018), and hard X-rays were concurrently detected by Swift-XRT (on day 4; Linford et al. 2017). Although these -ray detections are marginal, they support a scenario where nova shocks with external circumbinary material (as occur in binaries with giant companions) are characterized by lower density, less embedded environments, in comparison with shocks that occur internal to nova ejecta in binaries with dwarf companions.
It is worth noting that the high observed in V407 Cyg (see Figure 5) could not be explained by high absorption or X-ray suppression in this case, given the less embedded environments of the shocks. However, a detailed analysis of the shocks in novae with evolved secondaries is outside the scope of this paper and will be the topic of future projects.
4.4 Why are some -ray detected novae never detected in X-rays?
Out of the 13 novae in our sample, only two were never detected as X-ray sources with Swift, namely V1324 Sco (Figure A.12; Finzell et al. 2018) and V5856 Sgr666After further analysis of the WT data of V5856 Sgr, there is a possible X-ray detection on day 149, but the online generator did not find any detection. This is mainly affected by the estimate of background contribution for faint objects observed in WT mode. (Figure A.5; Li et al. 2017b). V5856 Sgr had only two Swift observations (15 and 149 days after discovery) which makes it difficult to draw conclusions about this nova as its X-ray emission could have been missed (as we might have missed the X-ray emission from e.g., V357 Mus if observations of it had been similarly sparse). However, V1324 Sco was followed with Swift between days 30 and 500 after eruption and was still never detected.
There are a few reasons that might explain why V1324 Sco was not detected: lack of correlation between -ray luminosity and X-ray luminosity, distance, and/or absorption. While V1324 Sco was not detected in X-rays, it is among the brightest novae detected in -rays. If X-ray luminosity does not scale with -ray luminosity, this could explain the difference between the two.
Distance, however, appears to be an important factor to the detection of X-rays. V1324 Sco is the farthest nova of our sample (6.5 kpc), and Figure 4 shows that this translates to less sensitive upper limits on the hard X-ray luminosity. We compared the flux of each nova’s first 1–10 keV detection to what it would be at V1324 Sco’s distance (also correcting for the additional interstellar absorption). This analysis revealed that five novae would have been non-detections at the distance and of V1324 Sco: V906 Car, V357 Mus, V5856 Sgr, V5855 Sgr, and V5668 Sgr. We therefore conclude that distance is probably the reason why V1324 Sco was not detected by Swift-XRT.
4.5 What determines when the hard X-rays appear?
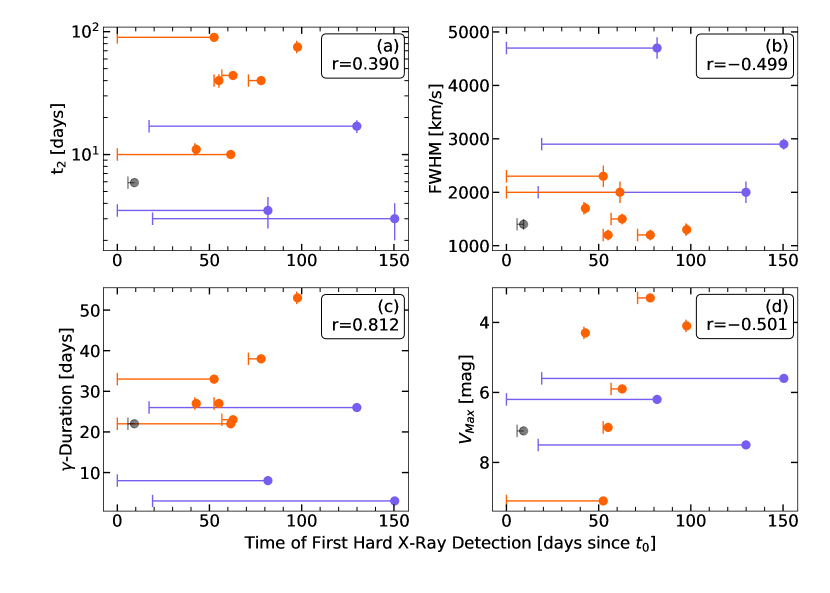
Part of the intention of this project was to study a sample of -ray detected novae in order to analyze possible trends in the data. In Figure 6, we plot the date of the first hard X-ray detection against other nova properties described in §2.2 and §2.3: , FWHM of Balmer emission lines (after optical peak), apparent magnitude at optical peak (), and the duration of the -ray detection to check for any correlations between these parameters. The Pearson correlation coefficient is shown in the top right corner of each panel.
Since the timing of Swift observations are different for each nova, it is challenging to draw conclusions about correlations between these parameters. For novae with extremely bright supersoft emission, it is possible that the harder shock component is contaminated by the supersoft component (see §4.1 for more discussion). The cadence of novae V407 Lup, V392 Per, and V5855 Sgr was interrupted by solar conjunction and observation schedules. In addition, V407 Lup and V5855 Sgr were first detected during a bright supersoft phase which caused large uncertainties on the first hard X-ray start date for these novae as plotted in Figure 6. Because of these complications, we exclude these novae from the fitting done to derive the correlation coefficients.
Based on panel (a) in Figure 6, visual inspection indicates earlier hard X-ray emission for faster novae (characterized by smaller )—particularly for novae with extensive Swift follow-up (with short error bars in Figure 6). The Pearson coefficient factor of derived for novae with higher-quality data also implies that there may be a weak correlation. Interestingly, we find a weak anti-correlation between the time of first hard X-ray detection and FWHM ( shown in panel (b). A nova characterized by a faster optical light curve (short ) should typically have higher ejecta expansion velocities (large FWHM; Shafter et al. 2011). In this case, the ejecta are expected to expand, drop in density, and become optically thin to the X-ray emitting shocked regions more rapidly than slower novae. There are hints that we may be observing these trends in Figure 6, but a larger sample of novae will need to be observed in the future in order to confirm these hints.
In panel (c), a Pearson correlation coefficient of 0.81 implies a likely correlation between the duration of the -ray detection and the first hard X-ray detection. To first order, this is expected given that none of the novae in our sample recorded Swift X-ray detections concurrent with the -ray emission and were only detected after this period ended. But this correlation may hold important clues as to the drivers of shocks in novae, as the only other quantity that has been observed to potentially correlate with -ray duration is -ray fluence (Cheung et al., 2016b; Franckowiak et al., 2018).
Panel (d) shows some indication of a correlation between the peak brightness of the nova and the time of first hard X-ray detection (note that an anti-correlation here is a correlation with brightness, due to the “flipped” magnitude scale). However, again this correlation is weak and requires a larger sample or higher cadence data to test.
In summary, although there are intriguing hints at correlations, it is challenging to draw conclusions from the current sample—the number of novae detected in -rays with dedicated multi-wavelength follow up is still small. Additional novae with high-cadence Swift-XRT and optical follow-up added to the current sample will allow us to draw better conclusions in the future.
5 Summary and conclusions
We have investigated the hard (1–10 keV) X-ray emission of 13 -ray emitting novae using Swift-XRT. Novae have long been observed to emit X-rays from hot ( 1–10 keV) optically-thin plasma, presumably from shocked gas (O’Brien et al., 1994; Mukai et al., 2008). The Swift-XRT light curves show evidence of hard X-ray emission from shocks in at least 7 out of the 13 novae studied, typically peaking several months after the start of eruption with luminosities erg s-1.
However, of the 9 novae with Swift-XRT observations during the -ray detection phase (typically a few weeks around optical maximum), eight yielded X-ray non-detections during these early times. The only nova showing X-ray emission concurrently with a Fermi -ray detection is V407 Cyg, which has a giant secondary. We suggest that the non-detection of early X-ray emission from the other eight novae (all with dwarf companions) is due to a combination of large column densities ahead of the shocks absorbing the X-rays, and X-ray suppression by corrugated shock fronts (e.g., Metzger et al., 2015; Steinberg & Metzger, 2018). The early X-ray detection of V407 Cyg (and possibly other novae with evolved companions) confirms that the shocks in symbiotic systems are external (between the nova ejecta and circumbinary material), rather than internal to the nova ejecta as claimed for novae with dwarf companions.
As more -ray emitting novae are discovered and followed up at other wavelengths, we will be able to better constrain the physical parameters of the shocks and further investigate the conditions of their surrounding media.
Acknowledgments
We are grateful to Tommy Nelson and Brian Metzger for conversations that inspired this work. ACG, EA, LC, KVS, and JS are grateful for the support of NASA Fermi grant 80NSSC18K1746, NuSTAR grant 80NSSC19K0522, NSF award AST-1751874, and a Cottrell Scholarship of the Research Corporation. KLP acknowledges funding from the UK Space Agency. KLL is supported by the Ministry of Science and Technology of the Republic of China (Taiwan) through grants 108-2112-M-007-025-MY3 and 109-2636-M-006-017, and he is a Yushan (Young) Scholar of the Ministry of Education of the Republic of China (Taiwan).
This work made use of data supplied by the UK Swift Science Data Centre at the University of Leicester. We acknowledge with thanks the variable star observations from the AAVSO International Database contributed by observers worldwide and used in this research. We also acknowledge with thanks the Astronomical Ring for Access to Spectroscopy ARAS observers for their optical spectroscopic observations
References
- Abdo et al. (2010) Abdo, A. A., Ackermann, M., Ajello, M., et al. 2010, Science, 329, 817
- Ackermann et al. (2014) Ackermann, M., Ajello, M., Albert, A., et al. 2014, Science, 345, 554
- Anupama (2013) Anupama, G. C. 2013, in IAU Symposium, Vol. 281, Binary Paths to Type Ia Supernovae Explosions, ed. R. Di Stefano, M. Orio, & M. Moe, 154–161
- Aydi et al. (2018a) Aydi, E., Buckley, D. A. H., Mohamed, S., & Whitelock, P. A. 2018a, The Astronomer’s Telegram, 11221
- Aydi et al. (2020a) Aydi, E., Sokolovsky, K., Chomiuk, L., Steinberg, E., & Li, K.-L. 2020a, Nature Astronomy, submitted
- Aydi et al. (2018b) Aydi, E., Orio, M., Beardmore, A. P., et al. 2018b, MNRAS, 480, 572
- Aydi et al. (2020b) Aydi, E., Sokolovsky, K. V., Chomiuk, L., et al. 2020b, Nature Astronomy, 4, 776
- Bahramian et al. (2015) Bahramian, A., Heinke, C. O., Degenaar, N., et al. 2015, MNRAS, 452, 3475
- Banerjee et al. (2015) Banerjee, D. P. K., Ashok, N. M., & Srivastava, M. 2015, The Astronomer’s Telegram, 7748
- Bode & Evans (2008) Bode, M. F., & Evans, A. 2008, Classical Novae, Vol. 43
- Bode et al. (2006) Bode, M. F., O’Brien, T. J., Osborne, J. P., et al. 2006, ApJ, 652, 629
- Burrows et al. (2005) Burrows, D. N., Hill, J. E., Nousek, J. A., et al. 2005, Space Sci. Rev., 120, 165
- Chen et al. (2019) Chen, B.-Q., Huang, Y., Yuan, H.-B., et al. 2019, MNRAS, 483, 4277
- Chen et al. (2016) Chen, P., Dong, S., Bose, S., et al. 2016, The Astronomer’s Telegram, 9550, 1
- Cheung et al. (2014) Cheung, C. C., Jean, P., & Shore, S. N. 2014, The Astronomer’s Telegram, 5879, 1
- Cheung et al. (2016a) Cheung, C. C., Jean, P., Shore, S. N., & Fermi Large Area Telescope Collaboration. 2016a, The Astronomer’s Telegram, 9594
- Cheung et al. (2016b) Cheung, C. C., Jean, P., Shore, S. N., et al. 2016b, ApJ, 826, 142
- Chochol et al. (2020) Chochol, D., Shugarov, S., Hambálek, Ľ., et al. 2020, arXiv e-prints, arXiv:2007.13337
- Chomiuk et al. (2012) Chomiuk, L., Krauss, M. I., Rupen, M. P., et al. 2012, ApJ, 761, 173
- Chomiuk et al. (2014) Chomiuk, L., Linford, J. D., Yang, J., et al. 2014, Nature, 514, 339
- Delgado & Hernanz (2019) Delgado, L., & Hernanz, M. 2019, MNRAS, 490, 3691
- Evans et al. (2007) Evans, P. A., Beardmore, A. P., Page, K. L., et al. 2007, A&A, 469, 379
- Evans et al. (2009) —. 2009, MNRAS, 397, 1177
- Finzell et al. (2015) Finzell, T., Chomiuk, L., Munari, U., & Walter, F. M. 2015, ApJ, 809, 160
- Finzell et al. (2018) Finzell, T., Chomiuk, L., Metzger, B. D., et al. 2018, ApJ, 852, 108
- Franckowiak et al. (2018) Franckowiak, A., Jean, P., Wood, M., Cheung, C. C., & Buson, S. 2018, A&A, 609, A120
- Friedman et al. (2011) Friedman, S. D., York, D. G., McCall, B. J., et al. 2011, ApJ, 727, 33
- Gallagher & Code (1974) Gallagher, J. S., I., & Code, A. D. 1974, ApJ, 189, 303
- Gallagher & Starrfield (1978) Gallagher, J. S., & Starrfield, S. 1978, ARA&A, 16, 171
- Gehrels et al. (2004) Gehrels, N., Chincarini, G., Giommi, P., et al. 2004, ApJ, 611, 1005
- Gehrz et al. (2018) Gehrz, R. D., Evans, A., Woodward, C. E., et al. 2018, ApJ, 858, 78
- Harrison et al. (2013) Harrison, F. A., Craig, W. W., Christensen, F. E., et al. 2013, ApJ, 770, 103
- Hernanz & Sala (2002) Hernanz, M., & Sala, G. 2002, Science, 298, 393
- Kafka (2020) Kafka, S. 2020, Observations from the AAVSO International Database, https://www.aavso.org
- Kaufman et al. (2018) Kaufman, R., Guido, E., Noschese, A., et al. 2018, Central Bureau Electronic Telegrams, 4473, 1
- Kolotilov et al. (1998) Kolotilov, E. A., Munari, U., Popova, A. A., et al. 1998, Astronomy Letters, 24, 451
- Kolotilov et al. (2003) Kolotilov, E. A., Shenavrin, V. I., Shugarov, S. Y., & Yudin, B. F. 2003, Astronomy Reports, 47, 777
- Krautter (2008) Krautter, J. 2008, in Classical Novae, ed. M. F. Bode & A. Evans, 232–251
- Li et al. (2017a) Li, K.-L., Chomiuk, L., & Strader, J. 2017a, The Astronomer’s Telegram, 10977
- Li et al. (2018a) —. 2018a, The Astronomer’s Telegram, 11590
- Li et al. (2020) Li, K.-L., Hambsch, F.-J., Munari, U., et al. 2020, arXiv e-prints, arXiv:2010.10753
- Li et al. (2018b) Li, K.-L., Mukai, K., Nelson, T., & Chomiuk, L. 2018b, The Astronomer’s Telegram, 11201
- Li et al. (2017b) Li, K.-L., Metzger, B. D., Chomiuk, L., et al. 2017b, Nature Astronomy, 1, 697
- Linford et al. (2015) Linford, J. D., Ribeiro, V. A. R. M., Chomiuk, L., et al. 2015, ApJ, 805, 136
- Linford et al. (2017) Linford, J. D., Chomiuk, L., Nelson, T., et al. 2017, ApJ, 842, 73
- Luckas (2016) Luckas, P. 2016, The Astronomer’s Telegram, 9658, 1
- Luckas (2017) —. 2017, The Astronomer’s Telegram, 10795
- Martin & Dubus (2013) Martin, P., & Dubus, G. 2013, A&A, 551, A37
- Mason et al. (2018) Mason, E., Shore, S. N., De Gennaro Aquino, I., et al. 2018, ApJ, 853, 27
- Metzger et al. (2016) Metzger, B. D., Caprioli, D., Vurm, I., et al. 2016, MNRAS, 457, 1786
- Metzger et al. (2015) Metzger, B. D., Finzell, T., Vurm, I., et al. 2015, MNRAS, 450, 2739
- Metzger et al. (2014) Metzger, B. D., Hascoët, R., Vurm, I., et al. 2014, MNRAS, 442, 713
- Mukai & Ishida (2001) Mukai, K., & Ishida, M. 2001, ApJ, 551, 1024
- Mukai et al. (2008) Mukai, K., Orio, M., & Della Valle, M. 2008, ApJ, 677, 1248
- Munari (2013) Munari, U. 2013, The Astronomer’s Telegram, 4709
- Munari et al. (2017) Munari, U., Hambsch, F.-J., & Frigo, A. 2017, MNRAS, 469, 4341
- Munari et al. (1990) Munari, U., Margoni, R., & Stagni, R. 1990, MNRAS, 242, 653
- Munari et al. (2020) Munari, U., Moretti, S., & Maitan, A. 2020, A&A, 639, L10
- Munari & Ochner (2018) Munari, U., & Ochner, P. 2018, The Astronomer’s Telegram, 11926
- Munari et al. (2011) Munari, U., Joshi, V. H., Ashok, N. M., et al. 2011, MNRAS, 410, L52
- Nelson et al. (2012a) Nelson, T., Donato, D., Mukai, K., Sokoloski, J., & Chomiuk, L. 2012a, ApJ, 748, 43
- Nelson et al. (2012b) —. 2012b, ApJ, 748, 43
- Nelson et al. (2019) Nelson, T., Mukai, K., Li, K.-L., et al. 2019, ApJ, 872, 86
- Ness et al. (2007) Ness, J.-U., Schwarz, G. J., Retter, A., et al. 2007, ApJ, 663, 505
- O’Brien et al. (1994) O’Brien, T. J., Lloyd, H. M., & Bode, M. F. 1994, MNRAS, 271, 155
- Orio et al. (2001) Orio, M., Covington, J., & Ögelman, H. 2001, A&A, 373, 542
- Orlando & Drake (2012) Orlando, S., & Drake, J. J. 2012, MNRAS, 419, 2329
- Osborne (2015) Osborne, J. P. 2015, Journal of High Energy Astrophysics, 7, 117
- Osborne et al. (2011) Osborne, J. P., Page, K. L., Beardmore, A. P., et al. 2011, ApJ, 727, 124
- Page et al. (2019) Page, K. L., Beardmore, A. P., & Osborne, J. P. 2019, arXiv e-prints, arXiv:1908.02004
- Page & Osborne (2014) Page, K. L., & Osborne, J. P. 2014, in Astronomical Society of the Pacific Conference Series, Vol. 490, Stellar Novae: Past and Future Decades, ed. P. A. Woudt & V. A. R. M. Ribeiro, 345
- Page et al. (2015) Page, K. L., Osborne, J. P., Kuin, N. P. M., et al. 2015, MNRAS, 454, 3108
- Page et al. (2020) Page, K. L., Kuin, N. P. M., Beardmore, A. P., et al. 2020, arXiv e-prints, arXiv:2010.01001
- Patterson (1994) Patterson, J. 1994, PASP, 106, 209
- Payne-Gaposchkin (1957) Payne-Gaposchkin, C. H. P. 1957, The galactic novae., ed. I. P. . Amsterdam, North-Holland Pub. Co.; New York
- Pretorius & Mukai (2014) Pretorius, M. L., & Mukai, K. 2014, MNRAS, 442, 2580
- Prieto (2016) Prieto, J. L. 2016, The Astronomer’s Telegram, 9564, 1
- Schaefer (2018) Schaefer, B. E. 2018, MNRAS, 481, 3033
- Schwarz et al. (2011) Schwarz, G. J., Ness, J.-U., Osborne, J. P., et al. 2011, ApJS, 197, 31
- Shafter et al. (2011) Shafter, A. W., Darnley, M. J., Hornoch, K., et al. 2011, ApJ, 734, 12
- Shappee et al. (2014) Shappee, B. J., Prieto, J. L., Grupe, D., et al. 2014, ApJ, 788, 48
- Shore et al. (2011) Shore, S. N., Augusteijn, T., Ederoclite, A., & Uthas, H. 2011, A&A, 533, L8
- Shore et al. (2016) Shore, S. N., Mason, E., Schwarz, G. J., et al. 2016, A&A, 590, A123
- Shugarov et al. (2014) Shugarov, S., Pavlenko, E., Chochol, D., et al. 2014, in Astronomical Society of the Pacific Conference Series, Vol. 490, Stellar Novae: Past and Future Decades, ed. P. A. Woudt & V. A. R. M. Ribeiro, 217–220
- Sokoloski et al. (2006) Sokoloski, J. L., Luna, G. J. M., Mukai, K., & Kenyon, S. J. 2006, Nature, 442, 276
- Sokolovsky et al. (2020a) Sokolovsky, K. V., Mukai, K., Chomiuk, L., et al. 2020a, MNRAS, 497, 2569
- Sokolovsky et al. (2020b) Sokolovsky, K. V., Aydi, E., Chomiuk, L., et al. 2020b, The Astronomer’s Telegram, 13900, 1
- Stanek et al. (2016) Stanek, K. Z., Kochanek, C. S., Brown, J. S., et al. 2016, The Astronomer’s Telegram, 9538
- Stanek et al. (2017) Stanek, K. Z., Kochanek, C. S., Shields, J. V., et al. 2017, The Astronomer’s Telegram, 10772
- Stanek et al. (2018) Stanek, K. Z., Holoien, T. W.-S., Kochanek, C. S., et al. 2018, The Astronomer’s Telegram, 11454
- Steinberg & Metzger (2018) Steinberg, E., & Metzger, B. D. 2018, MNRAS, 479, 687
- Teyssier (2019) Teyssier, F. 2019, Contributions of the Astronomical Observatory Skalnate Pleso, 49, 217
- The Fermi-LAT collaboration (2019) The Fermi-LAT collaboration. 2019, arXiv e-prints, arXiv:1902.10045
- Waagen (2013) Waagen, E. O. 2013, AAVSO Alert Notice, 489
- Waagen et al. (2013) Waagen, E. O., Pearce, A., Otero, S., et al. 2013, Central Bureau Electronic Telegrams, 3732, 3
- Wagner et al. (2012) Wagner, R. M., Dong, S., Bensby, T., et al. 2012, The Astronomer’s Telegram, 4157, 1
- Walter (2018) Walter, F. M. 2018, The Astronomer’s Telegram, 11298
- Walter et al. (2012) Walter, F. M., Battisti, A., Towers, S. E., Bond, H. E., & Stringfellow, G. S. 2012, PASP, 124, 1057
- Warner (1995) Warner, B. 1995, Cambridge Astrophysics Series, 28
- Williams (1992) Williams, R. E. 1992, AJ, 104, 725
- Wolf et al. (2013) Wolf, W. M., Bildsten, L., Brooks, J., & Paxton, B. 2013, ApJ, 777, 136
- Yaron et al. (2005) Yaron, O., Prialnik, D., Shara, M. M., & Kovetz, A. 2005, ApJ, 623, 398
Appendix A Swift X-ray Light Curves
In this Appendix, we present the XRT X-ray (0.3–10 keV) light curves for all the novae in our sample. We also plot the soft (0.3–1.0 keV) and hard (1.0–10 keV) light curves.