X-ray spectra in magnetic van der Waals materials , , and : a first-principles study
Abstract
Using density functional theory (DFT) methods, we have calculated X-ray absorption spectroscopy (XAS) and X-ray circular dichroism (XMCD) spectra in bulk and thin films of , , and . DFT+ methods are employed for better handling of correlation effects of 3 electrons of transition metals. We discuss relations between the density of states, radial matrix elements, and the corresponding spectra. By comparing the calculated spectra with previously measured spectra, we discuss the reliability of DFT+ methods to describe the electronic structures of these materials and determine the corresponding optimal and parameters.
I Introduction
Graphene is an attractive material because of its novel electronic structure and its potential for practical applications [1, 2, 3, 4]. However, the lack of intrinsic magnetism is a limitation for some device applications. Nevertheless, considerable effort has been expended to induce and control magnetism in graphene [5, 6] and separately to discover new two-dimensional (2D) materials that have intrinsic magnetism. Recent unprecedented experimental realization of magnetic 2D van der Waals (vdW) materials [7, 8] has created great excitement and determination to explore magnetism in these new 2D materials.
Among the magnetic 2D vdW (m2DvdW) materials, , and are the most intensively investigated ferromagnetic materials to understand fundamental physics such as the mechanism of magnetic ordering, the exchange interaction and the magnetocrystalline anisotropy as well as to improve desired properties by controlling external conditions such as electric and magnetic fields, strain, pressure, and doping [9, 10, 11, 12, 13, 14, 15, 16, 17]. Furthermore, since it is easy to separate vdW materials into thin layers and to over-lay different materials, the creation and exploration of composite thin layers has expanded the study of a wide variety of new interfaces and composite layered materials [18, 19, 20, 21, 22, 23, 24].
To investigate magnetic properties of heterostructures and alloys consisting of different magnetic atoms, it is beneficial to separate contributions from different atoms instead of averaging or summing them. X-ray Magnetic Circular Dichroism (XMCD) is useful for understanding the roles of individual magnetic atoms responsible for collective magnetic properties such as the magnetic ordering in interfaces of heterostructures. For instance, Liu et al. [25] performed XMCD measurements on a superlattice structure of and CrSb; and discovered that of can be significantly enhanced because of the interfacial ferromagnetic coupling. Also, Burn et al. [26] were able to characterize magnetic properties of the layers of Cr2Te3 thin films and Cr2Te3/Cr:Sb2Te3 (Cr doped Sb2Te3) heterostructures by XMCD measurements.
X-ray absorption spectroscopy (XAS) and XMCD have become essential tools for investigating magnetic properties of ferromagnetic alloys, surfaces and interfaces as well as magnetic bulk compounds because of the chemical and orbital selectivity of X-ray spectra [27, 28, 29, 30, 31]. These tools are able to resolve the total magnetic moment into the orbital and spin contributions by using sum rules. And they can assess magnetic information of each element within compounds and interfacial structures. Moreover, since these techniques involve electron transitions from well defined core states to (at times complex) conduction states, the spectra provide knowledge of the composition of the density of states (DOS) and the orbital character of the conduction bands.
Since the magnetic moment is a number that involves integration, it is not easy to pinpoint the origin or details of any differences of states by comparing their magnetic moments. On the other hand a comparison of DOSs can give information about the differences. In the experiment, optical spectra give energy-resolved information and can be compared with DOS(). In XAS/XMCD, since initial states are well defined atomic core states, which are not affected by surroundings, it is useful to obtain information of final conduction states. Comparison of theoretical spectra which are calculated with various methods and experimental XAS/XMCD spectra help to decide the more suitable theoretical method for further work. It is possible to associate key spectra structures with calculated DOS and obtain electronic structure information.
There are a number of reports for XMCD measurements for bulk m2DvdW materials such as [32, 33], [34, 35] and [36]. For , the XAS and XMCD spectra of Fe L3,2 edges have been measured [32, 33]. Zhu et al. [32] extracted the orbital moment of Fe atoms from the spectra and found good agreement with their calculations and Park et al. [33] showed that the ratio between orbital and spin moments of Fe atoms () in is much higher than in elemental Fe (0.04). Li et al.[37] measured the temperature-dependent XMCD spectra to study the magnetic ordering of and found a of , which agrees with the SQUID result.
For , Frisk et al. [34] measured the Cr L3,2 edge spectra and calculated the spectra using atomic multiplet theory [38]. Using XMCD spectra, Kim et al. [35] estimated in-plane and out-of-plane orbital moments () and concluded that the anisotropy of magnetic orbital moments in is negligible, unlike in . For , Waston et al. [36] performed XAS and XMCD measurements and atomic multiplet calculations for the Cr L3,2 edge spectra of . Along with angle-resolved photoemission spectroscopy (ARPES) measurements, they identified covalent bonding states and suggested these states as the primary driver of the ferromagnetic ordering of .
Most theoretical studies of the X-ray spectra in m2DvdW materials so far were based on atomic multiplet theory or cluster models [39], which employ adjustable parameters to describe the electronic structure and X-ray spectra. Though the reported theoretical spectra line shapes may show good agreement with experiments, it is hard to interpret the electronic structure in a comprehensive way because they rely on selected parameters. Atomic multiplet theory allows an easy incorporation of many-body effects but is not reliable for interpreting solid-state-like effects. Therefore, solid state first-principles calculations are useful for an integrated understanding of the system while the atomic and empirical approaches provide complementary information.
In this study, we calculate and discuss the electronic structure and X-ray spectra of , , and . We performed calculations not only with bulk structures but also with thin-film structures since most of reported X-ray spectra measurements [32, 34, 35] were done in total-electron-yield (TEY) mode which is surface sensitive and the probing depth of TEY is about 3-10 nm, depending on materials [39]. Since the c-lattice parameter is about or less than 2 nm , X-ray spectra in TEY mode may not yield bulk structure information for , and . Furthermore, the m2DvdW are attractive because of their thin-layer character. Therefore it is interesting to investigate the X-ray spectra of thin films (layers). We show that X-ray spectra are useful for determining the unoccupied DOS through comparison between the partial DOSs and spectral line shape. Electronic structures are described within density functional theory (DFT) and DFT+. By comparison between the theoretical and experimental spectra, we determine the optimal and values that are able to describe the electronic structures of these materials more satisfactorily within the DFT+ framework.
II Theory and computational details
II.1 X-ray magnetic circular dichroism.
Magneto-optical (MO) effects refer to various changes in the polarization state of light upon interaction with materials possessing a net magnetic moment, including rotation of the plane of linearly polarized light (Faraday, Kerr rotation), and the complementary differential absorption of left and right circularly polarized light (circular dichroism). In the near visible spectral range these effects result from excitation of electrons in the conduction band. Near x-ray absorption edges, or resonances, magneto-optical effects can be enhanced by transitions from well-defined atomic core levels to empty valence or conduction states.
Within the one-particle approximation, the absorption coefficient for incident x-ray polarization and photon energy can be determined as the probability of electronic transitions from initial core states with the total angular momentum to final unoccupied Bloch states
| (1) | |||||
where and are the wave function and the energy of a core state with the projection of the total angular momentum ; and are the wave function and the energy of a valence state in the -th band with the wave vector k; is the Fermi energy.
is the electron-photon interaction operator in the dipole approximation
| (2) |
where are the Dirac matrices and is the polarization unit vector of the photon vector potential, with , . Here, and denotes, respectively, left and right circular photon polarizations with respect to the magnetization direction in the solid. Then, x-ray magnetic circular and linear dichroism are given by and , respectively. More detailed expressions of the matrix elements in the electric dipole approximation in the frame of the fully relativistic Dirac LMTO method may be found in Ref. [40].
Concurrent with the development of x-ray magnetic circular dichroism experiments, some important magneto-optical sum rules have been derived [41, 42, 43, 44].
For the edges the sum rule can be written as [40]
| (3) |
where is the number of holes in the band , is the average of the magnetic quantum number of the orbital angular momentum. The integration is taken over the whole 2 absorption region. The sum rule can be written as
| (4) |
where is the component of the magnetic dipole operator which accounts for the asphericity of the spin moment. The integration () is taken only over the 2 (2) absorption region.
II.2 Computational details
The X-ray spectra [45] are calculated using the eigenvalues and wavefunctions of self-consistent electronic structures calculations, which are carried out within DFT or DFT+ using a full-potential linear augmented plane wave (FLAPW) method [46] as well as the fully relativistic linear muffin-tin orbital (RLMTO) method [47, 48]. This implementation of the LMTO method uses four-component basis functions constructed by solving the Dirac equation inside an atomic sphere [49]. The generalized gradient approximation (GGA) [50] was used for the correlation and exchange potentials. As for DFT+, we use both fully-localized-limit (FLL) [51, 52] and around-the-mean-field (AMF) [53] double-counting schemes with correlation parameters and applied on the cation- orbitals. We also used in this work the ”relativistic” generalization of the rotationally invariant version of the LSDA+ method (RG) [54] which takes into account SO coupling so that the occupation matrix of localized electrons becomes non-diagonal in spin indices.
In the x-ray absorption process an electron is promoted from a core level to an unoccupied state, leaving a core hole. As a result, the electronic structure at this state differs from that of the ground state. In order to reproduce the experimental spectrum the self-consistent calculations should be carried out including a core hole. In this study the core-hole effect was fully taken into account in the self-consistent iterations by removing an electron at the core orbital using the supercell approximation. The core state of the target atom in the ground state provides the initial state for the spectral calculation. The final states are the conduction band states obtained separately by the calculations in which one of the core electrons of the target atom is placed at the lowest conduction band. The interaction and the screening of the electron-hole pair are fully accounted for by the self-consistent iterations of the final state Kohn-Sham equations. This procedure simulates the experimental situation, in which the sample can easily supply an electron to screen a localized charge produced by the core hole. Such an approach considers the symmetry breaking of the system in a natural way, and self-consistently describes the charge redistribution induced by the core hole.
We employed the experimental lattice parameters [55, 56, 57] for calculations. We used hexagonal cells which have six formula units, with three layers instead of rhombohedral primitive cells for and . For the thin film calculations, we took one unit cell of hexagonal structures for , and an 112 supercell for and added a 25 a.u. vacuum region. In all of the bulk and film calculations, we did not perform any structural optimization calculations.
III Results & Discussion
III.1
III.1.1 Electronic structure
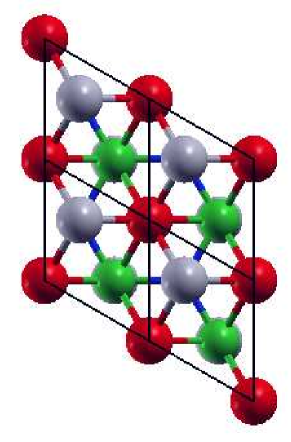
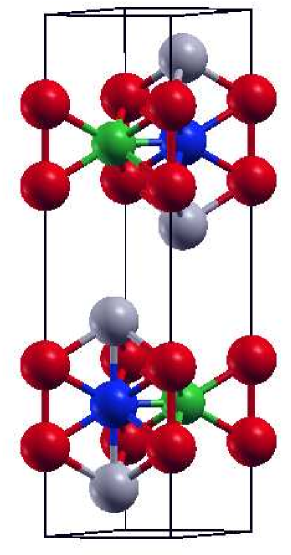
crystallizes in a hexagonal (, space group no. 194) structure [57, 59]. The primitive cell contains two formula units (f.u.). As shown in Fig. 1, Te atom occupies the () site and a Ge atom occupies the () site, while Fe atoms are divided into two sublattices, and , denoted as Fe1 and Fe2, respectively. Each sublattice forms a trigonal lattice in the basal plane. Fe2 and Ge atoms, together, form a Fe2-Ge honeycomb monolayer; sandwiched between two Te-capped Fe1 layers. The nearest neighbor of an Fe1 atom is an Fe1 atom along the direction and their distance is , and the distance between Fe2 and its nearest neighbor Ge is .
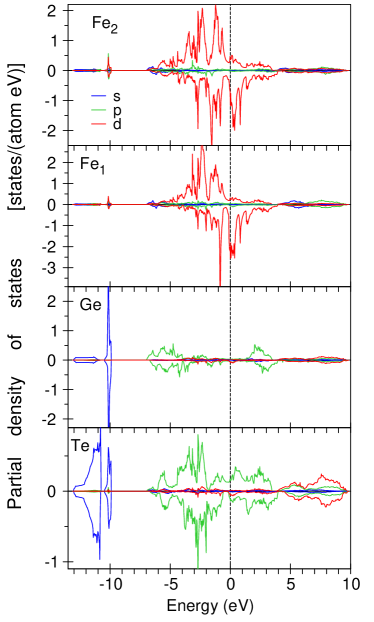
Figure 2 presents the partial density of states of in the GGA approximation. The contribution of the Te 5 states consists of two peaks that are located mostly between 13.1 and 10.8 eV below the Fermi level. The second double peak located between 10.5 and 9.7 eV originates from the hybridization with Ge 4 states. The Ge 4 bands are located mostly between 10.5 and 9.9 eV. The low intensity wide fine structure situated between 13.1 and 10.8 eV is due the hybridization with Te 5 states. The 5 states of Te are found to be in the 7 eV to 3.5 eV energy interval. The 4 states of Ge occupy the same energy interval, although, they have relatively small intensity in the vicinity of the Fermi level. The spin splittings of the Te and Ge states are quite small. The Te 5 states are situated from 3.9 eV to 9.8 eV above the Fermi level. Although the Fe1 and Fe2 3 states situated between 6.6 eV and 4 eV energy interval are very similar, they still have some differences. There is a strong spin-down peak at 0.9 eV at the Fe1 site, while the corresponding peak at the Fe2 site is much weaker. Besides, the Fe1 site possesses a quite intense spin-down peak in just above the Fermi level, while a similar peak is much smaller at the Fe2 site. Both the sites have quite large spin-down 3 density of states and small spin-up ones above the Fermi level.
| Bulk | Fe1 | Fe2 | |||||||
| Method | (Ry) | (Ry) | |||||||
| FLAPW | 2.36 | 0.07 | 1.55 | 0.03 | |||||
| RLMTO | 1.91 | 0.12 | 1.26 | 0.02 | |||||
| sum rules | 2.11 | 0.11 | 1.32 | 0.02 | |||||
| AMF | 0.1 | 2.32 | 0.13 | 1.59 | 0.05 | ||||
| 0.2 | 1.77 | 0.14 | 1.65 | 0.08 | |||||
| FLL | 0.1 | 2.62 | 0.08 | 1.81 | 0.07 | ||||
| 0.2 | 2.82 | 0.11 | 2.09 | 0.13 | |||||
| Exp111Total magnetic moment measured using neutron powder diffraction by May et al. [59]. | 2.18 | 1.54 | |||||||
| Film | |||||||||
| FLAPW | 2.35 | 0.07 | 1.55 | 0.03 | |||||
| FLL | 0.2 | 0.00 | 2.80 | 0.11 | 2.08 | 0.13 | |||
| 0.2 | 0.10 | 2.60 | 0.12 | 1.84 | 0.12 | ||||
| 0.2 | 0.15 | 2.48 | 0.17 | 1.71 | 0.12 | ||||
The on-site spin and orbital magnetic moments of both Fe sites in bulk and thin-film , calculated using various methods, are listed in Table 1 and compared with the on-site total magnetic moments from neutron powder diffraction. Fe1 has larger spin and orbital moments than Fe2 does, which is consistent with published experimental and theoretical results [59, 60]. Within the GGA approximation, the calculated ratio between Fe1 and Fe2 total magnetic moments is equal to 1.54, which is larger than the experimental value of 1.45 [59] by about 10%. GGA underestimates the orbital moment by , in comparison with the experimental value of = 0.10 obtained using the XMCD [32]. However, fully relativistic LMTO method produces an orbital magnetic moment in better agreement with the experiment (Table 1).
We also also present in the Table 1 the Fe spin and orbital magnetic moments obtained by the sum rules [Eqs. (3) and (II.1)] applyed to the theoretically calculated XAS and XMCD spectra in the GGA approximation in a frame of the RLMTO method. Although the XMCD sum rules are derived within an ionic model using a number of approximations and the application of the sum rules sometimes results in an error up to 50% [40], we found relatively good agreement between the theoretically calculated magnetic moments and those derived from the sum rules.
To investigate the correlation effects on magnetism, we perform GGA+ calculations and checked if the on-site Coulomb interaction term is able to improve agreement with experiments. The results depend on the double counting schemes used. Table 1 shows calculated magnetic moments with and using both the AMF and FLL schemes. The orbital moments () in both schemes are increased with increasing parameter, improving the agreement with the experiment. While, for the spin moments, the FLL scheme increases on both sites, deviating further from experiments, the AMF scheme decreases (increases) on Fe1 (Fe2) sites giving better agreement with the experiment. Thus, overall, a small parameter within the AMF scheme improves the agreement with the experiment.
We also investigate the dependence of Hunds’s parameter and the surface effects. The magnetic moments of the bulk and film are nearly identical, reflecting the van der Waals nature of the system. Table 1 also shows the dependence of the magnetic moments on the Hunds’s parameter in film . With increasing of values, spin moments are decreased at both iron sites while the orbital moment is increased only on the Fe1 site. Thus the spin fluctuation introduced by Hund’s improves the agreement with experiments. Our work suggests that using a single value for the parameter may not be sufficient for describing this system. An explicit treatment of electron correlations beyond DFT for these systems may be valuable [61, 62].
III.1.2 The XAS and XMCD spectra
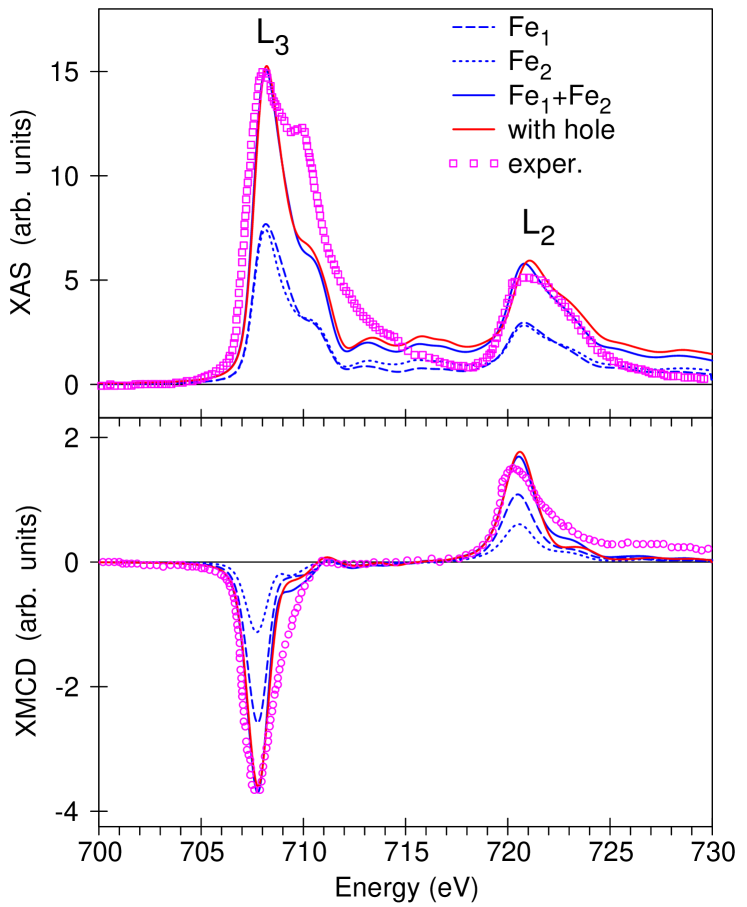
Figure 3 presents the calculated XAS as well as XMCD spectra of the compound at the Fe edges in the GGA approximation compared with the experimental data [32]. The XMCD spectra at the Fe edges are mostly determined by the strength of the spin-orbit (SO) coupling of the initial Fe 2 core states and spin-polarization of the final empty 3 states while the exchange splitting of the Fe 2 core states as well as the SO coupling of the 3 valence states are of minor importance for the XMCD at the Fe edges of . Because of the dipole selection rules, apart from the 4 states (which have a small contribution to the XAS due to relatively small 2 4 matrix elements) only 3 states occur as final states for XAS for unpolarized radiation, whereas for the XAS the 3 states also contribute. [40] Although the 2 3 radial matrix elements are only slightly smaller than for the 2 3 transitions the angular matrix elements strongly suppress the 2 3 contribution [40]. Therefore neglecting the energy dependence of the radial matrix elements, the and the spectrum can be viewed as a direct mapping of the DOS curve for 3 and 3 character, respectively.
The experimental Fe XAS has one prominent peak around 708 eV and a pronounced shoulder bump at around 710 eV shifted by about 2 eV with respect to the maximum to higher photon energy. This structure is less pronounced at the edge. This result can be ascribed to the lifetime broadening effect because the lifetime of the 2 core hole is shorter than the 2 core hole due to the Coster-Kronig decay. The GGA approximation reasonably well describes the shape of the XAS spectra at the Fe edges (the upper panel of Fig. 3), however it underestimates the high energy peak at around 710 eV. The calculated spectra have also smaller width compared to the experimental spectra.
The lower panel of the Fig. 3 shows XMCD spectra of the compound at the Fe edges in GGA approximation compared with the experimental data [32]. The Fe1 site shows stronger XMCD spectra than the Fe2 site due to larger orbital magnetic moment at the Fe1 site in comparison with the Fe2 one.
We found minor influence of the final-state interaction on the shape of the Fe XAS and XMCD spectra in the whole energy interval (red curves in Fig. 3).
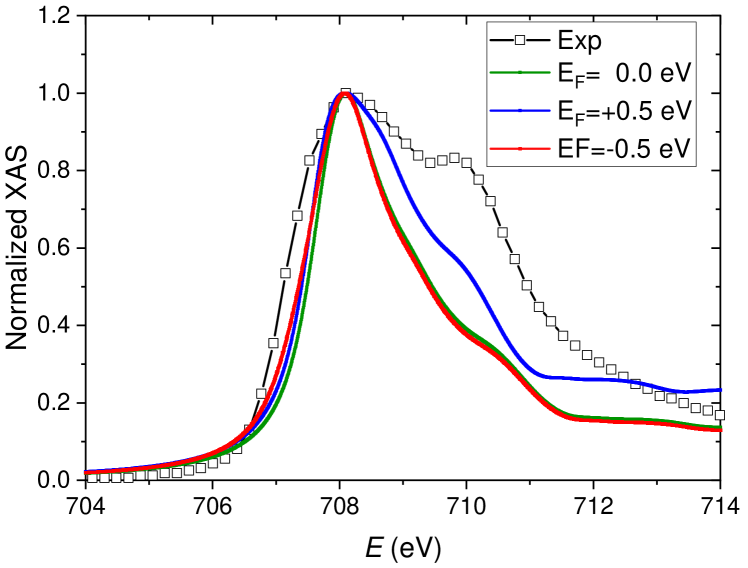
Zhu et al. [32] compared total DOSs calculated by DFT and DFT+DMFT. Their DFT result shows a broad peak right above EF and two sharp peaks at higher energies. However, in the DFT+DMFT calculation, the EF is located at the peak which is much narrower than the DFT peak near EF. It is possible that DFT overcounts down spin empty states just above EF so that it overemphasizes the first peak of XAS. To check this scenario, we calculated the spectra with shifted EF. Shifting EF can mimic the change in the number of electrons and mimic doping. It is interesting to find the change of relative intensity between the two peaks with EF changes. Figure 4 shows XAS with the GGA functional and with shifted EF from GGA results. As expected, shifting EF up reduces unoccupied states of down spin and the intensity of the first peak of the spectra. It results in the second peak becoming relatively stronger than for the GGA result.
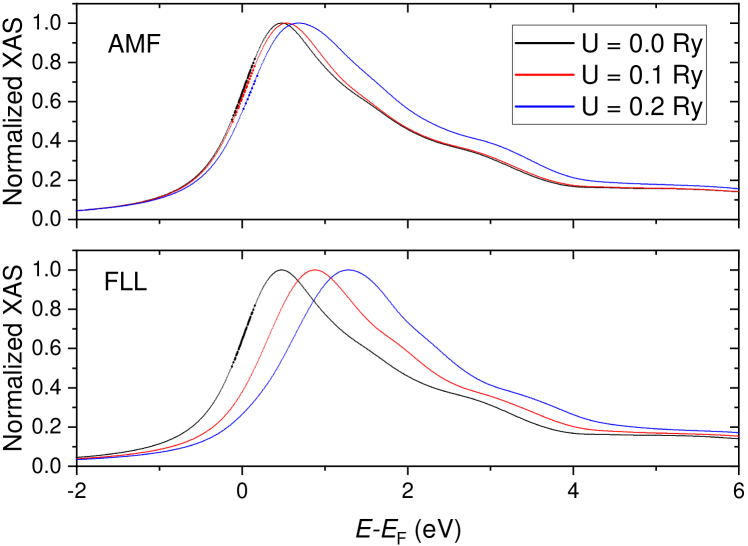
Since the XAS spectral line shape depends on details of DOS or band structure and an on-site Coulomb interaction changes electronic structure, it is interesting to find how the spectra change with different values. We calculated the spectra with the around mean field (AMF) and the fully localized limit (FLL) schemes of LDA+ to see how the spectra change with and values. For the AMF scheme, the higher value gives broader XAS spectra and a relatively higher second bump which is related to the lower spin moment. The intensity of XMCD spectra also depends on values that are attributed to moment change. The top panel of Fig. 5 shows results with the AMF scheme. As the figure shows, higher values give broader XAS spectra shape and a relatively higher second bump which is related to the lower spin moment (See Table 1). The bottom panel of Fig. 5 shows results of the FLL scheme with and but . For XAS spectra, instead of getting a broader line shape, the main peaks are moving toward higher energy. With increasing value, XAS is slightly shifted toward higher energy but XMCD becomes narrower (not shown). Although there are changes in detail of the spectra, overall spectral line shapes change little. The GGA+ method produces altered electronic structure compared to the GGA functional but the effects of on the XAS (XMCD) spectra line shape are not significant.
III.2
III.2.1 The electronic structure
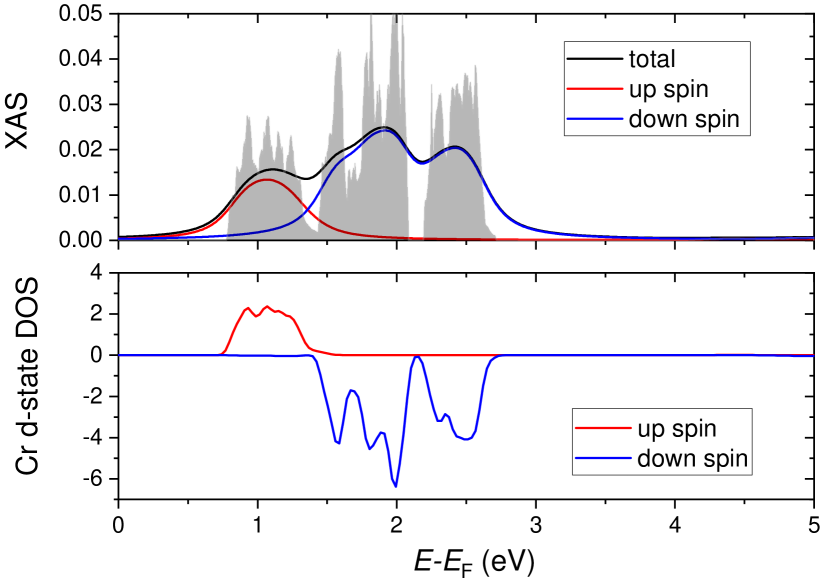
Figure 6 presents the partial density of states of in the GGA approximation. The 5 states of I are located in the 5.1 eV to 2.7 eV energy interval. It is interesting to note that the 5 partial DOS of I is extremely small and the number of the I 5 electrons is equal to 0.02 in instead of 2 in the free I atom. The Cr 3 spin up states are situated in the 5.1 eV and 1.5 eV energy interval. The empty Cr 3 spin-up DOS shows up as a single peak in the 0.7eV to 1.5 eV interval. The empty Cr 3 spin-down DOSs consist of two narrow intensive peaks in the 1.4 eV to 2.1 eV and 2.2 eV to 2.6 intervals, respectively.
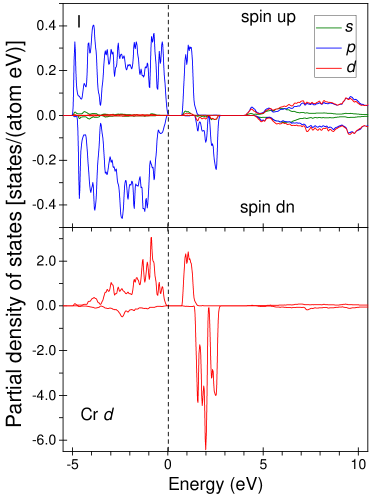
Table 2 and Table 3 show calculated Cr magnetic moments and band gaps of bulk with various and -parameters. While the AMF scheme gives lower spin moment with increasing parameters, the FLL scheme produces changes in the opposite direction. Gudelli et al. [63] performed GGA+ calculations for bulk, mono-,bi-, and tri-layer of and found the orbital moments are parallel to spin moments for the Cr atom. This agrees with the result that is presented here. However, the results that are estimated from XMCD spectra and atomic calculations [34, 35] are in the opposite direction compared to GGA and GGA+ results. The magnetic moment of Cr in a thin film is not so different from the bulk case (See Table.S1 in SI). It is because the Cr atom layers are shielded by I atom layers. If Cr atoms are located on the top surface, they may acquire a larger moment but because of Van der Waals bonding character - the inter-layer interaction is much weaker than the intra-layer interaction, it is not plausible to obtain structures where Cr atoms are on the top surface.
| Cr | gap | ||||||
|---|---|---|---|---|---|---|---|
| Method | Ry | eV | |||||
| FLAPW | 2.99 | 0.074 | 0.77 | ||||
| RLMTO | 3.23 | 0.118 | 0.42 | ||||
| sum rules | 2.74 | 0.108 | |||||
| AMF | 0.1 | 2.84 | 0.078 | 1.06 | |||
| 0.2 | 2.63 | 0.080 | 1.31 | ||||
| 0.4 | 2.12 | 0.074 | 0.72 | ||||
| FLL | 0.1 | 3.17 | 0.070 | 0.74 | |||
| 0.2 | 3.22 | 0.068 | 0.72 | ||||
| 0.4 | 3.42 | 0.062 | 0.65 | ||||
| Exp [35] | -0.059 | ||||||
| Cr | gap | ||||||
|---|---|---|---|---|---|---|---|
| (Ry) | Ry | eV | |||||
| 0.30 | 0.05 | 3.14 | 0.066 | 0.90 | |||
| 0.10 | 2.85 | 0.065 | 1.30 | ||||
| 0.20 | 2.15 | 0.055 | 0.68 | ||||
| 0.40 | 0.05 | 3.17 | 0.062 | 0.86 | |||
| 0.10 | 3.22 | 0.061 | 1.29 | ||||
| 0.20 | 3.42 | 0.062 | 0.60 | ||||
III.2.2 The XAS and XMCD spectra
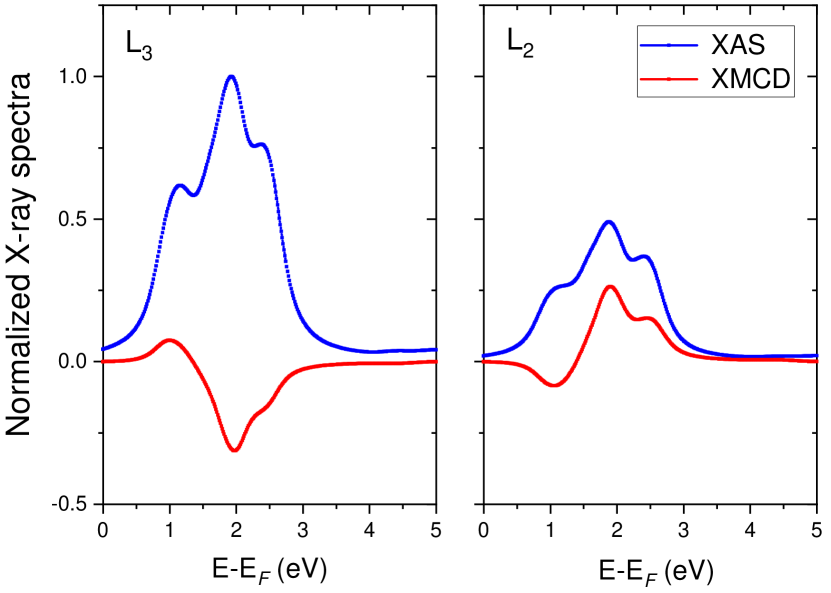
Figure 7 shows calculated XAS and XMCD spectra with GGA functionals. The left panel is L3-edge spectra and the right panel is L2-edge spectra. Both XASs show three structures a peak around 1 eV, a central peak around 1.9 eV and a shoulder bump around 2.4 eV. XMCD spectra also have three features - the first has a different sign compared to the other two peaks.
Frisk et al.’s [34] measured L3 edge XAS shows a strong peak around 576 eV photon energy and two bumps on both sides of the peak. However, their calculated spectra does not show the bump at higher energy but a smooth decreasing from the central peak. With these results, they suggested that the higher energy bump is attributed to partial oxidation. Kim et al.’s [35] results look similar to Frisk et al.’s except for the bump at higher energy. They observed a small bump and were able to reproduce it by their model calculation. It seems that the third peak is intrinsic and small, although it can be intensified by oxidation.
The top panel of Fig. 8 shows Cr L3-edge XAS which was calculated using radial matrix elements and DOS. It not only reproduces the three features of Fig. 7 well but also gives more information on the character of the peaks if it is combined with DOS (the bottom panel of Fig. 8). The spectra were decomposed into up spin (red) and down spin (blue) contributions. It shows the first peak is attributed to the up spin state and the other two peaks are from the down spin state. It also explains why the first peak of the XMCD spectra has the opposite sign of the other two peaks.
The main difference between the measured XAS and the calculated XAS with GGA is the spectral width. The calculated spectra has a much narrower spectral width than the experimental result. The spectral intensity of the calculated spectra is rapidly decreased after the third bump. It is because Cr 3d bandwidth is narrow and the top of the band is located about 2.5 eV from EF which corresponds to about 576.6 eV. The sign of the calculated XMCD peaks is also not consistent with the experiment. While the experimental result shows a negative sign for the first and second peaks and a positive sign for the third peak, the calculated spectra show a positive sign for the first peak and negative for the others.
The XMCD spectra depends on details of ml decomposed DOS. The GGA+ method is able to adjust relative positions of ml decomposed DOS by controlling values. Therefore it is possible to tune the calculated spectra by using different values. We have performed the GGA+ calculations to understand the effects of and values on X-ray spectra and to check if the GGA+ method is able to produce X-ray spectra that is consistent with the experimental results.
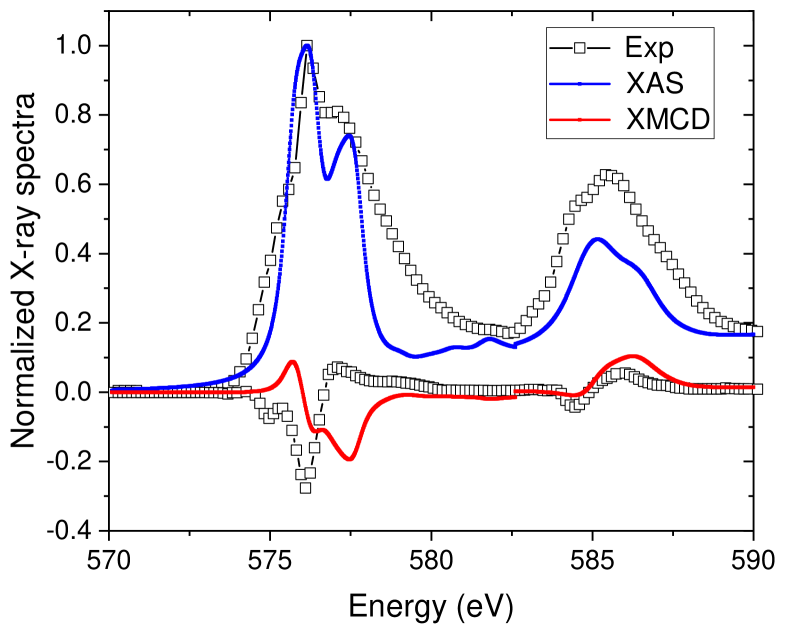
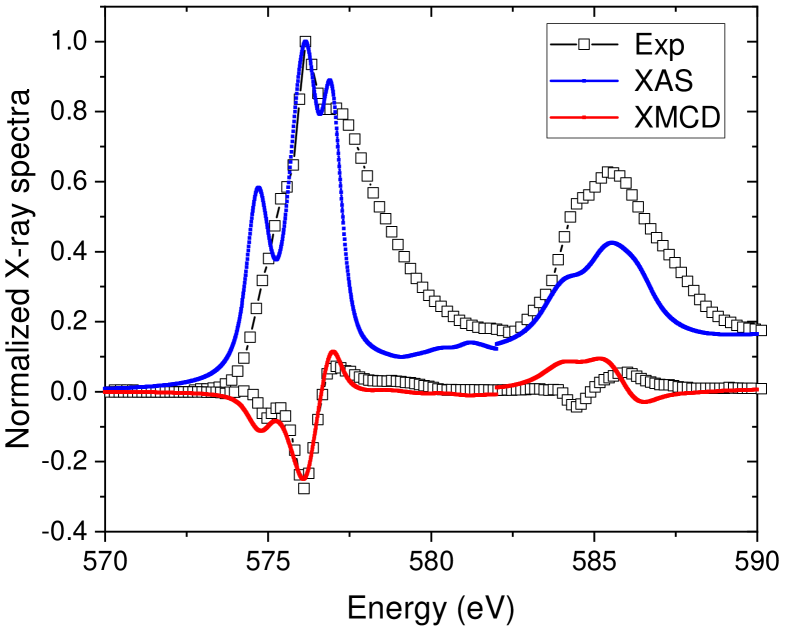
Figure 9 shows the result with (See Fig.S3 for a lower value result). For a comparison, it also includes experimental data that are obtained from Frisk et al. [34]. Since higher parameters promote 3 band splittings to be stronger and band widths to be wider, the calculated spectra have wider spectral widths. For the XAS spectra, the AMF scheme gives better agreement with experiment than the FLL scheme. The calculation with the AMF scheme gives good agreement with the experiment for the L3-edge but not for the L2-edge XMCD spectra. It is reversed from the calculation with the FLL scheme. The calculated XMCD spectra with the FLL scheme shows reasonable agreement for the L2-edge but not for the L3-edge.
The normalized X-ray spectra of the thin film is similar to the case of the bulk except for details of fine structure of L3 XAS spectra. See Fig.S4 in SI for the film X-ray spectra. The FLL scheme with and is able to reproduce most of the experimental features except for the higher energy peak (around 576.6 eV photon energy) of L3-edge XMCD spectra. While the AMF scheme with produces the L3-edge XMCD spectra which shows good agreement with the experimental result, it flips the sign of lower energy peak of the L2-edge XMCD spectra. For the L3 edge XMCD spectra, the lowest energy peak which has a positive sign is attributed to the up spin state and the other two peaks which have negative signs are attributed to the down spin state. The positive peak is located at the highest energy in the L3 edge XMCD spectra calculated by the AMF scheme.
Overall, the GGA+ method is able to improve theoretical spectra of the bulk but it requires a rather higher value. The results with show good agreement with the measured spectra but this is much higher than the values from published work. For instance, the employed values are 1.0 eV in Gudelli et al. [63], 2.0, 2.9 eV in Jang et al.’s [9], and 3.0 eV in Sivadas et al. [64].
III.3
III.3.1 The electronic structure
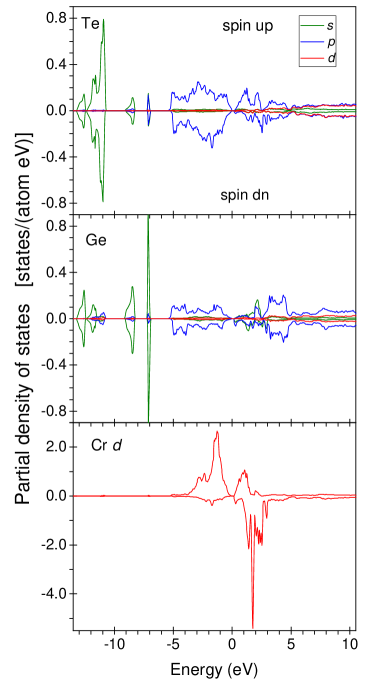
Figure 10 presents the partial density of states of in the GGA approximation. The Te 5 states consist of four peaks and they are located mostly between 12.2 and 10.7 eV below the Fermi level. The Ge 4 states are located mostly between 7.2 and 7 eV. Other peaks located at the lower energy originate from the hybridization with Te 5 states. The 5 states of Te and Ge are found to be at 5.5 eV to 5.0 eV energy interval in . The spin splitting of the Te and Ge states is quite small. The Cr 3 states are situated in the 5 eV to 3.2 eV energy interval. The empty Cr 3 spin-up DOSs present by relatively weak peak at 0 eV to 1.3 eV interval. The empty Cr 3 spin-down DOSs consist of three intensive peaks in the 0.5 eV to 3.2 eV interval.
Table 4 summarizes calculated spin, orbital magnetic moment and band-gap size. The trend of magnetic moment change with -parameter is similar to the trend in the case. While the spin moment is decreasing with increasing -parameter in the AMF scheme, it changes to opposite direction in the FLL scheme. The calculated orbital moments in the Table 4 are too small to assign physical meaning though the value is getting more negative with increasing value. The measured saturated magnetization is at [56] and the orbital moment is [35]. The calculated orbital moment with GGA+ is much smaller than this measured result.
| Cr | gap | ||||||
|---|---|---|---|---|---|---|---|
| Method | Ry | eV | |||||
| FLAPW | 3.06 | 0.004 | 0.18 | ||||
| RLMTO | 3.34 | 0.029 | 0.00 | ||||
| sum rules | 3.27 | 0.031 | |||||
| AMF | 0.10 | 2.91 | 0.003 | 0.15 | |||
| 0.20 | 2.65 | 0.002 | 0.08 | ||||
| 0.40 | 1.93 | -0.003 | 0.00 | ||||
| FLL | 0.10 | 3.21 | 0.001 | 0.14 | |||
| 0.20 | 3.36 | -0.001 | 0.08 | ||||
| 0.40 | 3.60 | -0.003 | 0.00 | ||||
| Exp [35] | -0.045 | ||||||
III.3.2 The XAS and XMCD spectra
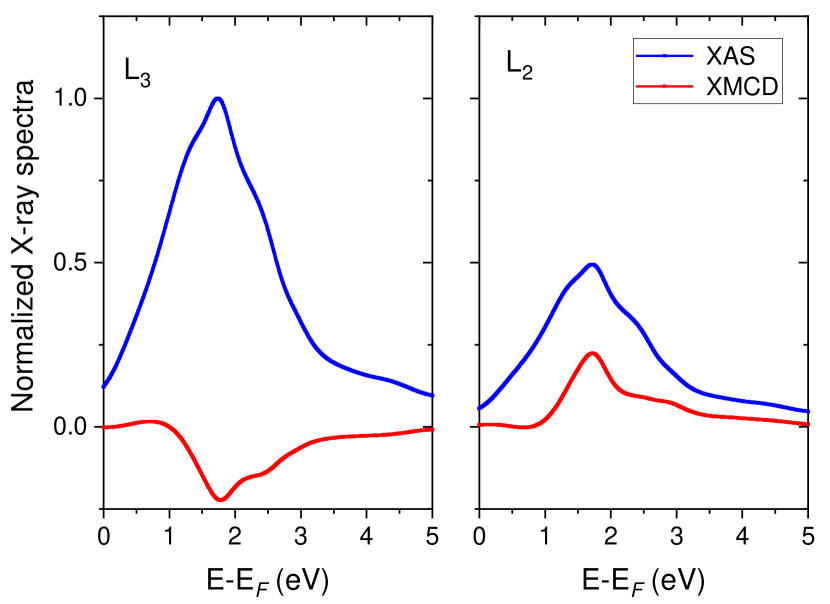
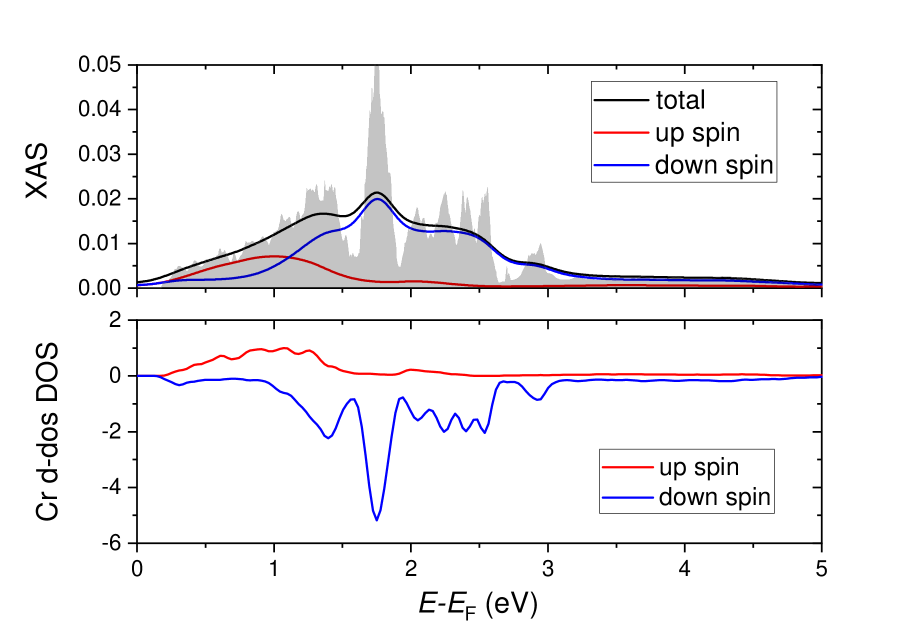
Figure 11 shows calculated XAS and XMCD spectra with GGA functionals. The left panel is Cr--edge spectra and the right panel is Cr L2-edge spectra. Both XASs show three features which are a strong central peak around 1.8 eV, and two shallow shoulders on both sides of the central peak around 1.2 eV and 2.3 eV. Since the distance between peaks is rather close, the spectra look like a broad peak unlike the Cr L3-edge XAS of which shows separated peaks in the XMCD spectra.
The top panel of Fig. 12 shows Cr L3 XAS spectra which is calculated by using radial matrix elements and the Cr -state DOS. It clearly shows that all three features of the XAS spectra are attributed to the down spin DOS. The bottom panel shows the Cr -state DOS which has a broader bandwidth than Cr -state of . It suggests that the Cr atom in is involved in stronger hybridization than in . In their atomic calculations of XAS/XMCD spectra of , Watson et al. [36] observed that a strong hybridization parameter is required to obtain results that show good agreement with the experimental result. Menichetti et al. [65] also reported that increasing the applied potential decreases the band-gap and attributed it to strong hybridization between the Cr and Te atoms.
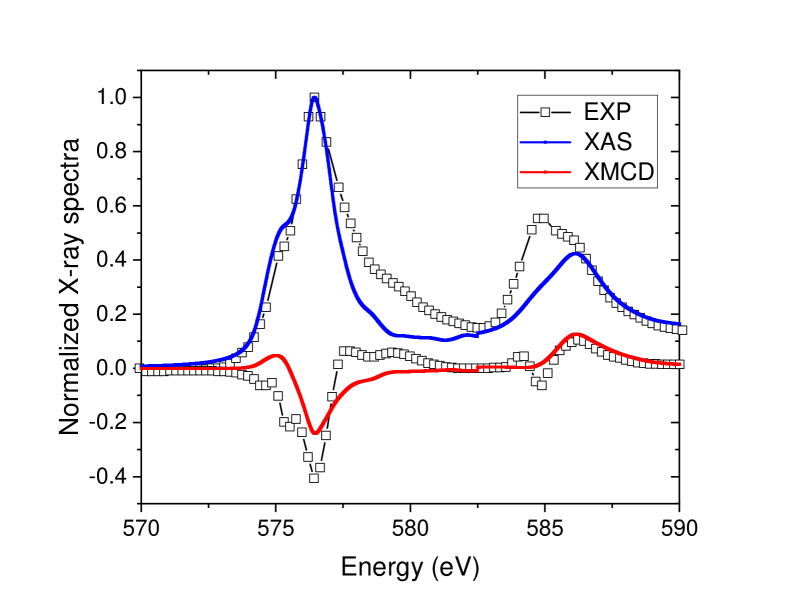
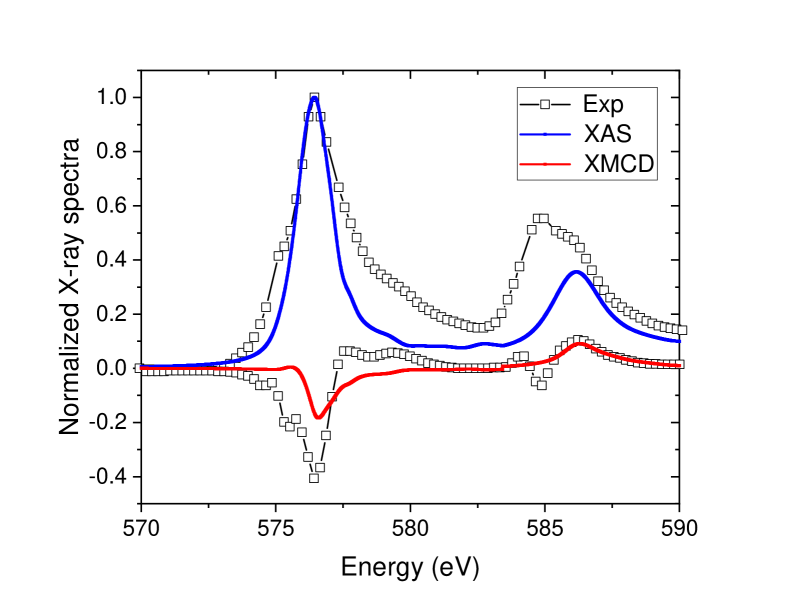
Figure 13 shows the spectra that are calculated with the FLL(top panel) and the AMF(bottom panel) schemes of the GGA+ method. The top panel shows that two lower energy peaks are separated further compared to Fig. 11. Although the L3-edge of XAS spectra which is calculated using the FLL scheme shows good agreement with the experiment, overall agreement between theoretical and experimental spectra is not so good. Using a higher value does not improve the agreement. It seems that the Hubbard is less effective for the Cr atom in the than in the since the Cr atom in the is involved in stronger hybridization.
IV conclusion
We performed first principles electronic structure calculations for bulk and thin film structures of m2DvdW materials , and with the GGA functional and the GGA+ methods. XAS, XMCD spectra were calculated using wavefunctions that were generated by first principles calculations. We show that the GGA is applicable for the metallic and the GGA+ method with a rather higher value is required for the semiconducting . Although is a semiconductor, because of the strong hybridization between Cr and Te atom, the spectral line shapes are not so sensitive to the values of the Hubbard U. The core-hole effects are not so strong to alter the spectral line shapes. Our calculations have been able to provide help in clarifying the various contributions to specific features of the experimental XMCD measured spectra. Although the complexity of the X-ray spectra excitations are formidable for calculations, by identifying which features of the spectra are primarily associated with particular elemental electron excitations, more sophisticated electron correlation treatments can be explored and tested with new experiments.
Acknowledgments
This work was supported by the U.S. Department of Energy, Office of Science, Office of Basic Energy Sciences, Materials Sciences and Engineering Division, and Early Career Research Program. Ames Laboratory is operated for the U.S. Department of Energy by Iowa State University under Contract No. DE-AC02-07CH11358.
References
- Allen et al. [2010] M. J. Allen, V. C. Tung, and R. B. Kaner, Honeycomb Carbon: A Review of Graphene, Chemical Reviews 110, 132 (2010).
- Choi et al. [2010] W. Choi, I. Lahiri, R. Seelaboyina, and Y. S. Kang, Synthesis of Graphene and Its Applications: A Review, Critical Reviews in Solid State and Materials Sciences 35, 52 (2010).
- Acik and Chabal [2011] M. Acik and Y. J. Chabal, 50, 070101 (2011).
- Coros et al. [2019] M. Coros, F. Pogacean, L. Magerusan, C. Socaci, and S. Pruneanu, A brief overview on synthesis and applications of graphene and graphene-based nanomaterials, Frontiers of Materials Science 13, 23 (2019).
- Yazyev and Katsnelson [2012] O. V. Yazyev and M. Katsnelson, Theory of Magnetism in Graphene, in Advanced Functional Materials, Science and Technology of Atomic, Molecular, Condensed Matter & Biological Systems, Vol. 2, edited by T. P. Das, B. Sanyal, and O. Eriksson (Elsevier, 2012) pp. 71 – 103.
- Kan et al. [2008] E. Kan, Z. Li, and J. Yang, Magnetism in graphene systems, Nano 03, 433 (2008).
- Gong et al. [2017] C. Gong, L. Li, Z. Li, H. Ji, A. Stern, Y. Xia, T. Cao, W. Bao, C. Wang, Y. Wang, Z. Q. Qiu, R. J. Cava, S. G. Louie, J. Xia, and X. Zhang, Discovery of intrinsic ferromagnetism in two-dimensional van der Waals crystals, Nature 546, 265 (2017).
- Huang et al. [2017] B. Huang, G. Clark, E. Navarro-Moratalla, D. R. Klein, R. Cheng, K. L. Seyler, D. Zhong, E. Schmidgall, M. A. McGuire, D. H. Cobden, W. Yao, D. Xiao, P. Jarillo-Herrero, and X. Xu, Layer-dependent ferromagnetism in a van der waals crystal down to the monolayer limit, Nature 546, 270 (2017), letter.
- [9] Microscopic understanding of magnetic interactions in bilayer , .
- Lado and Fernández-Rossier [2017] J. L. Lado and J. Fernández-Rossier, On the origin of magnetic anisotropy in two dimensional CrI3, 2D Materials 4, 035002 (2017).
- Li et al. [2019] T. Li, S. Jiang, N. Sivadas, Z. Wang, Y. Xu, D. Weber, J. E. Goldberger, K. Watanabe, T. Taniguchi, C. J. Fennie, K. Fai Mak, and J. Shan, Pressure-controlled interlayer magnetism in atomically thin cri3, Nature Materials 18, 1303 (2019).
- Subhan et al. [2019] F. Subhan, I. Khan, and J. Hong, Pressure-induced ferromagnetism and enhanced perpendicular magnetic anisotropy of bilayer CrI3, Journal of Physics: Condensed Matter 31, 355001 (2019).
- Mondal et al. [2019] S. Mondal, M. Kannan, M. Das, L. Govindaraj, R. Singha, B. Satpati, S. Arumugam, and P. Mandal, Effect of hydrostatic pressure on ferromagnetism in two-dimensional , Phys. Rev. B 99, 180407 (2019).
- Jiang et al. [2018] S. Jiang, L. Li, Z. Wang, K. F. Mak, and J. Shan, Controlling magnetism in 2d cri3 by electrostatic doping, Nature Nanotechnology 13, 549 (2018).
- Wang et al. [2016] H. Wang, F. Fan, S. Zhu, and H. Wu, Doping enhanced ferromagnetism and induced half-metallicity in monolayer, EPL (Europhysics Letters) 114, 47001 (2016).
- Xu et al. [2020] Q.-F. Xu, W.-Q. Xie, Z.-W. Lu, and Y.-J. Zhao, Theoretical study of enhanced ferromagnetism and tunable magnetic anisotropy of monolayer cri3 by surface adsorption, Physics Letters A 384, 126754 (2020).
- Morell et al. [2019] E. S. Morell, A. León, R. H. Miwa, and P. Vargas, Control of magnetism in bilayer CrI 3 by an external electric field, 2D Materials 6, 025020 (2019).
- Žutić et al. [2019] I. Žutić, A. Matos-Abiague, B. Scharf, H. Dery, and K. Belashchenko, Proximitized materials, Materials Today 22, 85 (2019).
- Liu et al. [2019a] Y. Liu, Y. Huang, and X. Duan, Van der Waals integration before and beyond two-dimensional materials, Nature 567, 323 (2019a).
- Kang et al. [2013] J. Kang, S. Tongay, J. Zhou, J. Li, and J. Wu, Band offsets and heterostructures of two-dimensional semiconductors, Applied Physics Letters 102, 012111 (2013).
- Shang et al. [2020] J. Shang, X. Tang, X. Tan, A. Du, T. Liao, S. C. Smith, Y. Gu, C. Li, and L. Kou, Stacking-Dependent Interlayer Magnetic Coupling in 2D CrI3/CrGeTe3 Nanostructures for Spintronics, ACS Applied Nano Materials 3, 1282 (2020).
- Dayen et al. [2020] J.-F. Dayen, S. J. Ray, O. Karis, I. J. Vera-Marun, and M. V. Kamalakar, Two-dimensional van der Waals spinterfaces and magnetic-interfaces, Applied Physics Reviews 7, 011303 (2020).
- Gibertini et al. [2019] M. Gibertini, M. Koperski, A. F. Morpurgo, and K. S. Novoselov, Magnetic 2D materials and heterostructures, Nature Nanotechnology 14, 408 (2019).
- Shi et al. [2018] Z. Shi, X. Wang, Y. Sun, Y. Li, and L. Zhang, Interlayer coupling in two-dimensional semiconductor materials, Semiconductor Science and Technology 33, 093001 (2018).
- Liu et al. [2019b] S. Liu, K. Yang, W. Liu, E. Zhang, Z. Li, X. Zhang, Z. Liao, W. Zhang, J. Sun, Y. Yang, H. Gao, C. Huang, L. Ai, P. K. J. Wong, A. T. S. Wee, A. T. N’Diaye, S. A. Morton, X. Kou, J. Zou, Y. Xu, H. Wu, and F. Xiu, Two-dimensional ferromagnetic superlattices, National Science Review (2019b).
- Burn et al. [2019] D. M. Burn, L. B. Duffy, R. Fujita, S. L. Zhang, A. I. Figueroa, J. Herrero-Martin, G. van der Laan, and T. Hesjedal, Cr2Te3 Thin Films for Integration in Magnetic Topological Insulator Heterostructures, Scientific Reports 9, 10793 (2019).
- Stöhr et al. [2006] J. Stöhr, H. Joachim Stšhr, and H. Siegmann, Magnetism: From Fundamentals to Nanoscale Dynamics, Springer Series in Solid-State Sciences (Springer, 2006).
- Wende [2004] H. Wende, Recent advances in x-ray absorption spectroscopy, Reports on Progress in Physics 67, 2105 (2004).
- Zhang et al. [2019] W. Zhang, P. K. J. Wong, X. Zhou, A. Rath, Z. Huang, H. Wang, S. A. Morton, J. Yuan, L. Zhang, R. Chua, S. Zeng, E. Liu, F. Xu, Ariando, D. H. C. Chua, Y. P. Feng, G. van der Laan, S. J. Pennycook, Y. Zhai, and A. T. S. Wee, Ferromagnet/Two-Dimensional Semiconducting Transition-Metal Dichalcogenide Interface with Perpendicular Magnetic Anisotropy, ACS Nano 13, 2253 (2019).
- Aruta et al. [2009] C. Aruta, G. Ghiringhelli, V. Bisogni, L. Braicovich, N. B. Brookes, A. Tebano, and G. Balestrino, Orbital occupation, atomic moments, and magnetic ordering at interfaces of manganite thin films, Phys. Rev. B 80, 014431 (2009).
- Srivastava et al. [1998] P. Srivastava, F. Wilhelm, A. Ney, M. Farle, H. Wende, N. Haack, G. Ceballos, and K. Baberschke, Magnetic moments and Curie temperatures of Ni and Co thin films and coupled trilayers, Phys. Rev. B 58, 5701 (1998).
- Zhu et al. [2016] J.-X. Zhu, M. Janoschek, D. S. Chaves, J. C. Cezar, T. Durakiewicz, F. Ronning, Y. Sassa, M. Mansson, B. L. Scott, N. Wakeham, E. D. Bauer, and J. D. Thompson, Electronic correlation and magnetism in the ferromagnetic metal , Phys. Rev. B 93, 144404 (2016).
- Park et al. [2020] S. Y. Park, D. S. Kim, Y. Liu, J. Hwang, Y. Kim, W. Kim, J.-Y. Kim, C. Petrovic, C. Hwang, S.-K. Mo, H.-j. Kim, B.-C. Min, H. C. Koo, J. Chang, C. Jang, J. W. Choi, and H. Ryu, Controlling the magnetic anisotropy of the van der waals ferromagnet fe3gete2 through hole doping, Nano Letters 20, 95 (2020).
- Frisk et al. [2018] A. Frisk, L. B. Duffy, S. Zhang, G. [van der Laan], and T. Hesjedal, Magnetic X-ray spectroscopy of two-dimensional CrI3 layers, Materials Letters 232, 5 (2018).
- Kim et al. [2019] D.-H. Kim, K. Kim, K.-T. Ko, J. Seo, J. S. Kim, T.-H. Jang, Y. Kim, J.-Y. Kim, S.-W. Cheong, and J.-H. Park, Giant Magnetic Anisotropy Induced by Ligand Coupling in Layered Cr Compounds, Phys. Rev. Lett. 122, 207201 (2019).
- Watson et al. [2020] M. D. Watson, I. Marković, F. Mazzola, A. Rajan, E. A. Morales, D. M. Burn, T. Hesjedal, G. van der Laan, S. Mukherjee, T. K. Kim, C. Bigi, I. Vobornik, M. Ciomaga Hatnean, G. Balakrishnan, and P. D. C. King, Direct observation of the energy gain underpinning ferromagnetic superexchange in the electronic structure of , Phys. Rev. B 101, 205125 (2020).
- Li et al. [2018] Q. Li, M. Yang, C. Gong, R. V. Chopdekar, A. T. N’Diaye, J. Turner, G. Chen, A. Scholl, P. Shafer, E. Arenholz, A. K. Schmid, S. Wang, K. Liu, N. Gao, A. S. Admasu, S.-W. Cheong, C. Hwang, J. Li, F. Wang, X. Zhang, and Z. Qiu, Patterning-Induced Ferromagnetism of Fe3GeTe2 van der Waals Materials beyond Room Temperature, Nano Letters 18, 5974 (2018).
- Thole et al. [1985] B. T. Thole, G. van der Laan, J. C. Fuggle, G. A. Sawatzky, R. C. Karnatak, and J.-M. Esteva, 3d x-ray-absorption lines and the 34 multiplets of the lanthanides, Phys. Rev. B 32, 5107 (1985).
- De Groot and Kotani [2008] F. De Groot and A. Kotani, Core Level Spectroscopy of Solids, Advances in Condensed Matter Science (Taylor & Francis Group, 2008).
- Antonov et al. [2004] V. Antonov, B. Harmon, and A. Yaresko, Electronic Structure and Magneto-Optical Properties of Solids (Kluwer, Dordrecht, 2004).
- Thole and van der Laan [1988] B. T. Thole and G. van der Laan, Branching ratio in x-ray absorption spectroscopy, Phys. Rev. B 38, 3158 (1988).
- Thole et al. [1992] B. T. Thole, P. Carra, F. Sette, and G. van der Laan, X-ray circular dichroism as a probe of orbital magnetization, Phys. Rev. Lett. 68, 1943 (1992).
- Carra et al. [1993] P. Carra, B. T. Thole, M. Altarelli, and X. Wang, X-ray circular dichroism and local magnetic fields, Phys. Rev. Lett. 70, 694 (1993).
- van der Laan and Thole [1996] G. van der Laan and B. T. Thole, X-ray-absorption sum rules in jj-coupled operators and ground-state moments of actinide ions, Phys. Rev. B 53, 14458 (1996).
- Pardini et al. [2012] L. Pardini, V. Bellini, F. Manghi, and C. Ambrosch-Draxl, First-principles calculation of X-ray dichroic spectra within the full-potential linearized augmented planewave method: An implementation into the Wien2k code, Computer Physics Communications 183, 628 (2012).
- Blaha et al. [2020] P. Blaha, K. Schwarz, F. Tran, R. Laskowski, G. K. H. Madsen, and L. D. Marks, WIEN2k: An APW+lo program for calculating the properties of solids, Journal of Chemical Physics 152, 074101 (2020).
- Andersen [1975] O. K. Andersen, Linear methods in band theory, Phys. Rev. B 12, 3060 (1975).
- Perlov et al. [shed] A. Y. Perlov, A. N. Yaresko, and V. N. Antonov, PY-LMTO, A Spin-polarized Relativistic Linear Muffin-tin Orbitals Package for Electronic Structure Calculations (1995, unpublished).
- Nemoshkalenko et al. [1983] V. V. Nemoshkalenko, A. E. Krasovskii, V. N. Antonov, V. N. Antonov, U. Fleck, H. Wonn, and P. Ziesche, The relativistic linear muffin-tin orbital method. application to au, 120, 283 (1983).
- Perdew et al. [1996] J. P. Perdew, K. Burke, and M. Ernzerhof, Generalized gradient approximation made simple, Phys. Rev. Lett. 77, 3865 (1996).
- Liechtenstein et al. [1995] A. I. Liechtenstein, V. I. Anisimov, and J. Zaanen, Density-functional theory and strong interactions: Orbital ordering in mott-hubbard insulators, Phys. Rev. B 52, R5467 (1995).
- Anisimov et al. [1993] V. I. Anisimov, I. V. Solovyev, M. A. Korotin, M. T. Czyżyk, and G. A. Sawatzky, Density-functional theory and NiO photoemission spectra, Phys. Rev. B 48, 16929 (1993).
- Czyżyk and Sawatzky [1994] M. T. Czyżyk and G. A. Sawatzky, Local-density functional and on-site correlations: The electronic structure of and , Phys. Rev. B 49, 14211 (1994).
- Yaresko et al. [2003] A. N. Yaresko, V. N. Antonov, and P. Fulde, Localized u 5f electrons in upd3 from lda+u calculations, Phys. Rev. B 67, 155103 (2003).
- McGuire et al. [2015] M. A. McGuire, H. Dixit, V. R. Cooper, and B. C. Sales, Coupling of crystal structure and magnetism in the layered, ferromagnetic insulator cri3, Chemistry of Materials 27, 612 (2015).
- Carteaux et al. [1995] V. Carteaux, D. Brunet, G. Ouvrard, and G. Andre, Crystallographic, magnetic and electronic structures of a new layered ferromagnetic compound Cr2Ge2Te6, Journal of Physics: Condensed Matter 7, 69 (1995).
- Deiseroth et al. [2006] H.-J. Deiseroth, K. Aleksandrov, C. Reiner, L. Kienle, and R. K. Kremer, Fe3GeTe2 and Ni3GeTe2 – Two New Layered Transition-Metal Compounds: Crystal Structures, HRTEM Investigations, and Magnetic and Electrical Properties, European Journal of Inorganic Chemistry 2006, 1561 (2006).
- Kokalj [1999] A. Kokalj, XCrySDen—a new program for displaying crystalline structures and electron densities, Journal of Molecular Graphics and Modelling 17, 176 (1999).
- May et al. [2016] A. F. May, S. Calder, C. Cantoni, H. Cao, and M. A. McGuire, Magnetic structure and phase stability of the van der Waals bonded ferromagnet , Phys. Rev. B 93, 014411 (2016).
- Verchenko et al. [2015] V. Y. Verchenko, A. A. Tsirlin, A. V. Sobolev, I. A. Presniakov, and A. V. Shevelkov, Ferromagnetic Order, Strong Magnetocrystalline Anisotropy, and Magnetocaloric Effect in the Layered Telluride Fe3-δGeTe2, Inorganic Chemistry 54, 8598 (2015).
- Lee et al. [2020] Y. Lee, T. Kotani, and L. Ke, Role of nonlocality in exchange correlation for magnetic two-dimensional van der Waals materials, Phys. Rev. B 101, 241409 (2020).
- Ke and Katsnelson [2020] L. Ke and M. I. Katsnelson, The surprising effect of electron correlations on exchange interactions and spin excitations in magnetic 2d van der waals materials (2020), arXiv:2007.14518 [cond-mat.mtrl-sci] .
- Gudelli and Guo [2019] V. K. Gudelli and G.-Y. Guo, Magnetism and magneto-optical effects in bulk and few-layer CrI3: a theoretical GGA+ study, New Journal of Physics 21, 053012 (2019).
- Sivadas et al. [2018] N. Sivadas, S. Okamoto, X. Xu, C. J. Fennie, and D. Xiao, Stacking-Dependent Magnetism in Bilayer CrI3, Nano Letters 18, 7658 (2018).
- Menichetti et al. [2019] G. Menichetti, M. Calandra, and M. Polini, Electronic structure and magnetic properties of few-layer cr2ge2te6: the key role of nonlocal electron–electron interaction effects, 2D Materials 6, 045042 (2019).