Inference of joint conformational distributions from separately-acquired experimental measurements
Abstract
Many biomolecules have flexible structures, requiring distributional estimates of their conformations. Experiments to acquire distributional data typically measure pairs of labels separately, losing information on the joint distribution. These data are assumed independent when estimating the conformational ensemble. We developed a method to estimate the true joint distribution from separately acquired measurements, testing it on two biological systems. This method accurately reproduces the joint distribution where known and generates testable predictions about complex conformational ensembles.
Flexible protein structures are often determined using multiple spectroscopic measurements that are performed independently on different parts of the protein but considered jointlyHays et al. (2018, 2019); Marinelli and Faraldo-Gómez (2015); Roux and Islam (2013). These independent measurements are treated as uncorrelated, while in actuality there likely exists a correlation structure in conformation probability space. Here, we introduce a means to estimate the joint distributions including any correlation structure. Such estimation is enabled by a stochastic resampling approach that estimates the free energy of restraining the protein to any individual conformation using non-equilibrium work measurements in simulations.
Flexible proteins play a critical role in a wide variety of cellular processes, including flexible recognition events during infection and in signal transduction pathways. This flexibility is essential to biological functionMotlagh et al. (2014); Norman et al. (2004); Wright and Dyson (2015); Dyson and Wright (2005). Experimental methods that have traditionally been used to study the structural ensembles of biological systems, like X-ray crystallography and nuclear magnetic resonance (NMR) spectroscopy, tend to reduce the ensemble to just a few low energy states in order to achieve high-resolution structuresBoehr et al. (2009); Jimenez et al. (2004); Willcox et al. (1999). As awareness has increased of the fundamental role structural heterogeneity plays in biological function, new experimental methods have been developed to report directly on full ensembles. Methods such as double electron-electron resonance (DEER) spectroscopy and single molecule Förster resonance energy transfer (smFRET) provide distance distributions between labeled amino acids, and thus yield quantitative information on conformational populations in a sampleBernadó et al. (7 05); Wei et al. (2016); Levin et al. (2007); Bonvin and Brü (1995). However, these methods come with an important set of challenges, described below.
Label-based experiments that yield distributional data are severely restricted in the number of labels that can be measured simultaneously, leading to two major limitations: since each distribution requires a separate, time-consuming experiment, the data tend to be sparse over atomic coordinates, and separately measured label sets do not provide information on the joint distribution. Recent efforts have ameliorated the former limitation by optimizing label placement to ensure maximally informative measurementsMittal and Shukla (2017); Jeschke (2012); Hays et al. (2018), but little progress has been made in handling the latter. Here we present a general method for inferring joint probability distributions from separately-acquired measurements. The method not only estimates the correlation structure of the experimental distributions, but also provides a direct way to infer the conformational ensemble of interest.
We first lay out the theoretical basis for the approach, then apply the method to two example systems: a toy model of an alternating-access transporter and the soluble N-ethylmaleimide-sensitive factor attachment receptor (SNARE) protein syntaxin-1a. In the case of the alternating transporter, where the joint distribution is known, we find that our method accurately reproduces the joint distribution and correctly estimates the true conformational ensemble. In the case of syntaxin, DEER data have been acquired, but the joint distribution is unknown. We find that EESM converges stably to a final estimate of the joint distribution which differs significantly from the convolution of the experimental distributions. The new joint distribution provides novel, testable structural data on the syntaxin that may be used to guide future experiments. Although we have chosen to demonstrate the approach using specific biological systems, the method will estimate joint probability distributions and conformational ensembles of any system for which distributional data can be obtained.
Let us denote a set of separately measured probability distribution functions , where is a random variable representing the observable of interest. In this convention, particular values of are denoted . In the applications presented later, each is a single DEER distribution and is the distance variable of the pair of atoms. We wish to estimate not only the joint probability distribution , but the conformational ensemble which optimally reproduces the joint distribution. This inference problem can be stated in terms of conditional probabilities: what is the probability of an ensemble given a set of distance variables, i.e., what is ? The joint probability distribution is proportional to the free energy difference of the desired ensemble from some (arbitrary) reference ensemble:
| (1) |
If each random variable can take on values with probability , then the probability of observing a particular conformation given a specific set of distances is trivially:
| (2) |
The challenge then lies in determining the free energy landscape as a function of the experimental observables. In some cases, it may be possibly to calculate this free energy analytically or via thermodynamic integration, but in general, it is prohibitively expensive to directly calculate the equilibrium free energy because of the large number of degrees of freedom and the slow relaxation timescales involved. Instead, the most robust and general method for calculating this free energy is via non-equilibrium sampling and use of the Jarzynski equality: Jarzynski (1997). We detail below how to leverage the Jarzynski equality and the experimental data to estimate the free energy landscape.
We previously developed a methodology, bias-resampling ensemble refinement (BRER), to incorporate distributional data into molecular dynamics (MD) simulationHays et al. (2019). The original method assumes that all are independent, but a simple extension of this formalism enables estimation of the joint distribution. The original BRER method is an iterative approach as follows:
-
1.
randomly sample a conformation from the current ensemble estimate
-
2.
select a set of observables, , via probability-weighted draws from the experimental distributions .
-
3.
run a biased MD simulation to constrain the conformation such that all
-
4.
update the estimate with the final conformation
The method is trivially parallelized by drawing multiple conformations in a single iteration and applying the constraints to each .
To estimate the free energy of a set of conformations given a set of observables , we can leverage the data from the biased MD runs of step (3). Because we use a simple linear biasing potential, it is trivial to calculate the work done on the ensemble to enforce the constraints. We can thus apply this simple linear bias to restrain the system to a single point in observable space, then use the nonequilibrium work to estimate equilibrium free energy differences via Jarzynski’s equality. Specifically:
| (3) |
where is a reference ensemble, in this case the estimated equilibrium ensemble assuming uncorrelated observables.
The general method for calculating both the joint distribution and the conformational ensemble from simulation, which we call Ensemble Estimation from Separate Measurements (EESM), can be summarized as follows:
-
1.
Draw a set of conformations from a reference ensemble.
-
2.
Select a set of specific observable values via stochastic draws from each .
-
3.
Apply a linear biasing potential such that for all .
-
4.
Calculate the work done in (3) and, consequently, the probabilities .
-
5.
Repeat 1-4 until the distribution has been estimated.
This method is demonstrated below for a simple biological model system.
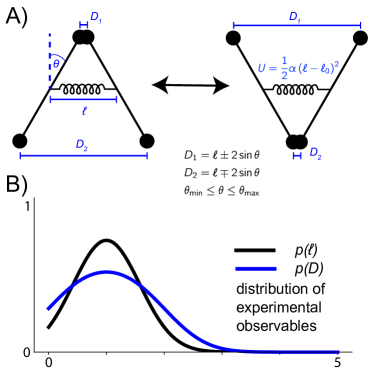
Alternating-access transporters are a class of membrane proteins that transport their substrates by switching between outward-facing and inward-facing conformationsWiddas (1952); Jardetzky (1966); Rees et al. (2009); Abramson et al. (2003); Ward et al. (2007); Wilkens (2015). In order to test the EESM approach, we studied a simple model of a “flexible” alternating transporter (Fig 1A). The model consists of two rigid rods connected at their midpoints by a spring with constant . The rods rotate about their midpoints subject to two constraints: they mirror each other’s rotation (the “channel” of the transporter is a symmetry axis) and the angle of rotation is constrained to a range . For a given channel width , all permitted values of have equal energy, while those outside the permitted range have infinite energy.
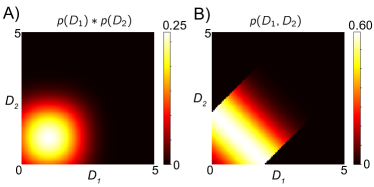
We can imagine performing three separate experiments on the transporter to try to estimate its conformational ensemble: one that measures the width of the channel midpoint , one that measures the distribution of the “inward-facing” mouth of the channel ( of Fig 1A), and one that measures the “outward-facing” mouth of the channel ( of Fig 1A). The results of these hypothetical experiments are shown in Fig 1B. Without any additional information, we would assume that the separately measured variables and are independent and we would estimate the joint probability distribution as shown in Fig 2A. However, because of the constraints imposed on the channel, the true joint distribution is dramatically different (Fig 2B).
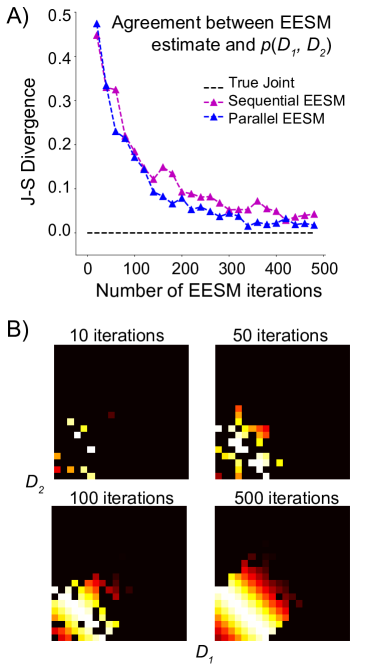
In order to estimate the true distribution from only the experimental observables, we performed 500 aggregate iterations of EESM (details are provided in the Supplemental Materials). As the number of iterations increases, the estimate of the joint distribution approaches the true distribution. This is quantified via Jensen-Shannon divergence in Fig 3A and illustrated as plots of the joint distribution in Fig 3B. This simple but powerful example demonstrates that the method can indeed recover the correlation structure of separately measured distributions.
Refinement of the SNARE protein syntaxin-1a presents a significantly more challenging problem because it requires knowledge of many more degrees of freedom. SNARE proteins drive neuronal vesicle fusion and thus synaptic neurotransmissionJahn and Scheller (2006); Carr (2001); Misura et al. (2000); Chen and Scheller (2001); Gerber et al. (2008). Syntaxin exhibits a complex open/closed conformational equilibrium believed to regulate SNARE complex assembly: “open” syntaxin is able to form SNARE complexes, but “closed” is notLerman et al. (2000); Margittai et al. (2003). The closed state has been characterized experimentallyChen et al. (2008), but the open state ensemble remains underdeterminedRizo and Südhof (2002); Liang et al. (2013); Wang et al. (2017). Thus, refining the open state conformational ensemble would provide insight into the mechanism of SNARE complex assembly and the regulation of neurotransmission.
We estimated the conformational ensemble of syntaxin using EESM and a set of three published DEER measurements. To obtain pair-wise distance distributions, DEER measurements must be obtained in a sequential fashion, meaning that information on the joint distribution is lost. A previously previously published estimate of the syntaxin ensemble assumes that the DEER distributions are independentHays et al. (2019); here, we refine the estimate further by explicitly calculating the joint distribution.
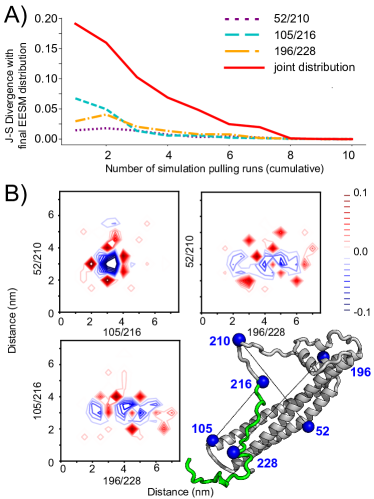
We performed an aggregate of 1.3 s of molecular dynamics (MD) simulation and used EESM to estimate the joint probability distribution of the three DEER-derived distance distributions (projections of the joint space may be found in the Supplemental Material). EESM converges stably to a final estimate of the joint distribution over ten EESM iterations (Fig. 4A). This final EESM estimate is quite different from the convolution of the experimental distributions (Fig. 4B). By subtracting the EESM distribution from the experimental convolution, we identified sets of structures that are significantly down-weighted by the EESM method. These are structures predicted to have high probability under the assumption that the experimental distributions are independent, but have low probability after the EESM correction. The most down-weighted structure is shown in Fig. 4B. From inspection, this structure appears unlikely, as one of the major structural elements in syntaxin is disrupted. Specifically, we would not expect a low-energy conformation to have an unstructured backbone region that maintains contacts with the structured domain; instead, we expect complete dissociation of the end region (rendered in green in Fig. 4B) while maintaining some secondary structure (see Supplement for further discussion). The presence or absence of such a structure can be tested via systematically-designed DEER experimentsHays et al. (2018) or other methods such as cross-linking mass spectrometryChristie et al. (2012). Thus, EESM produces testable hypotheses about the syntaxin conformational ensemble.
We have developed a method, ensemble estimation from separate measurements, that can be used to infer the joint distribution of separately-acquired measurements and the conformational ensemble which optimally reproduces that distribution. The method was tested on a simplified model of an alternating-access transporter, where it efficiently yielded the true joint distribution and conformational ensemble a priori. We found that EESM converged to the correct distribution within relatively few iterations (Fig 3), confirming that EESM can be used to calculate the correlation structure of separately-measured distributions.
EESM is particularly designed to estimate the conformational ensembles of systems where it is impossible to obtain a ground truth ensemble and joint distribution, as is the case for syntaxin-1a. We used EESM to estimate the syntaxin ensemble from three separately-acquired DEER distributions. We evaluated the method based on two criteria: its convergence behavior and its ability to generate testable hypotheses. We found that EESM converges smoothly to a final estimate of the joint distribution that is distinct from the convolved distributions (Fig. 4A). Most importantly, the EESM-refined ensemble revealed structures that are predicted to have significantly lower probability in reality than one would have anticipated from the convolved distributions. These structures can be used immediately to design additional DEER experiments that would further refine the syntaxin ensemble.
Spectroscopic measurements that provide pair-wise distributions are a rich source of experimental data on heterogeneous ensembles. However, the utility of these measurements has been limited by the need to introduce and measure each label pair separately. EESM enables inference of the correlation structure between these separate measurements, greatly improving our ability to leverage such experiments to refine complex, flexible conformational ensembles.
Acknowledgements.
The authors thank Z. Lu, E. Irrgang, K. Dubay, and D. Cafiso for helpful discussions. This work was supported by NSF OAC-1835780 and NIH R01GM115790 to P.M.K, a Wallenberg Academy Fellowship to P.M.K., and a MolSSI Fellowship from the National Science Foundation (ACI-1547580) to J.M.H. Computational resources were provided by XSEDE TG-MCB150128.References
- Hays et al. (2018) J. M. Hays, M. K. Kieber, J. Z. Li, J. I. Han, L. Columbus, and P. M. Kasson, Angew. Chem. Int. Ed. 57, 17110 (2018).
- Hays et al. (2019) J. M. Hays, D. S. Cafiso, and P. M. Kasson, J. Phys. Chem. Lett. , 3410 (2019).
- Marinelli and Faraldo-Gómez (2015) F. Marinelli and J. D. Faraldo-Gómez, Biophysical Journal 108, 2779 (2015).
- Roux and Islam (2013) B. Roux and S. M. Islam, J. Phys. Chem. B 117, 4733 (2013).
- Motlagh et al. (2014) H. N. Motlagh, J. O. Wrabl, J. Li, and V. J. Hilser, Nature 508, 331 (2014).
- Norman et al. (2004) A. W. Norman, M. T. Mizwicki, and D. P. G. Norman, Nat Rev Drug Discov 3, 27 (2004).
- Wright and Dyson (2015) P. E. Wright and H. J. Dyson, Nat Rev Mol Cell Biol 16, 18 (2015).
- Dyson and Wright (2005) H. J. Dyson and P. E. Wright, Nat Rev Mol Cell Biol 6, 197 (2005).
- Boehr et al. (2009) D. D. Boehr, R. Nussinov, and P. E. Wright, 5, 789 (2009).
- Jimenez et al. (2004) R. Jimenez, G. Salazar, J. Yin, T. Joo, and F. E. Romesberg, PNAS 101, 3803 (2004).
- Willcox et al. (1999) B. E. Willcox, G. F. Gao, J. R. Wyer, J. E. Ladbury, J. I. Bell, B. K. Jakobsen, and P. A. van der Merwe, 10, 357 (1999).
- Bernadó et al. (7 05) P. Bernadó, E. Mylonas, M. V. Petoukhov, M. Blackledge, and D. I. Svergun, 129, 5656 (2007-05).
- Wei et al. (2016) G. Wei, W. Xi, R. Nussinov, and B. Ma, Chem. Rev. 116 (2016), 10.1021/acs.chemrev.5b00562.
- Levin et al. (2007) E. J. Levin, D. A. Kondrashov, G. E. Wesenberg, and G. N. Phillips, Structure 15, 1040 (2007).
- Bonvin and Brü (1995) A. M. J. J. Bonvin and A. T. Brü, 250, 80 (1995).
- Mittal and Shukla (2017) S. Mittal and D. Shukla, 121, 9761 (2017).
- Jeschke (2012) G. Jeschke, J. Chem. Theory Comput. 8, 3854 (2012).
- Jarzynski (1997) C. Jarzynski, Phys. Rev. Lett. 78, 2690 (1997).
- Widdas (1952) W. F. Widdas, The Journal of Physiology 118, 23 (1952).
- Jardetzky (1966) O. Jardetzky, Nature 211, 969 (1966).
- Rees et al. (2009) D. C. Rees, E. Johnson, and O. Lewinson, Nat Rev Mol Cell Biol 10, 218 (2009).
- Abramson et al. (2003) J. Abramson, I. Smirnova, V. Kasho, G. Verner, S. Iwata, and H. R. Kaback, (2003).
- Ward et al. (2007) A. Ward, C. L. Reyes, J. Yu, C. B. Roth, and G. Chang, PNAS 104, 19005 (2007).
- Wilkens (2015) S. Wilkens, F1000Prime Rep 7 (2015), 10.12703/P7-14.
- Jahn and Scheller (2006) R. Jahn and R. H. Scheller, Nat Rev Mol Cell Biol 7, 631 (2006).
- Carr (2001) C. M. Carr, Nature Structural Biology 8, 186 (2001).
- Misura et al. (2000) K. M. S. Misura, R. H. Scheller, and W. I. Weis, Nature 404, 355 (2000).
- Chen and Scheller (2001) Y. A. Chen and R. H. Scheller, Nat Rev Mol Cell Biol 2, 98 (2001).
- Gerber et al. (2008) S. H. Gerber, J.-C. Rah, S.-W. Min, X. Liu, H. de Wit, I. Dulubova, A. C. Meyer, J. Rizo, M. Arancillo, R. E. Hammer, M. Verhage, C. Rosenmund, and T. C. Südhof, Science 321, 1507 (2008).
- Lerman et al. (2000) J. C. Lerman, J. Robblee, R. Fairman, and F. M. Hughson, Biochemistry 39 (2000), 10.1021/bi0003994.
- Margittai et al. (2003) M. Margittai, J. Widengren, E. Schweinberger, G. F. Schroder, S. Felekyan, E. Haustein, M. Konig, D. Fasshauer, H. Grubmuller, R. Jahn, and C. A. M. Seidel, PNAS 100, 15516 (2003).
- Chen et al. (2008) X. Chen, J. Lu, I. Dulubova, and J. Rizo, 41, 43 (2008).
- Rizo and Südhof (2002) J. Rizo and T. C. Südhof, Nat Rev Neurosci 3, 641 (2002).
- Liang et al. (2013) B. Liang, V. Kiessling, and L. K. Tamm, PNAS 110, 19384 (2013).
- Wang et al. (2017) S. Wang, U. B. Choi, J. Gong, X. Yang, Y. Li, A. L. Wang, X. Yang, A. T. Brunger, and C. Ma, EMBO J. 36, 816 (2017).
- Christie et al. (2012) M. P. Christie, A. E. Whitten, G. J. King, S.-H. Hu, R. J. Jarrott, K.-E. Chen, A. P. Duff, P. Callow, B. M. Collins, D. E. James, and J. L. Martin, PNAS 109, 9816 (2012).