Universal scaling properties of QCD
close to the chiral limit††thanks: Presented at workshop on Criticality in QCD and the Hadron Resonance Gas; 29-31 July 2020, Wroclaw, Poland.
Abstract
We present a lattice QCD based determination of the chiral phase transition temperature in QCD with two massless (up and down) and one strange quark having its physical mass. We propose and calculate two novel estimators for the chiral transition temperature for several values of the light quark masses, corresponding to Goldstone pion masses in the range of . The chiral phase transition temperature is determined by extrapolating to vanishing pion mass using universal scaling relations. After thermodynamic, continuum and chiral extrapolations we find the chiral phase transition temperature MeV. We also show some preliminary calculations that use the conventional estimator for the pseudo-critical temperature and compare with the new estimators for . Furthermore, we show results for the ratio of the chiral order parameter and its susceptibility and argue that this ratio can be used to differentiate between and universality classes in a non-parametric manner.
11.10.Wx, 11.15.Ha, 12.38.Aw, 12.38.Gc, 12.38.Mh, 24.60.Ky, 25.75.Gz, 25.75.Nq
1 Introduction
By now it is well established that for physical values of light and strange quark masses QCD undergoes a smooth crossover from a low temperature hadronic phase to a high temperature partonic phase [1, 2]. The chiral crossover temperature has been determined in various numerical studies of lattice QCD [3, 4, 5, 6, 7]. On the other hand the order of the QCD transition in the chiral limit with two massless degenerate quarks has been a celebrated topic without any concrete conclusion, yet. It has been argued long back [8] that “effective restoration” of , which is broken in vacuum, could play a very important role determining the order of the chiral phase transition for two massless flavors. When the remains broken at the chiral transition temperature, the chiral transition is expected to belong to the universality class [8] which is the most celebrated scenario till date. In case the gets effectively restored at the chiral transition then the latter may become first order [8], although second order phase transition belonging to other 3-d universality classes could also become relevant [9, 10, 11, 12]. If the chiral transition is first order then there exists an endpoint, belonging to universality class, at a non-zero value of light quark mass, where the chiral susceptibility will diverge.
In this contribution we present the first lattice QCD based determination [15] of the chiral phase transition temperature. Since there is no direct evidence for a first order phase transition down to a quite small pion mass, we employ the scaling to calculate the critical temperature for vanishing light quark masses. We introduce and present results for two novel estimators of which are reliable even for finite quark masses. We also present result for the ratio of the chiral order parameter and its susceptibility and argue that this ratio can be very effective in differentiating between and universality classes in a non-parametric manner.
2 Formalism
We start with the definition of the quark condensate,
| (1) |
In the chiral limit, the light quark chiral condensate , serves as an exact order parameter for the spontaneous breaking of chiral symmetry at low temperature. Additive and multiplicative renormalization have been taken care of by introducing [4] a combination of light and strange quark condensates,
| (2) |
where MeV, is the kaon decay constant, used as a normalization constant. The chiral susceptibility is defined as,
| (3) |
Close to a order phase transition, and are expected to be described by universal finite-size scaling functions and [18],
| (4) |
where the scaling variables in the arguments are defined as and , with denoting the reduced temperature; with being the symmetry breaking field, and denoting the linear extent of the system, . The normalization constants and appearing in definition of the scaling variables are non-universal parameters. and denote sub-leading contributions which arise due to contributions from corrections-to-scaling [13, 14] and regular terms, away from the critical point, for and respectively.
For large enough system sizes, the peak in the scaling function has been used as the usual estimator for the pseudo-critical temperature , which scales as
| (5) |
with . The universal quark mass dependence of is described by the first term and ‘sub-leading’ represents contributions from corrections-to-scaling and regular terms. In principle, the situation is same for scaling of a temperature defined at any fixed value ( in Eq. 5). Depending on the value of , may change significantly within a given window of , towards chiral limit [4]. This makes the chiral extrapolation complicated due to increasing importance of the contribution from the sub-leading terms. Here we consider two estimators [15, 16] for , defined close to or at , in the thermodynamic limit resulting in an order of magnitude smaller mass variation in Eq. 5. Pseudo-critical temperatures and are defined through,
| (6) | |||||
| (7) |
Since and , These pseudo-critical temperatures, and , give already a reasonable estimate of for non-zero and . Forms of universal functions along with the optimal parameterized form can be found in Ref.[19], for the 3-d, universality class. Here we present the calculation of through and . Details of the calculational set-up can be found in Ref.[15]. Ignoring corrections-to-scaling and keeping in only the leading -independent, infinite volume regular contribution proportional to , we then find for the pseudo-critical temperatures [15],
| (8) |
Here we also present the results for the ratio of and and we argue that this ratio can be used to study the difference between the and universality classes, through a non-parametric comparison. In the infinite volume limit, following Eq. 4 one can write:
| (9) |
where the first term is the universal part and the second term is a regular contribution which has been calculated by taking in Eq. 4. We will calculate the ratio in the LHS of Eq. 9 in the thermodynamic limit at different temperatures like and and compare with that from scaling expectation of RHS, where and will be numbers fixed by the universality class. As can be seen from Eq. 9 a comparison without the regular term is parameter free. If a second order endpoint exists at some finite quark mass, , then we have to replace by in the RHS of Eq. 9.
3 Results
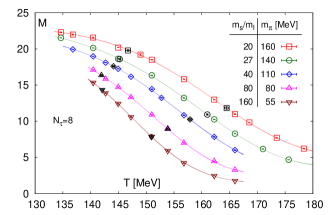
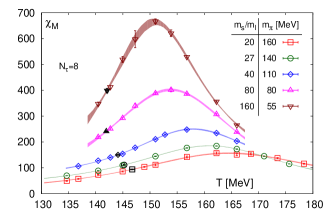
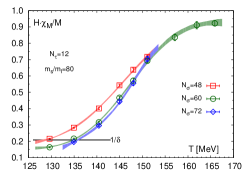
We start with the results for for different values of which is shown in Fig. 1 (left) for lattices of size with . One can see clearly that decreases with decreasing and the crossover becomes sharper towards smaller . In Fig. 1 (right) we show the chiral susceptibility for lattices as for Fig. 1 (left). The apparent increase of peak height is visible with decreasing and this is consistent with the expected behavior, , with , although within rather large uncertainty which restricts a precise determination of .
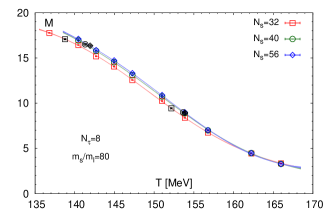
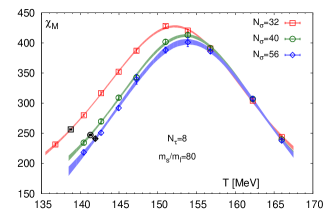
In Fig. 2 (left) we show the volume dependence of the order parameter for on lattices with and for different aspect ratios, and . One can see that increases and saturates when approaching the thermodynamic limit. This is found as a basic feature in finite size scaling studies [18] when there is a second order phase transition for vanishing external field. In Fig. 2 (right) we show the volume dependence for the same lattices as for Fig. 2 (left). Similar results have also been obtained for and . It is important to note that decreases slightly with increasing volume, contrary to what one would expect to find at or close to a order phase transition. In fact this trend also seems to be consistent with the behavior seen for universality class finite-size scaling functions [18]. Our current results, thus, suggest a continuous phase transition at .
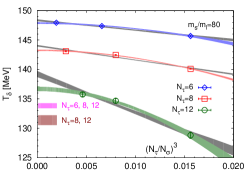
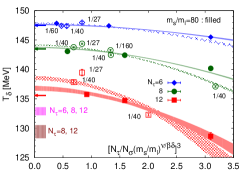
Using the results of and we have constructed the ratio for lattices with different spatial extents and several values of the light quark masses. In Fig. 3 (left) this ratio has been shown for the lattices with , as a typical example. Colored bands are interpolations to the data and the crossings with the horizontal line at define . We extrapolate for a fixed by two methods: (1) using the scaling function following Eq. 8 where the volume correction is roughly [19] and (2) assuming correction which is the case if the volume correction is of regular origin. The resulting volume extrapolations are shown in Fig. 3 (middle) where it can be seen that the data seems to reach the thermodynamic limit faster than . The difference between these two extrapolations to the thermodynamic limit serves as one component of the systematic uncertainty. The same procedure has been followed for all three different values and then the continuum extrapolation of these infinite volume results is performed with and without which gives a second source to the systematic uncertainty. These continuum extrapolated results are shown in Fig. 3 (middle) by horizontal bands with different colors. The same set of analyses have also been performed for . Finally, we extrapolate the for and to the chiral limit using Eq. 8, putting . Results obtained from these extrapolation chains, with the thermodynamic limit results obtained either through or ansatz, and continuum limit extrapolations with and without , lead to chiral phase transition temperatures in the range (-) MeV.
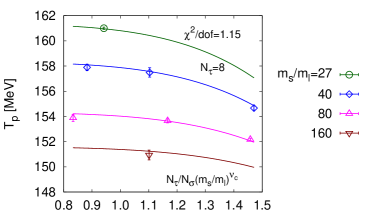
Since from Fig. 3 (middle) we can see that the scaling ansatz is already working quite well for finite lattice spacing, we attempt a joint extrapolation to the chiral and thermodynamic limit using results for all masses and on all available volumes, through finite-size scaling function. The resulting extrapolations for three different are shown in Fig. 3 (right) where we show the extrapolation only for and for better readability of the plot. Noticeably for , these bands compare well with the fits shown in Fig. 3 (middle). Colored arrows show the chiral limit results for each , in the thermodynamic limit. As a final step, the continuum extrapolation has been performed again with and without the result. The results are shown by the horizontal bars in different colors in Fig. 3 (right). Results for , obtained by this method, are also shown in Fig. 4 and they are found to be in complete agreement with the corresponding numbers when the continuum limit has been taken before the chiral limit.
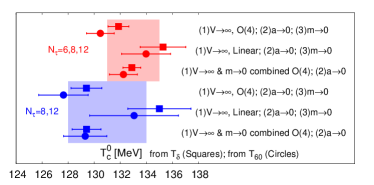
For same set of analyses has been done as for and, as can be seen from Fig. 4, the resulting numbers from analyses of agree within 1% with the same obtained from analyses. Leaving out numbers systematically gives a 2-3 MeV decrease of , reflected in the displacement of the two colored bands in Fig. 4. Out of all the above-mentioned analyses we finally quote the chiral phase transition temperature,
| (10) |
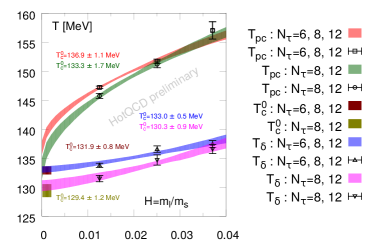
For completeness we also carried out the analyses for the peak position of the chiral susceptibility, i.e. . Here also we first take the thermodynamic limit and then the continuum limit. Results for continuum extrapolated are shown in Fig. 5 (left). For the extrapolation of we could not include the sub-leading contributions, which is of course, important. Including such a term with the three values at our disposal, makes the chiral extrapolation way less controlled. Apparently the obtained from the extrapolations of , even without a regular contribution, are in agreement with the same from within 95% confidence. The inclusion of a regular term will presumably make the agreement even better. Inclusion of results, as usual gives systematically higher , similar to the case of , as mentioned earlier. The numbers in Fig. 5 (left) are preliminary. Here we also show the and for , for lattices with aspect ratio 4 only, for which finite volume effects have been estimated to be similar to the magnitude of the present uncertainty. This can be seen from Fig. 5 (right) where we have shown the joint chiral and thermodynamic limit extrapolation for using the finite size scaling functions. A similar analysis has also been carried out for and . A continuum extrapolation then gives consistent with Fig. 5 (left) and other estimates within 95% confidence.
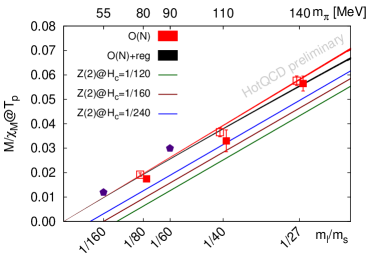
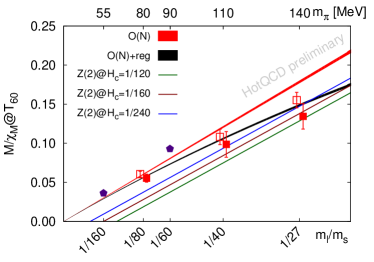
Next we show in Fig. 6 left and right results for the ratio of and evaluated at different temperatures, i.e. and , respectively. As discussed earlier this ratio gives a handle to compare the QCD results with results for different universality classes in a non-parametric way. We first calculate the ratio at the specified temperatures on different volumes for a fixed mass and fixed . We have already seen in Fig. 2 (left) and Fig. 2 (right) that the volume dependences of and are very small both at and . As a result the volume dependence of the ratio is also found to be small and in most of the cases a linear volume extrapolation gives the thermodynamic limit result which is in good agreement with that from the largest volume available. As usual for we show the result for aspect ratio 4 and for this ratio we did not apply estimated correction because of the above-mentioned reason. Next we continuum extrapolate the ratio for a fixed and these continuum extrapolated results are depicted in Fig. 6. For and 1/160 we have results only for and 8, respectively. Like in other cases we checked the systematic uncertainty in the continuum extrapolation by including and excluding results. In Fig. 6 we show the scaling expectations for (relevant for continuum extrapolated cases) and (relevant for results obtained with a finite lattice spacing) universality classes following Eq. 9. Expectations based on both universality classes differ little and are plotted together as a band denoted as . For the regular part of Eq. 9 we did not fit the coefficient from the ratio. For our preliminary comparison we rather took the values of and from the fit of and . This seems to describe the data quite satisfactorily up to physical masses. In Fig. 6 one can see that the effect of a regular term is more important at compared to which seems to be counter-intuitive. Since the contribution of a (-independent) regular term compared to the singular contribution rises for and decreases for when one goes from to , a depreciation of the regular contribution of the ratio happens, which can be realized by looking at Eq. 9. We also show the scaling expectations for universality class for different values of . Of course, when there is a endpoint at some non-vanishing , then , defined in Eq. 1 is not an exact order parameter anymore [20, 21]. Although one has to keep in mind that the mixing between magnetization like and energy like operators becomes smaller when decreases. Fig. 6 apparently shows that with the current calculations, the existence of a endpoint is unlikely down to corresponding to MeV.
4 Conclusions
Based on two novel estimators, we have calculated the chiral phase transition temperature in QCD with two massless light quarks and a physical strange quark. Eq. 10 lists our thermodynamic-, continuum- and chiral-extrapolated result for the chiral phase transition temperature, which is about MeV smaller than the pseudo-critical (crossover) temperature, for physical values of the light and strange quark masses. Preliminary calculation of from the peak positions gives results which are in agreement within 95% confidence with the results from new estimators. We also showed the results for the ratio of the chiral condensate and chiral susceptibility which we used to differentiate between and universality classes in a non-parametric manner and we found that the existence of second order endpoint belonging to universality class seems to be unlikely down to MeV.
5 Acknowledgement
This work was supported by the Deutsche Forschungsgemeinschaft (DFG) through Grant No. 315477589-TRR 211 and by Grant No. 05P18PBCA1 of the German Bundesministerium für Bildung und Forschung.
References
- [1] Y. Aoki, G. Endrodi, Z. Fodor, S. D. Katz and K. K. Szabo, Nature 443, 675-678 (2006).
- [2] for a recent review see: H. T. Ding, F. Karsch and S. Mukherjee, Int. J. Mod. Phys. E 24, no. 10, 1530007 (2015).
- [3] Y. Aoki, S. Borsanyi, S. Durr, Z. Fodor, S. D. Katz, S. Krieg and K. K. Szabo, JHEP 0906, 088 (2009).
- [4] A. Bazavov et al., Phys. Rev. D 85, 054503 (2012).
- [5] C. Bonati, M. D’Elia, M. Mariti, M. Mesiti, F. Negro and F. Sanfilippo, Phys. Rev. D 92, 054503 (2015).
- [6] A. Bazavov et al. [HotQCD Collaboration], Phys. Lett. B 795 15 (2019).
- [7] S. Borsanyi, Z. Fodor, J. N. Guenther, R. Kara, S. D. Katz, P. Parotto, A. Pasztor, C. Ratti and K. K. Szabo, Phys. Rev. Lett. 125, 052001 (2020).
- [8] R. D. Pisarski and F. Wilczek, Phys. Rev. D 29, 338 (1984).
- [9] A. Butti, A. Pelissetto and E. Vicari, JHEP 08, 029 (2003).
- [10] M. Grahl and D. H. Rischke, Phys. Rev. D 88, 056014 (2013).
- [11] A. Pelissetto and E. Vicari, Phys. Rev. D 88, 105018 (2013).
- [12] T. Sato and N. Yamada, Phys. Rev. D 91, 034025 (2015).
- [13] M. Hasenbusch, J. Phys. A 34, 8221 (2001).
- [14] J. Engels, S. Holtmann, T. Mendes and T. Schulze, Phys. Lett. B 492, 219 (2000).
- [15] H. T. Ding et al. [HotQCD Collaboration], Phys. Rev. Lett. 123, 062002 (2019).
- [16] H.-T. Ding, P. Hegde, F. Karsch, A. Lahiri, S.-T. Li, S. Mukherjee and P. Petreczky, Nucl. Phys. A 982, 211 (2019).
- [17] F. Karsch and E. Laermann, Phys. Rev. D 50, 6954 (1994).
- [18] J. Engels and F. Karsch, Phys. Rev. D 90, 014501 (2014).
- [19] O. Kaczmarek, F. Karsch, A. Lahiri, L. Mazur and C. Schmidt, [arXiv:2003.07920 [hep-lat]].
- [20] F. Karsch and S. Stickan, Phys. Lett. B 488, 319-325 (2000).
- [21] F. Karsch, E. Laermann and C. Schmidt, Phys. Lett. B 520, 41-49 (2001).