Competition between fractional quantum Hall liquid and Wigner solid at small fillings: Role of layer thickness and Landau level mixing
Abstract
What is the fate of the ground state of a two-dimensional electron system (2DES) at very low Landau level filling factors () where interaction reigns supreme? An ordered array of electrons, the so-called Wigner crystal, has long been believed to be the answer. It was in fact the search for the elusive Wigner crystal that led to the discovery of an unexpected, incompressible liquid state, namely the fractional quantum Hall state at . Understanding the competition between the liquid and solid ground states has since remained an active field of fundamental research. Here we report experimental data for a new two-dimensional system where the electrons are confined to an AlAs quantum well. The exceptionally high quality of the samples and the large electron effective mass allow us to determine the liquid-solid phase diagram for the two-dimensional electrons in a large range of filling factors near and . The data and their comparison with an available theoretical phase diagram reveal the crucial role of Landau level mixing and finite electron layer thickness in determining the prevailing ground states.
The ground states of an interacting, low-disorder two-dimensional electron system (2DES) in a large perpendicular magnetic field () has been of continued interest for decades. This is a regime where the kinetic (Fermi) energy of the electrons is quenched as they all occupy the highly-degenerate, lowest Landau level (LL), and the interaction (Coulomb) energy dominates. As the 2DES enters deep into this extreme quantum limit, the LL filling factor () becomes very small; is the 2DES density. At sufficiently small fillings , the ground state should be a magnetic-field-induced Wigner solid, where the electrons arrange themselves in an ordered (triangular) array to minimize their mutual Coulomb potential energy [1, 2]. Experiments on a relatively low-disorder GaAs 2DES, however, revealed a new phase of matter at , namely the fractional quantum Hall state (FQHS), an incompressible liquid state with a vanishing longitudinal resistance and a quantized Hall resistance [3]. The search for the WS then moved to even lower fillings, and culminated in the observation of insulating phases flanking a well-developed FQHS at in very high-quality 2DESs [4, 5]. The non-linear - characteristics of these insulating phases [5], as well as resonances in their microwave spectrum [6] were interpreted as evidence for the formation of a WS, which is pinned by the ubiquitous disorder that is present in all real samples. This interpretation has been corroborated by numerous theoretical calculations [7, 8, 9, 10], and a variety of experiments [11, 12, 13, 14, 15, 16, 17, 18, 19, 20, 21].
Shortly after the observation of insulating phases near in GaAs 2DESs [4, 5], Santos et al. reported similar insulating phases in a dilute GaAs 2D system (2DHS) but there they flanked the FQHS [22, 23]. Another system, where insulating phases next to the FQHS have been reported, is the ZnO 2DES [21]. These reports provided experimental evidence for the importance of LL mixing (LLM) in favoring the WS states over the FQH liquid states, and moving the stability of the WS to fillings as large as . Note that the 2D holes in GaAs and 2D electrons in ZnO have an effective mass () which is larger than of GaAs 2D electrons by a factor of [24], leading to a larger LLM parameter , defined as the ratio of the Coulomb energy and the LL separation: , where is the magnetic length, and is the dielectric constant. The importance of LLM in the competition between the liquid and solid states at low has indeed been highlighted by a number of theoretical [25, 26, 27, 28, 29, 30, 31, 32] and additional experimental studies [33, 34, 35, 36, 37, 38, 39, 40].
Here we report the observation of FQH and WS phases in 2DESs confined to AlAs quantum wells (QWs). These samples, which have exceptionally high quality, provide an ideal platform to explore the liquid-solid transitions for a large range of and . Electrons in AlAs QWs have larger ( in units of free electron mass) and smaller () compared to GaAs 2DESs ( and ). As a result, the parameter for AlAs 2DESs, for a given density and filling factor, is times larger than in GaAs 2DESs. Furthermore, the LLs are simple and their energies vary linearly with , making the interpretation of straightforward. This is in contrast to the much more complex LLs in the 2DHS which are non-linear and have crossings as a function of [39, 41]. Our data provide a vs. phase diagram for the liquid-solid states in a large range of fillings () and LLM (); note that the typical value for in GaAs 2DESs is . We compare this diagram quantitatively to the theoretically available diagrams near and [31]. The overall agreement is quite good and demonstrates the role of LLM, as well as finite-layer thickness; however, some subtle discrepancies remain. We also report a thermal melting phase diagram, near , for the pinned WS.
We studied 2DESs confined to modulation-doped AlAs QWs grown on GaAs (001) substrates. In the absence of symmetry-breaking, in-plane strain, our samples, which have QW widths (w) ranging from to nm, host electrons occupying two anisotropic in-plane valleys. The valleys have longitudinal and transverse effective masses and , leading to an effective cyclotron mass [42]. In our experiments, thanks to either intentionally applied uniaxial strain, or unintentional residual strain during the cooldown, the electrons occupy only one valley. The samples have 2DES densities () ranging from to , in units of cm-2, which we will use throughout the manuscript. They have a van der Pauw geometry, with alloyed InSn contacts at the corners and edge midpoints. We made measurements primarily in a dilution refrigerator, and used low-frequency ( Hz) lock-in techniques: constant-current mode for magnetoresistance and constant-voltage mode for differential resistance. We provide further details of sample parameters and device fabrication in the Supplemental Materials (SM) [43].
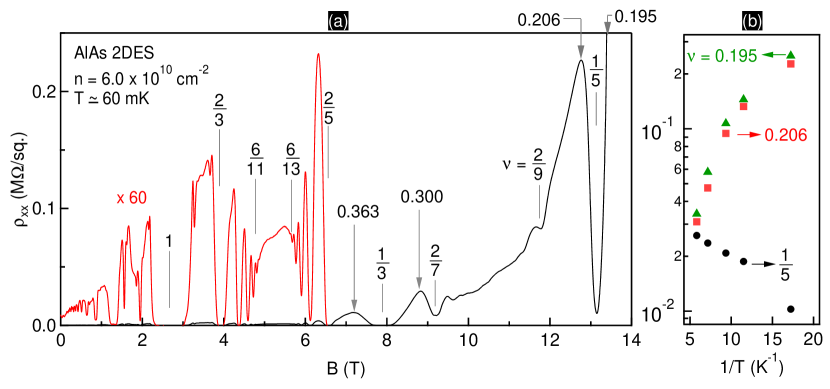
Figure 1(a) shows the longitudinal resistance () vs. at T mK for a sample with n . The expanded red trace shows several FQHSs, manifested by deep minima in the trace. At high magnetic fields, the FQHS exhibits a strong minimum. The numerous FQHSs and especially the state, which has only been observed in the highest quality GaAs 2DESs [4, 5, 44, 15] and more recently in graphene samples [45, 46], attest to the exceptionally high quality of the sample. On the flanks of (e.g., at and ), has very high values. Figure 1(b) shows Arrhenius plots of at and its flanks. At , decreases as we lower the temperature, consistent with the formation of a FQHS. In contrast, on its flanks, increases by about one order of magnitude when we lower the temperature from to mK. Such insulating phases are generally believed to signal a disorder-pinned WS state [4, 5, 47, 23, 22, 48, 49, 33, 50, 21]. Our data and analysis, as we describe below, are consistent with this interpretation. Moreover, they allow us to determine a quantitative quantum melting phase diagram for the magnetic-field-induced WS at low fillings, and compare this diagram to a recently calculated diagram, as reproduced in Fig. 2.
Figure 2 summarizes our experimental results (symbols) in vs. phase diagrams near and . The grey lines and yellow/white regions are from theoretical calculations [31]. The experimental data are shown by symbols. The open, closed, and semi-open symbols represent a liquid, a disorder-pinned WS, and a close competition between liquid-solid, respectively. Data for n are shown in Fig. 2 by red symbols. Around , in Fig. 2(b), there is overall agreement with the theoretical calculations except for . At , as the temperature decreases, increases, yet it remains a local minimum (see Fig. 1(a)). This behavior suggests a competition between the FQH liquid and a disorder-pinned WS. It is likely that disorder is partly responsible for the competition. It is worth remembering that early GaAs 2DESs, which had lower quality, showed a competition between a FQHS and an insulating behavior at [51]. When samples of much better quality became available, at displayed a clear FQHS with a vanishing resistance at the lowest temperatures [4]. Also, previous experimental studies in samples with a controlled (minute) amount of alloy disorder report an insulating behavior at and around [Li.PRL.2010, 53]. Local compressibility measurements in GaAs 2DES showed that disorder creates puddles of slightly different densities, and as a result of [54, 55]. In the theoretical phase diagram reproduced in Fig. 2, at large , variations in would make the WS (yellow region) overcome the FQH liquid (narrow white region), preventing its percolation. For a detailed discussion of the role of disorder in the competition between FQHSs and solids, see Ref. [32].
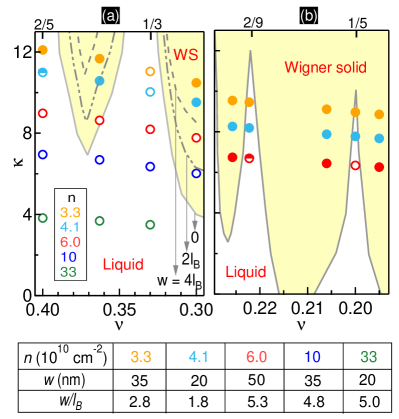
The red symbols in Fig. 2(a) show our experimental results for n near . The trace (see Fig. 1(a)) exhibits fully-developed and FQHSs, which agree with the prediction of liquid phases (open red symbols in Fig. 2(a)). As seen in Fig. 1(a), maxima on the flanks of (at and ) are several times larger than the low-field resistance, but do not show strong insulating behavior. This behavior appears to be at odds with the calculations. However, the calculations that delimit the yellow/white regions in Fig. 2 are for a 2DES with zero thickness, but our 2DES is confined to a finite-width QW. Zhao et al. [31] reported that for a 2DES with finite layer thickness, the WS-liquid boundary moves to larger values of (see SM of Ref. [31]). In Fig. 2(a), we also include the results of finite-thickness calculations from Ref. [31], for w and . As seen in the table shown in the lower part of Fig. 2, our AlAs 2DES with n has w at . Comparing the experimental data with the theoretical w liquid-solid boundary, we find agreement with the liquid states predicted in the calculations.
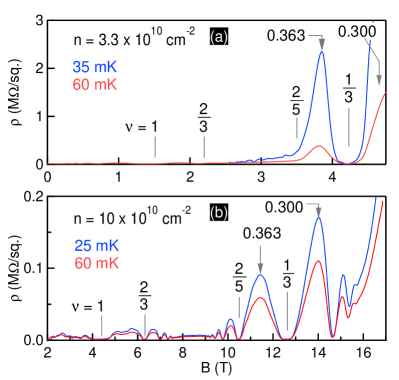
In order to explore larger values of , we studied samples with densities n = and (light-blue and yellow symbols in Fig. 2, respectively). Figure 3(a) shows vs. at T and mK for n ( for n has similar characteristics, see SM). On the flanks of the FQHS, has very large values and exhibits a strong insulating behavior, which we interpret as a signature of a disorder-pinned WS. The samples with n and have w and , respectively. When compared to the solid-liquid calculated boundary with w , we find agreement with the predicted WS on the flanks of . The behavior at is an exception to the agreement: in the experiments we find a WS for , and a competition between a FQHS and a solid for n . For smaller , around in Fig. 2(b), there is a strong insulating phase without any hint of FQHSs. As discussed in the previous paragraph, we invoke the role of disorder to explain the above discrepancies with calculations.
We also studied samples with densities n = and , to explore smaller values of . The data are shown in Fig. 2 by dark-blue and green symbols, respectively. Figure 3(b) shows vs. at T and mK for the sample with n . We find fully-developed FQHSs at and . At and , does not show a strong insulating behavior, suggesting that there is no WS on the flanks of . Considering that the sample with n has w at , the experimental data points agree with the theoretical boundary, once the finite-thickness of the 2DES is taken into account. Note that the filling range near was experimentally out of our reach for n . At n , the experimental data near are in good overall agreement with calculations (the trace is shown in the SM); there is no sign of an insulating phase down to , the smallest we could reach experimentally for this sample in a hybrid magnet.
Two remarks are in order here. First, the WS and FQH states near are very close in energy, and the role of finite-layer-thickness could not be assessed reliably in calculations [31]. Second, as seen in Fig. 2(b), the range of near (as well as near ) where the FQHS is stable, at large , is extremely narrow according to the calculations. This may explain why FQHSs are not experimentally seen for the lower density samples: even a very small level of disorder can cause density inhomogeneity (of the order of 1), which can lead to the disappearance of the FQHS. In this context, our observation of a well-developed FQHS, with a vanishing as the temperature approaches zero, in the sample (Fig. 1) at exceeding 6 (Fig. 2(b)) attests to the exceptionally high quality and homogeneity of the sample.
Another property of interest for the WS is its thermal melting phase diagram [39, 20, 5, 47, 16, 48, 49, 44, 40]. To probe this thermal melting, we monitor the non-linear behavior of the differential resistance () as a function of a DC current () flowing through the 2DES with n = . This technique was used in the past to study the magnetic-field-induced WS in other 2D carrier systems [5, 48, 22, 49, 44]. Measurement details are outlined in the SM [43].
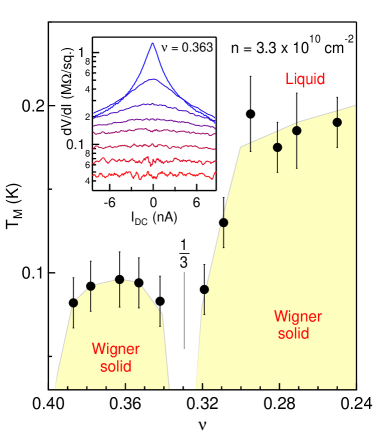
Figure 4 inset shows the temperature dependence of vs. at . At the lowest temperatures, the 2DES shows increased conduction for , signaled by a decrease in , and consistent with a disorder-pinned WS [48, 47, 49, 5, 22, 44]. At the highest temperatures, where we expect the WS to have melted, is independent of , consistent with ohmic conduction observed in liquid phases [48, 47, 49, 5, 22, 22, 38, 21, 44], and in our sample very near the FQHS (data not shown). As we raise the temperature, there is a gradual change from the low-temperature, non-linear behavior to the high-temperature, linear limit. This temperature dependence is qualitatively generic for all the filling factors where we observe a strong insulating behavior in this sample, namely near and for . We deduce the melting temperature () of the WS by estimating the temperature at which changes from non-linear to ohmic; see SM for details.
Figure 4, which contains vs. , displays our deduced WS thermal melting phase diagram of the AlAs 2DES with . As approaches , decreases sharply and vanishes close to the FQHS. When is larger than , we observe a reentrant WS. The values of in our thermal phase diagram are close to those recently reported for the melting temperatures of a WS reentrant around in a GaAs 2D hole system of density [39].
Our experimental data and their quantitative comparison with state-of-the-art calculations provide strong evidence for the validity of associating the insulating phases, observed in ultra-high-quality 2DESs, at low fillings, on the flanks of FQHSs with disorder-pinned WS states. The data also highlight the importance of LLM, as well as the finite-layer-thickness, in the competition between the correlated solid-liquid phases. The role of finite-layer-thickness was not assessed experimentally prior to our study. It is also important to note that the calculations [31] were done for isotropic 2DESs while our data are taken on samples which have an effective mass anisotropy of [42]. The very good agreement between the calculations and the experimental data might thus sound surprising. However, as reported experimentally [56] and theoretically [57, Qiu&Haldane.PRB.2012, 59, 60, 61, 62], it turns that FQHSs are quite robust against anisotropy, and that (anisotropic) WS states only become prevalent in systems with much larger anisotropies than in our samples. Finally, we emphasize that our data described here were taken in AlAs 2DESs with only one conduction-band valley occupied. An exciting future study would be to experimentally and/or theoretically assess the stability of liquid and solid states in AlAs 2DESs where the electrons occupy two degenerate valleys.
Acknowledgements.
We acknowledge support by the DOE BES (Grant No. DE-FG02-00-ER45841) for measurements, and the NSF (Grants No. DMR 1709076, No. ECCS 1906253, and No. MRSEC DMR 1420541), and the Gordon and Betty Moore Foundation’s EPiQS Initiative (Grant No. GBMF9615 to L.N.P.) for sample fabrication and characterization. This research is funded in part by QuantEmX grants from Institute for Complex Adaptative Matter. A portion of this work was performed at the National High Magnetic Field Laboratory, which is supported by National Science Foundation Cooperative Agreement No. DMR-1644779 and the state of Florida. We thank S. Hannahs, T. Murphy, A. Bangura, G. Jones, and E. Green at NHMFL for technical support. We also thank J. K. Jain for illuminating discussions.References
- [1] E. Wigner, On the Interaction of Electrons in Metals, Phys. Rev. 46, 1002 (1934).
- [2] Y. E. Lozovik and V. I. Yudson, Crystallization of a two-dimensional electron gas in a magnetic field, JTEP Lett. 22, 11 (1975).
- [3] D. C. Tsui, H. L. Stormer, and A. C. Gossard, Two Dimensional Magnetotransport in the Extreme Quantum Limit, Phys. Rev. Lett. 48, 1559 (1982).
- [4] H. W. Jiang, R. L. Willett, H. L. Stormer, D. C. Tsui, L. N. Pfeiffer, and K. W. West, Quantum liquid versus electron solid around Landau-level filling, Phys. Rev. Lett. 65, 633 (1990).
- [5] V. J. Goldman, M. Santos, M. Shayegan, and J. E. Cunningham, Evidence for two-dimensional quantum Wigner crystal, Phys. Rev. Lett. 65, 2189 (1990).
- [6] E. Y. Andrei, G. Deville, D. C. Glattli, F. I. B. Williams, E. Paris, and B. Etienne, Observation of a Magnetically Induced Wigner Solid, Phys. Rev. Lett. 60, 2765 (1988).
- [7] P. K. Lam and S. M. Girvin, Liquid-solid transition and the fractional quantum-Hall effect, Phys. Rev. B 30, 473 (1984).
- [8] D. Levesque, J. J. Weis, and A. H. MacDonald, Crystallization of the incompressible quantum-fluid state of a two-dimensional electron gas in a strong magnetic field, Phys. Rev. B 30, 1056 (1984).
- [9] H. A. Fertig, Properties of the Electron Solid, in Perspectives in Quantum Hall Effects, edited by S. Das Sarma and A. Pinczuk (Wiley, New York, 1996), pp. 71-108.
- [10] A. C. Archer, K. Park, and J. K. Jain, Competing Crystal Phases in the Lowest Landau Level, Phys. Rev. Lett. 111, 146804 (2013).
- [11] Y. P. Li, T. Sajoto, L. W. Engel, D. C. Tsui, and M. Shayegan, Low-frequency noise in the reentrant insulating phase around the 1/5 fractional quantum Hall liquid, Phys. Rev. Lett. 67, 1630 (1991).
- [12] E. M. Goldys, S. A. Brown, R. B. Dunford, A. G. Davies, R. Newbury, R. G. Clark, P. E. Simmonds, J. J. Harris, and C. T. Foxon, Magneto-optical probe of two-dimensional electron liquid and solid phases, Phys. Rev. B 46, 7957 (1992).
- [13] I. V. Kukushkin, N. J. Pulsford, v. K. Klitzing, R. J. Haug, K. Ploog, and V. B. Timofeev, Wigner Solid vs. Incompressible Laughlin Liquid: Phase Diagram Derived from Time-Resolved Photoluminescence, Europhysics Letters (EPL) 23, 211 (1993).
- [14] P. D. Ye, L. W. Engel, D. C. Tsui, R. M. Lewis, L. N. Pfeiffer, and K. West, Correlation Lengths of the Wigner Crystal Order in a Two-Dimensional Electron System at High Magnetic Fields, Phys. Rev. Lett. 89, 176802 (2002).
- [15] W. Pan, H. L. Stormer, D. C. Tsui, L. N. Pfeiffer, K. W. Baldwin, and K. W. West, Transition from an Electron Solid to the Sequence of Fractional Quantum Hall States at Very Low Landau Level Filling Factor, Phys. Rev. Lett. 88, 176802 (2002).
- [16] Y. P. Chen, G. Sambandamurthy, Z. H. Wang, R. M. Lewis, L. W. Engel, D. C. Tsui, P. D. Ye, L. N. Pfeiffer, and K. W. West, Melting of a 2D quantum electron solid in high magnetic field, Nat. Phys. 2, 452 (2006).
- [17] L. Tiemann, T. D. Rhone, N. Shibata, and K. Muraki, NMR profiling of quantum electron solids in high magnetic fields, Nat. Phys. 10, 648 (2014).
- [18] H. Deng, Y. Liu, I. Jo, L. N. Pfeiffer, K. W. West, K. W. Baldwin, and M. Shayegan, Commensurability Oscillations of Composite Fermions Induced by the Periodic Potential of a Wigner Crystal, Phys. Rev. Lett. 117, 096601 (2016).
- [19] J. Jang, B. M. Hunt, L. N. Pfeiffer, K. W. West, and R. C. Ashoori, Sharp tunnelling resonance from the vibrations of an electronic Wigner crystal, Nat. Phys. 13, 340 (2017).
- [20] H. Deng, L. N. Pfeiffer, K. W. West, K. W. Baldwin, L. W. Engel, and M. Shayegan, Probing the Melting of a Two-Dimensional Quantum Wigner Crystal via its Screening Efficiency, Phys. Rev. Lett. 122, 116601 (2019).
- [21] D. Maryenko, A. McCollam, J. Falson, Y. Kozuka, J. Bruin, U. Zeitler, and M. Kawasaki, Composite fermion liquid to Wigner solid transition in the lowest Landau level of zinc oxide, Nat. Commun. 9, 4356 (2018).
- [22] M. B. Santos, Y. W. Suen, M. Shayegan, Y. P. Li, L. W. Engel, and D. C. Tsui, Observation of a reentrant insulating phase near the 1/3 fractional quantum Hall liquid in a two-dimensional hole system, Phys. Rev. Lett. 68, 1188 (1992).
- [23] M. B. Santos, J. Jo, Y. W. Suen, L. W. Engel, and M. Shayegan, Effect of Landau-level mixing on quantum liquid and solid states of two-dimensional hole systems, Phys. Rev. B 46, 13639 (1992).
- [24] A. Tsukazaki, A. Ohtomo, M. Kawasaki, S. Akasaka, H. Yuji, K. Tamura, K. Nakahara, T. Tanabe, A. Kamisawa, T. Gokmen, J. Shabani, and M. Shayegan, Spin susceptibility and effective mass of two-dimensional electrons in MgxZn1-xO/ZnO heterostructures, Phys. Rev. B 78, 233308 (2008).
- [25] D. Yoshioka, Effect of the Landau Level Mixing on the Ground State of Two-Dimensional Electrons, J. Phys. Soc. Jpn. 53, 3740 (1984).
- [26] D. Yoshioka, Excitation Energies of the Fractional Quantum Hall Effect, J. Phys. Soc. Jpn. 55, 885 (1986).
- [27] X. Zhu and S. G. Louie, Wigner crystallization in the fractional quantum Hall regime: A variational quantum Monte Carlo study, Phys. Rev. Lett. 70, 335 (1993).
- [28] R. Price, P. M. Platzman, and S. He, Fractional quantum Hall liquid, Wigner solid phase boundary at finite density and magnetic field, Phys. Rev. Lett. 70, 339 (1993).
- [29] P. M. Platzman and R. Price, Quantum freezing of the fractional quantum Hall liquid, Phys. Rev. Lett. 70, 3487 (1993).
- [30] G. Ortiz, D. M. Ceperley, and R. M. Martin, New stochastic method for systems with broken time-reversal symmetry: 2D fermions in a magnetic field, Phys. Rev. Lett. 71, 2777 (1993).
- [31] J. Zhao, Y. Zhang, and J. K. Jain, Crystallization in the Fractional Quantum Hall Regime Induced by Landau Level Mixing, Phys. Rev. Lett. 121, 116802 (2018).
- [32] Z. W. Zuo, A. C. Balram, S. Pu, J. Zhao, T. Jolicoeur, A. Wojs, and J. K. Jain, Interplay between fractional quantum Hall liquid and crystal phases at low filling, Phys. Rev. B 102, 075307 (2020).
- [33] C.-C. Li, L. W. Engel, D. Shahar, D. C. Tsui, and M. Shayegan, Microwave Conductivity Resonance of Two-Dimensional Hole System, Phys. Rev. Lett. 79, 1353 (1997).
- [34] C.-C. Li, J. Yoon, L. W. Engel, D. Shahar, D. C. Tsui, and M. Shayegan, Microwave resonance and weak pinning in two-dimensional hole systems at high magnetic fields, Phys. Rev. B 61, 10905 (2000).
- [35] G. A. Csathy, D. C. Tsui, L. N. Pfeiffer, and K. W. West, Possible observation of phase coexistence of the fractional quantum Hall liquid and a solid, Phys. Rev. Lett. 92, 256804 (2004).
- [36] G. A. Csathy, H. Noh, D. C. Tsui, L. N. Pfeiffer, and K. W. West, Magnetic-field-induced insulating phases at large , Phys. Rev. Lett. 94, 226802 (2005).
- [37] W. Pan, G. A. Csathy, D. C. Tsui, L. N. Pfeiffer, and K. W. West, Transition from a fractional quantum Hall liquid to an electron solid at Landau level filling in tilted magnetic fields, Phys. Rev. B 71, 035302 (2005).
- [38] T. Knighton, Z. Wu, J. Huang, A. Serafin, J. S. Xia, L. N. Pfeiffer, and K. W. West, Evidence of two-stage melting of Wigner solids, Phys. Rev. B 97, 085135 (2018).
- [39] M. K. Ma, K. Villegas Rosales, H. Deng, Y. Chung, L. Pfeiffer, K. West, K. Baldwin, R. Winkler, and M. Shayegan, Thermal and Quantum Melting Phase Diagrams for a Magnetic-Field-Induced Wigner Solid, Phys. Rev. Lett. 125, 036601 (2020).
- [40] V. Bayot, X. Ying, M. B. Santos, and M. Shayegan, Thermopower in the Re-entrant Insulating Phase of a Two-Dimensional Hole System, Europhysics Letters (EPL) 25, 613 (1994).
- [41] R. Winkler, Spin–Orbit Coupling Effects in TwoDimensional Electron and Hole Systems, Springer Tracts in Modern Physics Vol. 191 (Springer-Verlag, Berlin, 2003).
- [42] M. Shayegan, E. P. D. Poortere, O. Gunawan, Y. P. Shkolnikov, E. Tutuc, and K. Vakili, Two-dimensional electrons occupying multiple valleys in AlAs, physica status solidi (b) 243, 3629 (2006).
- [43] See Supplemental Material for experimental details, and additional data.
- [44] M. Shayegan, Case for the Magnetic-Field-Induced Two-Dimensional Wigner Crystal, in Perspectives in Quantum Hall Effects, edited by S. Das Sarma and A. Pinczuk (Wiley, New York, 1996), pp. 343-384.
- [45] Y. Zeng, J. Li, S. Dietrich, O. Ghosh, K. Watanabe, T. Taniguchi, J. Hone, and C. Dean, High-Quality Magnetotransport in Graphene Using the Edge-Free Corbino Geometry, Phys. Rev. Lett. 122, 137701 (2019).
- [46] H. Zhou, H. Polshyn, T. Taniguchi, K. Watanabe, and A. F. Young, Solids of quantum Hall skyrmions in graphene, Nature Physics 16, 154 (2020).
- [47] H. W. Jiang, H. L. Stormer, D. C. Tsui, L. N. Pfeiffer, and K. W. West, Magnetotransport studies of the insulating phase around Landau-level filling, Phys. Rev. B 44, 8107 (1991).
- [48] F. I. B. Williams, P. A. Wright, R. G. Clark, E. Y. Andrei, G. Deville, D. C. Glattli, O. Probst, B. Etienne, C. Dorin, C. T. Foxon, and J. J. Harris, Conduction threshold and pinning frequency of magnetically induced Wigner solid, Phys. Rev. Lett. 66, 3285 (1991).
- [49] T. Sajoto, Charge transport in the fractional quantum Hall liquid to Wigner solid transition regime, PhD Thesis, Princeton University (1993).
- [50] M. A. Paalanen, R. L. Willett, R. R. Ruel, P. B. Littlewood, K. W. West, and L. N. Pfeiffer, Electrical conductivity and Wigner crystallization, Phys. Rev. B 45, 13784 (1992).
- [51] R. L. Willett, H. L. Stormer, D. C. Tsui, L. N. Pfeiffer, K. W. West, and K. W. Baldwin, Termination of the series of fractional quantum Hall states at small filling factors, Phys. Rev. B 38, 7881 (1988).
- [52] W. Li, D. R. Luhman, D. C. Tsui, L. N. Pfeiffer, and K. W. West, Observation of reentrant phases induced by short-range disorder in the lowest Landau level of AlxGaAs/Al0.32Ga0.68As heterostructures, Phys. Rev. Lett. 105, 076803 (2010).
- [53] B.-H. Moon, L. W. Engel, D. C. Tsui, L. N. Pfeiffer, and K. W. West, Pinning modes of high-magnetic-field Wigner solids with controlled alloy disorder, Phys. Rev. B 89, 075310 (2014).
- [54] S. Ilani, J. Martin, E. Teitelbaum, J. H. Smet, D. Mahalu, V. Umansky, and A. Yacoby, The microscopic nature of localization in the quantum Hall effect, Nature 427, 328 (2004).
- [55] V. Venkatachalam, A. Yacoby, L. Pfeiffer, and K. West, Local charge of the fractional quantum Hall state, Nature 469, 185 (2011).
- [56] I. Jo, K. A. Villegas Rosales, M. Mueed, L. Pfeiffer, K. West, K. Baldwin, R. Winkler, M. Padmanabhan, and M. Shayegan, Transference of Fermi Contour Anisotropy to Composite Fermions, Phys. Rev. Lett. 119, 016402 (2017).
- [57] H. Wang, R. Narayanan, X. Wan, and F. Zhang, Fractional quantum Hall states in two-dimensional electron systems with anisotropic interactions, Phys. Rev. B 86, 035122 (2012).
- [58] R.-Z. Qiu, F. D. M. Haldane, X. Wan, K. Yang, and S. Yi, Model anisotropic quantum Hall states, Phys. Rev. B 85, 115308 (2012).
- [59] B. Yang, Z. Papic, E. H. Rezayi, R. N. Bhatt, and F. D. M. Haldane, Band mass anisotropy and the intrinsic metric of fractional quantum Hall systems, Phys. Rev. B 85, 165318 (2012).
- [60] K. Yang, Geometry of compressible and incompressible quantum Hall states: Application to anisotropic composite-fermion liquids, Phys. Rev. B 88, 241105 (2013).
- [61] S. Johri, Z. Papic, P. Schmitteckert, R. N. Bhatt, and F. D. M. Haldane, Probing the geometry of the Laughlin state, New J. Phys. 18, 025011 (2016).
- [62] A. C. Balram and J. K. Jain, Exact results for model wave functions of anisotropic composite fermions in the fractional quantum Hall effect, Phys. Rev. B 93, 075121 (2016).