Measuring the Mass of Missing Baryons in the Halo of Andromeda Galaxy with Gamma-Ray Observations
Abstract
It has been suggested that a huge amount of baryons resides in the circumgalactic medium (CGM) extending out to the virial radii of galaxies. In this work we attempt to measure the baryon mass in CGM with a novel method based on the gamma-ray observations of the extended halo of the Andromeda Galaxy Messier 31 (M31). Since cosmic-ray particles generated inside the galaxy will eventually escape to the CGM, they will produce gamma-ray emission via the proton-proton collision with CGM and produce gamma rays. Different from some traditional measurements which are sensitive only to certain metallic ions in specific temperature range, the hadronic gamma-ray flux is sensitive to baryonic gases in all phases and does not rely on the metallicity in the halo, hence the measured gamma-ray flux from the galaxy’s halo can be used to constrain the mass of CGM. By dealing with the cosmic-ray transport in the halo and calculating the hadronic gamma-ray intensity, we find that the total baryon mass contained within the virial radius is less than according to the gamma-ray intensity obtained with a model-dependent analysis. It implies that the CGM of Andromeda Galaxy may not account for more than 30% of the missing baryons, but the result is subject to uncertainties from the gamma-ray intensity upper limit, diffusion coefficient of the CRs in the halo as well as the stellar mass and dark matter halo mass of the galaxy. This method will become more constraining provided better understandings on these issues and more sensitive gamma-ray telescopes in the future.
1 Introduction
While baryons are measured to account for 16% of the total mass of the universe according to the observations of the cosmic microwave background Planck Collaboration et al. (2018), more than half of this ordinary matter that makes up almost everything familiar to us is yet to be localised (Persic & Salucci, 1992; Fukugita et al., 1998). Decades of efforts have been dedicated to the hunt for missing baryons, and various studies have pointed to the existence of a gaseous halo extending out to at least 50 kpc around Milky Way and external galaxies with stellar luminosity similar to that of Milky Way, containing a total gas mass of a few times within 50 kpc (Anderson & Bregman, 2010; Dai et al., 2012; Fang et al., 2013; Miller & Bregman, 2013, 2015; Li et al., 2017). The gas density of the CGM as a function of galactocentric radius could be depicted by the so-called model(Cavaliere & Fusco-Femiano, 1976, or a modified model, see Bogdán et al. 2013), i.e., where is a normalization factor, is the core radius with the typical value kpc, and determines the slope of the distribution. The value of within kpc is found to be around 0.5 in many Milky Way-like galaxies (Li et al., 2018; Bregman et al., 2018). The total CGM mass within the virial radius is mainly determined by the gas distribution at larger radius. If the slope for gas distribution within kpc holds out to a much larger radius (Li et al., 2018) or even the virial radius, the CGM mass in the halo would be significantly less than that needed to account for the missing baryons (Miller & Bregman, 2015; Bregman et al., 2018). On the other hand, if a flattening is present in the density distribution at comparatively small radius with, e.g., , the entire halo could contain all the missing baryon(Gupta et al., 2012; Faerman et al., 2017; Das et al., 2019). Therefore, the key to evaluate the total missing baryon in CGM is to determine the density distribution slope beyond 50 kpc.
The halo of our Milky Way Galaxy has the most abundant observational data among all the galaxies and it has been extensively studied by various groups. However, the observable signals from different galactocentric radius of the halo all add up together along our line of sights, making it difficult to reveal its true gas distribution. The Andromeda Galaxy, the nearest sibling of our Milky Way Galaxy, is probably the best target to study this issue. Unlike the halo of our Galaxy, we can observe Andromeda’s halo from the side view and hence are, in principle, able to measure the baryon density as a function of the galactocentric radius. Moreover, Andromeda’s halo is more detectable than other Milky Way-like external galaxies due to its proximity, provided that their intrinsic emissivities are similar. Indeed, evidence of a massive gaseous halo around Andromeda has already been discovered (Grcevich & Putman, 2009; Lehner et al., 2015, 2020). The project Absorption Maps In the Gas of Andromeda (AMIGA) researches the physical conditions and metals in the CGM of M31 through the measurements of ultraviolet absorption along 43 QSO sightlines. The inferred baryon mass in cold and warm gas is about within the virial radius assuming a 0.3 solar metallicity for the CGM (Lehner et al., 2020). Lehner et al. (2020) also reported that the column densities of ions which indicate warm gases show a comparatively shallower decrease as the function of the projected distance to the galaxy beyond kpc than those at small distance. Nevertheless, many traditional methods of probing CGM such as those with UV/X-ray emission lines or absorption lines do not work well beyond 50 kpc because of the weak emission of the tenuous gas and the high Galactic foreground noise, as well as the large uncertainty from the metallicity of the CGM.
The Andromeda Galaxy has been detected in GeV gamma-rays by the Fermi Large Area Telescope (LAT) (Ackermann et al., 2017; Abdo et al., 2010). The gamma-ray signal may originate from multiple possible processes. In addition to the dark matter annihilation and unresolved population of millisecond pulsars (Pshirkov et al., 2016; Ackermann et al., 2017; Eckner et al., 2018; McDaniel et al., 2018; Fragione et al., 2019; McDaniel et al., 2019), part of the gamma-ray emission may arise from the proton-proton collisions between cosmic-ray (CR) protons accelerated in the galaxy and the interstellar medium. Referring to the situation in our Galaxy, CRs typically leave the galaxy quickly on a timescale of Myr, losing only a minor fraction of their energies, and diffuse into the extended halo of the galaxy. Those wandering CRs will inevitably interact with CGM and produce gamma-ray emission via the proton–proton collision (Feldmann et al., 2013; Taylor et al., 2014; Kalashev & Troitsky, 2016; Liu et al., 2019; Biswas & Gupta, 2019; Jana et al., 2020), same as that responsible for gamma rays from the galactic plane of our Galaxy. Feldmann et al. (2013) pointed out that the gamma-ray flux generated via this process in the halo of our Galaxy is approximately proportional to the amount of the gas residing in the halo and contributes to the isotropic gamma-ray background. Therefore, the gamma-ray signal from the halo contains the information of the total mass of the baryonic matter therein. Liu et al. (2019) found that the measurement of the isotropic gamma-ray background may constrain the baryon mass within the virial radius of our Galaxy to be lower than in the fiducial model. Here we extend this method to the extended halo of the Andromeda Galaxy by considering the CR diffusion and the hadronic emission in the CGM, with the advanced gamma-ray analysis managing to identify the emission of the galaxy’s halo from the foreground/background, as introduced below.
The diffuse gamma-ray emission was detected recently extending out to 200 kpc from the Andromeda galaxy (Karwin et al., 2019). The intensity for GeV gamma-rays is at the level of , while no significant emission is detected above 10 GeV, which poses a quite constraining upper limit of 68% confidence level (C.L.) at GeV assuming the spectrum to be a power-law function with exponential cutoff (PLEXP). Besides, a model-independent upper limit is given to be at GeV by freeing the spectral index in each energy bin in the analysis. In addition to CR interactions, other sources, such as termination shocks of a galactic wind (Zirakashvili & Völk, 2006) and dark matter annihilation (Karwin et al., 2020), could also contribute to the diffuse gamma-ray emission of the halo, and thus the measured gamma-ray flux or upper limit should be regarded as a conservative upper bound for CR-generated gamma-ray emission. This would enable us to constrain the gas distribution beyond 50 kpc by comparing the measured intensity to the predicted gamma-ray intensity from the collision under different assumptions of the slope (i.e., ), and test whether a flattening of the gas distribution is allowed by the gamma-ray data.
The rest of the paper is organized as follows: in Section 2, we model the CR distribution in the halo of M31 and the gamma-ray production via the collision. We compare the predicted gamma-ray intensity with the measured one and derive the constraints on the gas distribution beyond 50 kpc. We discuss the result obtained in this work in Section 3 and summarize the paper in Section 4.
2 Cosmic-Ray distribution in the halo of M31 and the pionic gamma-ray flux
The transport equation of CRs injected from a single point source is (Berezinsky & Gazizov, 2006)
| (1) |
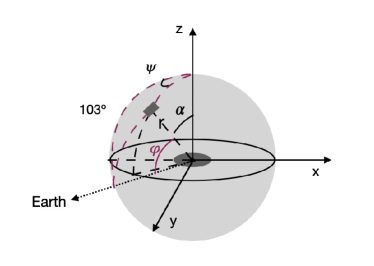
where is the differential density of CRs at time and position . We use a spherical coordinate system with the original point at the center of M31 and the -axis being the normal of the disk (see Fig.1). The first term on the r.h.s of the equation describes the diffusion of CRs caused by magnetic field turbulence with the diffusion coefficient . The most constraining gamma-ray data is at 35 GeV, so the most relevant proton energy is at 350 GeV since the energy of gamma-ray photon generated by the collision generally carries 10% of the parent proton’s energy. We thus denote the diffusion coefficient at 350 GeV by and assume the form of the diffusion coefficient to be . It should be noted that the index of is not necessary to be or Kolmogorov-like (Yan & Lazarian, 2002), but it would not influence our result significantly because the diffusion coefficient at 350 GeV is mainly dependent on the value of . The value of depends on the property (such as strength) of the turbulence. It is important for the CR spatial distribution in the halo and will be discussed in the later section.
The second term describes the advection of CRs caused by large-scale galactic wind with a speed . Currently there is no evidence for a large-scale galactic wind in the halo of M31. Note that Pshirkov et al. (2016) found indication of bubble-like gamma-ray structure located perpendicular to the M31 disc with height kpc, resembling the “Fermi bubble” (Su et al., 2010; Ackermann et al., 2014). This kind of bubbles might represent an outflow driven by the past activity of the supermassive black hole in the center of the galaxy. While the outflow could advect CRs to larger radius, it is limited in the inner halo and hence we here simply assume in the later calculation. The third term represents the energy loss of CRs due to the collisions in CGM, which is given by (Liu et al., 2019).
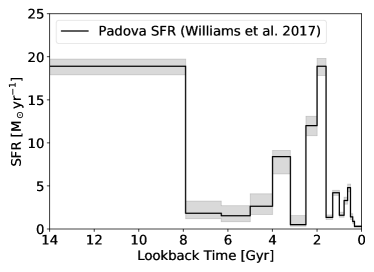
The last term in the r.h.s. describes the injection of CRs from a point source located at . can be decoupled into a term related to the CR injection history and a term describing the CR injection spectrum , i.e., . By doing so, we implicitly assume that the shape of the injection spectrum does not evolve with time. The CR injection rate is generally proportional to the star formation rate (Kennicutt, 1998). We here employ the star formation history of M31 derived by Williams et al. (2017), where four sets of the stellar evolution model are considered backtracking the star formation history of M31 to 14 Gyr ago. All the models show a common feature that most of the star formation occurred prior to Gyr ago. Here we refer to the Padova model, as is shown in Fig.2, and normalize the star-formation history with the present-day star formation rate () so that we have .
Following Liu et al. (2019), we approximate the galactic plane as a disk of negligible thickness (i.e., ) and CRs are uniformly injected from the disk. The injection spectrum is assumed to be in the form of a power-law function, i.e., , where is the normalization factor and is the injection spectral index of CRs. Given the present CR luminosity in M31 , we have with the radius kpc being the radius of galaxy disk of M31. can be normalized to the CR luminosity of our Galaxy by . The measured gamma-ray spectral index of M31 galaxy is (Abdo et al., 2010). We assume that the collision dominates the gamma-ray emission at several tens GeV and the measured gamma-ray spectral slope represents the spectral index of the steady-state CR spectrum in the galaxy, since the gamma-ray spectrum from collision generally follows the spectrum of the parent protons in the GeV energy range. Note that the energy-dependent escape of CRs from the galaxy leads to a softening in the steady-state spectrum with respect to the injection spectrum, with the spectral index being modified to where is the slope of the diffusion coefficient. In our Galaxy, is inferred from the measurement of the primary-to-secondary CR ratio (Aguilar et al., 2016). If the ISM in M31 has the similar property to that of our Galaxy, we may infer for the CR injection spectrum in M31, which is also consistent with the prediction of the canonical diffusive shock acceleration theory (Bell, 1978; Blandford & Eichler, 1987). In the following calculation, we consider in the range of .
An analytical formulae for the distribution of CR injected from a point source at can be given by (Berezinsky & Gazizov, 2006)
| (2) |
where implies the diffusion distance of a proton, is the energy of a proton at time and this proton has energy at present. We assume the CR sources homogeneously distributed throughout the disk and integrate over the contribution of each point sources in the disk to obtain the present-time () CR density at by
| (3) |
After obtaining CR distribution, the gamma-ray emissivity can be calculated by (Kelner et al., 2006),
| (4) |
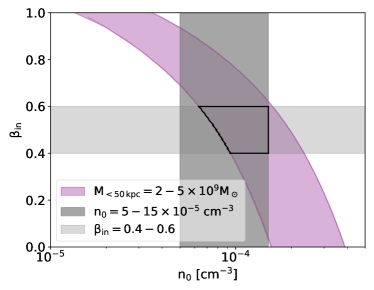
where is the spectrum of the secondary gamma-ray in a single collision, is the gas density distribution in the halo. The gas density distribution within 50 kpc is more or less known according to previous studies. The gas density of the halos of our Galaxy and Andromeda at a galactocentric radius kpc is measured to be through modelling the ram-pressure on the clouds and satellite galaxies (Salem et al., 2015; Grcevich & Putman, 2009). We consider and as the benchmark parameters. To include the uncertainties of parameters, we vary in the range of and in the range . Additionally, following Anderson et al. (2013); Bregman et al. (2018) and etc, we limit the total CGM mass within 50 kpc in the range of by choosing appropriate combinations of and the normalisation density (see Fig. 3). On the other hand, for the gas distribution beyond 50 kpc, a possible flattening or steepening in the distribution is taken into account. In other words, for , we have the gas density distribution
| (5) |
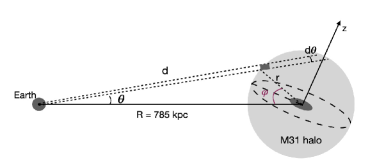
M31 is approximately 785 kpc away from Earth and the observation of its gamma-ray halo radius extends out to 200 kpc from the galactic center. Denoting the coordinate of Earth by , the distance between Earth and certain point in the halo can vary markedly from place to place. We therefore need to consider the geometry of the system to calculate the distance and the gamma-ray flux received at Earth. As shown in the top panel of Fig. 1, for certain point (marked as the gray rectangular) in the halo, we set its coordinate as . Utilizing the spherical triangle highlighted with purple dashed curve, we find out the open angle between Earth and the point as , and obtain by . Now we can calculate the average gamma-ray flux intensity within an angular radius with respect to the center of M31 viewed from Earth in the celestial plane by
| (6) |
with . The integration variables range in , and with the restriction , where (see the lower panel of Fig. 1). To average over the radiation within 100 kpc around M31, for instance, we have . The lower limit for corresponds to a projected size of 5.5 kpc at a nominal distance of kpc, which is the radial extension of M31 viewed by Fermi-LAT (Ackermann et al., 2017). In the analysis of the halo’s diffuse gamma-ray emission by Karwin et al. (2019), they remove the emission within (i.e., the emission of the galaxy itself) so we also exclude it from our calculation as well.
3 Constraint on the baryon mass in the halo of M31
Karwin et al. (2019) have obtained the average gamma-ray intensity of two annulus regions of and with respect to M31 center, corresponding to, namely, the spherical halo of radius kpc and the far outer halo of radius kpc respectively. The observed intensities of the two regions above 10 GeV are comparable. However, considering that the CR density and the baryon gas density are lower at larger radius, the expected pionic gamma-ray emissivity in the spherical halo is larger than that in the far outer halo. Therefore, the gamma-ray intensity of the spherical halo is more restrictive and we will perform our analysis based on it. We consider the model-dependent gamma-ray intensity and the model-independent gamma-ray intensity of the spherical halo obtained by Karwin et al. (2019) respectively. As mentioned in Section 1, the model-dependent analysis gives a constraining gamma-ray intensity upper limit at 35 GeV, while the model-independent gamma-ray intensity at the same energy is more conservative. Note that although the projected size of the spherical halo is 120 kpc, the measured gamma-ray intensity also contains the information of the gas density beyond 120 kpc because the measured gamma-ray emission results from the superposition of all the emission in the line of sight passing through the entire halo (see Fig. 1).
Bearing in mind that the theoretical gamma-ray intensity should not exceed the measured one, we adjust the value of to search the flattest gas density distribution from 50 kpc to 250 kpc allowed by the gamma-ray data. To do this, we scan the entire parameter space of , and for a given diffusion coefficient. Note that the gamma-ray emissivity is dependent not only on the gas density but also on the CR density. As mentioned earlier, the value of the diffusion coefficient at 350 GeV (i.e., ) is crucial to the latter. The standard nonlinear theory for CR diffusion (Yan & Lazarian, 2008) predicts a diffusion coefficient of at several hundreds GeV for the inner halo (kpc) of our Galaxy, which is comparable to that in the Galactic disk (e.g. Ptuskin, 2006; Strong et al., 2010; Genolini et al., 2015; Huang et al., 2020). The diffusion coefficient in the outer halo (kpc) is probably different given different environmental conditions such as the plasma density and the magnetic field strength. From an energetic point of view, the turbulence in the halo might be advected from the galactic disk, or might be driven locally by the differential rotation of the CGM of M31 as observed by XMM-Newton (Hodges-Kluck et al., 2016) and Planck (Tahir et al., 2019), or the proper motion of satellite galaxies in the halo of the galaxy with a velocity of a few (van der Marel et al., 2019; Grcevich & Putman, 2009; Watkins et al., 2010). A further investigation on the property of the turbulence in M31’s halo is beyond the scope of this work, but we note that in some previous literature, the authors generally considered a roughly times larger diffusion coefficient for the halo than that of the Galactic disk (Feldmann et al., 2013; Kalashev & Troitsky, 2016; Liu et al., 2019). We follow this treatment and consider ranging from up to and caveat that a larger might be also possible if the turbulence in the halo is very weak and it would relax the obtained constraint. In a recent study, the Feedback In Realistic Environments (FIRE) simulation of CR transport in galaxy ISM and CGM shows that for the constant-diffusivity model, the observational constraints of our Galaxy and nearby starburst galaxies could be consistent with a diffusion coefficient for 1 GeV CRs (Chan et al., 2019; Hopkins et al., 2021). Extrapolating the diffusion coefficient to 350 GeV with , one may get a diffusion coefficient at 350 GeV. On the other hand, Yan & Lazarian (2008) considered dominance of the magnetohydrodynamic fast modes in the inner halo of our Galaxy and found an almost energy-independent in 1 GeV–1 TeV, resulting in if we extrapolate to 350 GeV accordingly. Both of the extrapolated diffusion coefficient are covered by the chosen range for here.
| () | |||||
|---|---|---|---|---|---|
| () | () | ||||
| Case | 2 | ||||
| 1 | 2 | 0.6 | |||
| 0.8 | 0.27 | ||||
| 1.7 | |||||
| Case | 1.7 | 0.53 | |||
| 2 | 0.83 | 0.27 | |||
| 0.53 | 0.13 | ||||
Note. — The second column is the employed diffusion coefficient for 350 GeV CR protons. The third and fourth column show the largest values of for the gas density profile outside 50 kpc and the corresponding baryon mass within 250 kpc allowed by gamma-ray observation under different diffusion coefficients with the assumption of . The fifth and sixth column are the same but with the assumption of .
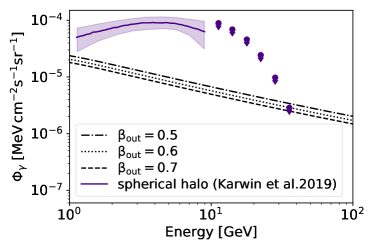
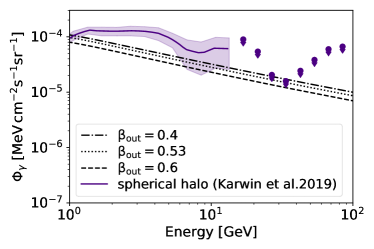
The critical value of is obtained when the theoretical gamma-ray intensity touches the lowest data point (i.e., the data point at GeV) in the plot. The obtained corresponds to the maximum allowable baryon mass in the halo for each considered. In Fig. 4, we show an example that how the predicted gamma-ray intensity changes with the value of . We note that the gamma-ray intensity at GeV may be more constraining especially for a soft injection spectrum. However, the streaming instability might operate for low energy CRs, the density of which is comparatively high (Skilling, 1971; Yan & Lazarian, 2002; Farmer & Goldreich, 2004). As a result, these low-energy CRs could be scattered by a self-generated waves with reduction of the diffusion coefficient but on the other hand suffering from adiabatic cooling (Pakmor et al., 2016). Therefore, the resulting gamma-ray intensity at 1 GeV may be subject to large uncertainty and hence we do not use it.
We first take the gamma-ray intensity upper limit of the PLEXP model at GeV to constrain the baryon mass (which is referred to as Case 1). As listed in Table 1, for smaller than , the gamma-ray intensity generated within 50 kpc already exceeds the data point. This result may imply that the CR diffusion in the halo cannot be too slow and in turn put a constraint on the diffusion coefficient (and consequently the properties of the turbulence) in the halo. A flattening of the density profile beyond 50 kpc would be allowed only if a large diffusion coefficient for the halo is employed. By translating the value of to the mass of CGM, we find that the baryon mass of CGM, as presented in Table 1 and the top panel of Fig. 5, cannot exceed baryons even with a quite large diffusion coefficient .
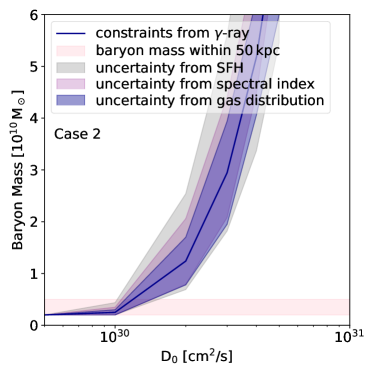
We also repeat the above process with the model-independent upper limit of the gamma-ray intensity at GeV (which is referred to as Case 2). The obtained results are shown in Table 1 and the bottom panel of Fig. 5. Due to the upper limit of gamma-ray intensity used in Case 2 is five times higher than that in Case 1, the constraint on the baryon mass of CGM obtained in Case 2 is more relaxed. The constrained baryon mass would exceed if , and then increase very rapidly with increasing .
The baryon fraction depends on the total mass of the dark matter halo and the total stellar mass. The total mass of the dark matter halo has been estimated by various groups with different methods and the results are subject to variation of a factor of a few. Generally, the total mass of M31’s dark matter halo is likely in the range of (e.g. Li & White, 2008; Watkins et al., 2010; Corbelli et al., 2010; van der Marel et al., 2012; Tamm et al., 2012; Fardal et al., 2013; Phelps et al., 2013; Diaz et al., 2014; Veljanoski et al., 2014; Sofue, 2015; Carlesi et al., 2017; Patel et al., 2017; Kafle et al., 2018; Garrison-Kimmel et al., 2019; Libeskind et al., 2020; Lemos et al., 2020), while the total stellar mass in Andromeda is about (Tamm et al., 2012; Williams et al., 2017). If we take the median value of all the quantities, we will arrive at that the CGM can only explain no more than 30% of the missing baryon for in Case 1 and no more than for in Case 2. The result of Case 1 is consistent with the studies on the baryon fraction in Milky Way’s halo by various authors(Miller & Bregman, 2015; Salem et al., 2015; Li et al., 2017). If this conclusion can be generalized to other galaxies, it implies that a considerable fraction of the missing baryons probably resides somewhere beyond the virial radius of galaxies, such as in the filaments of the cosmic web (Eckert et al., 2015; de Graaff et al., 2019) or in the intracluster medium of galaxy groups (Lim et al., 2020). However, due to the uncertainties of the estimation of , as well as the gas distribution within 50 kpc, the maximum percentage of missing baryons that the CGM of M31 can account for, constrained from the gamma-ray observation, ranges in . This prevents us from drawing a robust conclusion. Note that the first two uncertainties are inevitable regardless of the approach that is taken to measure the baryon fraction. Deeper observations of the halo region of M31, particularly the spectroscopic measurement (Yan & Lazarian, 2007), and better understanding on CR diffusion in CGM are needed to constrain the baryon mass of CGM more accurately.
There may be interesting implication by confronting the baryon mass constrained in this work with the result in other studies. For example, Lehner et al. (2020) obtained the mass of cool and warm gas of M31 within 230 kpc to be . If we compar this result with the upper limit of the total baryon mass, e.g., in Case 1 for , it would require the metallicity in the halo. On the other hand, if the metallicity in the extended halo can be better determined in the future, it would shed light on the total baryon budget in the halo. We note that Fig. 5 could be also regarded as a constraint on the diffusion coefficient or the property of the turbulence in the extended halo. Provided that a better measurement on the baryon budget in M31 with other methods, it then implies that the diffusion coefficient cannot be too small or the turbulence cannot be too strong in the halo.
4 Summary
To summarize, we attempted to utilize gamma-ray observations as a novel and independent probe of missing baryons in this work. Different from some traditional measurements through UV/X-ray observation which are sensitive to gas in certain specific temperature range, the hadronic gamma-ray flux is sensitive to baryonic gases in all phases and does not rely on their chemical composition. We pointed out that the constraint obtained with this method is dependent on the CR diffusion coefficient in the extended halo of the galaxy which is not clearly known at present. Considering a wide range of the diffusion coefficient (up to two orders of magnitude larger than the one of the Galactic plane), we arrived at that the total mass of baryons concealed in the halo of the Andromeda Galaxy could be at most for (for 350 GeV cosmic rays) based on the model-dependent analysis result of the gamma-ray intensity in the extended halo of the galaxy (Case 1), while no more than for based on the model-independent analysis result (Case 2). In the latter case, the method becomes unable to constrain the baryon mass with the present gamma-ray data for a larger . A flattening of the average CGM density profile beyond 50 kpc is allowed if a large diffusion coefficient in the halo presents for Case 1 and for Case 2. The missing baryon fraction that can be accounted for by the CGM also depends on the total mass of the dark matter halo of Andromeda Galaxy and the total stellar mass in the galaxy, both of which are subject to uncertainties. Employing median values of for these relevant quantities, we would get that the fraction is about 30% at most for Case 1. But using the more conservative gamma-ray intensity upper limit (Case 2) and uncertainties of other parameters such as lead us to the conclusion that CGM may explain less than of the missing baryons related to the galaxy. To get a more accurate estimation of the missing baryon fraction in the CGM, we need a better understanding on the properties of the turbulence in the extended galactic halo, a more accurate measurement on the total mass of the dark matter halo and stellar mass of Andromeda Galaxy. In addition, the next generation gamma-ray detectors may perform advanced observation on the diffuse gamma-ray flux or deeper upper limits of the halo of nearby galaxies, making gamma-ray emission a more accurate probe of the missing baryons of galaxies.
Acknowledgements
We would like to thank Zhijie Qu for useful comments. This work is supported by NSFC grants 11625312, 11851304 and U2031105, and the National Key R & D program of China under the grant 2018YFA0404203. HL was supported by NASA through the NASA Hubble Fellowship grant HST-HF2-51438.001-A awarded by the Space Telescope Science Institute, which is operated by the Association of Universities for Research in Astronomy, Incorporated, under NASA contract NAS5-26555.
References
- Abdo et al. (2010) Abdo, A. A. et al. 2010, Astronomy and Astrophysics, 523, L2
- Ackermann et al. (2017) Ackermann, M. et al. 2017, ApJ, 836, 208
- Ackermann et al. (2014) — 2014, ApJ, 793, 64
- Aguilar et al. (2016) Aguilar, M. et al. 2016, Physical Review Letters, 117, 231102
- Anderson & Bregman (2010) Anderson, M. E. & Bregman, J. N. 2010, ApJ, 714, 320
- Anderson et al. (2013) Anderson, M. E., Bregman, J. N., & Dai, X. 2013, ApJ, 762, 106
- Bell (1978) Bell, A. R. 1978, Mon. Not. R. Astron. Soc., 182, 147
- Berezinsky & Gazizov (2006) Berezinsky, V. & Gazizov, A. Z. 2006, ApJ, 643, 8
- Biswas & Gupta (2019) Biswas, S. & Gupta, N. 2019, arXiv e-prints, arXiv:1907.03102
- Blandford & Eichler (1987) Blandford, R. & Eichler, D. 1987, Phys. Rep., 154, 1
- Bogdán et al. (2013) Bogdán, Á. et al. 2013, ApJ, 772, 97
- Bregman et al. (2018) Bregman, J. N., Anderson, M. E., Miller, M. J., Hodges-Kluck, E., Dai, X., Li, J.-T., Li, Y., & Qu, Z. 2018, ApJ, 862, 3
- Carlesi et al. (2017) Carlesi, E., Hoffman, Y., Sorce, J. G., & Gottlöber, S. 2017, Mon. Not. R. Astron. Soc., 465, 4886
- Cavaliere & Fusco-Femiano (1976) Cavaliere, A. & Fusco-Femiano, R. 1976, Astronomy and Astrophysics, 500, 95
- Chan et al. (2019) Chan, T. K., Kereš, D., Hopkins, P. F., Quataert, E., Su, K. Y., Hayward, C. C., & Faucher-Giguère, C. A. 2019, Mon. Not. R. Astron. Soc., 488, 3716
- Corbelli et al. (2010) Corbelli, E., Lorenzoni, S., Walterbos, R., Braun, R., & Thilker, D. 2010, Astronomy and Astrophysics, 511, A89
- Dai et al. (2012) Dai, X., Anderson, M. E., Bregman, J. N., & Miller, J. M. 2012, ApJ, 755, 107
- Das et al. (2019) Das, S., Mathur, S., Gupta, A., Nicastro, F., Krongold, Y., & Null, C. 2019, ApJ, 885, 108
- de Graaff et al. (2019) de Graaff, A., Cai, Y.-C., Heymans, C., & Peacock, J. A. 2019, Astronomy and Astrophysics, 624, A48
- Diaz et al. (2014) Diaz, J. D., Koposov, S. E., Irwin, M., Belokurov, V., & Evans, N. W. 2014, Mon. Not. R. Astron. Soc., 443, 1688
- Eckert et al. (2015) Eckert, D. et al. 2015, Nature, 528, 105
- Eckner et al. (2018) Eckner, C. et al. 2018, ApJ, 862, 79
- Faerman et al. (2017) Faerman, Y., Sternberg, A., & McKee, C. F. 2017, ApJ, 835, 52
- Fang et al. (2013) Fang, T., Bullock, J., & Boylan-Kolchin, M. 2013, ApJ, 762, 20
- Fardal et al. (2013) Fardal, M. A. et al. 2013, Mon. Not. R. Astron. Soc., 434, 2779
- Farmer & Goldreich (2004) Farmer, A. J. & Goldreich, P. 2004, ApJ, 604, 671
- Feldmann et al. (2013) Feldmann, R., Hooper, D., & Gnedin, N. Y. 2013, ApJ, 763, 21
- Fragione et al. (2019) Fragione, G., Antonini, F., & Gnedin, O. Y. 2019, ApJL, 871, L8
- Fukugita et al. (1998) Fukugita, M., Hogan, C. J., & Peebles, P. J. E. 1998, ApJ, 503, 518
- Garrison-Kimmel et al. (2019) Garrison-Kimmel, S. et al. 2019, Mon. Not. R. Astron. Soc., 487, 1380
- Genolini et al. (2015) Genolini, Y., Putze, A., Salati, P., & Serpico, P. D. 2015, Astronomy and Astrophysics, 580, A9
- Grcevich & Putman (2009) Grcevich, J. & Putman, M. E. 2009, ApJ, 696, 385
- Gupta et al. (2012) Gupta, A., Mathur, S., Krongold, Y., Nicastro, F., & Galeazzi, M. 2012, ApJL, 756, L8
- Hodges-Kluck et al. (2016) Hodges-Kluck, E. J., Miller, M. J., & Bregman, J. N. 2016, ApJ, 822, 21
- Hopkins et al. (2021) Hopkins, P. F., Squire, J., Chan, T. K., Quataert, E., Ji, S., Kereš, D., & Faucher-Giguère, C.-A. 2021, Mon. Not. R. Astron. Soc., 501, 4184
- Huang et al. (2020) Huang, Z.-Q., Liu, R.-Y., Joshi, J. C., & Wang, X.-Y. 2020, ApJ, 895, 53
- Jana et al. (2020) Jana, R., Roy, M., & Nath, B. B. 2020, ApJL, 903, L9
- Kafle et al. (2018) Kafle, P. R., Sharma, S., Lewis, G. F., Robotham, A. S. G., & Driver, S. P. 2018, Mon. Not. R. Astron. Soc., 475, 4043
- Kalashev & Troitsky (2016) Kalashev, O. & Troitsky, S. 2016, PRD, 94, 063013
- Karwin et al. (2020) Karwin, C., Murgia, S., Moskalenko, I., Fillingham, S., Burns, A.-K., & Fieg, M. 2020, arXiv e-prints, arXiv:2010.08563
- Karwin et al. (2019) Karwin, C. M., Murgia, S., Campbell, S., & Moskalenko, I. V. 2019, ApJ, 880, 95
- Kelner et al. (2006) Kelner, S. R., Aharonian, F. A., & Bugayov, V. V. 2006, PRD, 74, 034018
- Kennicutt (1998) Kennicutt, Robert C., J. 1998, ApJ, 498, 541
- Lehner et al. (2020) Lehner, N. et al. 2020, ApJ, 900, 9
- Lehner et al. (2015) Lehner, N., Howk, J. C., & Wakker, B. P. 2015, ApJ, 804, 79
- Lemos et al. (2020) Lemos, P., Jeffrey, N., Whiteway, L., Lahav, O., Libeskind, N. I., & Hoffman, Y. 2020, arXiv e-prints, arXiv:2010.08537
- Li et al. (2018) Li, J.-T., Bregman, J. N., Wang, Q. D., Crain, R. A., & Anderson, M. E. 2018, ApJL, 855, L24
- Li et al. (2017) Li, J.-T., Bregman, J. N., Wang, Q. D., Crain, R. A., Anderson, M. E., & Zhang, S. 2017, ApJS, 233, 20
- Li & White (2008) Li, Y.-S. & White, S. D. M. 2008, Mon. Not. R. Astron. Soc., 384, 1459
- Libeskind et al. (2020) Libeskind, N. I. et al. 2020, Mon. Not. R. Astron. Soc., 498, 2968
- Lim et al. (2020) Lim, S. H., Mo, H. J., Wang, H., & Yang, X. 2020, ApJ, 889, 48
- Liu et al. (2019) Liu, R.-Y., Yan, H., Wang, X.-Y., Shao, S., & Li, H. 2019, ApJ, 871, 40
- McDaniel et al. (2018) McDaniel, A., Jeltema, T., & Profumo, S. 2018, PRD, 97, 103021
- McDaniel et al. (2019) McDaniel, A., Jeltema, T., & Profumo, S. 2019, Phys. Rev. D, 100, 023014
- Miller & Bregman (2013) Miller, M. J. & Bregman, J. N. 2013, ApJ, 770, 118
- Miller & Bregman (2015) — 2015, ApJ, 800, 14
- Pakmor et al. (2016) Pakmor, R., Pfrommer, C., Simpson, C. M., & Springel, V. 2016, ApJL, 824, L30
- Patel et al. (2017) Patel, E., Besla, G., & Mandel, K. 2017, Mon. Not. R. Astron. Soc., 468, 3428
- Persic & Salucci (1992) Persic, M. & Salucci, P. 1992, Mon. Not. R. Astron. Soc., 258, 14P
- Phelps et al. (2013) Phelps, S., Nusser, A., & Desjacques, V. 2013, ApJ, 775, 102
- Planck Collaboration et al. (2018) Planck Collaboration et al. 2018, arXiv e-prints, arXiv:1807.06209
- Pshirkov et al. (2016) Pshirkov, M. S., Vasiliev, V. V., & Postnov, K. A. 2016, Mon. Not. R. Astron. Soc., 459, L76
- Ptuskin (2006) Ptuskin, V. 2006, in Journal of Physics Conference Series, Vol. 47, Journal of Physics Conference Series, 113–119
- Salem et al. (2015) Salem, M., Besla, G., Bryan, G., Putman, M., van der Marel, R. P., & Tonnesen, S. 2015, ApJ, 815, 77
- Skilling (1971) Skilling, J. 1971, ApJ, 170, 265
- Sofue (2015) Sofue, Y. 2015, PASJ, 67, 75
- Strong et al. (2010) Strong, A. W., Porter, T. A., Digel, S. W., Jóhannesson, G., Martin, P., Moskalenko, I. V., Murphy, E. J., & Orlando, E. 2010, ApJL, 722, L58
- Su et al. (2010) Su, M., Slatyer, T. R., & Finkbeiner, D. P. 2010, ApJ, 724, 1044
- Tahir et al. (2019) Tahir, N., de Paolis, F., Qadir, A., & Nucita, A. 2019, International Journal of Modern Physics D, 28, 1950088
- Tamm et al. (2012) Tamm, A., Tempel, E., Tenjes, P., Tihhonova, O., & Tuvikene, T. 2012, Astronomy and Astrophysics, 546, A4
- Taylor et al. (2014) Taylor, A. M., Gabici, S., & Aharonian, F. 2014, PRD, 89, 103003
- van der Marel et al. (2012) van der Marel, R. P., Fardal, M., Besla, G., Beaton, R. L., Sohn, S. T., Anderson, J., Brown, T., & Guhathakurta, P. 2012, ApJ, 753, 8
- van der Marel et al. (2019) van der Marel, R. P., Fardal, M. A., Sohn, S. T., Patel, E., Besla, G., del Pino, A., Sahlmann, J., & Watkins, L. L. 2019, ApJ, 872, 24
- Veljanoski et al. (2014) Veljanoski, J. et al. 2014, Mon. Not. R. Astron. Soc., 442, 2929
- Watkins et al. (2010) Watkins, L. L., Evans, N. W., & An, J. H. 2010, Mon. Not. R. Astron. Soc., 406, 264
- Williams et al. (2017) Williams, B. F. et al. 2017, ApJ, 846, 145
- Yan & Lazarian (2002) Yan, H. & Lazarian, A. 2002, Physical Review Letters, 89, 281102
- Yan & Lazarian (2007) — 2007, ApJ, 657, 618
- Yan & Lazarian (2008) — 2008, ApJ, 673, 942
- Zirakashvili & Völk (2006) Zirakashvili, V. N. & Völk, H. J. 2006, Advances in Space Research, 37, 1923