The Dust-to-Gas Ratio and the Role of Radiation Pressure in Luminous, Obscured Quasars
Abstract
The absence of high-Eddington-ratio, obscured active galactic nuclei (AGNs) in local () samples of moderate-luminosity AGNs has generally been explained to result from radiation pressure on the dusty gas governing the level of nuclear ( pc) obscuration. However, very high accretion rates are routinely reported among obscured quasars at higher luminosities and may require a different feedback mechanism. We compile constraints on obscuration and Eddington ratio for samples of X-ray, optical, infrared, and submillimeter selected AGNs at quasar luminosities. Whereas moderate-luminosity, obscured AGNs in the local universe have a range of lower Eddington ratios (), the most luminous () IR/submillimeter-bright, obscured quasars out to commonly have very high Eddington ratios (). This apparent lack of radiation-pressure feedback in luminous, obscured quasars is likely coupled with AGN timescales, such that a higher fraction of luminous, obscured quasars are seen because of the short timescale for which quasars are most luminous. When adopting quasar evolutionary scenarios, extended ( pc) obscuration may work together with the shorter timescales to explain the observed fraction of obscured, luminous quasars, while outflows driven by radiation pressure will slowly clear this material over the AGN lifetime.
Dec 31, 2020 111e-mail: hsjun@kias.re.kr
1 Introduction
Accretion rate and obscuration of active galactic nuclei (AGNs) are two fundamental parameters that explain their diverse observed properties (e.g., Shen & Ho 2014; Hickox & Alexander 2018). According to AGN evolutionary scenarios (e.g., Hopkins et al. 2008; Hickox et al. 2009), matter falling onto the black hole (BH) will trigger AGN activity at various strengths depending on the environment, which in turn will heat and sweep any potential obscuring circumnuclear material. Thus, feeding onto the BH and feedback from the AGN are closely related on the obscuration–accretion rate plane.
Ricci et al. (2017c) (hereafter R17c) recently reported on a study of the relationship between obscuration and accretion rate in a large, relatively unbiased, and complete sample of local AGNs. Specifically, they investigated 836 AGNs with a median redshift of selected by the hard X-ray (14–195 keV) Swift Burst Alert Telescope (BAT, Gehrels et al. 2004; Barthelmy et al. 2005; Krimm et al. 2013) all-sky survey (Baumgartner et al. 2013; Koss et al. 2017; Oh et al. 2018), which is sensitive to sources with column densities up to Approximately one-half of the sources had robust measurements of column densities, intrinsic X-ray luminosities, and black hole masses, from which R17c was able to show that while unobscured AGNs are seen with Eddington fractions up to the Eddington limit, very few local, obscured AGNs are found with Eddington fractions above approximately 10%. This strengthened earlier results based on smaller samples (e.g., Fabian et al. 2009) and was interpreted as evidence for radiation-pressure-driven AGN feedback (e.g., King 2003; Murray et al. 2005) clearing the immediate BH environment of dusty gas (e.g., Fabian et al. 2006, 2008). For dusty gas (neutral or partially ionized), the effective cross section between matter and radiation () becomes larger than that between electrons and radiation for ionized gas (, for Thompson scattering), due to absorption of radiation by dust. This is given by the Eddington ratio for ionized gas,
| (1) |
where is the bolometric luminosity, is the Eddington luminosity with the BH mass, and is the proton mass. For dusty gas, we use instead of in Equation (1), where is redefined as the effective Eddington ratio (). AGNs are strong ionizing sources, but are fully ionized close to their accretion disks (e.g., Osterbrock 1979; Ballantyne et al. 2001), though pc-scale environment starts to be composed of dusty gas (e.g., Kishimoto et al. 2011; Minezaki et al. 2019).
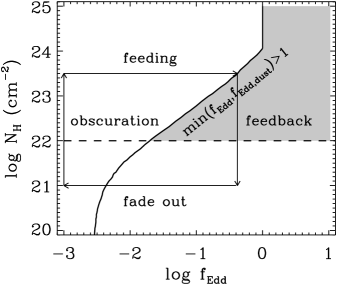
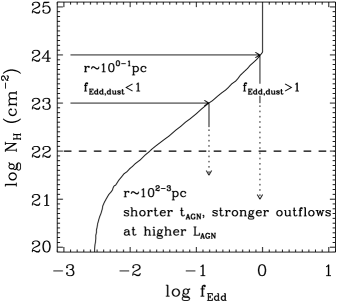
To visualize how the radiation pressure would blow away the nuclear material, we plot where as a function of in Figure 1, adopted from Fabian et al. (2009).222We note that at , , or the radiation pressure on dusty gas is weaker than on ionized gas. Only because of the relative lack of super-Eddington gas accretion, we restrict the curve to throughout. When AGNs are obscured beyond the typical value for galaxies (e.g., Buchner & Bauer 2017; Hickox & Alexander 2018), is on the order of 0.01–0.1, and the accretion becomes super-Eddington (shaded region) even if . This makes it easier for radiation pressure to blow out the dusty nuclear gas on the order of 1–10 pc (e.g., Jaffe et al. 2004; Ramos Almeida & Ricci 2017; Ichikawa et al. 2019) and matches well with the observations of R17c reporting a lack of AGNs with , perhaps favoring an episodic nuclear obscuration and blowout governed by radiation pressure.
The largest limitation for the /BAT survey, which is relatively unbiased and complete for local AGNs, is that its shallow sensitivity misses luminous quasars in the distant universe. Here, we explore high-luminosity/redshift samples of optical quasars (e.g., Schneider et al. 2010), optical–IR red quasars with large color excess, where mag (e.g., Glikman et al. 2007; Banerji et al. 2012; Ross et al. 2015; Hamann et al. 2017), dust-obscured galaxies (DOGs, Dey et al. 2008; Hot DOGs, Eisenhardt et al. 2012), and submillimeter galaxies (SMGs, Blain et al. 2002), where the latter two are likely subsets and distant analogs of local ultraluminous infrared galaxies (ULIRGs, ; Sanders et al. 1988) and their higher-luminosity cousins (e.g., hyLIRGs, Sanders & Mirabel 1996; ELIRGs, Tsai et al. 2015). We also add the highest-obscuration Compton-thick AGNs, that is, AGNs with X-ray-obscuring column densities of , observed with (Harrison et al., 2013).
| Name | Sample | Selection | Obscuration | N | ||
|---|---|---|---|---|---|---|
| B15b; B16 | Compton-thick | Hard X-ray | 0.001–0.051 | 42.5–45.8 | 16 | |
| R17c | Swift/BAT | Hard X-ray | , | 0.00–0.27 | 40.8–46.9 | 366 |
| Y09; M17; V18b | Type 1 | Optical | , | 0.15–4.26 | 44.8–48.7 | 174 |
| J13 | Type 1 | Optical | 0.14–4.13 | 45.7–48.2 | 14,531 | |
| L16; L17; G17 | Red | Optical–IR | , | 0.14–2.48 | 45.2–46.9 | 12 |
| U12; K18 | Red | Optical–IR | 0.29–0.96 | 45.8–47.1 | 23 | |
| G18 | Extremely red | Optical–IR | 2.32 | 47.5 | 1 | |
| P19 | Extremely red | Optical–IR | 2.24–2.95 | 46.7–47.8 | 28 | |
| L20 | Heavily reddened | Optical–IR | 2.09–2.66 | 45.7–46.9 | 7 | |
| B12; B13; B15a; T19 | Heavily reddened | Optical–IR | 1.46–2.66 | 46.0–48.6 | 51 | |
| C16; T20 | DOG | Optical–IR | 1.22–5.22 | 43.8–48.2 | 15 | |
| S14; A16; R17a; V18a; Z18; A20 | Hot DOG | IR | 1.01–4.60 | 46.2–48.1 | 9 | |
| A15 | Hot DOG | IR | 0.29–4.59 | 45.4–48.9 | 129 | |
| A08 | ULIRG, SMG | IR/submm | 0.04–2.05 | 44.6–45.6 | 3 |
Note. — AGN samples used in this work. We refer to each reference as having the objects with values or constraints on obscuration or accretion rate, while the original catalog paper is provided in the text (§2). Here, denotes the number of objects for each set of references having obscuration and accretion rate information used in §5, so they could be smaller than the number of sources from the references. The subscripts “cont” and “nl” under values are derived using the continuum SED and narow-line ratios, respectively. The abbreviated references are Brightman et al. (2015) (B15b); Brightman et al. (2016) (B16); Ricci et al. (2017c) (R17c); Young et al. (2009) (Y09); Martocchia et al. (2017) (M17); Vietri et al. (2018) (V18b); Jun & Im (2013) (J13); LaMassa et al. (2016, 2017) (L16, L17); Glikman et al. (2017a) (G17); Urrutia et al. (2012) (U12); Kim & Im (2018) (K18); Goulding et al. (2018) (G18); Perrotta et al. (2019) (P19); Lansbury et al. (2020) (L20); Banerji et al. (2012, 2013, 2015) (B12, B13, B15a); Temple et al. (2019) (T19); Corral et al. (2016) (C16); Toba et al. (2020) (T20); Stern et al. (2014) (S14); Assef et al. (2016) (A16); Ricci et al. (2017a) (R17a); Vito et al. (2018) (V18a); Zappacosta et al. (2018) (Z18); Assef et al. (2020) (A20); Assef et al. (2015) (A15); Alexander et al. (2008) (A08).
The latest studies of obscured quasars with large values, through careful analysis to quantify and minimize the effect of obscuration, have reported near-Eddington to Eddington-limited accretion ( 0.1–1, e.g., Alexander et al. 2008; Urrutia et al. 2012; Kim et al. 2015; Assef et al. 2020; Jun et al. 2020). Furthermore, Glikman (2017b) and Lansbury et al. (2020) find many obscured quasars with at high . These observations suggest that radiation pressure on dusty gas is effective, but is potentially less effective for obscured, luminous quasars since the length of time that luminous quasars are active is shorter than the length of time that less-luminous AGN are active (e.g., Hopkins et al. 2005, 2006). Alternatively, luminous, obscured quasars are thought to be observed in a short phase in which they are blowing out the material through outflows stronger at higher luminosities (e.g., LaMassa et al. 2017; Perrotta et al. 2019; Temple et al. 2019; Jun et al. 2020), perhaps requiring a different nuclear or galactic environment from less-luminous, obscured AGNs. Hence, there is growing interest in which AGN property drives radiation-pressure feedback, and in which temporal and spatial scales is it effective.
In this work, we attempt to constrain the – and – planes for quasars from multiwavelength AGN samples (§2) and through a consistent method to estimate , (§3), and values (§4). We present (§5) and discuss (§6) the – and – distributions for quasars in terms of various feedback mechanisms. Throughout, including the luminosities from the literature, we use a flat CDM cosmology with , , and .
2 The sample
Probing the distribution of – and – values from a statistically complete AGN sample is complicated for several reasons. AGNs radiate across almost the entire electromagnetic spectrum, but show a wide range of spectral energy distributions (SEDs) due to physical processes governing the radiation, host galaxy contamination, and obscuration on various scales around the accreting BHs (e.g., Lansbury et al. 2017; Hickox & Alexander 2018). Therefore, we found it beneficial to compile quasar samples selected at various wavelengths over a wide range of luminosity and redshift. Still, we chose to add only the data from the literature that meaningfully increase the sample size for a given wavelength selection.
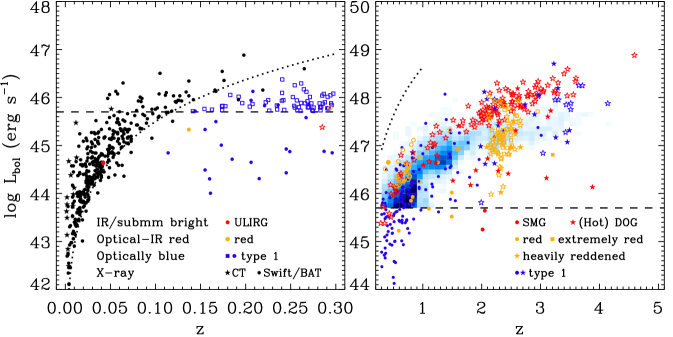
In Figure 2 we plot the AGN samples from X-ray, optically blue, optical–IR red, and IR/submillimeter-bright populations, also summarized in Table 1. At , the /BAT AGN in R17c (with from Ricci et al. 2017d; from Koss et al. 2017) has the advantage of minimal obscuration bias from the hard X-ray selection and covers a wide range of luminosities, reaching down to low-luminosity AGNs and up to quasar luminosities (). However, the /BAT survey lacks the sensitivity to probe the distant or luminous AGN populations marked in Figure 2. We complemented the highest obscurations using Compton-thick () AGNs observed with (B15b; B16), and the higher luminosities/redshifts from optical Sloan Digital Sky Survey (SDSS) quasars (e.g., Schneider et al. 2010; from Y09; from J13), red quasars (L16, originally from Glikman et al. 2012; K18, averaged between Glikman et al. 2007 and Urrutia et al. 2009), and quasars from ULIRGs (broad-line333Throughout, we classify narrow-line AGNs to be type (weak broad H and H, [O III]/H, Winkler 1992), and broad-line AGNs to be type (comparable broad-to-narrow H and [O III]/H). When the AGN types are not specified, we follow the visual classifications from the literature. ULIRGs in A08, with from Severgnini et al. 2001).
We further include quasars to search for luminous quasars, adding type 1 quasars from the SDSS (i.e., WISSH quasars, from M17 and from V18b), and a variety of quasars with red optical-to-infrared colors, that is, heavily reddened quasars (B12; B13, B15a; T19), red quasars (U12; G17; L17; K18), extremely red quasars (P19 with from G18 and from Hamann et al. 2017), and DOGs (C16; T20). Hot DOGs (S14; A15444This sample is being updated by P. R. M. Eisenhardt et al. (in preparation), but we simply refer to the numbers from A15 at this time.; A16; R17a; V18a; Z18; A20), and broad-line (AGN-like) SMGs (A08 with from Alexander et al. 2005) were also included, adding part of some samples at that extend to (A08; Y09; J13; L16; R17c; K18).
Duplication among the samples was found in Compton-thick AGNs (B15b; B16), heavily reddened quasars (B12; T19) and red quasars (U12; K18), where we used the most recent values, except for those between B15b/B16 and R17c, where we kept both the and estimates as they were based on multiple X-ray observations. The samples based on follow-up studies of SDSS quasars were separated into those with (Y09; M17) and those with (J13; V18b), where the values from signal-to-noise ratio (S/N) 20 spectra in Shen et al. (2011) and Pâris et al. (2012) were added. We removed beamed sources (R17c, flagged by Koss et al. 2017 using the blazar catalog from Massaro et al. 2015) for reliable and values (but see also, e.g., Baek et al. 2019, for estimation of in radio-bright AGNs). We used line widths corrected for instrumental resolution in estimating (§4).
3 Gas and Dust Obscuration
We compiled and values, representing gas and dust obscuration, for the AGN samples. For , we used the line-of-sight X-ray obscuration from sources with enough X-ray counts to model the spectra (40–60, defined by the respective references). Exceptions are obviously large absorption () constraints in S14, V18a, and A20, where the exposure times are longer than 20 ks but have a relatively smaller number of X-ray counts due to Compton-thick absorption. We add these values to our analysis. The choice of models to fit or estimate the X-ray obscuration varies in the literature: Murphy & Yaqoob (2009) (S14; L16; G17; V18a; Z18), Brightman & Nandra (2011) (B15b; A16; B16; C16; A20), hardness-ratio-based conversion (L17), (absorbed) power-law fit (Y09; C16; M17; G18; L20), and a combination of models (A08; R17c; T20). Still, when the values are compared between various models (e.g., B15b; B16; G17; Z18; L20), they are mostly consistent within the uncertainties (but see also B15b and Liu & Li 2015, for the limitations of the models at Compton-thick column densities).
For , we used the UV/optical–IR continuum SED-based 555Throughout, are those derived from the continuum SED and broad/narrow-line ratios, respectively, and the values are only mentioned as lower limits to . We used the Milky Way extinction curve with total-to-selective extinction of 3.1 when transforming extinction to . from the literature. Lower limits in were given to the P19 data from Hamann et al. (2017) because of likely underestimation using a narrow range of wavelengths to determine . For optical quasars, we determined the rest-frame m power-law continuum slope following , fit to the photometric SED. We assumed an intrinsic slope of from the most blue (hot dust-poor, outliers) quasars in J13, consistent with accretion disk models and polarized observations of quasar SEDs (, e.g., Shakura & Sunyaev 1973; Kishimoto et al. 2008). We limited the sample to quasars with at least three SDSS optical or UKIDSS near-IR (Lawrence et al., 2007) photometric detections at rest-frame m and rest-frame near-IR detections at up to at least 2.3m to decompose the SED into the power-law continuum and dust emission (see J13 for details). We converted into by reddening the intrinsic slope using a Milky Way extinction curve at m to match the observed value of , while fixing when . We checked if the estimates from J13 are consistent with the literature by comparing the values cross-matched with 17 sources in V18b and 277 sources in C. Carroll et al. (submitted) at mag. The J13 values have a median offset and scatter of and mag, respectively, consistent within the uncertainties. We adopt the J13 values for the cross-matched sources (Y09; M17; V18b).
The values can suffer from host galaxy contamination in the rest-frame optical/near-IR. We limited the samples with the SEDs decomposed into an AGN and a host galaxy (U12; A15; L17) to for the decomposition to contain a sufficient AGN contribution, and the samples without an SED decomposition (the remaining samples with in Table 1) to , to minimize host galaxy contamination. Above the luminosity limits, the average host contamination at 5100Å drops below 50% and 10%, respectively, for type 1 quasars (Shen et al., 2011) and is consistent with the growing AGN contribution to the observed SEDs for red quasars at higher (L17). The limit corresponds to , selecting ULIRG luminosities for IR-bright AGNs (e.g., Fan et al. 2016; Toba et al. 2017). The majority of the hard X-ray selected AGNs from R17c are less luminous than the limits for , but instead have robust measurements of from their hard X-ray spectra.
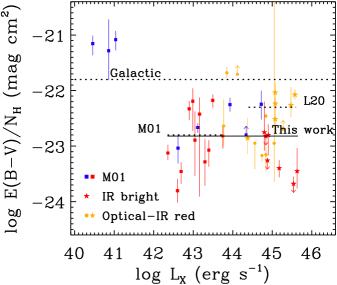
The nuclear dust-to-gas ratio traced by the (mag cm2) values in Figure 3 is constant if the gas and dust obscuration are proportional (e.g., Usman et al. 2014). The values are overall smaller than the Galactic value (21.8, e.g., Bohlin et al. 1978),666One of the reasons for the offset may be that the majority of the AGNs have an excess of dust-free gas within the sublimation radius (e.g., Risaliti et al. 2002, 2007; Maiolino et al. 2010; Burtscher et al. 2016; Ichikawa et al. 2019), but we focus here on the overall value when including the more luminous AGNs. with reported average values ranging between 22.8 (Maiolino et al., 2001) and 22.3 (L20). L20 find relatively higher values for a sample of heavily reddened broad-line quasars at high luminosity, but there are similarly luminous quasars with relatively smaller values (i.e., the Hot DOGs or some optical–IR red quasars in Figure 3). Apart from the type 1 AGNs where the large scatter in could in part arise from the uncertainty constraining the lowest values in either quantity, we find the mean and scatter of (observed) or 777We refer to the intrinsic scatter of the quantity , , as the observed scatter with measurement error subtracted in quadrature, that is, . The errors on values are missing for the L16 and G17 samples, but the intrinsic scatter of decreases by only 0.01 dex if we assign the mean error of mag from the L17 sample used here. (intrinsic) from 31 obscured AGNs (type 2 AGNs, optical–IR red quasars, and Hot DOGs) without upper/lower limits in Figure 3, spanning absorption-corrected . The ratios are close to the Maiolino et al. (2001) value, but are highly scattered for any combination of AGN type over the luminosity probed, complicating a simple correspondence between dust and gas. We thus refer to both and when selecting AGNs with dusty gas, using a conversion of 22.8.
The and values are thought to be nuclear obscuration close to the AGN center, but as the AGN geometry consists of an extended, kpc order narrow line region outside the central dusty structure (e.g., Kang & Woo 2018; Minezaki et al. 2019), we expect the narrow-line-based values to be smaller than the values measured closer to the nucleus (e.g., Zakamska et al. 2003; Zakamska et al. 2005; Greene et al. 2014; Jun et al. 2020). For the R17c sample providing narrow Balmer decrements, we find that the values for obscured (type 1.8–2.0) AGNs are about an order of magnitude smaller than the values in Figure 3, although showing an even larger scatter. This demonstrates that is simply much lower than . Furthermore, the dust-to-gas ratios may decrease when using the global , as it is larger than the nuclear line-of-sight , such as for red quasars in L16, implying extended gas. The extended obscuration in obscured quasars will be considered to assess the effect of radiation pressure (§6.2), but for a better comparison of nuclear dust and gas obscuration, we remove values from further analysis, and we use as the fiducial estimate of hereafter.
4 Eddington Ratio
Estimating throughout the samples relies on several bolometric correction methods and black hole scaling relations. For the bolometric correction, we primarily relied on the hard X-ray (2–10 keV) luminosity to minimize the absorption correction for the X-ray samples in Table 1. The 2–10 keV intrinsic luminosities are based on a simple conversion of the 14–195 keV luminosities from R17c using a typical X-ray spectral slope; namely, (Rigby et al., 2009). The absorption-corrected X-ray-to-bolometric correction depends on or (e.g., Marconi et al. 2004; Vasudevan & Fabian 2007; Lusso et al. 2012). We used the Marconi et al. (2004) bolometric correction as a function of , as the dynamic range of (3–4 dex) is wider than that of (2 dex). When the X-ray luminosity was absent, we adopted the monochromatic bolometric correction from IR or extinction-corrected UV/optical continuum or line luminosities, which are relatively insensitive to (e.g., Richards et al. 2006; Lusso et al. 2012). We used the corrections from , , and 888Throughout, subscripts of indicate monochromatic continuum luminosity at that wavelength, measured in units of Å. (3.81, 5.15, and 9.26, respectively, Shen et al. 2011) for optical quasars (J13; V18b) and obscured AGNs with extinction-corrected continuum luminosities (B12; B13; A15; B15a; objects in L17 without ; T19; A20), (, Kim et al. 2015) for K18, (8, Hamann et al. 2017) for P19, (9, Richards et al. 2006) for U12, with each correction having systematic uncertainties of a few tens of percent up to a factor of few (e.g., Heckman et al. 2004; Richards et al. 2006; Lusso et al. 2012).
We estimated mostly through stellar absorption or broad emission lines, using a mutually consistent methodology. The mass constant of single-epoch estimators for AGNs (-factor), is determined assuming that the reverberation mapped AGNs lie on the – relation for inactive galaxies. We thus use the same – relation (e.g., Woo et al. 2015),
| (2) |
to estimate -based values for narrow-line AGNs where the host absorption lines are better seen, and to derive the -factor in the broad FWHM-based single-epoch estimators for broad-line AGNs where AGN emission dominates over the host galaxy. The () estimates based on other – relations with a shallower slope, e.g., Kormendy & Ho (2013), are systematicaly offset to Equation (2) by 0.35 and 0.05 dex at and 400, respectively.
| Type | ||||
|---|---|---|---|---|
| (, FWHM) | 6.990.16 | 0.5470.037 | 2.110.11 | 0 |
| (, FWHM, ) | 6.620.16 | 0.5470.037 | 2.110.11 | 0.3350.022 |
| (, FWHM) | 6.570.13 | 0.5480.035 | 2.450.06 | 0 |
| (, FWHMHβ) | 6.880.12 | 0.5330.034 | 2 | 0 |
| (, FWHMHα) | 6.990.12 | 0.5330.034 | 2.120.03 | 0 |
| (, FWHMPβ) | 7.240.16 | 0.450.03 | 1.690.16 | 0 |
| (, FWHMPα) | 7.200.16 | 0.430.03 | 1.920.18 | 0 |
Note. — is the continuum or broad-line luminosity, FWHM is the full width at half maximum of the best-fit broad-line model, and is the broad C IV line offset to the systemic redshift (Shen et al. 2011 in J13, negative for blueshifts). , , , are the coefficients in Equation (3).
The single-epoch estimators were empirically calibrated between H and H, Mg II, or C IV (Jun et al. 2015 using the Bentz et al. 2013 – relation) with C IV blueshift correction when broad-line shifts were available (Jun et al. 2017), or were calibrated between hydrogen Balmer and Paschen series (Kim et al. 2010999Using our adopted cosmology, we find that the values from Bentz et al. (2013) are higher than from Bentz et al. (2009) by 0.00–0.03 dex for the luminosity range used to derive Paschen line values (, A08; K18). K18 also note that using a single Gaussian to fit the broad Paschen lines will underestimate the values by 0.06–0.07 dex, but these amounts are negligible compared to the significance of the results (§5)., using the Bentz et al. 2009 – relation), over a wide range of redshift and luminosity. This approach reduces the systematic offset from the choice of emission line by up to an order of magnitude101010We note that a nonlinear relation between and FWHM values could further result in positive/negative biases in the FWHM-based estimate at notably high and low FWHM values (e.g., Peterson et al. 2004; Collin et al. 2006), as well as whether to construct the UV or IR mass estimators to match the values to the Balmer line based, or to match the UV or IR broad-line widths and the luminosities to the optical values separately. Our choice of estimators has its own merits and limitations, and we test the systematic uncertainty of in §5. at extreme values (Jun et al., 2015), or at extreme C IV blueshifts (Jun et al., 2017). The estimators were updated using a common -factor and uncertainty of for the FWHM-based (Woo et al., 2015), as shown below:
| (3) |
The set of values for the combination of (, FWHM, ) are given in Table 2. For broad-line AGNs with X-ray observations and single-epoch UV/optical estimates, we converted the X-ray-based into , , using the aforementioned bolometric corrections, to minimize host galaxy contamination in 1350–5100Å. We removed sources with Balmer line widths similar to [O III] (A08) to distinguish broad lines from broadening by ionized gas outflows. We also limited the FWHM values to 10,000 where values otherwise (e.g., 4% of the J13 sample) are potentially affected by rotating accretion disks and show double-peaked lines (e.g., Chen & Halpern 1989; Eracleous & Halpern 1994; Table 4 in Jun et al. 2017). Meanwhile, R17c removed single-epoch estimates for AGNs as the emission line profiles could be modified by obscuration or are dominated by the narrow component (Koss et al., 2017). However, as we already removed type 1.8 sources when estimating for broad-line AGNs, we keep the sources. These obscured type 1.5 AGNs with (FWHM) in R17c do not significantly change the distribution of – with respect to using () values. This hints that obscuration does not significantly bias the single-epoch estimates for broad-line AGNs, also consistent with the independence of broad C IV-to-H line width ratios with respect to the continuum slope for type 1 quasars (e.g., Jun et al. 2017). We thus carefully selected only the type 1.5 sources when using rest-frame UV–optical spectra to estimate (FWHM) for AGNs.
Among single-epoch estimates with multiple broad-line detections, we adopted the estimators in the order of decreasing rest wavelength, while direct dynamical (B15b; B16; R17c) or reverberation-mapped (Bentz & Katz 2015 in R17c) values were adopted over other methods. Hot DOGs, which are heavily obscured AGNs typically showing strong, narrow lines, often display signatures of narrow-line outflows instead of ordinary broad emission lines (e.g., Wu et al. 2018; Jun et al. 2020). Unless the sources are thought to show scattered or leaked light from the broad-line region (A16; A20), we utilized the SED fit from A15 when deriving the constraints. Applying their maximal stellar mass () estimates from the SED fit, we gave upper limits to the values using the – relation. The values are thought to evolve less with redshift (, ) than (e.g., Bennert et al. 2011; Ding et al. 2020; Suh et al. 2020). We adopt from the 1–2 AGNs in Ding et al. (2020) and Suh et al. (2020). The same relation was used to estimate for the DOGs in C16 and T20.
Although this analysis attempted to consistently estimate for the various samples, systematic uncertainties of a factor of several are expected from the intrinsic scatter in the BH–host mass scaling relations (e.g., Kormendy & Ho 2013) and the – relation (e.g., Bentz et al. 2013; Du et al. 2014). Overall, the compiled and estimates each have systematic uncertainties of up to a factor of several or more, and although the AGN estimators include the dependence, reducing uncertainty from the bolometric correction going into , we still expect systematic uncertainties of a factor of several in . We thus will interpret only the group behavior of each AGN sample within the uncertainties in .
5 Results
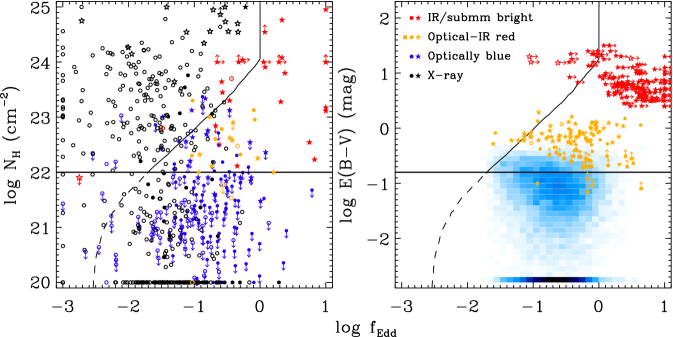
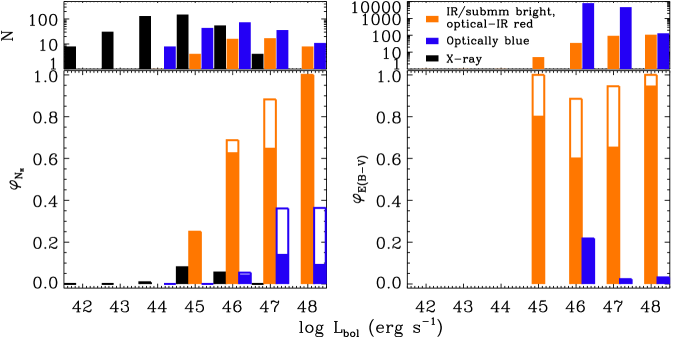
In Figure 4 we plot the distributions of – and – for the collection of AGN samples. It is clear that the forbidden region for dusty gas (Figure 1), previously less occupied by the AGNs from R17c, is well populated with IR/submillimeter-selected and optical–IR red quasars, with a minor fraction of type 1 quasars. This is seen in both the – and the – diagrams. We investigate this further in Figure 5 where we show the fraction of sources in the forbidden zone (i.e., , ) per bolometric luminosity bin as a function of . In the following, this fraction is referred to as . It is clear that is minimal among the X-ray-selected AGNs with 10% at . Similarly, optically selected quasars have and 20% at , with some uncertainty for at . In contrast, the optical–IR red and IR/submillimeter-bright quasars (hereafter referred to together as luminous, obscured quasars) commonly lie mostly in the forbidden region over a wide range of and values, and we combined their statistics.111111A potential caveat is the difference in the dust-to-gas ratio observed between optical–IR red and IR/submillimeter-bright quasars, which may bias the value between the populations. The average dust-to-gas ratios for each population from §3, are and , respectively. Using the separate ratios, however, (Figure 5 right) still remains consistent between the two populations. The luminous, obscured quasars show and 60% at , significantly higher than the less-luminous X-ray AGNs at comparable obscuration, or the comparably luminous but less obscured optical quasars. These findings confirm earlier studies by Glikman (2017b) and L20 on optical–IR red quasars, with our results applicable to general luminous, obscured quasars.
Systematic uncertainties of a factor of several in (§4) may change the fraction of the samples in the forbidden region. We test this by giving a 0.5 dex offset to the curve and recalculating . The values are nearly unchanged for the X-ray AGNs and optical quasars, whereas for the luminous, obscured quasars, may drop down to 40%–50% at if the observed values are overestimated by 0.5 dex. Still, the values for the luminous, obscured quasars are several times the X-ray AGNs or optical quasars at a given luminosity, and the main trend in Figure 5 remains unchanged. Modifications to the curve may also occur when considering the effect of dust-to-gas ratios closer to the Milky Way value than the value adopted in this work, or radiation trapping. The enhanced absorption of the incident radiation by dust or trapping of reprocessed radiation lowers the curve, at (Ishibashi et al., 2018). Still, we note that both effects simply increase for luminous, obscured quasars, reinforcing our findings in Figures 4 and 5.
The values can be further shifted by nuclear stars. Adopting the sphere of influence from the BH, we have
| (4) |
and the enclosed mass becomes multiple times larger than at due to nuclear stars, increasing the in Equation (1) for a radiation pressure force to balance off a stronger gravity by times. Nuclear stars may lower significantly if the BH is undermassive relative to the – relation, or if the stellar light is more concentrated near the center. To fully explain the excess in luminous, obscured quasars by the shift in values, however, their negative offset on the – relation should be on average an order of magnitude, which is less likely from current observations (e.g., Bongiorno et al. 2014, but see also U12, where a fraction of their sample show undermassive / values). Instead, assuming from 1–2 AGNs (Ding et al. 2020; Suh et al. 2020), we find that the Sérsic index (Sérsic, 1963) for luminous, obscured quasars should still be 2.5–3 times larger than for the typical AGN for to be boosted by an order of magnitude, which is likewise a stringent condition. Therefore, we find that nuclear stars themselves are less likely to shift values enough to falsify our results.
We note that the IR-luminous, obscured quasars appear to show higher values compared to obscured (type 1.8–2), X-ray-selected quasars at matched luminosity. The type 1.8–2 sources in R17c have values 20%, still avoiding the forbidden region by factors of several compared to the IR-luminous, obscured quasars at . We caution that the IR luminous, obscured quasars are intrinsically different from the obscured, BAT-selected quasars, however, as the /BAT survey is missing the distant, obscured quasar population often detected by deeper X-ray observations (e.g., Merloni et al. 2014; see the references in Table 1).
6 Discussion
The luminous, obscured quasars are known to be a substantial population in the intermediate-redshift universe, as their combined number density is comparable to that of unobscured quasars at matched luminosity (A15; B15a; Hamann et al. 2017; Glikman et al. 2018). As the typical values for quasars in this work are similar () for both the obscured and unobscured populations, the timescale of the luminous, obscured quasar phase with is presumed to be similar to that of the quasars. In contrast, the nearly complete absence of lower-luminosity AGNs with (§5) suggests a much shorter obscured phase for lower-luminosity AGNs. This appears as a challenge for the radiation-pressure feedback in regulating the nuclear obscuration for luminous quasars, and we next consider possible evolutionary scenarios to achieve a coherent picture of dust obscuration in luminous quasars.
6.1 Active timescale
First, the AGN timescale (hereafter ) is thought to be shorter for more luminous quasars, and this may explain higher values for luminous quasars. The nearby AGN fraction is measured to be tens of percent of the galaxy lifetime (e.g., Ho et al. 1997; Kauffmann et al. 2003), with a corresponding of yr assuming typical galaxy lifetimes of yr. More luminous quasars are more rare, with expected yr (e.g., Martini 2004; Hopkins et al. 2005; Hopkins & Hernquist 2009). To explain 1–10% for AGNs in Figure 5, we constrain the timescale for radiation pressure to clear the nuclear obscuration (hereafter the radiation feedback timescale, ) to be yr. Assuming that luminous, obscured quasars will evolve into comparably luminous unobscured quasars through radiation-pressure feedback, so as to explain the comparable number density between the populations, for luminous () quasars with 60% would be yr, roughly comparable to for less-luminous AGNs. We note that if AGN activity is more episodic (e.g., Park & Ricotti 2011; Yajima et al. 2017), feedback timescales may be shortened accordingly, although it seems more likely that luminous quasars have few episodes of vigorous accretion (e.g., Hopkins & Hernquist 2009). Luminous, obscured quasars may thus appear to show higher values due to a shorter than less-luminous, obscured AGNs, even if they feel the same radiation pressure.
We have referred to yr for quasars as a whole (e.g., mag or ), but if more luminous, obscured quasars are in a shorter phase of AGN evolution (shorter ), it better explains the highest values observed at . L20 note outflow timescales () for nuclear obscuration to clear away in an expanding shell by radiation pressure on dust,
| (5) |
finding yr for Compton-thick gas expanding from an initial distance of 30 pc until it reaches , assuming . If the dusty gas outflows are triggered by radiation pressure, we expect to be equal to . However, it is shorter than our estimated values for luminous quasars, by or 1–2 orders of magnitude. This can be explained if for quasars are 1–2 orders of magnitude shorter than the yr we adopt, qualitatively consistent with the drop of for more luminous quasars in simulations (e.g., Hopkins et al. 2005, 2006).
6.2 Extended obscuration
An alternative description is that it takes a longer for luminous, obscured quasars to clear their obscuration than at lower luminosity. Radiation pressure from luminous, obscured quasars should effectively reach larger distances in the galaxy according to the decreasing small-scale dust covering factor observed in high or AGNs (e.g., Maiolino et al. 2007; Toba et al. 2014; Ezhikode et al. 2017). Thus, observing high values in luminous, obscured quasars implies that dusty gas may be spatially extended into their hosts, in contrast to lower-luminosity AGNs. This is supported by observations of obscured quasars showing an extended distribution of disturbed emission (e.g., Sanders et al. 1988; Sanders & Mirabel 1996; Urrutia et al. 2008; Glikman et al. 2015; Fan et al. 2016; Ricci et al. 2017b). An increased fraction of obscured yet broad-line AGNs (e.g., Lacy et al. 2015; Glikman et al. 2018) or extended dust extinction through lines of sight kiloparsecs away from narrow-line AGNs are seen (§3) at quasar luminosities, also in agreement with global column densities much larger than the line-of-sight for red quasars (§3).
According to simplified models for AGNs and host galaxy obscuration at multiple scales (e.g., Buchner & Bauer 2017; Hickox & Alexander 2018), the host galaxy kiloparsecs away from the nucleus is responsible for , whereas obscuration from the inner AGN structure (10 pc) or circumnuclear starbursts (10–100 pc) can reach Compton-thick column densities. In addition, obscuration from gas-rich mergers (e.g., Hopkins et al. 2008) or higher gas fractions in high-redshift galaxies (e.g., Tacconi et al. 2010; Buchner & Bauer 2017) may enhance the obscuration up to kiloparsec scales. Coming back to Equation (5), we find that for luminous, obscured quasars will be extended by 1–2 orders of magnitude ( yr) if extended obscuration due to mergers is spread over pc, closing the gap between the timescale arguments (§6.1) without even changing . This scenario is also consistent with the values estimated by modeling expanding shells of dusty gas located pc away from luminous quasars (Ishibashi et al., 2017). We direct readers to the theoretical and observational studies on how the nuclear outflows triggered by radiation pressure extend to the host galaxy (e.g., Harrison et al. 2014; Ishibashi & Fabian 2015; Thompson et al. 2015; Ishibashi et al. 2017; Kang & Woo 2018).
Although the impact of radiation pressure from the AGN itself is weaker at extended regions of the galaxy, and R17c separate radiation-pressure feedback from inflows and outflows, radiation pressure has still been considered to launch outflows that may reach large distances (e.g., Hopkins & Elvis 2010 and the discussion in L20). In this work, we separately considered radiation pressure to regulate pc order obscuration and outflows pc scales, but note that radiation pressure is thought to cause extended outflows that eventually clear obscured quasars, according to gas-rich, merger-driven quasar evolution models (e.g., Hopkins et al. 2008; Hickox et al. 2009). Not only are the highly ionized gas outflows on the order of found in the majority of quasars with (or ), or (e.g., Woo et al. 2016; Rakshit & Woo 2018; Shin et al. 2019; Jun et al. 2020), they extend over kiloparsec scales together with Balmer line outflows with a weaker ionization potential or molecular outflows (e.g., Fiore et al. 2017; Kang et al. 2017; Fluetsch et al. 2019). This is in line with higher merger fractions seen in quasars (e.g., Treister et al. 2012; Fan et al. 2016; Díaz-Santos et al. 2018), which is also the transitional luminosity where radiation-pressure feedback appears less effective (Figure 5).
We thus consider radiation pressure to be responsible for regulating not only the 10 pc-order dusty structure (e.g., Lawrence 1991; R17c), but also the host galaxy environment in obscured quasars where the triggered nuclear outflows may reach and clear parsec-scale material, slowly over a timescale of yr. This is consistent with the high- AGN outflows discussed in R17c, though their sample lacked the luminous quasars that we argue are responsible for producing extended outflows at values. We summarize our discussion in Figure 6.
7 Summary
Using a collection of AGN samples spanning a wide dynamic range of luminosity, obscuration, and redshift, we probed the distribution of obscuration and accretion rate values to comparatively examine the role of radiation pressure in blowing out obscured quasars. We summarize our findings below:
1. The fraction of AGNs in the forbidden zone for radiation pressure, , is kept to 20% for all of the multi-wavelength-selected AGN samples compiled over a wide range of luminosity and redshift, consistent with previous findings that nuclear obscuration is quickly blown away by radiation pressure once the accretion rate exceeds the Eddington limit for dusty gas.
2. This radiation-pressure feedback, that is, the acceleration of nuclear dusty gas, appears limited for luminous, obscured quasars at or mag, and , where they show over a wide range of AGN selection wavelengths or amount of obscuration. This may be explained by a combination of shorter luminous quasar lifetimes and extended obscuration cleared by outflows over a longer timescale than to clear the nuclear obscuration.
Ultimately, we expect to see the values grow while luminous, obscured quasars become unobscured if extended outflows, slower than radiation pressure clearing the nuclear obscuration, are the bottleneck for AGN feedback. Ongoing hard X-ray surveys probing fainter sources (e.g., Lansbury et al. 2017; Oh et al. 2018) will confirm if distant, gas-obscured quasars are going through similar strengths of radiation-pressure feedback as dust-obscured quasars. Spatially resolved or global and estimates for luminous, obscured quasars will better tell whether obscuration is indeed more extended in luminous quasars and will quantify the relative effect of radiation pressure and outflows to their parsec-to-kiloparsec scale gas and dust environments.
References
- Alexander et al. (2005) Alexander, D. M., Bauer, F. E., Chapman, S. C., et al. 2005, ApJ, 632, 736
- Alexander et al. (2008) Alexander, D. M., Brandt, W. N., Smail, I., et al. 2008, AJ, 135, 1968
- Assef et al. (2015) Assef, R. J., Eisenhardt, P. R. M., Stern, D., et al. 2015, ApJ, 804, 27
- Assef et al. (2016) Assef, R. J., Walton, D. J., Brightman, M., et al. 2016, ApJ, 819, 111
- Assef et al. (2020) Assef, R. J., Brightman, M., Walton, D. J., et al. 2020, ApJ, 897, 112
- Baek et al. (2019) Baek, J., Chung, A., Schawinski, K., et al. 2019, MNRAS, 488, 4317
- Ballantyne et al. (2001) Ballantyne, D. R., Ross, R. R., & Fabian, A. C. 2001, MNRAS, 327, 10
- Banerji et al. (2012) Banerji, M., McMahon, R. G., Hewett, P. C., et al. 2012, MNRAS, 427, 2275
- Banerji et al. (2013) Banerji, M., McMahon, R. G., Hewett, P. C., Gonzalez-Solares, E., & Koposov, S. E. 2013, MNRAS, 429, L55
- Banerji et al. (2015) Banerji, M., Alaghband-Zadeh, S., Hewett, P. C., & McMahon, R. G. 2015, MNRAS, 447, 3368
- Baumgartner et al. (2013) Baumgartner, W. H., Tueller, J., Markwardt, C. B., et al. 2013, ApJS, 207, 19
- Barthelmy et al. (2005) Barthelmy, S. D., Barbier, L. M., Cummings, J. R., et al. 2005, Space Sci. Rev., 120, 143
- Bennert et al. (2011) Bennert, V. N., Auger, M. W., Treu, T., et al. 2011, ApJ, 742, 107
- Bentz et al. (2013) Bentz, M. C., Denney, K. D., Grier, C. J., et al. 2013, ApJ, 767, 149
- Bentz et al. (2009) Bentz, M. C., Peterson, B. M., Netzer, H., et al. 2009, ApJ, 697, 160
- Bentz & Katz (2015) Bentz, M. C., & Katz, S. 2015, PASP, 127, 67
- Blain et al. (2002) Blain, A. W., Smail, I., Ivison, R. J., et al. 2002, Phys. Rep., 369, 111
- Bohlin et al. (1978) Bohlin, R. C., Savage, B. D., & Drake, J. F. 1978, ApJ, 224, 132
- Bongiorno et al. (2014) Bongiorno, A., Maiolino, R., Brusa, M., et al. 2014, MNRAS, 443, 2077
- Brightman & Nandra (2011) Brightman, M. & Nandra, K. 2011, MNRAS, 413, 1206
- Brightman et al. (2015) Brightman, M., Baloković, M., Stern, D., et al. 2015, ApJ, 805, 41
- Brightman et al. (2016) Brightman, M., Masini, A., Ballantyne, D. R., et al. 2016, ApJ, 826, 93
- Buchner & Bauer (2017) Buchner, J., & Bauer, F. E. 2017, MNRAS, 465, 4348
- Burtscher et al. (2016) Burtscher, L., Davies, R. I., Graciá-Carpio, J., et al. 2016, A&A, 586, A28
- Chen & Halpern (1989) Chen, K. & Halpern, J. P. 1989, ApJ, 344, 115
- Collin et al. (2006) Collin, S., Kawaguchi, T., Peterson, B. M., & Vestergaard, M. 2006, A&A, 456, 75
- Corral et al. (2016) Corral, A., Georgantopoulos, I., Comastri, A., et al. 2016, A&A, 592, A109
- Dey et al. (2008) Dey, A., Soifer, B. T., Desai, V., et al. 2008, ApJ, 677, 943
- Díaz-Santos et al. (2018) Díaz-Santos, T., Assef, R. J., Blain, A. W., et al. 2018, Science, 362, 1034
- Ding et al. (2020) Ding, X., Silverman, J., Treu, T., et al. 2020, ApJ, 888, 37
- Du et al. (2014) Du, P., Hu, C., Lu, K.-X., et al. 2014, ApJ, 782, 45
- Eisenhardt et al. (2012) Eisenhardt, P. R. M., Wu, J., Tsai, C.-W., et al. 2012, ApJ, 755, 173
- Eracleous & Halpern (1994) Eracleous, M. & Halpern, J. P. 1994, ApJS, 90, 1
- Ezhikode et al. (2017) Ezhikode, S. H., Gandhi, P., Done, C., et al. 2017, MNRAS, 472, 3492
- Fabian et al. (2006) Fabian, A. C., Celotti, A., & Erlund, M. C. 2006, MNRAS, 373, L16
- Fabian et al. (2008) Fabian, A. C., Vasudevan, R. V., & Gandhi, P. 2008, MNRAS, 385, L43
- Fabian et al. (2009) Fabian, A. C., Vasudevan, R. V., Mushotzky, R. F., et al. 2009, MNRAS, 394, L89
- Fan et al. (2016) Fan, L., Han, Y., Nikutta, R., et al. 2016, ApJ, 822, L32
- Fluetsch et al. (2019) Fluetsch, A., Maiolino, R., Carniani, S., et al. 2019, MNRAS, 483, 4586
- Fiore et al. (2017) Fiore, F., Feruglio, C., Shankar, F., et al. 2017, A&A, 601, A143
- Gehrels et al. (2004) Gehrels, N., Chincarini, G., Giommi, P., et al. 2004, ApJ, 611, 1005
- Glikman (2017b) Glikman, E. 2017b, Research Notes of the American Astronomical Society, 1, 48
- Glikman et al. (2007) Glikman, E., Helfand, D. J., White, R. L., et al. 2007, ApJ, 667, 673
- Glikman et al. (2018) Glikman, E., Lacy, M., LaMassa, S., et al. 2018, ApJ, 861, 37
- Glikman et al. (2017a) Glikman, E., LaMassa, S., Piconcelli, E., Urry, M., & Lacy, M. 2017a, ApJ, 847, 116
- Glikman et al. (2015) Glikman, E., Simmons, B., Mailly, M., et al. 2015, ApJ, 806, 218
- Glikman et al. (2012) Glikman, E., Urrutia, T., Lacy, M., et al. 2012, ApJ, 757, 51
- Goulding et al. (2018) Goulding, A. D., Zakamska, N. L., Alexandroff, R. M., et al. 2018, ApJ, 856, 4
- Greene et al. (2014) Greene, J. E., Alexandroff, R., Strauss, M. A., et al. 2014, ApJ, 788, 91
- Hamann et al. (2017) Hamann, F., Zakamska, N. L., Ross, N., et al. 2017, MNRAS, 464, 3431
- Harrison et al. (2014) Harrison, C. M., Alexander, D. M., Mullaney, J. R., & Swinbank, A. M. 2014, MNRAS, 441, 3306
- Harrison et al. (2013) Harrison, F. A., Craig, W. W., Christensen, F. E., et al. 2013, ApJ, 770, 103
- Heckman et al. (2004) Heckman, T. M., Kauffmann, G., Brinchmann, J., et al. 2004, ApJ, 613, 109
- Hickox & Alexander (2018) Hickox, R. C., & Alexander, D. M. 2018, ARA&A, 56, 625
- Hickox et al. (2009) Hickox, R. C., Jones, C., Forman, W. R., et al. 2009, ApJ, 696, 891
- Ho et al. (1997) Ho, L. C., Filippenko, A. V., & Sargent, W. L. W. 1997, ApJS, 112, 315
- Hopkins & Elvis (2010) Hopkins, P. F., & Elvis, M. 2010, MNRAS, 401, 7
- Hopkins et al. (2006) Hopkins, P. F., Hernquist, L., Cox, T. J., et al. 2006, ApJS, 163, 1
- Hopkins et al. (2005) Hopkins, P. F., Hernquist, L., Martini, P., et al. 2005, ApJ, 625, L71
- Hopkins & Hernquist (2009) Hopkins, P. F., & Hernquist, L. 2009, ApJ, 698, 1550
- Hopkins et al. (2008) Hopkins, P. F., Hernquist, L., Cox, T. J., & Kereš, D. 2008, ApJS, 175, 356
- Ichikawa et al. (2019) Ichikawa, K., Ricci, C., Ueda, Y., et al. 2019, ApJ, 870, 31
- Ishibashi et al. (2017) Ishibashi, W., Banerji, M., & Fabian, A. C. 2017, MNRAS, 469, 1496
- Ishibashi & Fabian (2015) Ishibashi, W. & Fabian, A. C. 2015, MNRAS, 451, 93
- Ishibashi et al. (2018) Ishibashi, W., Fabian, A. C., Ricci, C., et al. 2018, MNRAS, 479, 3335
- Jaffe et al. (2004) Jaffe, W., Meisenheimer, K., Röttgering, H. J. A., et al. 2004, Nature, 429, 47
- Jun & Im (2013) Jun, H. D., & Im, M. 2013, ApJ, 779, 104
- Jun et al. (2015) Jun, H. D., Im, M., Lee, H. M., et al. 2015, ApJ, 806, 109
- Jun et al. (2017) Jun, H. D., Im, M., Kim, D., & Stern, D. 2017, ApJ, 838, 41
- Jun et al. (2020) Jun, H. D., Assef, R. J., Bauer, F. E., et al. 2020, ApJ, 888, 110
- Kang et al. (2017) Kang, D., Woo, J.-H., & Bae, H.-J. 2017, ApJ, 845, 131
- Kang & Woo (2018) Kang, D., & Woo, J.-H. 2018, ApJ, 864, 124
- Kauffmann et al. (2003) Kauffmann, G., Heckman, T. M., Tremonti, C., et al. 2003, MNRAS, 346, 1055
- Kim & Im (2018) Kim, D., & Im, M. 2018, A&A, 610, A31
- Kim et al. (2015) Kim, D., Im, M., Glikman, E., Woo, J.-H., & Urrutia, T. 2015, ApJ, 812, 66
- Kim et al. (2010) Kim, D., Im, M., & Kim, M. 2010, ApJ, 724, 386
- King (2003) King, A. 2003, ApJ, 596, L27
- Kishimoto et al. (2008) Kishimoto, M., Antonucci, R., Blaes, O., et al. 2008, Nature, 454, 492
- Kishimoto et al. (2011) Kishimoto, M., Hönig, S. F., Antonucci, R., et al. 2011, A&A, 536, A78
- Kormendy & Ho (2013) Kormendy, J., & Ho, L. C. 2013, ARA&A, 51, 511
- Koss et al. (2017) Koss, M., Trakhtenbrot, B., Ricci, C., et al. 2017, ApJ, 850, 74
- Krimm et al. (2013) Krimm, H. A., Holland, S. T., Corbet, R. H. D., et al. 2013, ApJS, 209, 14
- Lacy et al. (2015) Lacy, M., Ridgway, S. E., Sajina, A., et al. 2015, ApJ, 802, 102
- LaMassa et al. (2016) LaMassa, S. M., Ricarte, A., Glikman, E., et al. 2016, ApJ, 820, 70
- LaMassa et al. (2017) LaMassa, S. M., Glikman, E., Brusa, M., et al. 2017, ApJ, 847, 100
- Lawrence (1991) Lawrence, A. 1991, MNRAS, 252, 586
- Lawrence et al. (2007) Lawrence, A., Warren, S. J., Almaini, O., et al. 2007, MNRAS, 379, 1599
- Lansbury et al. (2020) Lansbury, G. B., Banerji, M., Fabian, A. C., et al. 2020, MNRAS, 495, 2652
- Lansbury et al. (2017) Lansbury, G. B., Alexander, D. M., Aird, J., et al. 2017, ApJ, 846, 20
- Liu & Li (2015) Liu, Y. & Li, X. 2015, MNRAS, 448, L53
- Lusso et al. (2012) Lusso, E., Comastri, A., Simmons, B. D., et al. 2012, MNRAS, 425, 623
- Maiolino et al. (2001) Maiolino, R., Marconi, A., Salvati, M., et al. 2001, A&A, 365, 28
- Maiolino et al. (2010) Maiolino, R., Risaliti, G., Salvati, M., et al. 2010, A&A, 517, A47
- Maiolino et al. (2007) Maiolino, R., Shemmer, O., Imanishi, M., et al. 2007, A&A, 468, 979
- Marconi et al. (2004) Marconi, A., Risaliti, G., Gilli, R., et al. 2004, MNRAS, 351, 169
- Martini (2004) Martini, P. 2004, Coevolution of Black Holes and Galaxies, 169
- Martocchia et al. (2017) Martocchia, S., Piconcelli, E., Zappacosta, L., et al. 2017, A&A, 608, A51
- Massaro et al. (2015) Massaro, E., Maselli, A., Leto, C., et al. 2015, Ap&SS, 357, 75
- Merloni et al. (2014) Merloni, A., Bongiorno, A., Brusa, M., et al. 2014, MNRAS, 437, 3550
- Minezaki et al. (2019) Minezaki, T., Yoshii, Y., Kobayashi, Y., et al. 2019, ApJ, 886, 150
- Murphy & Yaqoob (2009) Murphy, K. D. & Yaqoob, T. 2009, MNRAS, 397, 1549
- Murray et al. (2005) Murray, N., Quataert, E., & Thompson, T. A. 2005, ApJ, 618, 569
- Oh et al. (2018) Oh, K., Koss, M., Markwardt, C. B., et al. 2018, ApJS, 235, 4
- Osterbrock (1979) Osterbrock, D. E. 1979, AJ, 84, 901
- Pâris et al. (2012) Pâris, I., Petitjean, P., Aubourg, É., et al. 2012, A&A, 548, A66
- Park & Ricotti (2011) Park, K., & Ricotti, M. 2011, ApJ, 739, 2
- Perrotta et al. (2019) Perrotta, S., Hamann, F., Zakamska, N. L., et al. 2019, MNRAS, 488, 4126
- Peterson et al. (2004) Peterson, B. M., Ferrarese, L., Gilbert, K. M., et al. 2004, ApJ, 613, 682
- Rakshit & Woo (2018) Rakshit, S., & Woo, J.-H. 2018, ApJ, 865, 5
- Ramos Almeida & Ricci (2017) Ramos Almeida, C., & Ricci, C. 2017, Nature Astronomy, 1, 679
- Ricci et al. (2017a) Ricci, C., Assef, R. J., Stern, D., et al. 2017a, ApJ, 835, 105
- Ricci et al. (2017b) Ricci, C., Bauer, F. E., Treister, E., et al. 2017b, MNRAS, 468, 1273
- Ricci et al. (2017c) Ricci, C., Trakhtenbrot, B., Koss, M. J., et al. 2017c, Nature, 549, 488
- Ricci et al. (2017d) Ricci, C., Trakhtenbrot, B., Koss, M. J., et al. 2017d, ApJS, 233, 17
- Richards et al. (2006) Richards, G. T., Lacy, M., Storrie-Lombardi, L. J., et al. 2006, ApJS, 166, 470
- Rigby et al. (2009) Rigby, J. R., Diamond-Stanic, A. M., & Aniano, G. 2009, ApJ, 700, 1878
- Risaliti et al. (2002) Risaliti, G., Elvis, M., & Nicastro, F. 2002, ApJ, 571, 234
- Risaliti et al. (2007) Risaliti, G., Elvis, M., Fabbiano, G., et al. 2007, ApJ, 659, L111
- Ross et al. (2015) Ross, N. P., Hamann, F., Zakamska, N. L., et al. 2015, MNRAS, 453, 3932
- Sanders & Mirabel (1996) Sanders, D. B., & Mirabel, I. F. 1996, ARA&A, 34, 749
- Sanders et al. (1988) Sanders, D. B., Soifer, B. T., Elias, J. H., et al. 1988, ApJ, 325, 74
- Schneider et al. (2010) Schneider, D. P., Richards, G. T., Hall, P. B., et al. 2010, AJ, 139, 2360
- Sérsic (1963) Sérsic, J. L. 1963, Boletin de la Asociacion Argentina de Astronomia La Plata Argentina, 6, 41
- Severgnini et al. (2001) Severgnini, P., Risaliti, G., Marconi, A., Maiolino, R., & Salvati, M. 2001, A&A, 368, 44
- Shakura & Sunyaev (1973) Shakura, N. I., & Sunyaev, R. A. 1973, A&A, 24, 337
- Shen et al. (2011) Shen, Y., Richards, G. T., Strauss, M. A., et al. 2011, ApJS, 194, 45
- Shen & Ho (2014) Shen, Y., & Ho, L. C. 2014, Nature, 513, 210
- Shin et al. (2019) Shin, J., Woo, J.-H., Chung, A., et al. 2019, ApJ, 881, 147
- Stern et al. (2014) Stern, D., Lansbury, G. B., Assef, R. J., et al. 2014, ApJ, 794, 102
- Suh et al. (2020) Suh, H., Civano, F., Trakhtenbrot, B., et al. 2020, ApJ, 889, 32
- Tacconi et al. (2010) Tacconi, L. J., Genzel, R., Neri, R., et al. 2010, Nature, 463, 781
- Temple et al. (2019) Temple, M. J., Banerji, M., Hewett, P. C., et al. 2019, MNRAS, 487, 2594
- Thompson et al. (2015) Thompson, T. A., Fabian, A. C., Quataert, E., et al. 2015, MNRAS, 449, 147
- Toba et al. (2017) Toba, Y., Bae, H.-J., Nagao, T., et al. 2017, ApJ, 850, 140
- Toba et al. (2020) Toba, Y., Yamada, S., Ueda, Y., et al. 2020, ApJ, 888, 8
- Toba et al. (2014) Toba, Y., Oyabu, S., Matsuhara, H., et al. 2014, ApJ, 788, 45
- Treister et al. (2012) Treister, E., Schawinski, K., Urry, C. M., et al. 2012, ApJ, 758, L39
- Tsai et al. (2015) Tsai, C.-W., Eisenhardt, P. R. M., Wu, J., et al. 2015, ApJ, 805, 90
- Urrutia et al. (2008) Urrutia, T., Lacy, M., & Becker, R. H. 2008, ApJ, 674, 80
- Urrutia et al. (2009) Urrutia, T., Becker, R. H., White, R. L., et al. 2009, ApJ, 698, 1095
- Urrutia et al. (2012) Urrutia, T., Lacy, M., Spoon, H., et al. 2012, ApJ, 757, 125
- Usman et al. (2014) Usman, S. M., Murray, S. S., Hickox, R. C., et al. 2014, ApJ, 788, L3
- Vasudevan & Fabian (2007) Vasudevan, R. V., & Fabian, A. C. 2007, MNRAS, 381, 1235
- Vietri et al. (2018) Vietri, G., Piconcelli, E., Bischetti, M., et al. 2018, A&A, 617, A81
- Vito et al. (2018) Vito, F., Brandt, W. N., Stern, D., et al. 2018, MNRAS, 474, 4528
- Winkler (1992) Winkler, H. 1992, MNRAS, 257, 677
- Woo et al. (2016) Woo, J.-H., Bae, H.-J., Son, D., & Karouzos, M. 2016, ApJ, 817, 108
- Woo et al. (2015) Woo, J.-H., Yoon, Y., Park, S., et al. 2015, ApJ, 801, 38
- Wu et al. (2018) Wu, J., Jun, H. D., Assef, R. J., et al. 2018, ApJ, 852, 96
- Yajima et al. (2017) Yajima, H., Ricotti, M., Park, K., et al. 2017, ApJ, 846, 3
- Young et al. (2009) Young, M., Elvis, M., & Risaliti, G. 2009, ApJS, 183, 17
- Zakamska et al. (2003) Zakamska, N. L., Strauss, M. A., Krolik, J. H., et al. 2003, AJ, 126, 2125
- Zakamska et al. (2005) Zakamska, N. L., Schmidt, G. D., Smith, P. S., et al. 2005, AJ, 129, 1212
- Zappacosta et al. (2018) Zappacosta, L., Piconcelli, E., Duras, F., et al. 2018, A&A, 618, A28