∎
2 Cryogenic Research Center, The University of Tokyo, 2-11-16, Yayoi, Bunkyo-ku, Tokyo 113-0032, Japan
Superconducting Niobium Calorimeter for Studies of Adsorbed Helium Monolayers
Abstract
We developed a calorimeter with a vacuum container made of superconducting niobium (Nb) to study monolayers of helium adsorbed on graphite which are prototypical two-dimensional quantum matters below 1 K. Nb was chosen because of its small specific heat in the superconducting state. It is crucially important to reduce the addendum heat capacity () when the specific surface area of substrate is small. Here we show details of design, construction and results of measurements of the Nb calorimeter down to 40 mK. The measured was sufficiently small so that we can use it for heat capacity measurements on helium monolayers in a wide temperature range below 1 K. We found a relatively large excess heat capacity in , which was successfully attributed to atomic tunneling of hydrogen (H) and deuterium (D) between trap centers near oxygen or nitrogen impurities in Nb. The tunnel frequencies of H and D deduced by fitting the data to the tunneling model are consistent with the previous experiments on Nb doped with H or D.
Keywords:
calorimeter, heat capacity, helium monolayer, gas-liquid transition, hydrogen tunneling1 Introduction
Atomically thin 4He and 3He films physisorbed on flat surfaces at low temperatures provide experimental opportunities for us to study bosonic and fermionic quantum phenomena, respectively, in two-dimensions (2D). Among them, a few layers of 4He and 3He adsorbed on graphite are of particular importance because of their rich quantum phase diagrams Bretz1973 ; Greywall1990 ; Greywall1993 ; Godfrin1995 ; Fukuyama2008 . Heat capacity measurements are one of the most sensitive experimental techniques to explore the phase diagrams in these systems. One important unsolved problem in this field is the possible self-binding of 3He, i.e., 2D liquefaction of 3He, which was claimed by Sato Sato2010 ; Sato2012 . They found that the uniform fluid state of areal densities lower than 0.6-0.9 nm-2 is unstable against phase separation into gas and liquid phases below 80 mK, the gas-liquid (G-L) coexistence. This theoretically unexpected finding stimulated new theoretical studies Ruggeri2013 ; Ruggeri2016 ; Gordillo2016c ; Gordillo2016b , and some of them Ruggeri2016 ; Gordillo2016b can partially explain the experimental results of Sato . but not sufficiently. Similar experimental indications of the self-binding are also reported in 2D 3He on different substrates from graphite Bhattacharyya1985 ; Csathy2002 .
In general, for studies of adsorbed 2D systems, comparison of heat capacity data obtained on substates with different surface coherence lengths () is crucially important for determining the true nature of detected phase transitions Bretz1977 . In the case of exfoliated graphite, the comparison can be done using Grafoil and ZYX substrates, where ZYX has a ten times longer ( nm) than Grafoil which is used in the most previous studies including the measurements by Sato . Thus, a new heat capacity measurement with ZYX is highly desirable to test if their results vary quantitatively or even qualitatively due to the finite size effects. In addition, it is important to observe the G-L critical point which may exist at temperatures 80 mK, the high temperature limit of the previous surveys Sato2010 ; Sato2012 . Besides the 2D liquefaction of 3He, there are many other interesting physics to be explored by heat capacity measurements in 2D He systems Morishita2001 ; Casey2003 ; Nakamura2016 ; Nyeki2017a .
The heat capacity contribution from the empty calorimeter (addendum) with ZYX should be minimized to keep reasonably good experimental accuracies, because the specific surface area of ZYX ( m2/g) is ten times smaller than that of Grafoil. Previously, Nakamura . constructed a calorimeter with a ZYX substrate in a container (sample cell) made of Nylon Nakamura2012 . Nylon is an easily machinable polymer with a sufficiently small specific heat below 1 K Pobell2007a . It worked well during the first several thermal cycles, but then started to leak because of many microcracks created by water absorbed inside the cell walls due to the high hygroscopy of Nylon. In order to overcome this technical problem, we have constructed a new calorimeter with a vacuum container made of niobium (Nb), containing the same ZYX substrate as that used in the previous Nylon calorimeter. Nb is a superconductor with the superconducting transition temperature () of 9.25 K. The specific heat of superconductors is known to fall off exponentially with decreasing temperature below and in proportion to below about due to decreasing numbers of normal state electrons and thermal phonons, respectively. Thus the addendum of Nb calorimeter is expected to be very small below 1 K.
In this article, we report design details and measurement results of the addendum heat capacity of the Nb calorimeter. It turned out that the measured addendum is as low as that of the previous Nylon calorimeter but is at least twice as large as the estimation based on the amounts of all construction materials of the cell and their known specific heats. By comparing with a theoretical estimation for heat capacities due to atomic tunneling of hydrogen and deuterium impurities trapped by oxygen or nitrogen impurities in Nb, we concluded that the measured excess heat capacity comes from these contributions.
2 Experimental
There are three basic concepts in our calorimeter design. The first is to minimize the addendum heat capacity, of course. The second is to increase thermal conductances among essential parts, such as the ZYX substrate, a thermometer and a heater, as high as possible to realize a short internal thermal relaxation time over the whole measurement temperature range. The third is to achieve a tunability of the thermal conductance between the calorimeter and the base temperature plate of a refrigerator so that the same calorimeter can be used in a wide temperature () range from 1 K to even below 1 mK depending on the experiment.
To meet these requirements, we carefully chose the other construction materials, besides superconducting Nb, as well as the thermal contact and isolation methods. For example, no stainless steel or BeCu parts such as bolts and nuts to tighten demountable thermal contacts were used in order to reduce the addendum heat capacity. Instead, a specially manufactured alloy, Si0.15Ag0.85 (Tokuriki Honten Co., Ltd.), was used for this purpose. Most of the thermal links are made of high purity silver (Ag) (Tokuriki Honten Co., Ltd.; 99.999%) rather than copper (Cu), since higher residual resistivity ratios (RRRs) of up to 3000 can more easily be obtained for Ag than Cu by a simple heat treatment at 630∘C for 2 h in an oxygen pressure of 0.1 Pa unless the size effect limits RRR. The mechanism behind this heat treatment is the “internal oxidation and segregation” of magnetic impurities in noble metals Ehrlich1974 . Due to the higher RRR value, we could reduce the amount of Ag used.
To our knowledge, Nb has never been used as a main construction material in previously developed vacuum chambers for low- experiments. This is presumably because it does not seem easy to make a leak-proof seal for Nb which cannot be soldered. Note that Nb has a very small thermal contraction Wang1998 compared to typical epoxy sealants for cryogenic applications such as Stycast 1266 or 2850FT. It was also unknown for us if commercially available Nb materials are helium leak-proof or not. Therefore, we first confirmed the leak-proofness of a prototypical Nb cell sealed with Stycast 1266 at K, and then constructed the actual sample cell.
Fig. 1 shows a schematic drawing and a photograph of the calorimeter constructed in this work. The sample cell consists of three Nb parts: the (a)circular top and (b)bottom covers of 45 mm in outer diameter and the (c)main cell body with a rectangular inner cross section of 2233 mm2. They are machined from a single Nb rod (Changsha South Tantalum Niobium Co., Ltd.). Typical impurity concentrations in the Nb rod (at.% purity, RRR ) provided by the supplier are C (37ppm), N (8ppm), O (95ppm), Si (1ppm), Fe (6ppm), Ni (7ppm), Mo (10ppm), Ta (460ppm), and W (12ppm).
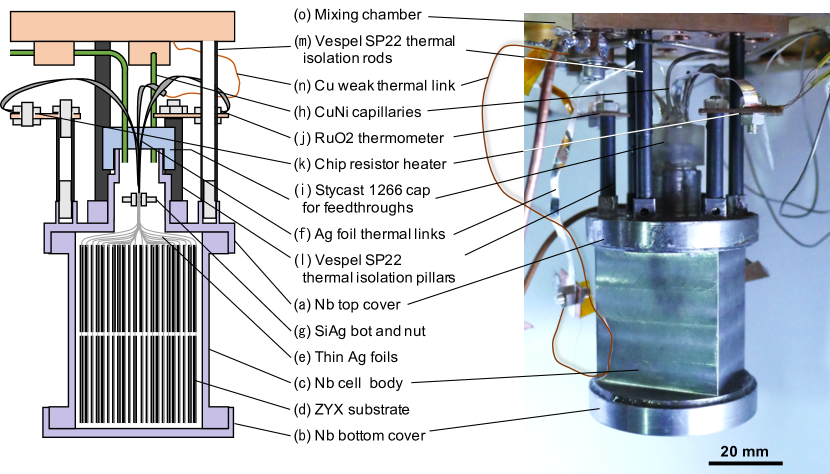
The (d)adsorption substrate consists of ZYX plates (1 mm thick each). Every two such ZYX plates are diffusively bonded on both sides of a 50 m thick Ag foil to assist thermalization of the substrate. Details of the original substrate preparation are reported elsewhere Nakamura2012 . The ZYX substrate was taken out of the previous Nylon cell and was baked at 110∘C for 10 h in vacuum. Then, it was enclosed in the new Nb cell and sealed with Stycast 1266 in a glove box with a nitrogen (N2) atmosphere. The (e)thin Ag foils are tightly connected to (f)three thick Ag foils (0.2 mm thickness) with the (g)SiAg bolt and nuts inside the cell. The thick Ag foils and (h)two CuNi capillaries (0.6 mm inner diameter) are fed through a (i)small Stycast 1266 cap on the top Nb cover which are sealed with Stycast 1266. One of the CuNi capillaries is for sample filling, and the other is to connect the cell to a low- strain pressure gauge (not shown in the figure) to measure sample gas pressure . After curing the bond, the calorimeter was taken out from the glove box and assembled underneath the mixing chamber plate of a dilution refrigerator as described below. No He leak was detected from the Nb cell ( ccSTP/s) when 4He gas of Pa was introduced to the cell at K.
Two of the three thick Ag foils thermally connect the (j)RuO2 thermometer and the (k)heater to the ZYX substrate directly. The last one connects the substrate with the mixing chamber through a weak thermal link. The thermometer, which monitors the substrate temperature, is a RuO2 chip register (Alps Electric Co., Ltd., 470 ) wrapped in a silver foil of 50 m thickness. This foil serves not only as a thermal link but also as a radiation shield for the register. As the heater element for heat capacity measurements, we used a metal thin film resistor (Susumu Co., Ltd., 100 ). The thermometer and the heater are supported from the Nb top cover with (l)thermal isolation pillars made of Vespel SP22 (E. I. du Pont de Nemours and Company).
The Nb cell is supported from the mixing chamber plate with (m)three Vespel SP22 rods. The (n)weak thermal link, which consists of two copper wires of 0.1 mm in diameter and 10 cm in length (RRR ), connects between the ZYX substrate and the (o)mixing chamber with a moderate thermal conductance so that we can employ the quasi-adiabatic heat pulse method Nakamura2013s for heat capacity measurements in the temperature range of 40 mK K. When the cell is empty, the measured internal thermal relaxation time is a few seconds, and the relaxation time between the substrate and the mixing chamber plate is 20 to 90 s in this temperature range. An ambient heat leak to the cell was measured as 10 nW below 200 mK. Under this heat leak, the lowest attainable temperature of the substrate is 40 mK, while the base temperature of the mixing temperature is 18 mK. We didn’t employ a superconducting heat switch nor a mechanical heat switch not only to simplify the cell design but also to avoid large heat generation when they open at the lowest temperature. In Table 1, we list amounts of all materials used in the present calorimeter.
| symbol | material | weight (g) |
|---|---|---|
| A | niobium | 200 |
| B | silver | 20 |
| C | copper | 4.3 |
| D | ZYX exfoliated graphite | 19 |
| E | Stycast 1266 | 2 |
3 Results and discussion
Figure 2(a) shows the measured addendum heat capacity () of the present Nb cell (: (yellow) dots). It has a steep temperature dependence at as is expected for superconductors. Thus, is much smaller than of the sample cell made of silver, a normal metal, (: (blue) dashed dotted line Sato2012 ), where the specific heat of conduction electrons falls slowly in proportion to the temperature at K. In the figure, the peak drawn by the (purple) line at K (anomaly-1) is the heat capacity () anomaly associated with the G-L transition in the second layer of 4He adsorbed on Grafoil Greywall1993 (areal density 14 nm-2) whose magnitude is normalized to be consistent with the surface area of our substrate. Our Nb calorimeter would be able to detect this anomaly, since the peak height is larger than by a factor of two at the same temperature. The kink at K drawn by the (pink) line (anomaly-2) in the figure is the anomaly associated possibly with the G-L transition in 3He submonolayer (0.092 layers) floating on a 1.23 nm-thick superfluid 4He film adsorbed on Nuclepore substrate Bhattacharyya1985 . is about seven times smaller than this anomaly at the same temperature, which indicates that its detection would be much easier than the 0.7 K anomaly. As mentioned in Introduction, the possible G-L critical temperature () in monolayers of 3He, which we are seeking for, is expected to emerge at mK. The upper bound should be mK in the second layer of 4He on Grafoil Greywall1991 . Note that in 3He systems should be lower than in 4He systems due to larger zero-point energies. Although the phase transition nature is unknown, the magnitude of the expected anomaly would not be so different from those of the two above-mentioned anomalies that were found previously in different 2D He systems. Therefore, we expect to detect the possible finite- G-L transition of 3He in 2D with this Nb calorimeter which is immune from moisture brittleness unlike the Nylon cell.
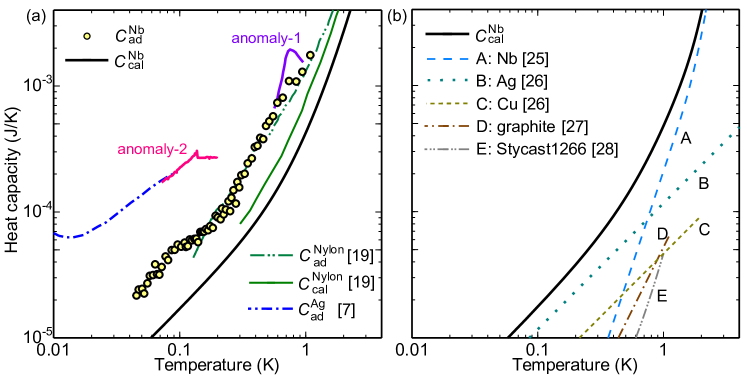
As can be seen in Fig. 2(a), is substantially larger than the calculated addendum heat capacity (; (black) thick solid line) in the whole temperature range we studied. We denote the excess heat capacity as . Here, is evaluated from the known properties of all construction materials used in the cell (see Table 1). The contribution from the Nb cell walls to is dominant at K, while that from the Ag parts is dominant at lower temperatures (see Fig. 2(b)). The Nylon cell seems to have a similar but slightly smaller excess heat capacity () than . In Fig. 2(a), the measured addendum heat capacity and the calculated one are also shown by the (green) dashed double-dotted line and the (green) thin line, respectively Nakamura2012 .
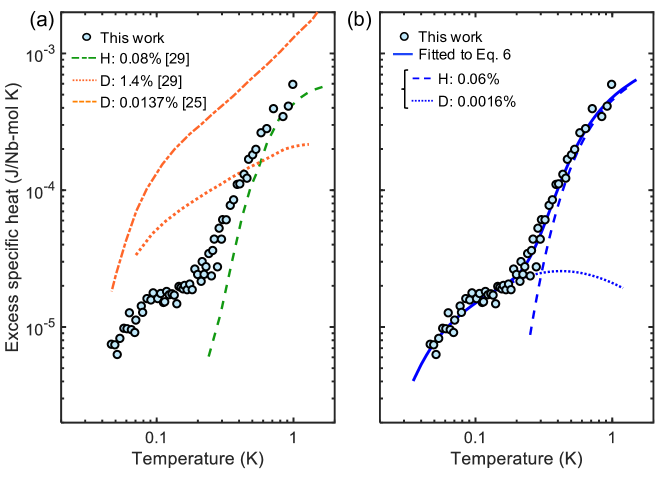
The observed large can be explained by atomic tunneling of hydrogen (H) or deuterium (D) impurities trapped by trap centers such as oxygen (O) or nitrogen (N) in Nb Wipf1984 . Figure 3(a) shows the excess specific heat of our Nb cell , i.e., divided by the molar amount of Nb used in the calorimeter, ((blue) dots). The data seem to consist of two components. One component, which dominates at high temperatures, rapidly falls down with decreasing. The other one dominates below 0.2 K. Also shown in Fig. 3(a) are excess specific heats obtained by the previous workers for Nb samples with H of 0.08at% ((green) dashed dotted line Wipf1984 ), D of 0.0137at% ((orange) dashed line Sellers1974 ) and 1.4at% ((orange) dotted line Wipf1984 ) introduced after high-vacuum annealing. Here the concentrations of H and D in the data of Ref. Wipf1984 are those determined by the authors themselves, and those of Ref. Sellers1974 are obtained by fitting their data by ourselves with functional forms described below. Note that the measured specific heat of the Nb sample after the high-vacuum annealing at 2250∘C in Ref. Sellers1974 follows almost exactly expected from the Debye model (lattice vibrations). All the data shown in Fig. 3 are plotted after subtracting the contribution. As can be seen in the figure, the high- component of our data is likely due to the H tunneling and the low- one due to the D tunneling.
Based on the above-mentioned scenario, we analyzed our data, , quantitatively following the method described in Ref. Wipf1984 as follows. The energy splitting of the ground state for a particle in an asymmetric double well potential is given by
| (1) |
where is the tunnel frequency, and is the potential energy difference between the two minima caused by a random arrangement of neighboring O(N)-H or O(N)-D complexes. Such has a distribution approximated by the Lorentzian distribution function Stoneham1969 :
| (2) |
Here the width is the typical energy difference of the double well. The specific heat of this tunneling system per one O(N)-H(D) complex, , can be written as
| (3) |
where
| (4) |
| (5) |
and is the Boltzmann constant. Finally, we fit our data to the following expression:
| (6) |
where is Avogadro’s number, and and are the concentrations of O-H and O-D complexes in Nb, respectively. Here, stands for H or D.
| [K] | [%] | [K] | [K] | [%] | [K] | Ref. | |||||||
| 1. | 85(9) | 0. | 06(2) | 12( | 5) | 0. | 11(9) | 0. | 0016(5) | 0 | .9(5) | This work | |
| 1. | 5(1) | 0. | 017(3) | 5( | 1) | — | — | — | Sellers1974 | ||||
| — | — | — | 0. | 2(1) | 0. | 0137(4) | 2 | .9(3) | Sellers1974 | ||||
| 1. | 8(6) | 0. | 08 | 21( | 4) | — | — | — | Wipf1984 | ||||
| 2. | 0(2) | 0. | 24 | 58( | 2) | — | — | — | Wipf1984 | ||||
| — | — | — | 0. | 21(4) | 0. | 05 | 10 | (10) | Wipf1984 | ||||
| — | — | — | 0. | 2(1) | 0. | 26 | 33 | (1) | Wipf1984 | ||||
| — | — | — | 0. | 2(3) | 1. | 4 | 88 | (7) | Wipf1984 | ||||
The fitting result is shown as the (blue) solid line in Fig. 3(b), and the fitting parameters are summarized in Table 2. In the whole temperature range, the fitting quality is satisfactory. The deduced values, K and K, are in reasonable agreement with the previous workers’ results: K and K obtained by heat capacity measurements by Wipf and Neumaier (WN) Wipf1984 and neutron spectroscopy measurement Wipf1981 . The larger error bar in our estimation is due to the much lower deuterium concentration in our as-received Nb sample compared to those in the previous workers’ samples into which the D impurities were intentionally doped after cleaning by the high-vacuum annealing. It is known that is independent of , whereas increases rapidly with increasing Wipf1984 . Our data are consistent with these trends. Overall, it is strongly suggested that the measured excess heat capacity in the addendum of our calorimeter is due to atomic tunneling of hydrogen isotopes embedded in the Nb parts.
4 Conclusions
We developed the calorimeter that is mainly made of Nb for the study of low temperature properties of He monolayers adsorbed on a ZYX graphite substrate. The use of Nb is because of its small contribution to the addendum heat capacity, , in the superconducting state. The measured moderate thermal relaxation time, lowest attainable temperature (40 mK) and the small meet the requirements to detect subtle heat capacity anomalies associated with phase transitions in adsorbed He systems in the temperature range between 40 mK and 1 K. One promising application is the possible finite- gas-liquid transitions in 3He monolayers expected to be observable at temperatures between 80 and 740 mK.
We also found the additional heat capacity (), an excess over the expected addendum heat capacity that is calculated from the known specific heats of construction materials. can be explained by atomic tunneling of hydrogen (H) and deuterium (D) impurities in Nb. The tunneling frequencies of H and D obtained by fitting the data to this model are consistent with those obtained in the previous studies. If one can anneal Nb parts in a high vacuum at C before assembling the cell, would be further reduced by a factor of three providing a further improvement in the resolution of heat capacity measurement.
Acknowledgements.
We are grateful to Sachiko Nakamura for helpful discussions and sharing her technical experiences on the construction of the previous Nylon calorimeter with us. The authors appreciate Megumi A. Yoshitomi for her contributions to the early stage of this work. We also thank Ryo Toda and Satoshi Murakawa for their valuable discussions and the machine shop of the School of Science, the University of Tokyo for machining the Nb calorimeter. This work was financially supported by JSPS KAKENHI Grant Number JP18H01170. J.U. was supported by Japan Society for the Promotion of Science (JSPS) through Program for Leading Graduate Schools (MERIT) and Grant-in-Aid for JSPS Fellows JP20J12304.References
- (1) M. Bretz, J.G. Dash, D.C. Hickernell, E.O. McLean, O.E. Vilches, Physical Review A 8, 1589 (1973). DOI 10.1103/PhysRevA.8.1589. URL https://journals.aps.org/pra/pdf/10.1103/PhysRevA.8.1589
- (2) D.S. Greywall, Physical Review B 41, 1842 (1990). DOI 10.1103/PhysRevB.41.1842
- (3) D.S. Greywall, Physical Review B 47, 309 (1993). DOI 10.1103/PhysRevB.47.309. URL papers2://publication/uuid/54FF4ADA-514F-45FA-8785-1C1DBA018BC9
- (4) H. Godfrin, H.J. Lauter, Progress in Low Temperature Physics 14, 213 (1995). DOI 10.1016/S0079-6417(06)80018-1
- (5) H. Fukuyama, Journal of the Physical Society of Japan 77, 111013 (2008). DOI 10.1143/JPSJ.77.111013
- (6) D. Sato, D. Tsuji, S. Takayoshi, K. Obata, T. Matsui, H. Fukuyama, Journal of Low Temperature Physics 158, 201 (2010). DOI 10.1007/s10909-009-0013-x
- (7) D. Sato, K. Naruse, T. Matsui, H. Fukuyama, Physical Review Letters 109, 235306 (2012). DOI 10.1103/PhysRevLett.109.235306
- (8) M. Ruggeri, S. Moroni, M. Boninsegni, Physical Review Letters 111, 045303 (2013). DOI 10.1103/PhysRevLett.111.045303. URL https://link.aps.org/doi/10.1103/PhysRevLett.111.045303
- (9) M. Ruggeri, E. Vitali, D.E. Galli, M. Boninsegni, S. Moroni, Physical Review B 93, 104102 (2016). DOI 10.1103/PhysRevB.93.104102. URL https://journals.aps.org/prb/pdf/10.1103/PhysRevB.93.104102
- (10) M.C. Gordillo, J. Boronat, Physical Review Letters 116, 145301 (2016). DOI 10.1103/PhysRevLett.116.145301. URL https://journals.aps.org/prl/pdf/10.1103/PhysRevLett.116.145301
- (11) M.C. Gordillo, J. Boronat, Physical Review B 94, 165421 (2016). DOI 10.1103/PhysRevB.94.165421. URL https://journals.aps.org/prb/pdf/10.1103/PhysRevB.94.165421
- (12) B.K. Bhattacharyya, F.M. Gasparini, Physical Review B 31, 2719 (1985). DOI 10.1103/PhysRevB.31.2719. URL https://journals.aps.org/prb/pdf/10.1103/PhysRevB.31.2719
- (13) G.A. Csáthy, E. Kim, M.H. Chan, Physical Review Letters 88, 045301 (2002). DOI 10.1103/PhysRevLett.88.045301
- (14) M. Bretz, Physical Review Letters 38, 501 (1977). DOI 10.1103/PhysRevLett.38.501
- (15) M. Morishita, T. Takagi, Physical Review Letters 87, 185301 (2001). DOI 10.1103/PhysRevLett.87.185301
- (16) A. Casey, H. Patel, J. Nyéki, B.P. Cowan, J. Saunders, Physical Review Letters 90, 115301 (2003). DOI 10.1103/PhysRevLett.90.115301
- (17) S. Nakamura, K. Matsui, T. Matsui, H. Fukuyama, Physical Review B 94, 180501 (2016). DOI 10.1103/PhysRevB.94.180501
- (18) J. Nyéki, A. Phillis, A. Ho, D. Lee, P. Coleman, J. Parpia, B. Cowan, J. Saunders, Nature Physics 13, 455 (2017). DOI 10.1038/nphys4023
- (19) S. Nakamura, K. Matsui, T. Matsui, H. Fukuyama, Journal of Physics: Conference Series 400, 032061 (2012). DOI 10.1088/1742-6596/400/3/032061
- (20) F. Pobell, Matter and methods at low temperatures (Springer, 2007)
- (21) A.C. Ehrlich, Journal of Materials Science 9, 1064 (1974). DOI 10.1007/BF00552819
- (22) K. Wang, R.R. Reeber, Materials Science and Engineering R: Reports 23, 101 (1998). DOI 10.1016/S0927-796X(98)00011-4
- (23) S. Nakamura, K. Matsui, T. Matsui, H. Fukuyama, Journal of Low Temperature Physics 171, 711 (2013). DOI 10.1007/s10909-012-0847-5. URL https://link.springer.com/content/pdf/10.1007%2Fs10909-012-0847-5.pdf
- (24) D.S. Greywall, P.A. Busch, Physical Review Letters 67, 3535 (1991). DOI 10.1103/PhysRevLett.67.3535. URL https://link.aps.org/doi/10.1103/PhysRevLett.67.3535
- (25) G.J. Sellers, A.C. Anderson, H.K. Birnbaum, Physical Review B 10, 2771 (1974). DOI 10.1103/PhysRevB.10.2771. URL https://journals.aps.org/prb/pdf/10.1103/PhysRevB.10.2771
- (26) D.L. Martin, Physical Review 170, 650 (1968). DOI 10.1103/PhysRev.170.650
- (27) B.J. Van Der Hoeven, P.H. Keesom, J.W. McClure, G. Wagoner, Physical Review 152, 796 (1966). DOI 10.1103/PhysRev.152.796
- (28) M.L. Siqueira, R.E. Rapp, Cite as: Review of Scientific Instruments 62, 2499 (1991). DOI 10.1063/1.1142224. URL https://doi.org/10.1063/1.1142224
- (29) H. Wipf, K. Neumaier, Physical Review Letters 52, 1308 (1984). DOI 10.1103/PhysRevLett.52.1308. URL https://journals.aps.org/prl/pdf/10.1103/PhysRevLett.52.1308
- (30) A.M. Stoneham, Reviews of Modern Physics 41, 82 (1969). DOI 10.1103/RevModPhys.41.82. URL https://journals.aps.org/rmp/abstract/10.1103/RevModPhys.41.82
- (31) H. Wipf, S.M. Shapiro, S.K. Satija, W. Thomlinson, Phys. Rev. Lett. 46, 947 (1981)