Rise of the Titans: Gas Excitation and Feedback in a Binary Hyper-Luminous Dusty Starburst Galaxy at 6
Abstract
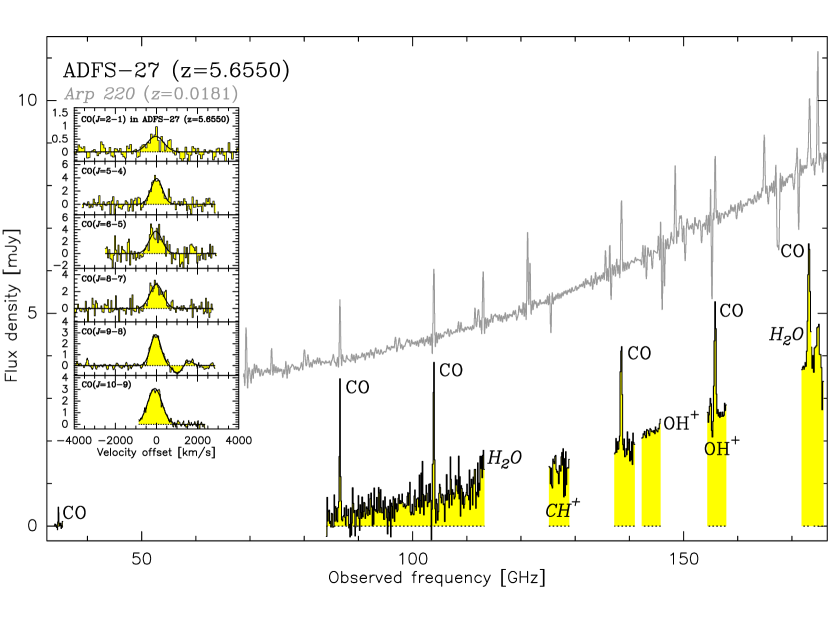
We report new observations toward the hyper-luminous dusty starbursting major merger ADFS-27 (=5.655), using the Australia Telescope Compact Array (ATCA) and the Atacama Large Millimeter/submillimeter Array (ALMA). We detect CO(=21), CO(=87), CO(=98), CO(=109), and H2O(312221) emission, and a P-Cygni-shaped OH+(1101) absorption/emission feature. We also tentatively detect H2O(321312) and OH+(1201) emission and CH+(=10) absorption. We find a total cold molecular mass of =(2.10.2)1011 . We also find that the excitation of the star-forming gas is overall moderate for a 5 dusty starburst, which is consistent with its moderate dust temperature. A high density, high kinetic temperature gas component embedded in the gas reservoir is required to fully explain the CO line ladder. This component is likely associated with the “maximum starburst” nuclei in the two merging galaxies, which are separated by only (14013) km s-1 along the line of sight and 9.0 kpc in projection. The kinematic structure of both components is consistent with galaxy disks, but this interpretation remains limited by the spatial resolution of the current data. The OH+ features are only detected towards the northern component, which is also the one that is more enshrouded in dust and thus remains undetected up to 1.6 m even in our sensitive new Hubble Space Telescope Wide Field Camera 3 imaging. The absorption component of the OH+ line is blueshifted and peaks near the CO and continuum emission peak while the emission is redshifted and peaks offset by 1.7 kpc from the CO and continuum emission peak, suggesting that the gas is associated with a massive molecular outflow from the intensely star-forming nucleus that supplies 125 yr-1 of enriched gas to its halo.
1 Introduction
With infrared luminosities 1013 , hyper-luminous infrared galaxies (HyLIRGs; e.g., Sanders & Mirabel 1996; Rowan-Robinson 2000) represent the most intensely star-forming galaxies through cosmic history. While rare at any epoch, they are particularly exceptional in the early universe within the first billion years, when structure formation had not yet sufficiently matured to allow for the presence of a substantial abundance of the most massive dark matter halos that are thought to host such systems (e.g., Robson et al. 2014, and references therein). The majority of their star formation activity, taking place at rates of SFR1000 yr-1, and even the already existing stellar populations, are commonly hidden from our view due to high levels of dust obscuration (e.g., Simpson et al. 2020, and references therein). This makes them the most luminous, and perhaps most massive tail of the dusty star-forming galaxy (DSFG) population (e.g., Hodge & da Cunha 2020, and references therein). The star formation activity in HyLIRGs is typically driven by major mergers (e.g., Engel et al. 2010; Oteo et al. 2016; Riechers et al. 2017). It commonly takes place in compact regions only one to a few kiloparsecs across, which are permeated by intense radiation fields powered by the large quantities of massive stars that were just born, and impacted by mechanical feedback due to ejecta from evolved stars and supernova explosions (e.g., Riechers et al. 2013; 2014; 2017; 2020; Fu et al. 2013; Ivison et al. 2013; Tadaki et al. 2020). This radiation pressure and mechanical feedback can lead to large-scale turbulence, winds and outflows, which deposit enriched gas in the galaxy’s halo. This gas can be traced through absorption in molecular species like OH+ and CH+, back to the first billion years of cosmic history, as demonstrated by detections in the 6 HyLIRG HFLS3 (Riechers et al. 2013) and detailed investigations of the line profiles in a sample of strongly-lensed 2 DSFGs (Falgarone et al. 2017; Indriolo et al. 2018). These compact starburst regions are commonly characterized by a high excitation of the molecular gas due to a high gas density and kinetic temperature (as traced by the CO rotational line ladder), and they may be embedded in more extended, massive cold gas reservoirs that supply the material to support the starburst activity on tens to 100 Myr timescales (e.g., Greve et al. 2005; Tacconi et al. 2008; Riechers et al. 2010; 2011; 2020; Ivison et al. 2011; Hodge et al. 2015).
We here report new observations of the hyper-luminous binary starburst ADFS-27 at =5.655 (2HERMES S250 SF J043657.7–543810; Riechers et al. 2017) with ATCA, ALMA, and the Hubble Space Telescope, to obtain a more detailed understanding of the physical properties of such exceptionally luminous systems. ADFS-27 was initially discovered in the Herschel Multi-tiered Extragalactic Survey (HerMES; Oliver et al. 2012) combined with follow-up observations with the Atacama Pathfinder EXperiment (APEX) telescope through its exceptionally “red” color between the 250 and 870 m bands, which make it the only known dusty point source in the survey that fulfills the “870 m riser” criterion (i.e., ; Riechers et al. 2017). This work investigates the stellar light emerging from the system, the mass of its gas reservoir, the gas excitation, and evidence for starburst-driven feedback. We present the data and their calibration in Section 2, before discussing the immediate results and presenting a broader analysis, informed by models, in Sections 3 and 4. A summary and conclusions are given in Section 5. We use a concordance, flat CDM cosmology throughout, with = 69.6 km s-1 Mpc-1, = 0.286, and = 0.714. At =5.655, 1′′ on the sky corresponds to 6.026 kpc with these parameters, the luminosity distance is =55044.8 Mpc, and the time since the Big Bang is =1.016 Gyr.
2 Data
2.1 ATCA
We observed the CO(=21) line (=230.5380 GHz, redshifted to =34.6413 GHz) toward ADFS-27 using ATCA (project ID: C3226; PI: Riechers). Observations were carried out under acceptable to good weather conditions for two tracks on 2017 October 05 and 06 using the 7 mm band receivers in the H168 configuration (baseline range: 61–185 m for the 5-antenna main array, with a sixth outrigger antenna providing 4.3–4.5 km baselines), totaling 16 hr of observing time. The outrigger antenna was only available for the first track, and it was manually flagged due to the significantly poorer phase stability on the longest baselines. The nearby bright radio quasar 0454–463 (1.4 Jy) at 9 deg distance from ADFS-27 was observed for phase and bandpass calibration every 10 minutes. Pointing corrections were obtained on a calibrator source roughly every hour, or when moving the telescopes by 20 deg on the sky. Absolute fluxes were determined based on observations of PKS 1934–628, which we cross-checked based on observations of Uranus. From our data, we estimate that the absolute flux scale is reliable at the 12%–20% level, with a relative accuracy at the 2% level between the two tracks.
The correlator was set up using the Compact Array Broadband Backend (CABB; Wilson et al. 2011) in CFB 1M mode with a bandwidth of 2 GHz in each of two intermediate frequency (IF) band at a spectral resolution of 1 MHz (8.7 km s-1). Data were binned to 40–80 km s-1 resolution in the subsequent analysis.
Data reduction was performed using the miriad package (Sault et al. 1995). Imaging the line emission yields a synthesized beam size of 7253 at an rms noise level of 54.3 Jy beam-1 over 1509 km s-1. Imaging the data across the entire line-free bandwidth yields a continuum rms level of 12 Jy beam-1.
| Line or | configuration | weighting | beam size | rms noise | frequency range | velocity range |
|---|---|---|---|---|---|---|
| (ATCA/ALMA) | (Jy beam-1) | ( km s-1) | ||||
| CO(=21) | H168 | natural | 7253 | 54.3 | 175 MHz | 1509 |
| CO(=87) | C43-1/2 | natural | 3123 | 100 | 400 MHz | 866 |
| CO(=98) | C43-5 | natural | 056049 | 23.8 | 593.75 MHz | 1142 |
| robust +0.5 | 042036 | 28 | ||||
| CO(=109) | C43-2/3+5 | natural | 054045 | 35 | 750 MHz | 1299 |
| robust +0.5 | 040034 | 40 | ||||
| CH+(=10) abs. | C43-1/2 | natural | 3326 | 130 | 460.938 MHz | 1100 |
| OH+(1101) abs. | C43-5 | natural | 056049 | 29 | 343.75 MHz | 664 |
| OH+(1101) em. | C43-5 | natural | 056049 | 28 | 421.875 MHz | 815 |
| OH+(1201) em. | C43-5 | natural | 060052 | 42 | 156.25 MHz | 321 |
| 2.3 mm continuum | C43-1/2 | natural | 3326 | 34 | 3.43 GHz | |
| 2.2 mm continuum | C43-1/2 | natural | 3023 | 36 | 3.12 GHz | |
| 2.0 mm continuum | C43-5 | robust –0.5 | 033028 | 20 | 3.43 GHz | |
| 1.9 mm continuum | C43-5 | robust –0.5 | 032026 | 29 | 1.74 GHz | |
| 1.7 mm continuum | C43-2/3+5 | robust –0.5 | 031028 | 50 | 2.08/0.92 GHzaaLine-free frequency ranges for compact/extended configuration observations, respectively. |
2.2 ALMA
We observed the CO(=87), CO(=98), and CO(=109) lines (=921.7997, 1036.9124, and 1151.9855 GHz; redshifted to =138.5124, 155.8095, and 173.1007 GHz, respectively) in setups that also covered the CH+(=10), OH+(1101), H2O(312221), and H2O(321312) lines (=835.0790, 1033.0582, 1153.1268, and 1162.9116 GHz; =125.4814, 155.2304, 173.2723, and 174.7425 GHz, respectively) toward ADFS-27 using ALMA (project ID: 2017.1.00235.S; PI: Riechers; we also included archival data from project 2018.1.00966.S in the frequency range overlapping with our science goals). Observations were carried out under acceptable to very good weather conditions during six runs in cycles 5 and 6 between 2018 July 14 and November 20 using the band 4 and 5 receivers on 42–48 12 m antennas in a compact array configuration for CO(=87) (C43-1/2; baseline range: 15–313 m), in a moderately extended configuration for CO(=98) (C43-5; 15 m–1.4 km),111Observations in a more compact configuration were scheduled as part of project 2017.1.00235.S, but not carried out. and in both a compact and a moderately extended configuration for CO(=109) (C43-2/3 and C43-5; 15 m–1.4 km). A total of 12.6, 76, and 102 minutes on source were spent for observing the CO(=87), CO(=98), and CO(=109) lines, respectively. The nearby radio quasars J0425–5331 or J0441–5154 were observed regularly for phase calibration. J0519–4546 was used for pointing, amplitude, bandpass and absolute flux calibration, leading to 10% calibration uncertainty.
The correlator was set up with two spectral windows of 1.875 GHz bandwidth (dual polarization) each per sideband, at a sideband separation of 8 GHz for all CO(=87) and CO(=98) observations, and the CO(=109) observations in a compact configuration. The upper sideband for the CO(=109) observations (which did not contain any lines of interest) fell into the outer wing of the 183 GHz atmospheric H2O line, and had to be discarded due to unreliable calibration given the modest weather conditions at the time of observing. For the extended configuration CO(=109) observations, three partially overlapping spectral windows were placed in the lower sideband (only one of which was used in the analysis presented here), and none was placed in the upper sideband.
Data reduction was performed using version 5.4.0 or 5.6.1 of the casa package (McMullin et al. 2007), aided by the calibration pipeline included with each version. Data were mapped manually using the CLEAN algorithm via the tclean task with “natural”, Briggs robust +0.5, and Briggs robust –0.5 weighting, which resulted in the image parameters detailed in Table 1. Continuum maps are created over the entire line-free bandwidths.
2.3 Hubble Space Telescope
ADFS-27 was observed with the Hubble Space Telescope Advanced Camera for Surveys Wide-Field Camera (ACS-WFC) in the F606W filter (effective wavelength: 581 nm) for 2 orbits on 2020 August 11/12 and with the Wide-Field Camera 3 in the infrared F098M, F125W, and F160W filters (WFC3-IR; 983, 1236, and 1528 nm) for 1, 1, and 2 orbits on 2018 August 18 and 2020 June 14, respectively (program ID: 15919, PI: Riechers for all except F125W, which is from 15464, PI: Long). The total exposure times in the F606W, F098M, F125W, and F160W filters were 4800, 2712, 2612, and 5612 s, respectively
Standard procedures were used to calibrate the data, including flat fielding and flux calibration, as well as masking of bad pixels, bias and dark current subtractions, corrections for geometric distortions, and the combination of exposures with AstroDrizzle. Initial catalogs for astrometry were obtained by running SExtractor (Bertin & Arnouts 1996) in single mode for each band. Astrometry was carried out by matching the images in each filter to the GAIA DR2 catalog (Gaia Collaboration 2018) with a matching radius of one full width at half maximum, which resulted in typically 14 matches per band in the WFC3 filters. The final shift applied was taken as the mean of the shifts for these matched sources. Photometry catalogs were made using SExtractor in dual mode, with F160W as the detection image, and using the other bands iteratively to obtain the photometry.
3 Results
3.1 Continuum Emission
We here report our new findings on the rest-frame ultraviolet to millimeter continuum emission toward ADFS-27. The main results are summarized in Table 2.
3.1.1 HST
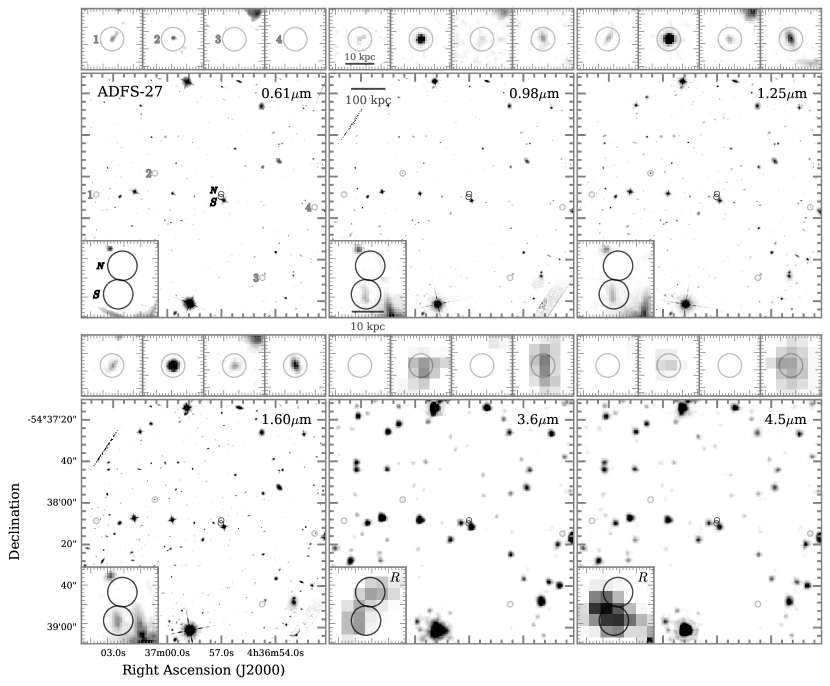
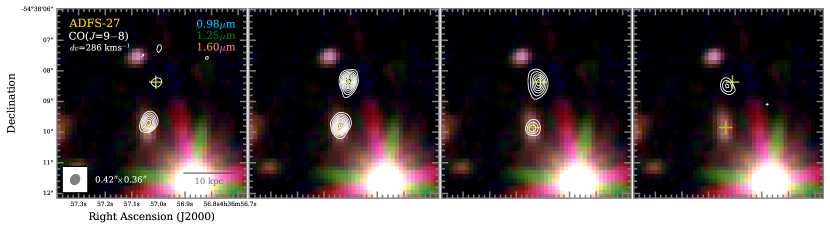
The F606W filters sits below the Lyman break at 5.7. Thus, no emission is detected toward ADFS-27, as expected (Fig. 1). Also, there is no evidence for the presence of a foreground galaxy that could cause strong gravitational lensing. The nearest bright foreground galaxy detected in the WFC3-IR filters is 3.7′′ to the east of ADFS-27S. There is a faint object at 1.0′′ distance from ADFS-27N detected in F606W, but unlike most effective deflectors, it is not a massive red galaxy, such that strong lensing (i.e., a flux magnification factor of 2) remains unlikely. A small amount of magnification (a few per cent to few tens of per cent) remains possible, but there is no evidence for a significant extension of ADFS-27N along the axis that would be expected for distortion due to weak lensing magnification (which lies close to its minor axis). Also, there is no evidence for a foreground galaxy group or cluster that could provide a larger-scale lensing potential. As such, we confirm that ADFS-27 is intrinsically a HyLIRG. ADFS-27N also remains undetected in all WFC3-IR filters, while spatially-resolved stellar emission is detected towards ADFS-27S in all three filters (Fig. 1). This suggests that the stellar light in ADFS-27N is significantly more heavily dust-obscured than in ADFS-27S, such that no direct stellar mass measurement is possible for the northern galaxy without the investment of at least many tens of orbits of HST time, at least until the launch of the James Webb Space Telescope (JWST). Aperture fluxes and upper limits are reported in Table 2.
We have also conducted a -band dropout search for candidate
Lyman-break galaxies (LBGs) at the same redshift as ADFS-27. We
initially selected the F606W and F098M filters, because the Lyman
break falls between these filters at =5.655. We used selection
criteria defined in analogy with those used by Bouwens et
al. (2015), but fine-tuned toward the selection of
LBGs at =5.6 (R. Bouwens 2020, private communication). First, we
required a detection at 5 in all WFC3-IR bands. Then, we
applied the following color selection criteria (in AB magnitudes):
F606W – F098M 2.3
F606W – F098M 2.3 + (F098M – F160W)
F098M – F160W 1.2
As such, we used the F606W–F098M color as the main selection criterion to reject 5 galaxies, and the slope between the near-infrared bands to select against excessively steep spectral energy distribution shapes above the expected Lyman break. We also rejected stars by excluding point sources from the resulting sample. Due to the faint selection thresholds required, we also rejected sources near the edges of the WFC3 coverage, where a higher incidence of spurious faint sources is expected. This results in four candidates, A27.LBG-1 to 4 (labeled 1 to 4 in Fig. 1). Despite the break selection criterion, A27.LBG-1 and 2 clearly show faint detections in the F606W filter, and A27.LBG-2 shows a morphology that resembles a point source. These sources thus are discarded from the LBG candidate sample. None of the two surviving candidates appear to have detections in the F606W filter. A27.LBG-3 is lacking a detection in the Spitzer IRAC bands at 3.6 and 4.5 m, but it also is the far faintest source in the WFC3 bands. We thus retain it in the LBG candidate sample. A27.LBG-4 has strong detections in the IRAC bands, and thus, is the strongest candidate. A27.LBG-3 and 4 are at 43.7 and 45.4′′ (corresponding to 264 and 274 kpc at =5.655) projected distance from ADFS-27S, respectively. Given the custom selection criteria, narrow-band Lyman– imaging and/or follow-up spectroscopy is required to assess whether or not any of the candidates is at the redshift of ADFS-27. If confirmed, our findings would be consistent with an overdensity of star-forming galaxies within 300 kpc around ADFS-27.
To further quantify the density contrast compared to the field, we calculated the field density of =5.7 LBGs in the same manner as done by Pavesi et al. (2018), which is based on the method developed by Smolčić et al. (2017). Adopting a redshift slice of =0.64 and using the photometric redshifts reported in the COSMOS2015 catalog (Laigle et al. 2016), we find an expected density in the field of 0.19 arcmin-2. We then calculate the overdensity parameter relative to the field as =–1. This yields an estimated overdensity of 8–11 out to the distance of A27.LBG-4, and 6–9 within a 300 kpc radius, where the range indicate the difference between considering ADFS-27 as a single source or two sources. Out to the same distances, the overdensity around the =5.7 galaxy CRLE studied by Pavesi et al. (2018) is 5 or 4, respectively. At face value, the overdensity around ADFS-27 thus may be more significant, but the relative uncertainties are dominated by small number statistics.
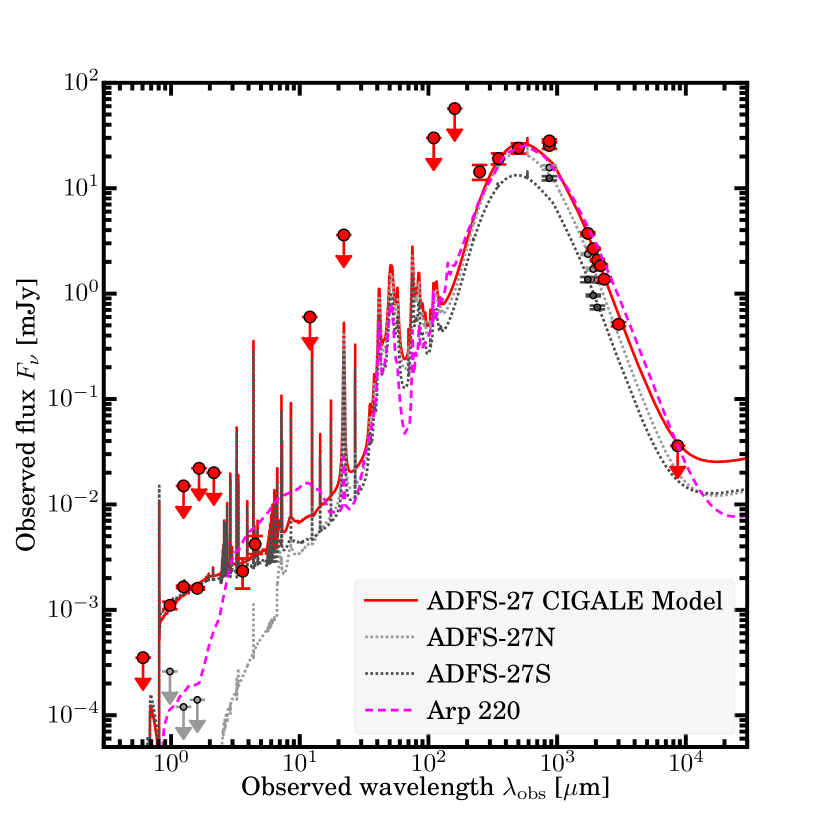
| Wavelength | Flux densityaaLimits are 3. | Telescope | Reference | ||
|---|---|---|---|---|---|
| total | north | south | |||
| (m) | (mJy) | (mJy) | (mJy) | ||
| 0.606bbFluxes extracted from a region where emission is seen in the F160W filter. Emission is only detected toward ADFS-27S. Upper limits for ADFS-27N are taken as 3 limits in an aperture that is the same size as used for ADFS-27S, but are not added to the total flux since no emission is seen in the images. | 0.35210-3 | 0.04310-3 | 0.35210-3 | HST/ACS-WFC | 1 |
| 0.98bbFluxes extracted from a region where emission is seen in the F160W filter. Emission is only detected toward ADFS-27S. Upper limits for ADFS-27N are taken as 3 limits in an aperture that is the same size as used for ADFS-27S, but are not added to the total flux since no emission is seen in the images. | (1.104)10-3 | 0.2610-3 | (1.104)10-3 | HST/WFC3-IR | 1 |
| 1.25bbFluxes extracted from a region where emission is seen in the F160W filter. Emission is only detected toward ADFS-27S. Upper limits for ADFS-27N are taken as 3 limits in an aperture that is the same size as used for ADFS-27S, but are not added to the total flux since no emission is seen in the images. | (1.6520.040)10-3 | 0.1210-3 | (1.6520.040)10-3 | HST/WFC3-IR | 1 |
| 1.25 | 0.015 | VISTA/VHS | 2 | ||
| 1.60bbFluxes extracted from a region where emission is seen in the F160W filter. Emission is only detected toward ADFS-27S. Upper limits for ADFS-27N are taken as 3 limits in an aperture that is the same size as used for ADFS-27S, but are not added to the total flux since no emission is seen in the images. | (1.5990.046)10-3 | 0.1410-3 | (1.5990.046)10-3 | HST/WFC3-IR | 1 |
| 1.65 | 0.022 | VISTA/VHS | 2 | ||
| 2.15 | 0.020 | VISTA/VHS | 2 | ||
| 3.6ccValues obtained after de-blending from foreground sources. Flux is likely dominated by ADFS-27S. | (2.330.74)10-3 | Spitzer/IRAC | 2 | ||
| 4.5ccValues obtained after de-blending from foreground sources. Flux is likely dominated by ADFS-27S. | (4.200.82)10-3 | Spitzer/IRAC | 2 | ||
| 12 | 0.6 | WISE | 2 | ||
| 22 | 3.6 | WISE | 2 | ||
| 110 | 30 | Herschel/PACS | 2 | ||
| 160 | 57 | Herschel/PACS | 2 | ||
| 250ddUncertainties do not account for confusion noise, which is 5.9, 6.3, and 6.8 mJy (1) at 250, 350, and 500 m, respectively (Nguyen et al. 2010). | 14.32.3 | Herschel/SPIRE | 2 | ||
| 350ddUncertainties do not account for confusion noise, which is 5.9, 6.3, and 6.8 mJy (1) at 250, 350, and 500 m, respectively (Nguyen et al. 2010). | 19.12.3 | Herschel/SPIRE | 2 | ||
| 500ddUncertainties do not account for confusion noise, which is 5.9, 6.3, and 6.8 mJy (1) at 250, 350, and 500 m, respectively (Nguyen et al. 2010). | 24.02.7 | Herschel/SPIRE | 2 | ||
| 870 | 25.41.8 | APEX/LABOCA | 2 | ||
| 870 | 28.10.9 | 15.700.76 | 12.43 0.56 | ALMA | 2 |
| 1733 | 3.730.09 | 2.370.05 | 1.360.08 | ALMA | 1 |
| 1910 | 2.670.05 | 1.710.05 | 0.960.02 | ALMA | 1 |
| 2053 | 2.080.05 | 1.340.04 | 0.740.03 | ALMA | 1 |
| 2173 | 1.840.06 | ALMA | 1 | ||
| 2323 | 1.370.06 | ALMA | 1 | ||
| 3000 | 0.5120.023 | ALMA (scan) | 2 | ||
| 8653 | 0.036 | ATCA | 1 |
[1] This work; [2] Riechers et al. (2017).
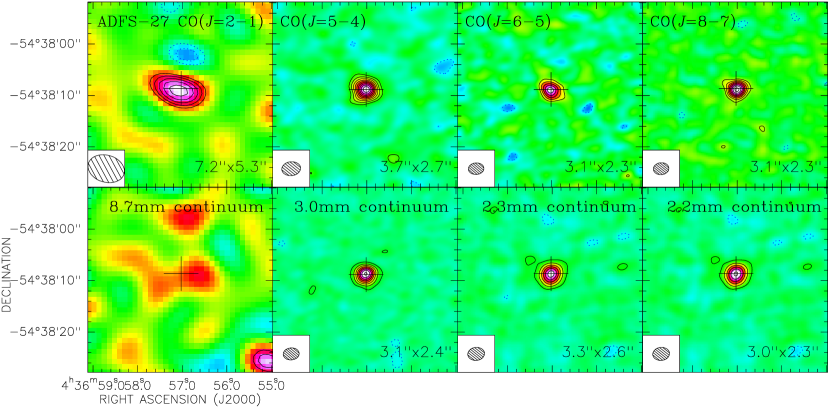
3.1.2 ALMA and ATCA
No continuum emission is detected toward ADFS-27 in the ATCA data, and we report an upper limit in Table 2. Continuum emission is detected in all ALMA data between 1.7 and 2.3 mm (Fig. 3), but ADFS-27N and S are resolved apart from each other only shortwards of 2.1 mm (Fig. 4) due to the more compact configuration chosen for the CO(=87) observations. The peak significance levels of the detections are 31 and 42 at 2.3 and 2.2 mm, respectively. The peak significance levels of the detections of ADFS-27N and S in maps imaged with natural weighting are 121 and 70 at 2.0 mm, 90 and 56 at 1.9 mm, and 89 and 56 at 1.7 mm, respectively. Between 2.0 mm and 0.87 mm, the continuum flux ratio between ADFS-27N and S decreases from 1.810.09 to 1.260.08. This suggests that ADFS-27S has an intrinsically “warmer” dust spectral energy distribution shape than ADFS-27N. All continuum fluxes are summarized in Table 2.

3.2 Line Emission and Absorption
We here report our new findings on CO, H2O, OH+, and CH+ emission and absorption toward ADFS-27. The main results are summarized in Table 3.
3.2.1 CO Emission
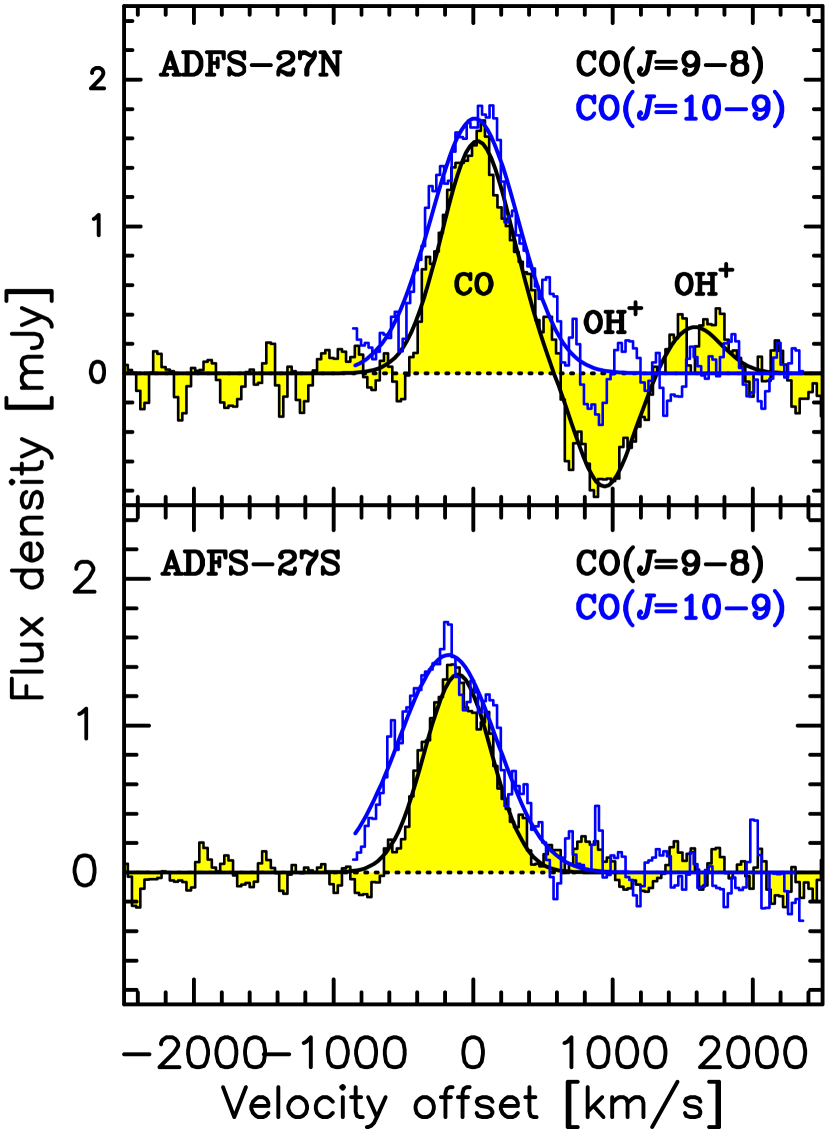
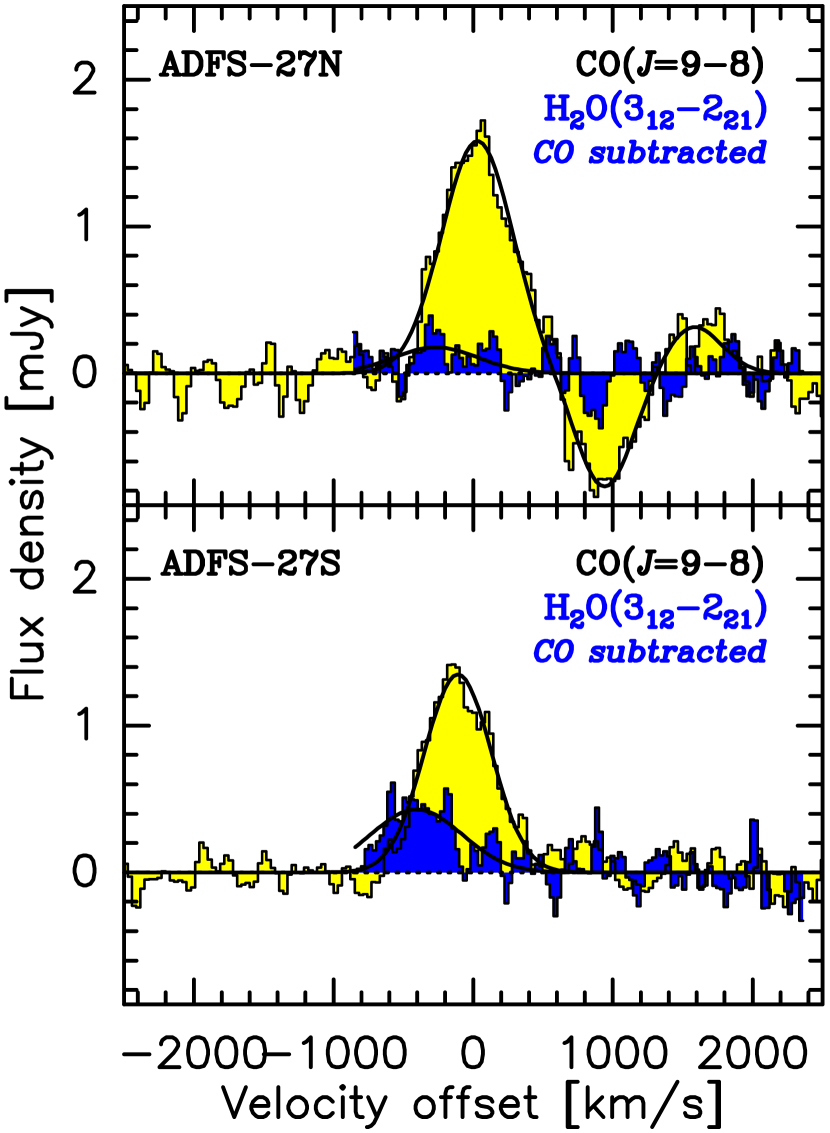
We detect CO =21 and 87 emission toward ADFS-27 at 7.6 and 18 peak significance (Fig. 3), respectively. We also detect and spatially resolve CO =98 and 109 emission towards ADFS-27N and S at 23 peak significance in each case (naturally-weighted maps are shown in Fig. 4; CO =109 is not corrected for a subdominant contribution from the H2O 312221 line). The line FWHM for the CO =21 and 87 lines is (910143) and (74368) km s-1, respectively, as compared to (65159) and (710103) km s-1 for the previously-detected CO =54 and 65 lines. The CO =98 and 109 lines summed over both source components yield FWHM values of (59718) and (81616) km s-1, where the latter is not corrected for any contribution from the H2O 312221 line. The overall trend may suggest changes in the line ratio between ADFS-27N and S from the CO =54 to the 87 transition due to a potential increase in overall line widths, but the values are consistent within the uncertainties. On the other hand, the CO =98 line may be somewhat narrower than expected, possibly due to a contribution from the nearby OH+ absorption feature, while the CO =109 line appears broader than all lines except CO =21 due to a likely contribution from the H2O 312221 line. To further investigate these issues, we compare the profiles of the CO =98 and 109 lines for each component individually in Fig. 6. The consistent red wing between both lines does not suggest significant reduction of the CO(=98) line width or flux due to OH+ absorption in either source component. On the other hand, the extended blue wing of the CO(=109) line in both components suggests a significant contribution from the H2O 312221 line in both cases. To de-blend the CO and H2O lines, we fix the line centroids of both lines to the high signal-to-noise ratio CO(=98) lines, and we assume a common width of the CO and H2O lines. The CO-subtracted H2O spectra are shown in the right panels of Fig. 6 for reference, and the H2O line parameters are studied below. We also simultaneously fit the CO(=98) and OH+ emission, and report the OH+ line parameters below. For the CO =98 and 109 lines, we find line FWHM values of (59928) and (71122) km s-1 for ADFS-27N, and (56518) and (76728) km s-1 for ADFS-27S, respectively. ADFS-27N is redshifted by (14013) km s-1 relative to ADFS-27S in the CO(=98) line, which suggests that the lines appear broadened in spatially-unresolved measurements due to the internal kinematic structure of the merging system. We find redshifts of =5.655680.00023 and 5.652580.00016 for ADFS-27N and S, respectively. Intensities and luminosities for all lines are reported in Table 3.
| Transition | dvFWHM | aaLine brightness temperature ratio relative to CO(=21). For reference, the large velocity gradient (LVG) modeling suggests =0.95 between CO =21 and 10. | |||
|---|---|---|---|---|---|
| (Jy km s-1) | ( km s-1) | (1010 K km s-1 pc2) | (108 ) | ||
| CO(=21) | 0.716 0.087 | 910143 | 19.93 1.42 | 0.782 0.095 | 1 |
| CO(=54) | 2.68 0.20 | 65159 | 11.96 0.92 | 7.32 0.56 | 0.60 0.09 |
| CO(=65) | 2.82 0.34 | 710103 | 8.73 1.07 | 9.24 1.13 | 0.44 0.07 |
| CO(=87) | 2.24 0.11 | 74368 | 3.90 0.19 | 9.78 0.48 | 0.20 0.03 |
| CO(=98) | 1.80 0.04 | 59928 (N) | 2.48 0.06 | 8.84 0.21 | 0.124 0.015 |
| 56518 (S) | |||||
| CO(=109) | 2.18 0.05 | 71122 (N) | 2.43 0.06 | 11.89 0.29 | 0.121 0.015 |
| 76728 (S) | |||||
| CH+(=10) abs.bbTentative detection, independent confirmation required. | –0.360.14 | (N) | |||
| OH+(1101) abs. | –0.296 0.027 | 42250 (N) | |||
| OH+(1101) em. | 0.1470.018 | 74587 (N) | 0.204 0.025 | 0.719 0.088 | |
| OH+(1201) em. | 0.170.04 | 740 (N) | 0.27 0.06 | 0.79 0.17 | |
| H2O(211202)bbTentative detection, independent confirmation required. | 0.83 0.22 | 503163 | 2.17 0.58 | 2.96 0.80 | |
| H2O(312221)ccDe-blended from CO(=109) line assuming a common line width. | 0.48 0.06 | (fixed; N/S) | 0.54 0.07 | 2.63 0.33 | |
| H2O(321312)bbTentative detection, independent confirmation required. | 1.26 0.32 | 1150340 (S) | 1.38 0.35 | 6.96 1.75 |
3.2.2 H2O Emission
We tentatively detect H2O(321312) emission at approximately 4 significance, at a position consistent with ADFS-27S. The formal FWHM of the line is (1150340) km s-1, which is consistent with the width of the CO lines within the uncertainties. Through de-blending from the CO(=109) line, we also detect H2O(312221) emission toward ADFS-27S, and at lower significance, toward ADFS-27N. The combined detection significance of both components is about 8 when neglecting systematic uncertainties in the de-blending process. The line widths are tied to the CO(=109) line, and a simultaneous fit tied to the CO(=98) redshift of each component gives FWHM of (71122) and (76728) km s-1 for ADFS-27N and S, respectively. Given the H2O de-excitation cascade process expected for radiatively-excited H2O lines (as is likely the case for ADFS-27), the H2O(321312) line is expected to be brighter than the H2O(312221) line based on photon number conservation arguments (see, e.g., Gonzalez-Alfonso et al. 2010). We find an H2O 312221/321312 ratio of =0.390.11 (Table 3), which is formally consistent with a 1:2 ratio within the uncertainties. As such, we would expect the H2O(312303) line, as the second branch of the cascade, to be detectable at a strength comparable to the H2O(312221) line in ADFS-27. Additionally, a detection of H2O(312221) and H2O(321312) is consistent with the previous tentative detection of H2O(211202) in this source (Riechers et al. 2017). While tentative, the peak velocity of that line also appears to be blueshifted compared to the CO emission centroid of the entire source, which is consistent with stronger H2O emission in ADFS-27S (as the blueshifted source component) than in ADFS-27N. The comparatively brighter H2O emission in ADFS-27S is consistent with its warmer dust spectral energy distribution shape, under the assumption that the H2O line ladder is dominantly excited radiatively. This is because warmer dusts leads to a greater availability of 75.4 m photons, which pump the ortho-H2O 321 level from the 212 state (see, e.g., Gonzalez-Alfonso et al. 2012; Riechers et al. 2013). Higher signal-to-noise ratio detections of spectrally isolated H2O lines are required for a more detailed interpretation.
3.2.3 OH+ Emission/Absorption
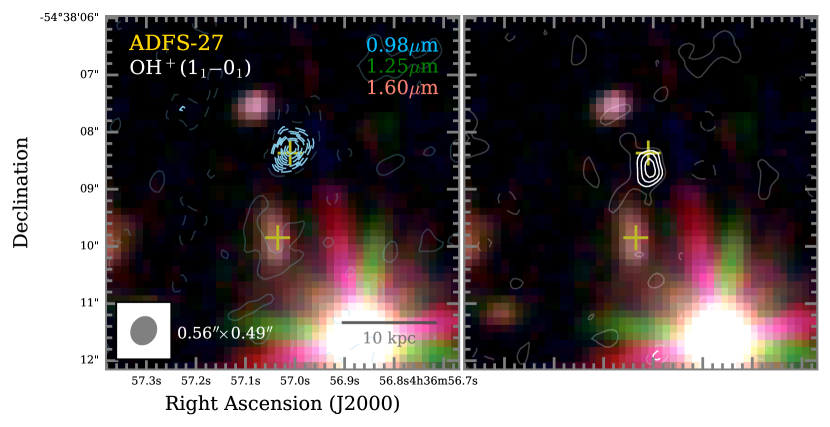
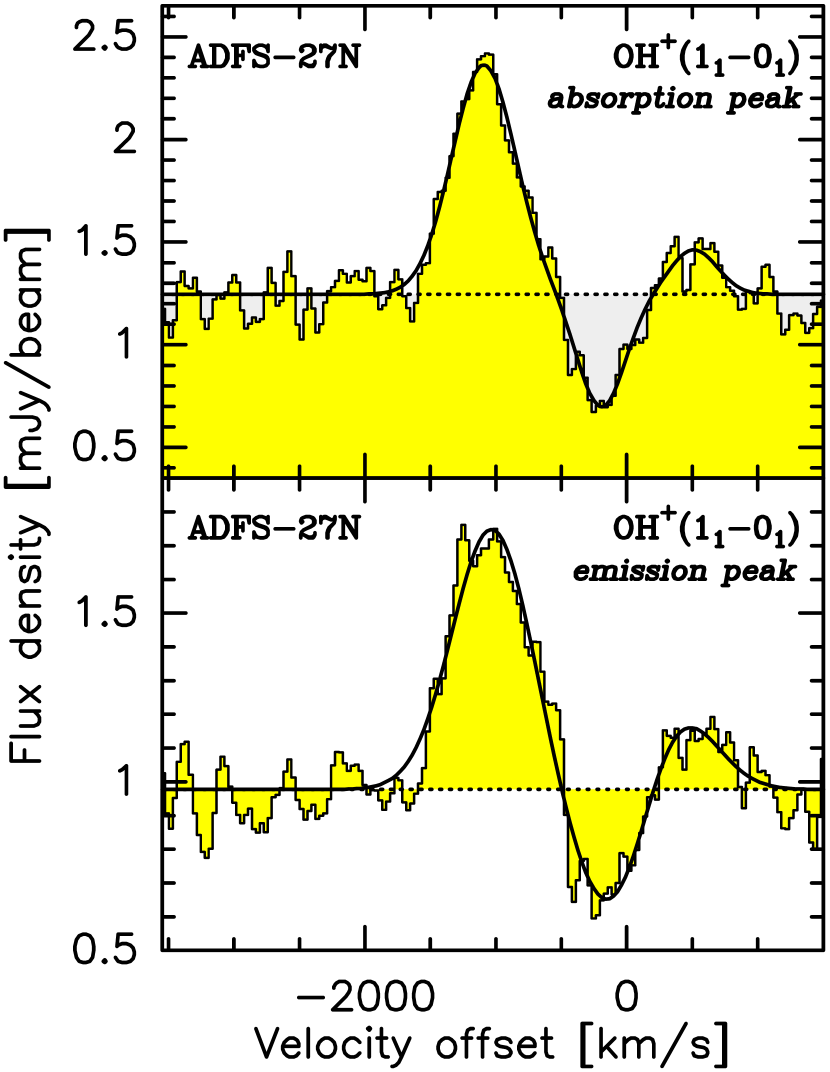
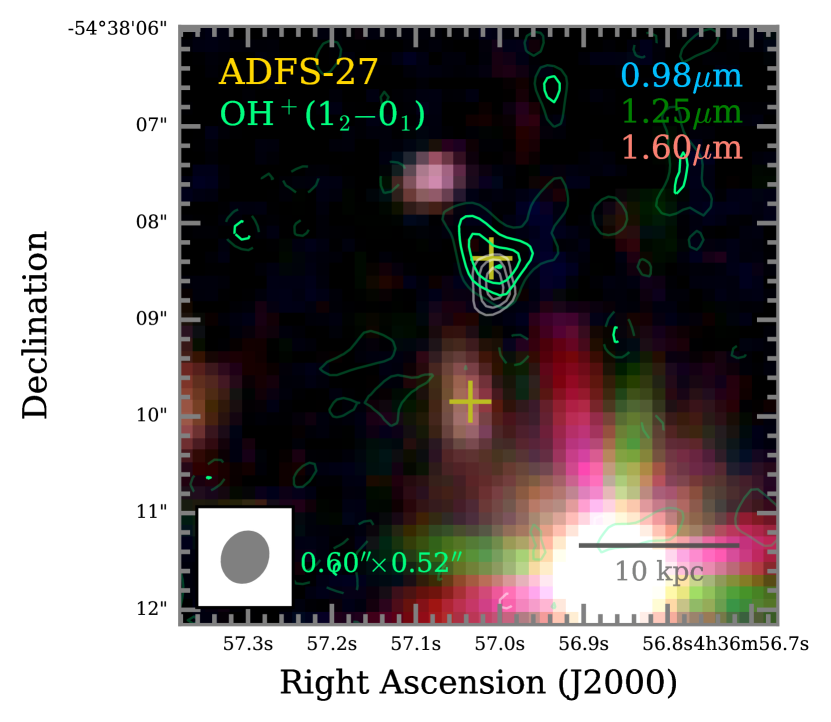
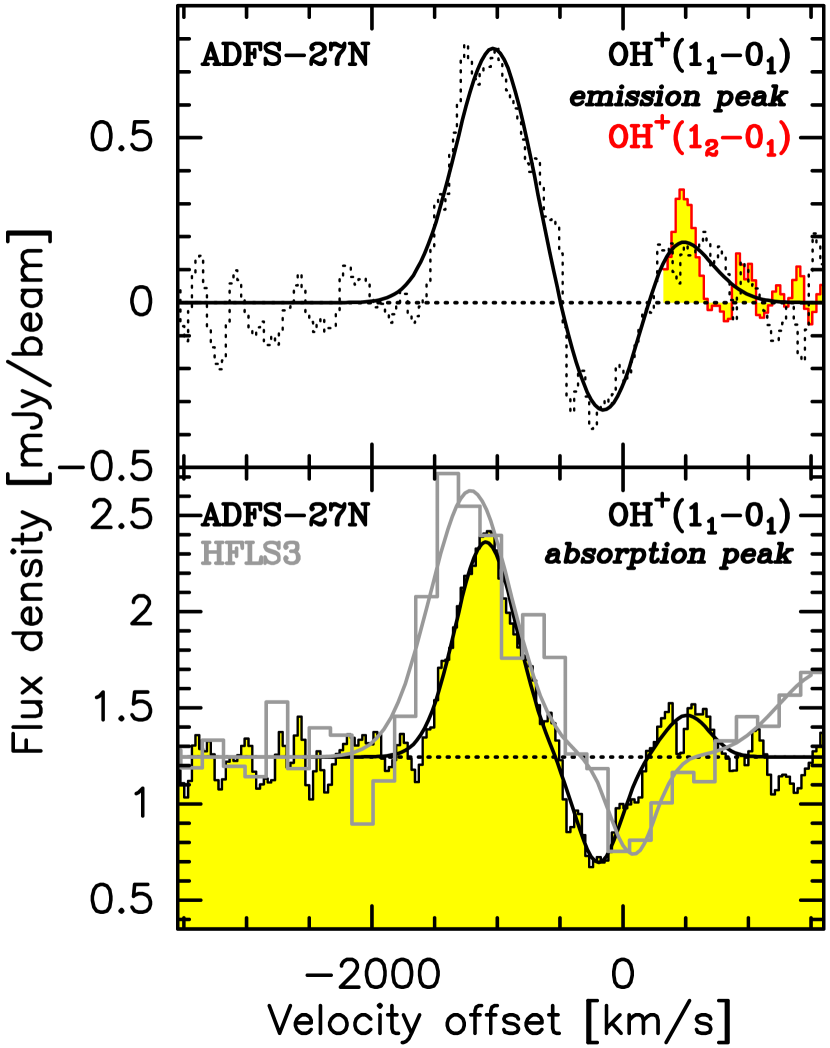
We detect a P-Cygni shaped absorption/emission profile of the OH+(1101) line toward ADFS-27N, while no OH+ line is detected toward ADFS-27S (Fig. 7). The OH+ absorption and emission components in ADFS-27 are detected at peak significances of 14 and 5.6, respectively. The OH+ absorption component is blueshifted by (21616) km s-1 at its map peak position relative to the CO(=98) line, while the emission component is redshifted by (17110) km s-1 at its peak position relative to the CO(=98) line (or by (23310) km s-1 relative to the CO =98 emission at the CO and continuum peak position). The OH+ absorption component is spatially coincident with the continuum emission within 0.076′′ (0.5 kpc), while the peak of the emission component is offset to the south by 0.29′′ (1.7 kpc). The OH+ absorption and emission components have FWHM values of (42250) and (74587) km s-1, respectively. Thus, the emission component has a width similar to the high- CO lines, but the absorption component is narrower.
A comparison to the OH+(1101) line detected toward HFLS3 (=6.34; Riechers et al. 2013) shows a comparable absorption strength, but the absorption and emission components in HFLS3 appear significantly more redshifted (Fig. 8; only the red wing of the emission component is seen in HFLS3 due to the limited coverage of the bandpass).
We also detect the emission wing of the OH+(1201) emission feature (Fig. 2 and 8) at 5 peak significance. The highest signal-to-noise ratio is obtained when averaging the emission over 320 km s-1, but the line remains detected at the 4 level when averaging over the full range showing positive emission in the spectrum (740 km s-1). The peak of the emission also shifts to the south by a fraction of the beam size when averaging over the broader velocity range, but remains consistent with the position shown in Fig. 8 within the uncertainties. Overall, we find that the peak positions, redshifts, and line profiles of the OH+ 1201 and 1101 emission components agree within the uncertainties. Due to the fact that only part of the line profile is seen, we only report an integrated flux for the OH+ 1201 emission component, and we focus our main analysis on the OH+(1101) line.
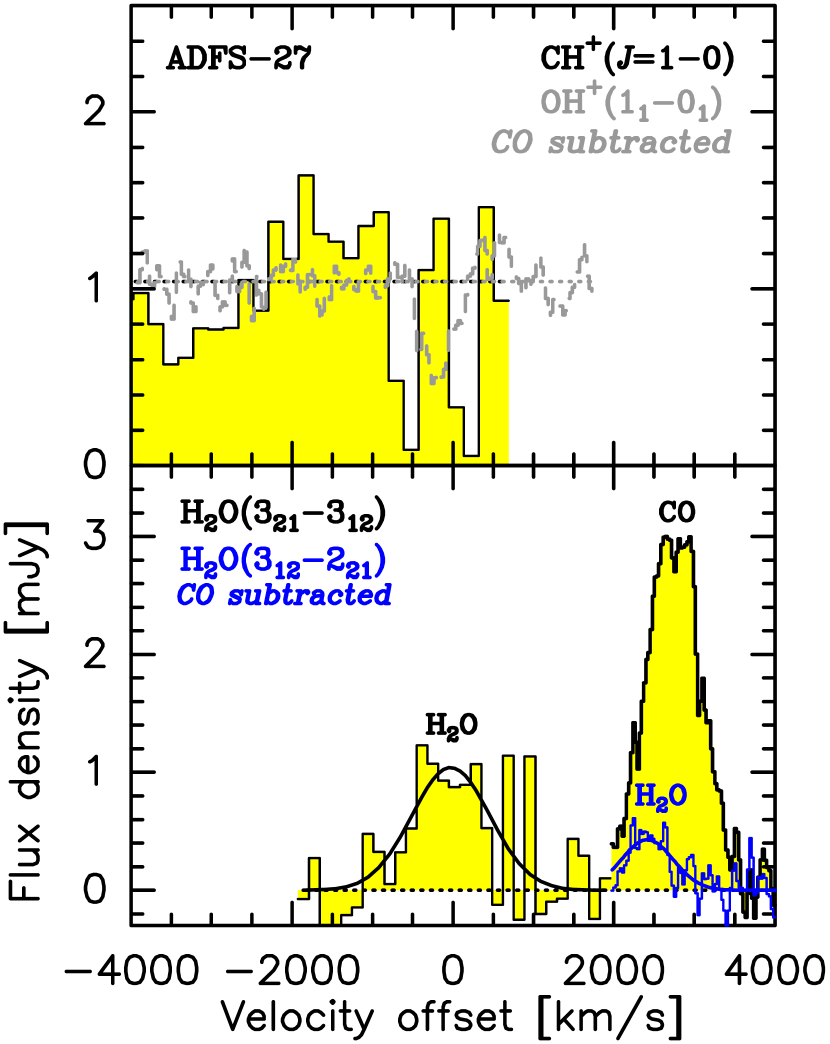
3.2.4 CH+ Absorption
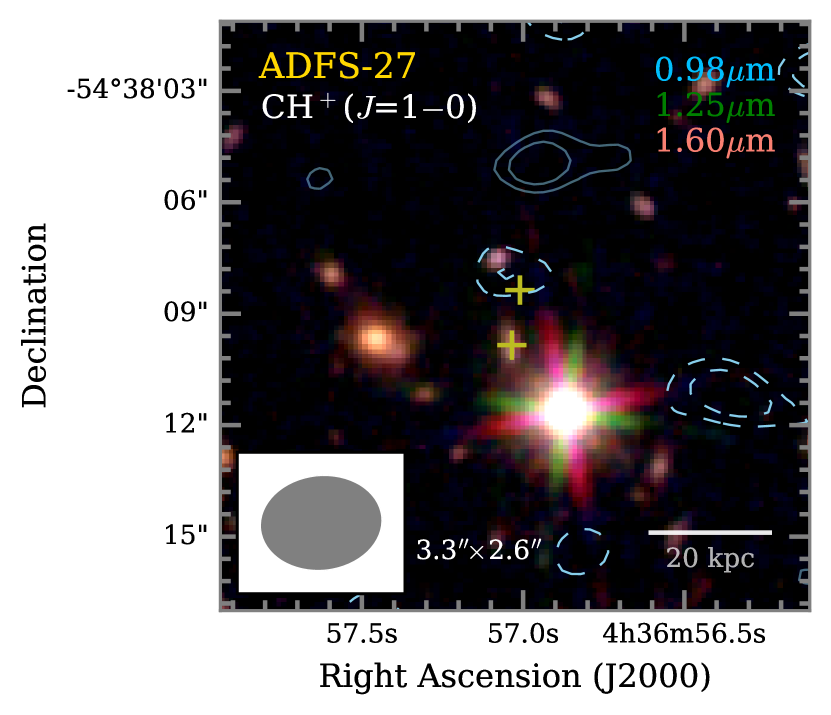
We tentatively detect the CH+(=10) line (Fig. 9) at 2.5 significance in absorption at a position consistent with ADFS-27N. The feature is formally consistent with the central velocity and strength of the OH+(1101) absorption detected toward the same source component (see also Table 3), but a broader feature cannot be ruled out with the current data. Given the limited signal-to-noise ratio of the detection, we do not report parameters from a fit to the line profile. More sensitive observations are required to confirm this feature, and to study its properties in more detail.
4 Analysis and Discussion
We here determine a broad range of physical properties for ADFS-27, to place them in the more general context required to improve our understanding of galaxy evolution. The main quantities are summarized in Tables 4, 5, and 6.
4.1 Spectral Energy Distribution Modeling
4.1.1 CIGALE
We have used the Code Investigating GALaxy Emission (CIGALE; Burgarella et al. 2005; Noll et al. 2009; Boquien et al. 2019) spectral energy distribution (SED) fitting package to model the full SED of ADFS-27. We have run the code on all spatially-integrated photometry from Table 2 for the entire galaxy, and also on the two source components ADFS-27N and S individually, using only the photometry in those bands where the emission is resolved into both sources. We ran two series of fits, with star-formation histories (SFHs) either limited to approximately the age of the universe at =5.655 (i.e., 1.0 Gyr), or to an age of 0.2 Gyr, as is characteristic for young dusty starbursts (e.g., Greve et al. 2005; Bergvall et al. 2016). We sampled standard ranges for all main parameters within CIGALE, and used a Bruzual & Charlot (2003) single stellar population and a Chabrier (2003) stellar initial mass function with a “delayed” SFH (i.e., where star-formation rate SFR() / exp(/), and the fit parameter is the time at which the SFR peaks; Boquien et al. 2019; see also Burgarella et al. 2020) for all fits. We fixed the power-law slope of the dust attenuation law to –0.7 for both the interstellar medium and birth clouds, and assumed a polycyclic aromatic hydrocarbon (PAH) mass fraction (which is not directly constrained by the data) of =3.9% (i.e., similar to dust found in the Milky Way and nearby galaxies with near-solar metallicity; e.g., Draine & Li 2007, and references therein).222We allowed for a range in metallicity in our fits, but the metallicity remains difficult to constrain directly without rest-frame optical spectroscopy. This is consistent with the range of =0.47%–3.9% found for a sample of infrared-luminous galaxies at =0.5–4 (Magdis et al. 2012).333The uncertainty due to this assumption is fully captured by the error bars for the most relevant parameters, like . For ADFS-27 as a whole and for ADFS-27S (which is detected in the near-infrared bands), the best-fit parameters for both series agree within the uncertainties. We thus adopt those from the series with less constraints on the SFH in the following, and only use those from the other series in the evaluation of the true uncertainties. For ADFS-27N (which is not detected in the near-infrared bands), the series with more stringent constraints on the SFH appears to provide more reasonable results, and thus, are adopted in the following.
We find a total dust luminosity of =(2.620.21)1013 and a SFR of (3100330) yr-1 for ADFS-27. We also find a total dust mass of =(4.190.39)109 . These values would differ by only 0.6%, 3%, and –1% when adopting the more restricted parameter study, which is indistinguishable within the uncertainties. The dust mass is consistent with that found by Riechers et al. (2017) within the uncertainties.
CIGALE uses the simplified Draine & Li (2007) prescription for which dust is heated by starlight in an intensity range with , where is a dimensionless scaling factor of the interstellar radiation field in the solar neighborhood as estimated by Mathis et al. (1983), and =106 is fixed to the value found for nearby star-forming galaxies. We find =3211, and a power-law slope of =2.80.3 for the distribution of starlight intensities / (e.g., Dale et al. 2001). A fraction (1–)60%30% of the dust is heated by starlight at (representing the diffuse interstellar medium component), and 40%30% is heated by more intense starlight that follows the power-law distribution. Following Draine & Li (2007), this corresponds to 77% of the dust heating444Dust heating is defined here as the fraction of radiated by dust grains in regions where 100, i.e., 3. being due to reprocessed starlight from photon-dominated regions (PDRs), rather than the interstellar radiation field. This would be consistent with a picture in which young starbursts are hosted by a largely fractured, clumpy interstellar medium, embedded in the diffuse interstellar medium that fills most of the volume of the sources. We note however that is not constrained at high significance by the current data, and thus is the main source of uncertainty in our interpretation.
We find that, despite the large quantities of dust present, the stellar light detected toward ADFS-27S appears to suffer only a modest extinction, corresponding to an extinction (1.00.1) mag, while ADFS-27N appears to suffer a substantially larger extinction (5.10.8) mag. We find young ages of (11060) and (8030) Myr for the stellar populations of ADFS-27N and S, respectively (which are consistent with the picture described in the previous paragraph), and total stellar masses of (1.61.3) and (0.460.15)1011 . Based on our findings from both fit series, we estimate that the stellar mass for ADFS-27N is uncertain by at least a factor of three in practice. The individual dust masses are =(2.600.38) and (1.460.20)109 , respectively. This suggests that the dust yield from the stellar populations is of order 2% after about 100 Myr, i.e., after sufficient time for stars of 5–8 produced early on to end their life cycles and enrich their surroundings (assuming that no additional, older stellar populations that have produced the bulk of the dust are present).
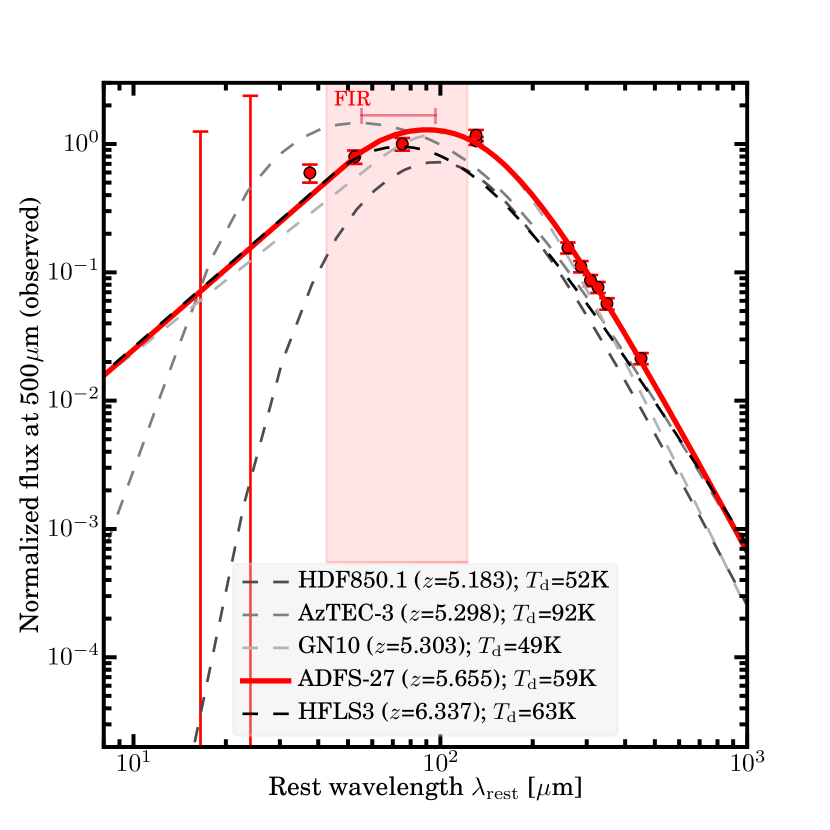
| Name | redshift | aaLensing magnification factor. No uncertainties are reported for HDF 850.1 in the original work, and we assume 20% uncertainty throughout this work. | bbApparent values not corrected for gravitational magnification where applicable. | bbApparent values not corrected for gravitational magnification where applicable. | References | ||||
|---|---|---|---|---|---|---|---|---|---|
| (K) | (m) | (m) | (1012 ) | (1012 ) | |||||
| HDF 850.1 | 5.1833 | 1.6 | 51.6 | 2.67 | 85.1 | 136 | 5.2 | 7.4 | 1, 2 |
| AzTEC-3 | 5.2980 | — | 92.5 | 2.09 | 55.4 | 181 | 11.2 | 25.5 | 3, 4, 2 |
| GN10 | 5.3031 | — | 48.8 | 3.18 | 96.4 | 170 | 6.4 | 11.8 | 2 |
| ADFS-27 | 5.6550 | — | 59.2 | 2.52 | 85.2 | 191 | 15.8 | 23.8 | 5, 6 |
| HFLS3 | 6.3369 | 1.80.6 | 63.3 | 1.94 | 73.3 | 142 | 29.3 | 55.0 | 7, 2 |
4.1.2 Modified Black-Body Fits to the Far-Infrared Emission
To understand the dust properties of ADFS-27 in more detail, we also updated our modified black-body (MBB) model of the dust continuum emission relative to that shown by Riechers et al. (2017) after including the new measurements on the Rayleigh-Jeans tail. We adopt the same Markov Chain Monte Carlo-based method (mbb_emcee) as described in our previous work, which was initially used by Riechers et al. (2013) and Dowell et al. (2014). The main fit parameters are the dust temperature , the spectral slope of the dust emissivity and the wavelength where the optical depth reaches unity. We also use the observed-frame 500 m flux density as a normalization parameter, and we join the MBB function to a power law toward the far Wien side of the spectral energy distribution to better capture the decline in flux towards shorter wavelengths, where the power-law slope is used as the fit parameter. We place a relatively broad prior of 1.80.6 on , and leave all other parameters without a prior. The results are reported in Table 4, and they agree with our previous estimates within the uncertainties. Based on the infrared luminosity (which is comparable to the value found by CIGALE), we find SFRIR = 2380 yr-1 when assuming a Chabrier (2003) stellar initial mass function. This is consistent with the value reported by Riechers et al. (2017), but by about 30% lower than the SFR found by CIGALE. Given the high level of dust obscuration (and the resulting high fraction of dust-reprocessed stellar light contributing to the total), we thus estimate that the systematic uncertainty on the SFR and quantities derived from it is at least 30%.
We also carried out the same fitting procedure with the same parameters for a comparison sample of unlensed or at most weakly-lensed 5 dusty starbursts, namely, HDF 850.1 (=5.18), AzTEC-3 and GN10 (both =5.30), and HFLS3 (=6.34; see Table 4). For all sources except HDF 850.1, this results in at most minor changes compared to our previous work (Riechers et al. 2013; 2020), due to only minor differences in the assumptions or approach. HDF 850.1 was previously fit with a different technique (Walter et al. 2012; Neri et al. 2014). Our new estimates include a more realistic approach to the dust optical depth, and thus suggests a higher , which (like the other fit parameters) still agrees with the previous values within the uncertainties. Due to the limited information available near the peak of the dust SED for this source, it is expected that the detailed parameters will vary with the adopted fitting method.
The best fits for all sources are shown in Fig. 10, normalized to their observed-frame 500 m flux densities or estimates. The peak wavelengths vary by a factor of 1.7, and the inferred dust temperatures vary by a factor of 1.9. ADFS-27 falls in the middle of the observed ranges, suggesting moderate dust properties for a 5 dusty starburst. This is interesting, because none of the other sources is found in an early merger stage – which thus may not be the dominant reason for the extreme observed properties of ADFS-27 compared to “typical” galaxies at the same redshift (e.g., Pavesi et al. 2016; 2019; Faisst et al. 2020). However, ADFS-27 shows the highest , which may be the main reason for its unusually “red” dust SED compared to other 5 dusty starbursts (which typically are not “870 micron risers”).
| Tracer | ADFS-27N | ADFS-27S | ||
|---|---|---|---|---|
| major | minor | major | minor | |
| (mas) | (mas) | (mas) | (mas) | |
| CO(=98) | 41548 | 28556 | 34456 | 106101 |
| CO(=109)aaNot corrected for contributions from the H2O(312221 line). | 46467 | 16289 | 41752 | 68126 |
| OH+ (emission) | 418152 | 93204 | ||
| OH+ (absorption) | 430 | 120 | ||
| 2.0 mm continuum | 40124 | 25822 | 42240 | 20649 |
| 1.9 mm continuum | 37221 | 23919 | 32224 | 13838 |
| 1.7 mm continuum | 35621 | 24932 | 37148 | 11293 |
| 0.87 mm continuum | 30330 | 21327 | 34131 | 14625 |
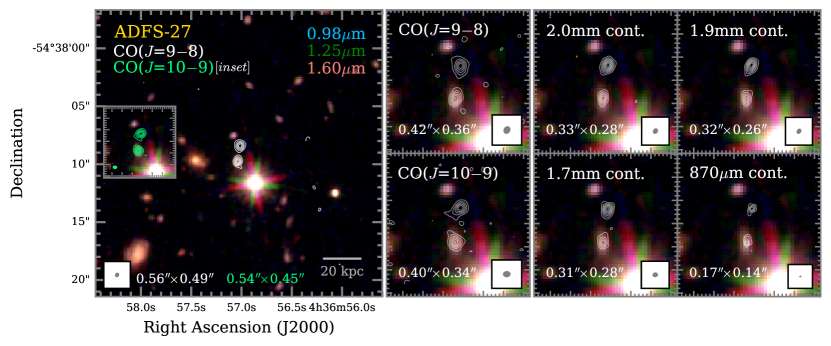
4.2 Extent of the Gas and Dust Emission
The two source components ADFS-27N and S are resolved individually in the CO =98 and 109 and OH+ lines (and, at lower significance, in CH+ and H2O) and in the 2.0 mm to 0.87 mm dust continuum emission (Figs. 4 and 7 and Table 5). There is no significant difference between the extent of the high- CO and long-wavelength dust continuum emission for either source component. The median sizes for ADFS-27N and S from all but the 0.87 mm dust measurements are (40823) mas(24427) mas and (37146) mas(12614) mas, respectively, where the uncertainties are the median absolute deviation. As such, any differences between the extent of the dust at shorter and longer wavelengths remain tentative at best, despite the finding that the source-averaged optical depths exceed unity at observed-frame 1.3 mm. By taking the median of all measurements, we find final sizes of (40129) mas(23926) mas and (35826) mas(13217) mas, for ADFS-27N and S, respectively. This corresponds to (2.40.2) kpc(1.40.2) kpc and (2.20.2) kpc(0.80.1) kpc, respectively, or source surface areas of (2.730.31) and (1.350.18) kpc2. Based on the updated total SFRIR of 2380 yr-1 and assuming that the flux ratio at 0.87 mm is representative of the peak of the SED, we find revised SFR surface densities of =(280110) and (450200) yr-1 kpc-2 at SFRIR of (1330130) and (1050110) yr-1 for ADFS-27N and S, respectively. While lower than initial estimates based on fewer data points (Riechers et al. 2017), this remains consistent with the picture that these sources are both HyLIRGs and “maximum starbursts”.555The derived would be higher by a factor of 1.3 when using the SFR estimates from CIGALE.
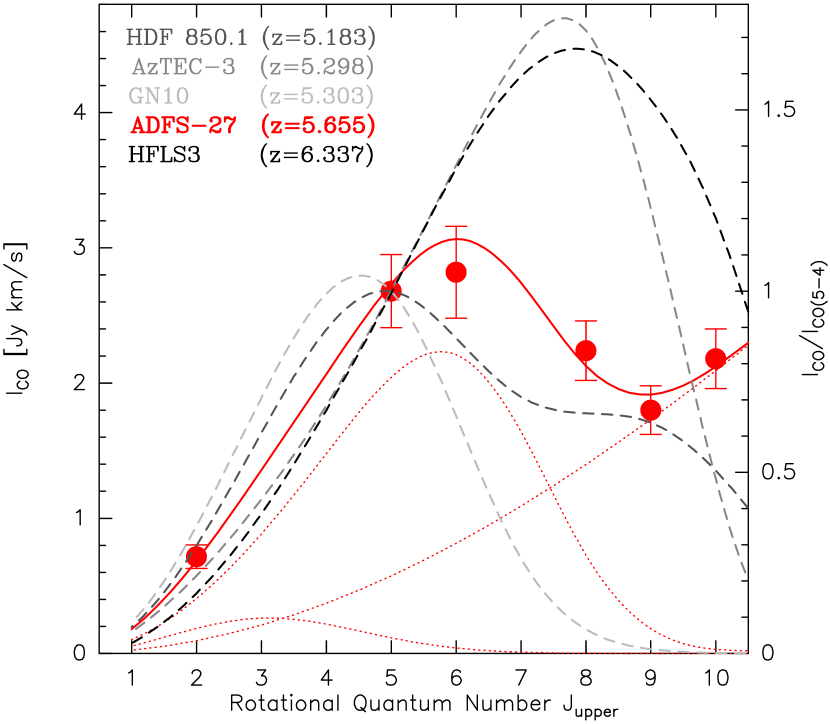
4.3 CO Large Velocity Gradient Modeling
To understand the physical conditions for star formation in ADFS-27, we investigated the CO line excitation by calculating a grid of large velocity gradient (LVG) models. Since our main goal is to obtain constraints on the gas kinetic temperature and the H2 density (H2) from collisions with CO molecules, we kept the H2 ortho-to-para ratio fixed to 3:1, the cosmic microwave background (CMB) temperature at =5.655 set to 18.135 K, and the ratio between CO/H2 abundance and the velocity gradient fixed to 10-5 pc ( km s-1)-1. We also adopted the Flower (2001) CO collision rates (see e.g., Weiß et al. 2005; 2007; Riechers et al. 2006; 2010; 2011; 2020 for similar strategies).
The peak of the CO line ladder can be fitted well with a moderate temperature, moderate density component, which, however, underpredicts both the CO(=21) and the CO(=109) line fluxes (see Fig. 11). Given the shape of the line ladder, three LVG components are required to fit all lines simultaneously, with =35, 40, and 100 K and log [(H2)/cm-3]=3.0, 4.0, and 6.0, respectively. The total LVG-predicted CO(=10) line flux is 0.18 Jy km s-1, corresponding to a CO line brightness temperature ratio between the CO =21 and 10 lines of =0.95. As such, the measured CO(=21) line profile is expected to be a good representation of the total CO emission. From our model, we find that 57% of the CO(=10) emission are associated with the gas component that dominantly contributes at the peak of the line ladder, with only 30% being associated with the lowest-excitation component (which, however, may dominate the total gas mass). Only 13% is due to the highest-excitation component, which is required to reproduce the observed CO =109 to 98 ratio, such that it is expected to contribute relatively little to the total gas mass (or dust mass). This component only becomes a dominant contributor to the CO line luminosity in the CO(=87) line and above. Overall, we are able to fully explain the CO excitation up to the =109 level with collisional excitation, without requiring unusually high or (H2) compared to the conditions that exist in molecular cloud cores. We also do not find evidence for very cold gas, but such emission would be challenging to detect given the CMB temperature of close to 20 K at this redshift. We find that the line flux ratio between ADFS-27N and S increases by only 4% between the CO =98 and 109 lines, which is insignificant compared to the relative calibration uncertainties. As such, further measurements are required to investigate any potential difference in CO excitation between the two merging galaxies.
We compare the CO line excitation in ADFS-27 to those found in the same sample studied above in the dust continuum analysis (dashed lines in Fig. 11; models adopted from Riechers et al. 2013; 2020). We find that ADFS-27 has a moderate CO excitation for a =5 dusty starburst galaxy, but we caution that the only other source for which measurements up to the CO =109 transition have been reported is HFLS3 at =6.34. As such, the presence of potentially warmer, high-excitation components cannot be ruled out for HDF 850.1 and GN10, i.e., the sources with apparently lower CO excitation than ADFS-27. However, we note that these are also the two sources with the lowest levels, such that the level of CO excitation, to first order, appears to parallel that seen in the dust continuum SED shapes, with the warmest sources showing the highest CO excitation. Moreover, to first order, this parallels the trend in increasing CO excitation with increasing SFR surface density previously proposed by Riechers et al. (2020).
4.4 Dynamical Masses, Gas Mass Fraction, and Gas-to-Dust Ratio
The CO emission in ADFS-27N and S is resolved both spatially and in velocity space, showing similar gradients in the CO =98 and 109 lines (Fig. 5). Since the patterns are comparable, but the CO(=109) line is difficult to de-blend from the H2O contribution to the velocity field, we focus on the CO(=98) kinematic structure in the following. From blue to red, the centroid of the CO emission in ADFS-27N moves by approximately 0.25′′ (1.5 kpc) from north-west to south-east, where the east-west extension marks the dominant contribution (0.24′′) relative to north-south (maximum of 0.14′′). The CO centroid in ADFS-27S moves by 0.19′′ (1.2 kpc), and almost entirely in the north-south direction (0.19′′ versus maximum east-west motion of 0.02′′). The source sizes are consistent with point sources in all but their central velocity channels, showing that the physical extent of the galaxies in their moment-0 maps is mostly due to spatially-resolved velocity gradients. In their central channels, ADFS-27N has a CO(=98) diameter of (51767) mas(23671) mas, and ADFS-27S is (32863) mas(10174) mas. These are comparable to the sizes in the moment-0 maps, but ADFS-27N is consistent with being 30% more extended. The velocity gradients are consistent with disk-like rotation in both cases, but higher spatial resolution is required to better distinguish between rotation- and dispersion-dominated components since constraints on the CO velocity dispersion are currently largely limited to the galaxy-wide dispersion.
To obtain dynamical mass estimates, we adopt an isotropic virial estimator (e.g., Engel et al. 2010), and sizes that are 30% larger than the averages obtained from the moment-0 and continuum maps for ADFS-27N to account for the findings in the previous paragraph. For the CO(=98) line widths, this yields =(4.40.3)1011 , and =(3.60.3)1011 , for a total value of =(8.00.4)1011 across both components. Using the stellar and dust masses found in our analysis, and neglecting any potential mass contributions from dark matter, we find upper limits on the conversion factor from CO luminosity to molecular gas mass of 2.4 and 3.3 (K km s-1 pc-2)-1 for ADFS-27N and S, respectively. If we assume a 25% contribution to due to dark matter (e.g., Daddi et al. 2010), these limits are reduced to 1.5 and 2.3 (K km s-1 pc-2)-1. This suggests that an assumption of =1.0 (K km s-1 pc-2)-1 is reasonable for a merger-driven starburst at 6 like ADFS-27. We thus adopt this value throughout this work. This corresponds to gas mass fractions of =0.26 for each source component. When assuming the CO(=98) line flux ratio as the gas mass ratio, we find gas-to-dust ratios of 458 and 6510 for ADFS-27N and S, respectively, or a source-averaged value of 506. This is comparable to what is found for the =6.34 dusty starburst HFLS3 (Riechers et al. 2013), and compatible with the values found for nearby star-forming galaxies (e.g., Wilson et al. 2008). It also is compatible with the earlier value found by Riechers et al. (2017) under common assumptions.
| Quantity | Unit | ADFS-27 | ADFS-27N | ADFS-27S |
|---|---|---|---|---|
| 1011 | 2.10.2 | 1.160.10 | 0.940.08 | |
| 109 | 4.20.4 | 2.60.4 | 1.50.2 | |
| 1011 | 2.10.6 | 1.61.3aaWe estimate this value to have a systematic uncertainty of a factor of three. | 0.460.15 | |
| 1011 | 8.00.4 | 4.40.3 | 3.60.3 | |
| SFRIR | yr-1 | 2380 | 1330130 | 1050110 |
| Myr | 11060 | 8030 | ||
| GDR=/ | 506 | 458 | 6510 | |
| DY[]=/ | 2% | 1.6% | 3.2% | |
| =/ | 0.260.02 | 0.260.03 | 0.260.03 | |
| (K km s-1 pc2)-1 | 1.5 | 2.3 | ||
| =/SFRbbValues would be 1.3 times lower/higher when assuming the SFR of 3100330 yr-1 found by CIGALE, which we consider to be the systematic uncertainty for these quantities. | Myr | 8810 | 8712 | 8912 |
| 104 pc2 | 3.0 | 1.9 | 4.0 | |
| bbValues would be 1.3 times lower/higher when assuming the SFR of 3100330 yr-1 found by CIGALE, which we consider to be the systematic uncertainty for these quantities. | kpc2 | 340140 | 280110 | 450200 |
4.5 Gas Mass, Surface Density, and Depletion Time
Based on the LVG-predicted CO(=10) line luminosity, we find a total cold molecular gas mass of =(2.10.2)1011 , where is the conversion factor from CO luminosity to molecular gas mass in units of (K km s-1 pc-2)-1. Based on the extent of the high- CO and dust emission, this provides an upper limit on the gas surface density of 3.0104 pc-2. When assuming the CO(=98) line flux ratio, this also suggests 1.9104 pc-2 and 4.0104 pc-2 for ADFS-27N and S, respectively. This is approximately consistent with the star-formation law found at lower redshift (e.g., Hodge et al. 2015). It also corresponds to an overall gas depletion timescale of 9010 Myr, which is consistent with expectations for starburst galaxies (e.g., Carilli & Walter 2013).666The derived would be by a factor of 1.3 shorter when using the SFR estimates from CIGALE, but this could be compensated by a higher , as allowed by the data within the uncertainties.
4.6 OH+ and CH+ Optical Depths and Column Densities
Together with HFLS3 (=6.34; see Fig. 8 and Riechers et al. 2013), ADFS-27N is only the second 6 galaxy that shows absorption/emission from OH+ and CH+. The (on average) blueshifted OH+ and CH+ absorption toward ADFS-27N is expected to come from a cool (100 K), low-density (100 cm-3), spatially-extended gas component, while the broad, redshifted OH+ emission component is likely associated with a shock-heated, dense gas component impacted by galactic winds (e.g., Falgarone et al. 2017). The OH+ emission thus may be associated with the densest gas component in the “maximum starburst” nucleus that leads to the enhanced CO(=109) emission, and the spatial and redshift offset may suggest that it is associated with a wind emerging from this region. The optical depth of an unsaturated absorption line is =–ln(), where is the fraction of the continuum emission that is still transmitted. Averaged over the entire line widths, we find =0.350.04 for the absorption component of the OH+(1101) line and =0.380.18 for the tentative CH+(=10) line observed toward ADFS-27N. This corresponds to velocity-integrated optical depths of 23426 and 415198 km s-1, respectively. The difference between both molecules is not significant, and largely due to the broader velocity range adopted for the tentative CH+ feature. As such, we conclude that the OH+ and CH+ optical depths are indistinguishable at the quality level of our current data. The CH+ peak optical depth is comparable to those found for strongly-lensed dusty starbursts at 2 (Falgarone et al. 2017).
Following Equation 5 of Indriolo et al. (2018) and Falgarone et al. (2017), we find OH+ and CH+ column densities of (11.41.2) and (12.55.9)1014 cm-2, which is comparable to what is found for the Cosmic Eyelash at =2.3 by the same authors, despite a roughly 5 times higher star-formation rate in ADFS-27N. These authors suggest that estimates based on this ground-state OH+ transition should be a good representation of the total OH+ column density, given that the CMB temperature even at =5.7 is significantly below that necessary to populate the first rotationally excited state of OH+. Based on the modeling carried out by Indriolo et al., this is consistent with a cosmic ray ionization rate of 10-15 s-1 in the gas found in a low-density, extended gaseous halo around ADFS-27N that gives rise to the OH+ and CH+ absorption. In this regard, the non-detection of absorption towards ADFS-27S is interesting, since it may suggest that the diffuse gaseous halo does not extend out to or beyond 9 kpc from the central source, despite the early-stage merger between ADFS-27N and S. On the other hand, the redshift difference of (14013) km s-1 may indicate that ADFS-27S is in the foreground of ADFS-27N, such that the de-projected distance may exceed 10 kpc or more.
Following Falgarone et al. (2017), we estimate that the hydrogen mass in the diffuse halo is 5% of the total gas mass of ADFS-27, which we consider to be uncertain by a factor of a few. The absolute value of 0.61010 is comparable to those found for strongly-lensed 2 dusty starbursts (Falgarone et al. 2017). To create such a mass reservoir on 45 Myr timescales (i.e., approximately half the gas depletion time) through gaseous outflows would require an mass outflow rate of 125 yr-1, corresponding to 9% of the current SFR of ADFS-27N. Thus, it appears realistic to assume that the extended gas reservoir is maintained by a starburst-driven outflow from the “maximum starburst” nucleus. Given the lack of a detection of any OH+ or CH+ absorption toward the more compact, higher- component ADFS-27S, we conclude that such diffuse gas reservoirs in the environment of the most intense starbursts may not be entirely spherical. Since ADFS-27N appears to be the older source component by 30 Myr, it could also be possible that enhanced OH+ features preferentially appear in slightly later stages of the evolution of HyLIRGs. However, the ages of both source components agree within the uncertainties, such that this conclusion remains speculative.
4.7 On the “870 micron riser” population
Since the initial discovery of ADFS-27, one additional “870 micron riser” has been reported, SPT 0245–63 at =5.6256 (Reuter et al. 2020). The same work has also revised the redshift of the other previously known example, SPT 0243–49, to =5.7022. Together with the redshifts of ADFS-27N and S, this yields an average redshift of =5.659 for the currently known population, with a surprisingly narrow range in redshift of 0.038 that may be dominantly due to the currently small sample size.
5 Conclusions
We have detected CO =21 to 109 emission toward the =5.7 binary HyLIRG ADFS-27, revealing a massive, moderately highly excited molecular gas reservoir with a mass of =(2.10.2)1011 , corresponding to about 25% of its stellar mass. The two starbursts are separated by only 140 km s-1 along the line of sight, and 9.0 kpc in projection. The kinematic structure seen in high- CO line emission is consistent with 2.3 kpc diameter rotating disks in both cases, but the factor of about 2 difference in minor axis length may suggest differences in orientation toward the line of sight, unless the sources are intrinsically asymmetric. The dynamical mass estimates suggest that ADFS-27 is consistent with a 1:1 merger of very massive galaxies that have comparable gas fractions, which at face value would suggest a similar evolutionary stage. A detection of high-level (=3) H2O lines and ground-state OH+ transitions in emission, together with an apparently enhanced CO(=109) flux, reveals the presence of a high density, high kinetic temperature gas component and a strong infrared radiation field embedded in the gas reservoir, which is likely associated with the cores of the “maximum starburst” nuclei. The H2O emission appears to be significantly stronger in the southern starburst ADFS-27S, which may indicate a higher radiation field intensity. On the other hand, a blueshifted absorption component is seen in the OH+ and (tentatively) CH+ ground-state transitions, together with redshifted OH+ emission, in the northern starburst ADFS-27N, whereas neither of these molecular species is detected in ADFS-27S. This suggests the presence of a massive molecular outflow from the northern source, which feeds enriched gas to its halo at a rate of approximately 125 yr-1, or 9% of its SFR. The lack of OH+ and CH+ absorption in ADFS-27S could be understood if the distribution of the diffuse gas has a relatively low covering fraction. However, this interpretation is not preferred when taking into account the finding that CH+ absorption in particular appears to be ubiquitous towards 2 lensed starbursts (Falgarone et al. 2017).
ADFS-27S appears to be the warmer source, consistent with its stronger H2O emission, but the dust temperature of =59 K averaged over both source components is moderate for a 5 dusty starburst (which have a median =50 K; Riechers et al. 2020). A difference in dust temperature between the two starbursts would be consistent with the unusual shape of the peak of its dust SED, which has currently not been resolved into the two components on the Wien side. Stellar light is detected toward ADFS-27S in the rest-frame ultraviolet, while ADFS-27N remains undetected below at least observed-frame 3.6 m. Modeling of the full spectral energy distribution suggests that the deeply-embedded, “optically-dark” source component ADFS-27N is the older of the two sources (albeit consistent within the uncertainties), with an age of only 110 Myr (compared to 80 Myr for ADFS-27S). However, it cannot be ruled out that an older stellar population is completely hidden from our view in ADFS-27N, and it would likely be outshone by the light from young massive stars in ADFS-27S. The inferred ages of the stellar populations are comparable to the gas depletion times in both sources (which themselves are comparable to other 5 dusty starbursts, e.g., Riechers et al. 2020), which may suggest an intermediate stage of their starbursts, despite the relatively early stage of the merger.
Overall, the two merging HyLIRGs that are part of the ADFS-27 system show decisively different physical properties, several of which cannot be solely explained by orientation or line-of-sight differences. This may suggest at least some differences in their evolutionary stages, or in the gas supply that powers their starbursts and the resulting feedback. The extended diffuse gas reservoir associated with ADFS-27N seen in OH+ and CH+ in absorption can plausibly be put in place through feedback on tens of millions of years timescales and supported by its current gas reservoir, such that even a 30 Myr difference in the onset times of the starbursts could explain a fair range of the differences seen between both sources. As such, our findings on the feedback timescales are consistent with those found for strongly-lensed 2 starbursts (e.g., Falgarone et al. 2017).
After concluding the major merger process and depleting its large gas reservoir through intense star formation, ADFS-27 will likely evolve into one of the most massive galaxies by =3–4, with a stellar mass of order 41011 or more (depending on additional gas supply). While major mergers may not be the dominant process leading to galaxy mass assembly in the universe, this event will be important to form such a rare, massive galaxy early in the universe’s history. Despite its relatively short gas depletion timescale of 90 Myr, at least part of the gas mass will be converted into stars on longer timescales, due to the already observed feedback processes, extending the star formation period to likely at least a few hundred million years, even before accounting for additional gas accretion from larger scales from the environment of ADFS-27.
Given the lack of identifications of other, similar 1:1 mergers of a few times 1011 galaxies at comparable redshifts,777Other, at least somewhat similar examples are known at =2–4, e.g., Fu et al. (2013); Emonts et al. (2015); Oteo et al. (2016). a detailed study of the ADFS-27 system is of particular interest to understand such a rare, relatively short-lived phase in the early evolution of massive galaxies. Higher-resolution ALMA data will be capable of revealing the sub-kiloparsec scale gas dynamics that are not yet accessible with the current data, but which are required to reveal if the two merger components truly are rotating, smooth disks, or if they already show substantial pertubation of their velocity fields. ALMA will also be able to better constrain the properties of the extended diffuse gas component, setting the stage for similar investigations in low- CO emission with the Next Generation Very Large Array (ngVLA; e.g., Murphy et al. 2018) for galaxies in the northern sky in the coming decade. At the same time, JWST will be able to better constrain the properties of the stellar populations, in particular for ADFS-27N, which remains undetected in our deep HST imaging due to dust obscuration. Given the extreme rarity of systems like ADFS-27, a more precise measurement of its stellar mass and age will be key to constrain the parameter space that needs to be explored by simulations of galaxy formation to account for the enigmatic HyLIRG population that already existed within the first billion years of cosmic time.
References
- Bergvall et al. (2016) Bergvall, N., Marquart, T., Way, M. J., et al. 2016, A&A, 587, A72, doi: 10.1051/0004-6361/201525692
- Bertin & Arnouts (1996) Bertin, E., & Arnouts, S. 1996, A&AS, 117, 393, doi: 10.1051/aas:1996164
- Boquien et al. (2019) Boquien, M., Burgarella, D., Roehlly, Y., et al. 2019, A&A, 622, A103, doi: 10.1051/0004-6361/201834156
- Bouwens et al. (2015) Bouwens, R. J., Illingworth, G. D., Oesch, P. A., et al. 2015, ApJ, 803, 34, doi: 10.1088/0004-637X/803/1/34
- Bruzual & Charlot (2003) Bruzual, G., & Charlot, S. 2003, MNRAS, 344, 1000, doi: 10.1046/j.1365-8711.2003.06897.x
- Burgarella et al. (2005) Burgarella, D., Buat, V., & Iglesias-Páramo, J. 2005, MNRAS, 360, 1413, doi: 10.1111/j.1365-2966.2005.09131.x
- Burgarella et al. (2020) Burgarella, D., Nanni, A., Hirashita, H., et al. 2020, A&A, 637, A32, doi: 10.1051/0004-6361/201937143
- Carilli & Walter (2013) Carilli, C. L., & Walter, F. 2013, ARA&A, 51, 105, doi: 10.1146/annurev-astro-082812-140953
- Chabrier (2003) Chabrier, G. 2003, PASP, 115, 763, doi: 10.1086/376392
- Daddi et al. (2010) Daddi, E., Bournaud, F., Walter, F., et al. 2010, ApJ, 713, 686, doi: 10.1088/0004-637X/713/1/686
- Dale et al. (2001) Dale, D. A., Helou, G., Contursi, A., Silbermann, N. A., & Kolhatkar, S. 2001, ApJ, 549, 215, doi: 10.1086/319077
- Dowell et al. (2014) Dowell, C. D., Conley, A., Glenn, J., et al. 2014, ApJ, 780, 75, doi: 10.1088/0004-637X/780/1/75
- Draine & Li (2007) Draine, B. T., & Li, A. 2007, ApJ, 657, 810, doi: 10.1086/511055
- Emonts et al. (2015) Emonts, B. H. C., De Breuck, C., Lehnert, M. D., et al. 2015, A&A, 584, A99, doi: 10.1051/0004-6361/201526090
- Engel et al. (2010) Engel, H., Tacconi, L. J., Davies, R. I., et al. 2010, ApJ, 724, 233, doi: 10.1088/0004-637X/724/1/233
- Faisst et al. (2020) Faisst, A. L., Fudamoto, Y., Oesch, P. A., et al. 2020, MNRAS, doi: 10.1093/mnras/staa2545
- Falgarone et al. (2017) Falgarone, E., Zwaan, M. A., Godard, B., et al. 2017, Nature, 548, 430, doi: 10.1038/nature23298
- Flower (2001) Flower, D. R. 2001, Journal of Physics B: Atomic, Molecular and Optical Physics, 34, 2731, doi: 10.1088/0953-4075/34/13/315
- Fu et al. (2013) Fu, H., Cooray, A., Feruglio, C., et al. 2013, Nature, 498, 338, doi: 10.1038/nature12184
- Gaia Collaboration et al. (2018) Gaia Collaboration, Brown, A. G. A., Vallenari, A., et al. 2018, A&A, 616, A1, doi: 10.1051/0004-6361/201833051
- González-Alfonso et al. (2010) González-Alfonso, E., Fischer, J., Isaak, K., et al. 2010, A&A, 518, L43, doi: 10.1051/0004-6361/201014664
- González-Alfonso et al. (2012) González-Alfonso, E., Fischer, J., Graciá-Carpio, J., et al. 2012, A&A, 541, A4, doi: 10.1051/0004-6361/201118029
- Greve et al. (2005) Greve, T. R., Bertoldi, F., Smail, I., et al. 2005, MNRAS, 359, 1165, doi: 10.1111/j.1365-2966.2005.08979.x
- Hodge & da Cunha (2020) Hodge, J. A., & da Cunha, E. 2020, arXiv e-prints, arXiv:2004.00934. https://arxiv.org/abs/2004.00934
- Hodge et al. (2015) Hodge, J. A., Riechers, D., Decarli, R., et al. 2015, ApJ, 798, L18, doi: 10.1088/2041-8205/798/1/L18
- Indriolo et al. (2018) Indriolo, N., Bergin, E. A., Falgarone, E., et al. 2018, ApJ, 865, 127, doi: 10.3847/1538-4357/aad7b3
- Ivison et al. (2011) Ivison, R. J., Papadopoulos, P. P., Smail, I., et al. 2011, MNRAS, 412, 1913, doi: 10.1111/j.1365-2966.2010.18028.x
- Ivison et al. (2013) Ivison, R. J., Swinbank, A. M., Smail, I., et al. 2013, ApJ, 772, 137, doi: 10.1088/0004-637X/772/2/137
- Laigle et al. (2016) Laigle, C., McCracken, H. J., Ilbert, O., et al. 2016, ApJS, 224, 24, doi: 10.3847/0067-0049/224/2/24
- Magdis et al. (2012) Magdis, G. E., Daddi, E., Béthermin, M., et al. 2012, ApJ, 760, 6, doi: 10.1088/0004-637X/760/1/6
- Mathis et al. (1983) Mathis, J. S., Mezger, P. G., & Panagia, N. 1983, A&A, 500, 259
- McMullin et al. (2007) McMullin, J. P., Waters, B., Schiebel, D., Young, W., & Golap, K. 2007, in Astronomical Society of the Pacific Conference Series, Vol. 376, Astronomical Data Analysis Software and Systems XVI, ed. R. A. Shaw, F. Hill, & D. J. Bell, 127
- Murphy et al. (2018) Murphy, E. J., Bolatto, A., Chatterjee, S., et al. 2018, in Astronomical Society of the Pacific Conference Series, Vol. 517, Science with a Next Generation Very Large Array, ed. E. Murphy, 3. https://arxiv.org/abs/1810.07524
- Neri et al. (2014) Neri, R., Downes, D., Cox, P., & Walter, F. 2014, A&A, 562, A35, doi: 10.1051/0004-6361/201322528
- Nguyen et al. (2010) Nguyen, H. T., Schulz, B., Levenson, L., et al. 2010, A&A, 518, L5, doi: 10.1051/0004-6361/201014680
- Noll et al. (2009) Noll, S., Burgarella, D., Giovannoli, E., et al. 2009, A&A, 507, 1793, doi: 10.1051/0004-6361/200912497
- Oliver et al. (2012) Oliver, S. J., Bock, J., Altieri, B., et al. 2012, MNRAS, 424, 1614, doi: 10.1111/j.1365-2966.2012.20912.x
- Oteo et al. (2016) Oteo, I., Ivison, R. J., Dunne, L., et al. 2016, ApJ, 827, 34, doi: 10.3847/0004-637X/827/1/34
- Pavesi et al. (2019) Pavesi, R., Riechers, D. A., Faisst, A. L., Stacey, G. J., & Capak, P. L. 2019, ApJ, 882, 168, doi: 10.3847/1538-4357/ab3a46
- Pavesi et al. (2016) Pavesi, R., Riechers, D. A., Capak, P. L., et al. 2016, ApJ, 832, 151, doi: 10.3847/0004-637X/832/2/151
- Pavesi et al. (2018) Pavesi, R., Riechers, D. A., Sharon, C. E., et al. 2018, ApJ, 861, 43, doi: 10.3847/1538-4357/aac6b6
- Rangwala et al. (2011) Rangwala, N., Maloney, P. R., Glenn, J., et al. 2011, ApJ, 743, 94, doi: 10.1088/0004-637X/743/1/94
- Reuter et al. (2020) Reuter, C., Vieira, J. D., Spilker, J. S., et al. 2020, arXiv e-prints, arXiv:2006.14060. https://arxiv.org/abs/2006.14060
- Riechers et al. (2011) Riechers, D. A., Hodge, J., Walter, F., Carilli, C. L., & Bertoldi, F. 2011, ApJ, 739, L31, doi: 10.1088/2041-8205/739/1/L31
- Riechers et al. (2006) Riechers, D. A., Walter, F., Carilli, C. L., et al. 2006, ApJ, 650, 604, doi: 10.1086/507014
- Riechers et al. (2010) Riechers, D. A., Capak, P. L., Carilli, C. L., et al. 2010, ApJ, 720, L131, doi: 10.1088/2041-8205/720/2/L131
- Riechers et al. (2013) Riechers, D. A., Bradford, C. M., Clements, D. L., et al. 2013, Nature, 496, 329, doi: 10.1038/nature12050
- Riechers et al. (2014) Riechers, D. A., Carilli, C. L., Capak, P. L., et al. 2014, ApJ, 796, 84, doi: 10.1088/0004-637X/796/2/84
- Riechers et al. (2017) Riechers, D. A., Leung, T. K. D., Ivison, R. J., et al. 2017, ApJ, 850, 1, doi: 10.3847/1538-4357/aa8ccf
- Riechers et al. (2020) Riechers, D. A., Hodge, J. A., Pavesi, R., et al. 2020, ApJ, 895, 81, doi: 10.3847/1538-4357/ab8c48
- Robson et al. (2014) Robson, E. I., Ivison, R. J., Smail, I., et al. 2014, ApJ, 793, 11, doi: 10.1088/0004-637X/793/1/11
- Rowan-Robinson (2000) Rowan-Robinson, M. 2000, MNRAS, 316, 885, doi: 10.1046/j.1365-8711.2000.03588.x
- Sanders & Mirabel (1996) Sanders, D. B., & Mirabel, I. F. 1996, ARA&A, 34, 749, doi: 10.1146/annurev.astro.34.1.749
- Sault et al. (1995) Sault, R. J., Teuben, P. J., & Wright, M. C. H. 1995, in Astronomical Society of the Pacific Conference Series, Vol. 77, Astronomical Data Analysis Software and Systems IV, ed. R. A. Shaw, H. E. Payne, & J. J. E. Hayes, 433. https://arxiv.org/abs/astro-ph/0612759
- Simpson et al. (2020) Simpson, J. M., Smail, I., Dudzevičiūtė, U., et al. 2020, MNRAS, 495, 3409, doi: 10.1093/mnras/staa1345
- Smolčić et al. (2017) Smolčić, V., Miettinen, O., Tomičić, N., et al. 2017, A&A, 597, A4, doi: 10.1051/0004-6361/201526989
- Tacconi et al. (2008) Tacconi, L. J., Genzel, R., Smail, I., et al. 2008, ApJ, 680, 246, doi: 10.1086/587168
- Tadaki et al. (2020) Tadaki, K.-i., Iono, D., Yun, M. S., et al. 2020, ApJ, 889, 141, doi: 10.3847/1538-4357/ab64f4
- Walter et al. (2012) Walter, F., Decarli, R., Carilli, C., et al. 2012, Nature, 486, 233, doi: 10.1038/nature11073
- Weiß et al. (2007) Weiß, A., Downes, D., Neri, R., et al. 2007, A&A, 467, 955, doi: 10.1051/0004-6361:20066117
- Weiß et al. (2005) Weiß, A., Downes, D., Walter, F., & Henkel, C. 2005, A&A, 440, L45, doi: 10.1051/0004-6361:200500166
- Wilson et al. (2008) Wilson, C. D., Petitpas, G. R., Iono, D., et al. 2008, ApJS, 178, 189, doi: 10.1086/590910
- Wilson et al. (2011) Wilson, W. E., Ferris, R. H., Axtens, P., et al. 2011, MNRAS, 416, 832, doi: 10.1111/j.1365-2966.2011.19054.x