Probing the interaction at the high energy upgrade of the LHC
Abstract
An interaction at the tree level is a common feature of new physics models that feature scalar triplets. In this study, we aim to probe the strength of the aforementioned interaction in a model-agnostic fashion at the futuristic 27 TeV proton-proton collider. We assume that the couples dominantly to () and () and specifically study the processes that involve the vertex at the production level, that is, and . Moreover, we look into both decays for either production process. Our investigations reveal that the production process has a greater reach compared to . Moreover, the discovery potential of a charged Higgs improves markedly with respect to the earlier studies corresponding to lower centre-of-mass energies. Finally, we recast our results in the context of the popular Georgi-Machacek model.
I Introduction
With the discovery of a Higgs boson of mass 125 GeV Aad et al. (2012); Chatrchyan et al. (2012), the particle spectrum of the Standard Model (SM) is complete. Moreover, the properties of the discovered boson are found to be increasingly consistent with that of the SM Higgs. Despite this success, the SM remains far from being the complete framework. Certain issues on both theoretical and experimental fronts advocate for additional dynamics beyond the SM. Interestingly, extending just the scalar sector of the SM can suffice to address such issues. This puts forth extended Higgs sectors as prototypes of new physics (NP).
A subset of extended Higgs sectors features additional scalar multiplets and all of them predict at least one singly charged scalar . While the tree level fermionic couplings of are generally proportional to the fermion mass for all representations, it is the coupling to the gauge bosons that can differ. For instance, the interaction vanishes at the tree level for a two-Higgs doublet model (2HDM) Deshpande and Ma (1978); Branco et al. (2012); Grifols and Méndez (1980); Gunion et al. (2000). This coupling is generated at one-loop Kanemura (2000a, b); Abbas et al. (2018); Arhrib et al. (2007) and hence is generally small in magnitude. And this is true regardless the number of such scalar doublets. On the contrary, the aforementioned coupling is non-zero at the tree level itself in case of scalar triplets Schechter and Valle (1980); Magg and Wetterich (1980); Lazarides et al. (1981); Cheng and Li (1980) and is proportional to the vacuum expectation value (VEV) acquired by the neutral component of the triplet. The triplet VEV is however tightly constrained by measurements of the -parameter for the simplistic Higgs triplet model (HTM) (that employs a complex scalar triplet over and above the doublet) thereby obscuring the observability of the coupling. That said, there exist non-minimal extensions of the HTM where this problem can be circumvented. These involve combining a real scalar triplets with a complex ones in a custodially symmetric manner such that the -parameter is unity for all values of the triplet VEV. The most popular of such extensions arguably is the Georgi-Machacek (GM) model (see Georgi and Machacek (1985); Chanowitz and Golden (1985); Gunion et al. (1990); Aoki and Kanemura (2008); Chiang and Yagyu (2013); Hartling et al. (2014, 2015); Chiang et al. (2014); Blasi et al. (2017); Logan and Rentala (2015); Keeshan et al. (2020); Ghosh et al. (2020); Banerjee et al. (2019); Azevedo et al. (2021); Moultaka and Peyranère (2020); Ismail et al. (2021); Zhou et al. (2019); Sun et al. (2017); Degrande et al. (2017); Chang et al. (2017) for a partial list of references) that features an global symmetry in the scalar potential. This framework predicts two charged Higgses both of which couple to . In fact, they also get to interact with the SM fermions by virtue of mixings induced by the scalar potential. Given that the strengths of such Yukawa interactions are proportional to the corresponding fermion masses, the one with the pair is of foremost importance here. The charged Higgses emerging from the more non-minimal extensions also naturally feature sizeable couplings to () and (). Therefore, owing to the fact that the interaction features in a plethora of new physics (NP) scenarios, there is the enticing possibility of probing the same in a model-independent fashion.
A singly charged Higgs lighter than the -quark has been looked for at the LHC via the decay. On the other hand, a heavier one is searched in processes where it is produced in association with a and subsequently decays to a pair of fermions. Such channels include Aaboud et al. (2018a); Aad et al. (2016); Khachatryan et al. (2015a), Aaboud et al. (2018b); Aad et al. (2015a), Sirunyan et al. (2018) and Khachatryan et al. (2015b). These searches mainly rely on the strength of the Yukawa interactions of . In addition, bosonic decays of the form , where denotes a scalar have also been of substantial interest Patrick et al. (2018, 2017); Li et al. (2016); Moretti et al. (2016, 2016); Coleppa et al. (2014, 2020). On the other hand, the interaction has been probed in Sirunyan et al. (2017); Aad et al. (2015b) in context of the GM model and scalar triplet extensions of the minimal supersymmetric standard model (MSSM) Bandyopadhyay et al. (2015a, b, 2016); Bandyopadhyay and Costantini (2018). A recent review on charged Higgs phenomenology in 2HDM is Akeroyd et al. (2017).
In this work, we set out to study the interaction at the proposed 27 TeV energy upgrade Azzi et al. (2019) of the Large Hadron Collider (LHC), the so-called high-energy LHC (HE-LHC). We adopt a generic but simplistic framework comprising and interactions only. We look for the in processes that involve the coupling at the production vertex. Two such important processes are fusion and the -mediated . Following production, the decay modes are looked at and bounds on the corresponding branching fractions are derived corresponding to 15 ab-1 integrated luminosity. The generality of the adopted framework makes the obtained results applicable to a wide variety of models that consist of at least one charged Higgs.
The study is organised as follows. We propose the theoretical framework in section II. The existing LHC constraints and our analysis strategy are discussed in section III. Section IV contains the analyses for the proposed channels. The results so obtained are recasted as favoured regions in the model parameter space in section V. Finally we summarise and conclude in section VI.
II Theoretical framework
The following Lagrangian describes the dimension 4 interactions of an in a generic fashion Barger et al. (1990); Cen et al. (2019); Diaz-Cruz et al. (2001) 111Momentum dependent interactions borne out of higher dimensional operators Diaz-Cruz et al. (2001) have not been considered in this study.:
| (1) |
In the above, and are dimensionless parameters quantifying the strengths of the and interactions respectively. To generate some perspective, we comment here on the typical values for , and for two specific classes of models. In scalar sectors containing doublets alone, is generated radiatively at the one-loop level. The largest for a 2HDM is reported to be 0.01 Moretti et al. (2015) with further enhancement expected with increasing the number of scalar doublets. For example, addition of an additional inert (color-octet) doublet elevates the maximum value of to 0.03 (0.025) Moretti et al. (2015); Chakrabarty et al. (2020). While this trend is encouraging, one must note that arbitrarily increasing the number of scalar doublets not only is limited by the experimental constraints such as that of the electroweak -parameter and the diphoton signal strength, the model becomes aesthetically unattractive and loses predictive power. Therefore, is in the ballpark for realistic multi-doublet extensions of the SM. The other parameter of interest, equals cot for a 2HDM and its inert doublet and color-octet doublet extensions. Here, tan with and denoting the VEVs of the two active doublets. Since tan is ruled out by flavour constraints, one has for a 2HDM. In fact, tan [1,10] are typical values allowed for the pure 2HDM (see Chowdhury and Eberhardt (2018) for a global analysis of the 2HDM parameter space) leading to [0.1,1]. On the other hand, equals cot (tan) for a Type-I (Type-II) 2HDM.
The other class of models are characterised by scalar triplets where is non-zero at the tree level itself. One derives for a single complex triplet. Here, and denote the triplet VEV, -mass, cosine of the Weinberg mixing angle and the gauge coupling respectively. In this case however, the -parameter constraint dictates GeV Tanabashi et al. (2018) leading to . The singly charged scalar couples to quarks by virtue of doublet-triplet mixing due to which where denotes the VEV of the SM-like doublet. And the maximum value permitted by the -parameter constraint is . The small for this model therefore renders both . The same is not true in case of the GM model where is allowed to be larger by virtue of the global symmetry of the scalar potential. A global analysis of the minimal GM model in Chiang et al. (2019) gives the bound 35 GeV thereby indicating and .
Other possible bosonic and fermionic interactions of are not included in the present study. Motivated by the some NP scenarios such as the Type-I 2HDM and the GM model, we further take in this work for the subsequent analysis. Therefore, with the framework being describable by the two interactions, the total decay width of reads
| (2) |
The branching ratios read
| (3a) | |||||
| (3b) | |||||
Finally, we give the expressions for the corresponding partial widths below.
| (4a) | |||||
| (4b) | |||||
| (4c) | |||||
Here, for and are the masses of the charged Higgs, top-quark, bottom-quark and -boson respectively. Henceforth, and are counted as the free parameters of the current framework.
III Analysis strategy and existing LHC limits
Two kinematically distinct topologies for production in - collisions that involve the interaction are and . In the former, an is produced by the fusion of and and two forward jets are emitted. This is essentially vector boson-fusion (VBF) that has close semblance to similar processes for -production, where, denotes the SM-like Higgs of mass 125 GeV. On the other hand, the process is a -mediated -channel topology. In this work, we aim to probe the decays for both the aforementioned production processes. Leptonic decays of and gives rise to the following four cascades: (a) , (b) , (c) and (d) , where . The corresponding Feynman diagrams are shown in Fig.1.
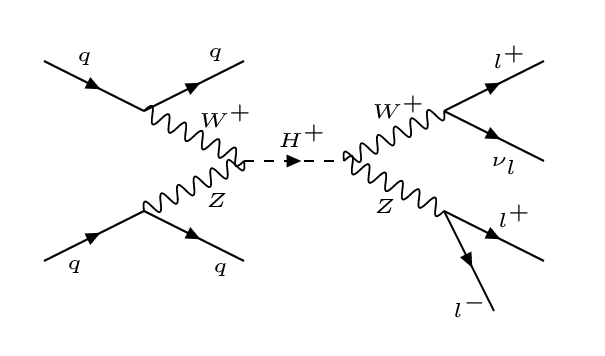
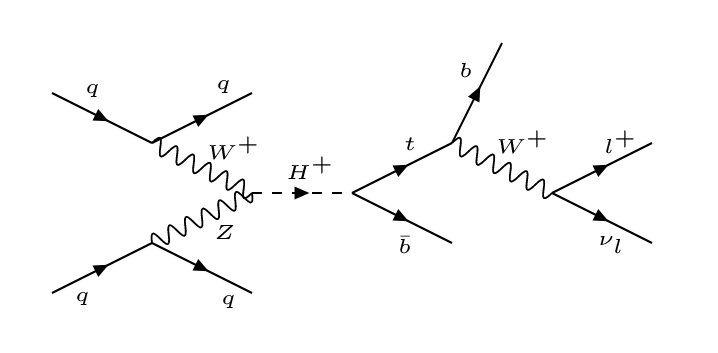
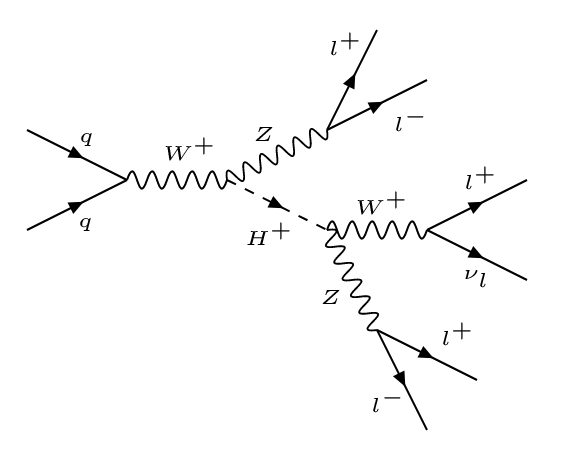
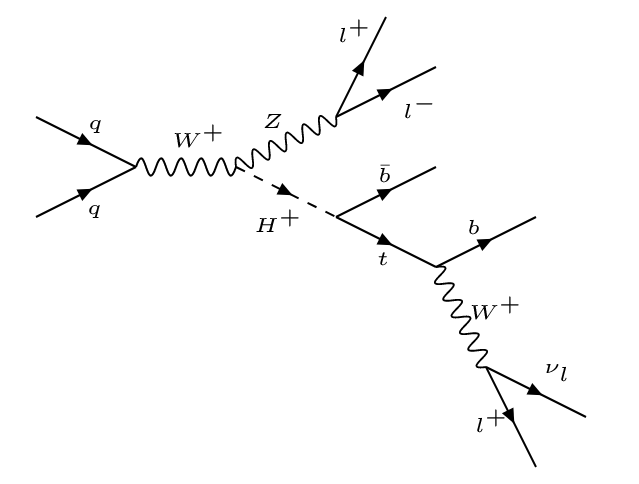
We reiterate for clarity that both processes (a) and (b) describe -production via VBF with subsequent decays to and modes respectively. Similarly, processes (c) and (d) correspond to the and decays of produced via .
As mentioned before, the framework can be described by , and the couplings and . We aim to explore the discovery potential of a 27 TeV -machine with integrated luminosity = 15 ab-1 through a detailed signal and background analysis of the aforementioned signal channels. Further, we supplement the conventional cut-based analyses (CBA) with the more sophisticated multivariate analyses (MVA) using the Boosted Decision Tree Decorrelated (BDTD) algorithm Roe et al. (2005). An overview of BDTD analysis will be given in subsection IV.1.
The performances of the proposed channels can be compared by drawing the exclusion and discovery contours corresponding to each in the plane for a given .
It is imperative to discuss possible exclusions on {} from previous collider searches. The proposed process (a) itself has been searched at the LHC by the ATLAS and CMS collaborations Aad et al. (2015b); Sirunyan et al. (2017). These searches have placed upper limits on as a function of . The CMS analysis for = 13 TeV and integrated luminosity = 15.2 fb-1 Aad et al. (2015b) predicts a stronger bound compared to the one by ATLAS analysis for = 8 TeV with 20.3 fb-1 of integrated luminosity Sirunyan et al. (2017) except for 300 GeV 400 GeV. We thus choose to work with the CMS bound in this work. A limit on can be obtained as,
| (5) |
Here denotes the cross section in our framework for for a given in absence of kinematical cuts.
Another pertinent search by ATLAS at 13 TeV and 36.2 fb-1 of integrated luminosity is Aaboud et al. (2018a). A more stringent bound comes from the recent search at 139 fb-1 data ATLAS-CONF-2020-039 (2020). Adopting the more recent bound, a limit on is derived as :
| (6) |
where, denotes the cross section for for a given in absence of kinematical cuts.
IV Collider analysis
We choose to perform analyses for = 200 GeV, 300 GeV, 500 GeV and 1 TeV which we tag as BP1, BP2, BP3 and BP4 respectively. The signal and background samples are generated using MG5aMC@NLO Alwall et al. (2014) at the leading order (LO). The NN23LO1 Parton Distribution Function (PDF) set and default hadronization and factorization scales are used. The parton level events are passed on to pythia8 Sjöstrand et al. (2015) for showering and hadronisation and subsequently to Delphes-3.4.1 for detector simulation. Specifically, we have throughout used the default ATLAS detector simulation card that comes with Delphes-3.4.1 de Favereau et al. (2014). The multivariate analysis is done using the TMVA package Hoecker et al. (2007). The signal significance is derived using Cowan et al. (2011), with denoting the number of signal (background) events surviving the kinematical cuts222The number of signal () and the background () events can be calculated as: (7) where denote the signal (background) cross section, integrated luminosity and signal (background) cut-efficiency respectively..
In order to estimate the effects on the final signal significance by assuming a systematic uncertainty of , the signal significance formula changes as:
| (8) |
where .
We set out to analyse the various channels following the aforementioned strategy. For processes (a),(c) and (b),(d) in Fig.1, (,BR()) and (,BR()) are respectively treated as the free parameters. That said, for a given signal, it is important to compare the results from CBA to those from MVA for specific reference values of and the branching ratios. Therefore, we take (,BR()) = (0.4,0.4) and (,BR()) = (0.4,0.4) as the reference for processes (a),(c) and (b),(d) respectively for the ensuing analysis.
IV.1 The channel
This subsection discusses the VBF production of followed by the decay. The VBF topology always leads to a couple of light jets in the forward and backward directions with negligible hadronic activity in the intervening rapidity gap. Since the two jets () reside in different -hemisphere for VBF production, the forward (backward) jet is identified by (). We therefore demand to tag the two leading light jets as forward and backward ones. The decay ultimately leads to three leptons, two of which are of same flavor and opposite sign (SFOS) that come from and the third one comes from . In addition, a neutrino also originates from . We choose to treat the branching ratio as a free parameter at this level. The signal cross sections for different are given in Table 1.
The most dominant SM backgrounds corresponding to signal come from and production followed by leptonic cascades. These two background processes involve jets at the production level as does the signal. Therefore, we demanded > 20 GeV, > 500 GeV, < 5 while generating these in order to pick out the phase space kinematically relevant to the VBF topology. The resulting LO cross sections of these two background processes along with their leptonic decay chains are given in Table 1. Sub-leading contributions to the backgrounds come from . We do not impose cuts at the generation level for the sub-leading ones since they do not involve jets at the production level, and, the corresponding cross sections are again listed in Table 1. A couple of observations then emerge. First, have negligible cross sections compared to the leading backgrounds. Secondly, though it might naively appear that the other sub-leading channels offer rates comparable to, or, even higher than , one must remember that their cross sections are computed in the absence of kinematical cuts. Therefore, stringent VBF selection cuts almost nearly obliterate . In all, it is only the and channels that are kinematically relevant to the analysis.
Events are selected by demanding at least two light jets () and three leptons after vetoing -jets and -jets in the final state. Of the two hardest light jets, one is demanded to be forward and the other as the backward one as mentioned earlier. We first initiate the cut-based approach. The following trigger-level cuts are applied:
| (9) |
| Signal / Backgrounds | Process | Cross section (LO) (fb) |
| Signal | ||
| BP1 ( GeV) | 5.49 | |
| BP2 ( GeV) | 3.43 | |
| BP3 ( GeV) | 1.64 | |
| BP4 ( TeV) | 0.46 | |
| Backgrounds | 120.0 | |
| 4.57 | ||
| 1.19 | ||
| 4.80 | ||
| 10.15 | ||
| 11.50 | ||
| 8.25 | ||
| 8.75 |
To start with, we shall compute the signal significance using the cut-based method. In addition to the trigger cuts, certain specific kinematic variables are identified to extract the signal with higher efficiency. They are . We denote the corresponding cuts to be respectively and they are optimised by looping over a few configurations and selecting the one that yields the maximum statistical significance. The cut-flow for the signal and background processes corresponding to the chosen BPs are displayed in Table 3-6. The following discussion motivates these variables and compares the signal and backgrounds in their terms.
-
•
and : A VBF topology demands a high invariant mass of the two forward jet system () and a large separation between their pseudo rapidities (). Thus high invariant mass cuts (given in Table 2) are used for all the benchmarks. Strong cuts on for enhancing the significance for all benchmark points can be found in Table 2. Corresponding normalised distributions for both signal and backgrounds are drawn in Fig.2(d) and Fig.2(e). It can be observed that the peak of distribution shifts towards higher value with increase in . From the distributions, it is evident that these cuts reduce the backgrounds to a large extent. The same is also reflected in the first two columns of Table 3, Table 4 and Table 5.
-
•
: Next comes a cut on the invariant mass of the system (), which must peak at the mass of the decaying in case of the signal. For constructing this variable, we have taken into account two possible combinations comprising of one same flavour opposite sign (SFOS) lepton pair (peaking at ) , one isolated lepton coming from -boson and -component of missing transverse energy 333, where ). and are the and component of the missing transverse momentum.. Two solutions of the -component of missing transverse energy lead to two different kinematic variables : and . Comparing these two variables with , the closest one is chosen to be . For clarity we have plotted distributions of and for both signal and dominant backgrounds before applying any cut. Whereas, for backgrounds since the source of is not a single particle, the corresponding distributions of and in Fig.2(a), Fig.2(b) do not peak around 444While drawing the distributions, we only have shown the distribution for two dominant backgrounds, i.e. and ..
-
•
: Another potentially important variable for this signal is the transverse mass of -system. It can be constructed as:
(10) where is computed by adding and of the lepton (coming from ) vectorially and is obtained from the scalar sum of and the lepton transverse energy. is constructed by adding the of the two leptons of SFOS that peak near the -mass and is calculated using the following relation.
(11)


| 200 GeV | > 500 GeV | > 5 | ||
| 300 GeV | > 500 GeV | > 5.5 | ||
| 500 GeV | > 500 GeV | > 6 | ||
| 1 TeV | > 500 GeV | > 4.5 |
| GeV | NEV ( 15 ab-1) | |||
| Signal | 7170 | 3916 | 3190 | 3183 |
| 88484 | 11462 | 4662 | 4647 | |
| 4637 | 622 | 301 | 301 | |
| Signal yield = 3138 | Total background yield = 4948 | Signal significance ( ) = | ||
| Signal significance ( ) = | ||||
| GeV | NEV ( 15 ab-1) | |||
| Signal | 5529 | 2433 | 2057 | 1591 |
| 89118 | 6300 | 2934 | 1494 | |
| 4599 | 316 | 135 | 68 | |
| Signal yield = 1591 | Total background yield = 1562 | Signal significance ( ) = | ||
| Signal significance ( ) = | ||||
| GeV | NEV ( 15 ab-1) | |||
| Signal | 3283 | 1254 | 1050 | 942 |
| 88484 | 2912 | 489 | 172 | |
| 4637 | 157 | 26 | 6 | |
| Signal yield = 942 | Total background yield = 178 | Signal significance ( ) = | ||
| Signal significance ( ) = | ||||
| TeV | NEV ( 15 ab-1) | |||
| Signal | 862 | 654 | 491 | 262 |
| 88484 | 19602 | 324 | 15 | |
| 4637 | 1065 | 178 | 0 | |
| Signal yield = 262 | Total background yield = 15 | Signal significance ( ) = | ||
| Signal significance ( ) = | ||||
| NTrees | MinNodeSize | MaxDepth | nCuts | KS-score for | BDT Score | |
|---|---|---|---|---|---|---|
| Signal(Background) | ||||||
| BP1 | 180 | 3 % | 2.0 | 35 | 0.251(0.621) | 0.02 |
| BP2 | 100 | 4 % | 2.0 | 60 | 0.409(0.524) | 0.148 |
| BP3 | 150 | 3 % | 2.0 | 39 | 0.11(0.541) | 0.232 |
| BP4 | 200 | 3 % | 2.0 | 35 | 0.346(0.054) | 0.19 |
Overall, the CBA shows that = 500 GeV has the highest observability. Next we perform an MVA to improve over the results obtained from cut-based analysis. Before going to perform the MVA analysis, let us elaborate on the details of the same. Here the MVA is performed using Decorrelated Boosted Decision Tree (BDTD) algorithm within the Toolkit for Multivariate Data Analysis (TMVA) framework.
First the signal and the background-like events are distinguished using decision trees as classifier. To segregate the signal and background-like events depending on its purity 555The purity can be defined as : . An event can be tagged as signal (background) when ()., each node of the decision tree is associated with one discerning variable on which an optimised cut value is imposed. By modifying the BDTD variable NCuts, one can perform the aforementioned task within TMVA. Starting from the zeroth node or root node, the training of the decision trees is carried on unless a particular depth (MaxDepth) specified by the user is achieved. Finally from the final leaf nodes, an event can be tagged as signal or background according to the purity.
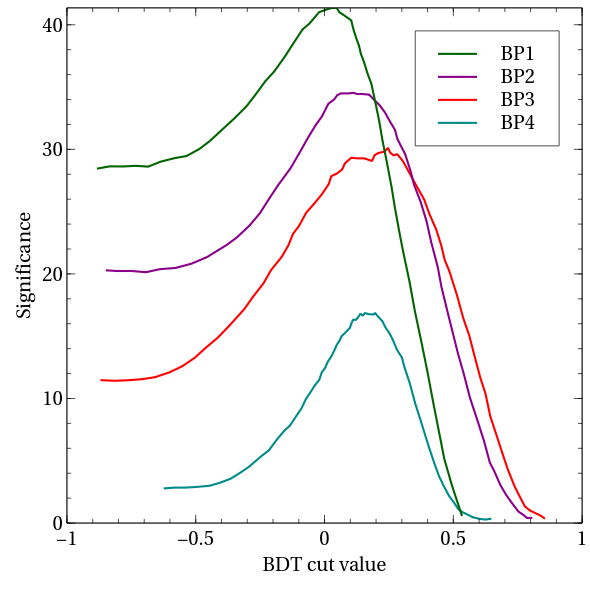
The decision trees being prone to statistical fluctuations of the training sample, are said to be weak classifiers. This problem can be alleviated by combining a set of weak classifiers into a stronger one through the modification of the weight of the events. One can thus create new decision trees using this particular procedure termed as Boosting. Throughout the analysis, we have used Adaptive boost, compatible for weak classifiers, with input variable transforming in a decorrelated manner. Within TMVA framework, it can be realised as Decorrelated AdaBoost. The BDTD parameters like the number of decision trees NTrees, the maximum depth of the decision tree allowed MaxDepth, the minimum percentage of training events in each leaf node MinNodeSize and NCuts for four benchmarks of our analysis have been tabulated in Table 7. To get rid of the overtraining of the signal and background samples, the results of the Kolmogorov-Smirnov test, i.e. Kolmogorov-Smirnov score (KS-score) should be > 0.1 as well as stable. In fact, KS-score > 0.01 can also avoid the overtraining if it remains stable even after changing the internal parameters of the algorithm. Now the BDTD algorithm makes a ranking list out of the kinematic variables that are fed into the algorithm, according to the performance of variables in separating signal from backgrounds. Several kinematic variables might be highly correlated. We select a reasonable number of top ranking variables among them for providing best possible separation between the signal and backgrounds. Thus for this channel following kinematic variables with maximum discerning abilities are proposed for MVA:
| (12) |
Here, denotes the distance in the plane between the th and th particle. While is the scalar (vector) sum of the transverse momentum of the system of th, th and th particle, represents invariant mass of ""-system. The rest of the variables have been defined earlier in the text. According to the BDT ranking, among these variables, the five most important variables to differentiate the signal from backgrounds are : .
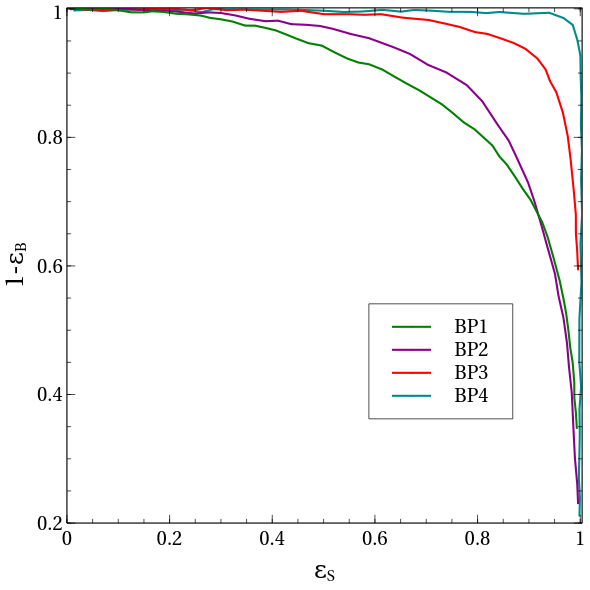
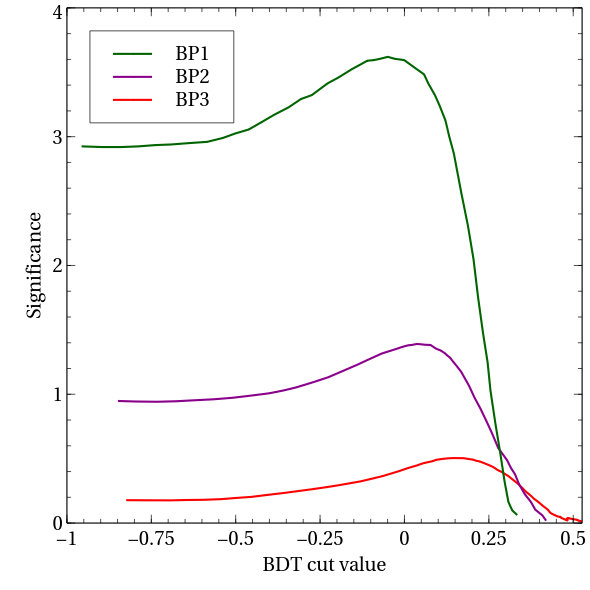
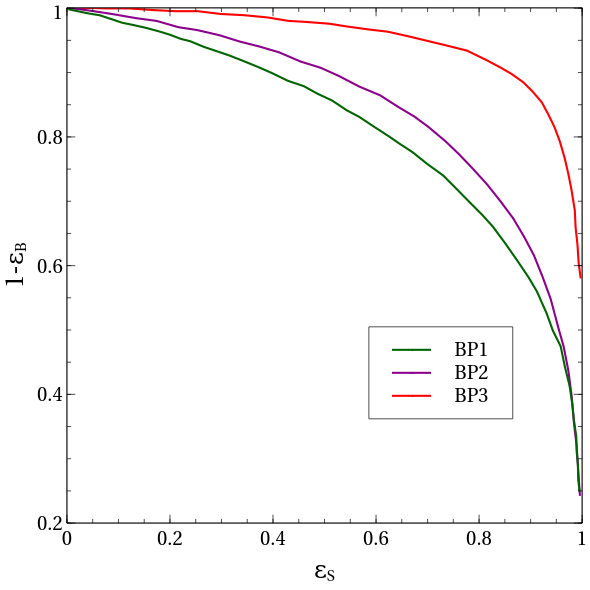
Fig.18 (a),(b),(c),(d) in Appendix A depict the KS-scores for signal and backgrounds for all four benchmarks. KS-scores have also been tabulated in Table 7 for convenience. To maximise the significance, one can adjust BDT cut value or BDT score. The BDT cut values adjusted for four benchmarks can be found in Table 7. In Fig.3(a), we have presented the variation of the signal significances with BDT score. Here it can be easily inferred that the significance attains a maximum value at a particular BDT score 666If the curves show any fluctuations, then we put the BDT cut value just before the curve starts fluctuating. Next we draw Receiver’s Operative Characteristic (ROC) curves 777ROC curve is a plot of signal efficiency () vs. efficiency of rejecting the backgrounds , being the background efficiency. for all benchmarks in Fig.3(b), to estimate the degree of rejecting the backgrounds with respect to the signal. From Fig.3, it can be inferred that the degree of rejecting backgrounds reduces with decrease in . But owing to large signal cross section of BP1 compared to the rest of the three BPs, BP1 fares the best in probing this channel.
The yields for signal (for ) and corresponding backgrounds after optimisation through BDTD-analysis are given in Table 8. The numbers events are computed taking and at ab-1. BP1 is seen to offer the highest observability through MVA. And this observability decreases upon increasing . Importantly, the MVA is seen to yield higher statistical significance than the CBA for all the values of . The maximum improvement of significance (with respect to the cut-based analysis) is which occurs for GeV. Besides, we have computed the significances taking into account and systematic uncertainties in Table 8.
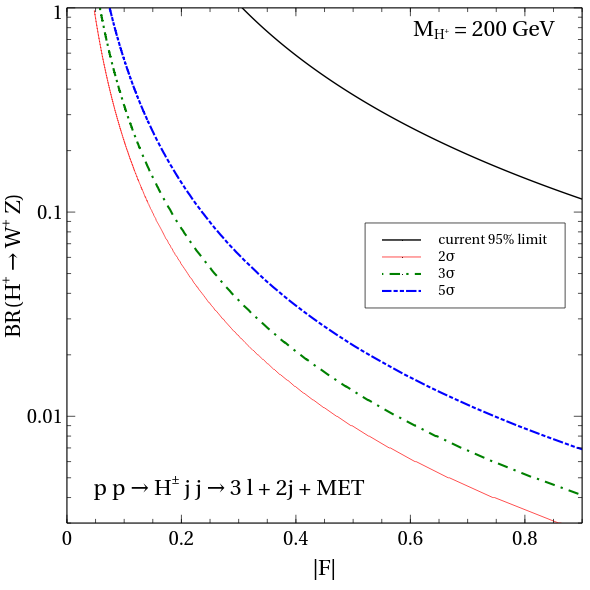
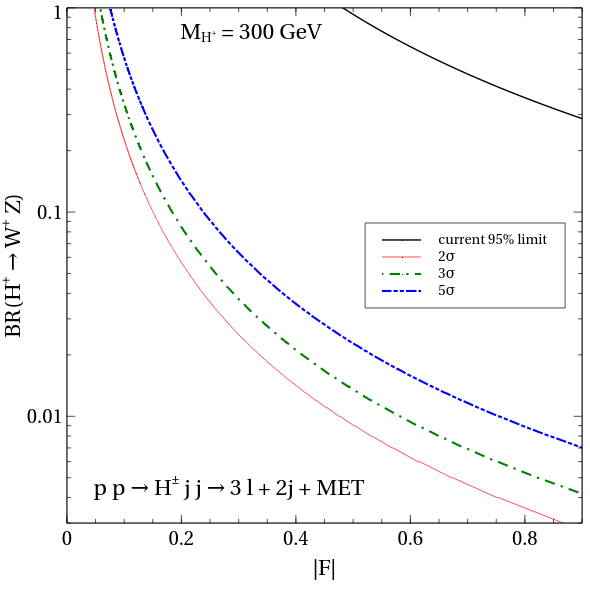
We remark here that for each BP can be extrapolated for arbitrary and BR( by appropriately scaling the number corresponding to the (,BR()) = (0.4,0.4) reference point. Given the MVA outperforms the CBA for all the BPs, the numbers from the former scaled to draw contours in the BR() vs plane as shown in Fig. 4.
| GeV | ||
| Process | Yield at 15 ab -1 | |
| Background | ||
| Total | ||
| Signal () | ||
| Significance ( ) | ||
| Signal significance ( ) | ||
| GeV | ||
| Process | Yield at 15 ab -1 | |
| Background | ||
| Total | ||
| Signal () | ||
| Significance ( ) | ||
| Signal significance ( ) | ||
| GeV | ||
| Process | Yield at 15 ab -1 | |
| Background | ||
| Total | ||
| Signal () | ||
| Significance ( ) | ||
| Signal significance ( ) | ||
| TeV | ||
| Process | Yield at 15 ab -1 | |
| Background | ||
| Total | ||
| Signal () | ||
| Significance ( ) | ||
| Signal significance ( ) | ||
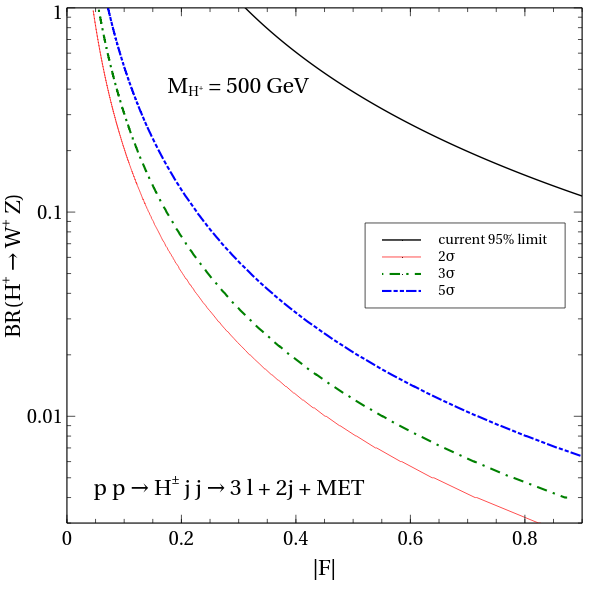
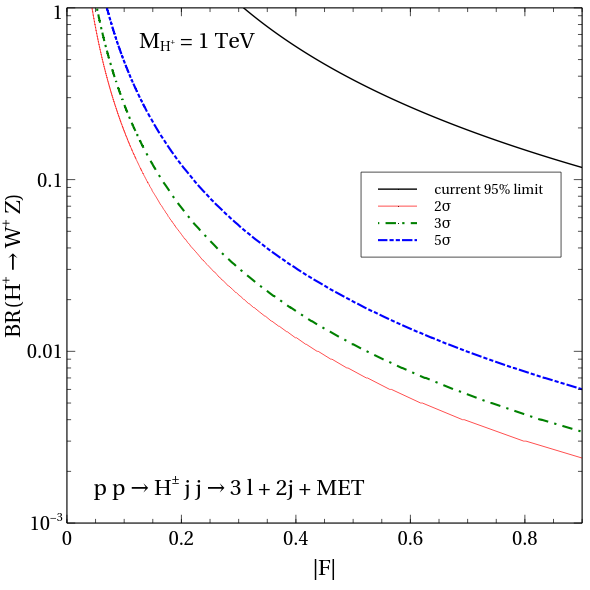
IV.2 The channel
In the previous subsection we explored VBF production of the charged Higgs where one forward and one backward light jet is produced along with and further decays into and . In this subsection, the decay is probed with the decaying leptonically leading to a final state containing two -tagged jets, two light jets, one isolated lepton (leptons include electron, muon) and . Forward and backward jet-tagging has been done using the criteria mentioned earlier. Here, the dominant background contribution comes from top pair production. There are two possibilities, viz. semi-leptonic decay of , where one of the top quarks decays hadronically or full leptonic decay of , where both the top quarks decay leptonically. The next dominant contribution comes from QCD-QED () production. We also generate the subdominant backgrounds, viz. and -boson associated single top production or . Among these the background is generated with one extra parton in the final state and here the -bosons are decayed in all possible channels which can give rise to the final state of our interest. The cross sections for the chosen signal benchmarks and background processes are given in Table 9. We impose the following generation-level cuts while generating these backgrounds to better handle the statistics for large backgrounds :
| (13) |
| Signal / Backgrounds | Process | Cross section (fb) |
| Signal | ||
| BP1 ( GeV) | 123.37 | |
| BP2 ( GeV) | 76.93 | |
| BP3 ( GeV) | 37.04 | |
| BP4 ( TeV) | 10.62 | |
| Backgrounds | (semileptonic) (NNLO) | 906843.5 |
| (leptonic) (NNLO) | 245010.26 | |
| (LO) | 69691 | |
| (LO) | 19733.25 | |
| (NLO) | 2860 | |
| (NLO) | 3477.02 | |
| (LO) | 986.58 |
In addition to the generation-level cuts we add stronger trigger-level cuts on as : . To first perform a rectangular CBA , a set of relevant kinematic variables are constructed and their distributions are observed. Here we mostly present those distributions that illustrate the features of VBF topology and shall apply suitable cuts on the variables for maximising the significance.


-
•
and : The absence of hadronic activity in the central region is evident from the distributions of . The distribution of peaks at a larger value for the signal as compared to the background processes. Consequently is distributed towards higher mass values. The more separated the two jets are, the larger will be their invariant mass. We also explicitly put a central jet-veto condition, implying the veto on the additional production of jets in the central region (between two forward and backward jets).
-
•
: Similar to the previous channel, the charged Higgs mass can be reconstructed for this case too since there is only one neutrino in the final state that comes from the decay of the . First, we reconstruct the four top masses from two possible choices of pairing with bottom quark and the two possible solution corresponding to the -component of () as described in section IV.1. Here we choose those combinations for which the reconstructed top mass is closest to GeV. After that we construct the invariant mass of whole -system , which should peak around the charged Higgs mass () for the signal events. This particular variable plays a crucial role in signal background separation, since for backgrounds the reconstructed mass will not peak around .
-
•
: We construct an observable called which is defined as the scalar sum of transverse momenta of all visible particles and . This variable helps us separate signal from background especially in the high region, because the decay products of a heavy charged Higgs will naturally be boosted rendering higher for the whole system.
-
•
: We also utilise the contransverse mass variable, Tovey (2008) which is an invariant quantity for two objects and having contra-linear (opposite in direction) and equal magnitude boost. This variable is defined as,
Here, and corresponds to the invariant mass and transverse momentum vector respectively for the object , whereas the transverse energy, is defined as . Since in case of the signal and come from the decay of charged Higgs, the end point of distribution in this case will indicate the charged Higgs mass in the large limit. The reason is the following : is constructed from the transverse momenta of the and system where both of them are bounded from above by by construction. Therefore, can take a maximum value of , the remaining terms being negligible compared to . We can see from Fig. 5, this variable possesses good discriminating power. Although we have not used this in the cut-based analysis since it becomes redundant after applying cuts on the other discriminating variables, because of its correlation with variables such as , we have utilised this variable as an input for our BDTD analysis which will be discussed shortly.
The optimised cuts on the aforementioned variables for each of the benchmark points are given in Table. 10. These cuts are applied to select the events over and above the basic generation-level and trigger-level cuts discussed above.
| 200 GeV | GeV | 100 GeV 300 GeV | - | |
|---|---|---|---|---|
| 300 GeV | GeV | 100 GeV 300 GeV | - | |
| 500 GeV | GeV | GeV | GeV | |
| 1 TeV | GeV | GeV | GeV |
| NTrees | MinNodeSize | MaxDepth | nCuts | KS-score for | BDT Score | |
|---|---|---|---|---|---|---|
| Signal(Background) | ||||||
| BP1 | 40 | 3 % | 2 | 40 | 0.31(0.145) | 0.4 |
| BP2 | 100 | 3 % | 2 | 20 | 0.396(0.236) | 0.23 |
| BP3 | 100 | 3 % | 2 | 20 | 0.335(0.43) | 0.25 |
| BP4 | 100 | 3 % | 2 | 20 | 0.029(0.044) | 0.32 |
| GeV | NEV ( 15 ab-1) | ||
| Signal | 33079 | 27362 | 24870 |
| semileptonic | 4.9 | 1.7 | 9.6 |
| leptonic | 3.6 | 1.5 | 7.7 |
| 5.2 | 2.9 | 811360 | |
| 188553 | 65018 | 19506 | |
| 30598 | 12777 | 4371 | |
| 73202 | 37124 | 13595 | |
| 16703 | 4898 | 2261 | |
| Signal yield = 24870 | Total background yield = 1.8 | Signal significance ( ) = | |
| Signal significance ( ) = | |||
| GeV | NEV ( 15 ab-1) | ||
| Signal | 48351 | 39091 | 33816 |
| semileptonic | 4.9 | 1.7 | 9.6 |
| leptonic | 3.6 | 1.5 | 7.7 |
| 5.2 | 2.9 | 811360 | |
| 188553 | 65018 | 19506 | |
| 30598 | 12777 | 4371 | |
| 73202 | 37124 | 13595 | |
| 16703 | 4898 | 2261 | |
| Signal yield = 33816 | Total background yield = 1.8 | Signal significance ( ) = | |
| Signal significance ( ) = | |||
| GeV | NEV ( 15 ab-1) | |||
| Signal | 25195 | 21194 | 19484 | 17586 |
| semileptonic | 3.1 | 1.1 | 5.6 | 5.1 |
| leptonic | 1.6 | 6.5 | 3.9 | 3.1 |
| 5.2 | 2.9 | 2.3 | 1.9 | |
| 188553 | 65018 | 52015 | 45513 | |
| 30598 | 12777 | 9079 | 7734 | |
| 73202 | 37124 | 27189 | 23529 | |
| 16703 | 4898 | 3140 | 2763 | |
| Signal yield = 17586 | Total background yield = 1.0 | Signal significance ( ) = | ||
| Signal significance ( ) = | ||||
| TeV | NEV ( 15 ab-1) | |||
| Signal | 6466 | 5553 | 5136 | 4149 |
| semileptonic | 3.1 | 1.1 | 1.8 | 679093 |
| leptonic | 1.6 | 6.5 | 872734 | 269754 |
| 5.2 | 2.9 | 1.5 | 1.0 | |
| 188553 | 65018 | 39011 | 26007 | |
| 30598 | 12777 | 4371 | 3362 | |
| 73202 | 37124 | 10458 | 5752 | |
| 16703 | 4898 | 1381 | 879 | |
| Signal yield = 4149 | Total background yield = 1.9 | Signal significance ( ) = | ||
| Signal significance ( ) = | ||||
Tables 12-15 show the cut-flow for the signal and the background processes, yielding a fair indication of the efficiency of each cut. We have also calculated the projected significance for each benchmark point at 27 TeV LHC with 15 ab-1 luminosity.
We can see in Tables 12-15 that BP2 fares best in terms of signal significance, followed by BP1, BP3 and BP4. Therefore, BP1 which has the lowest mass of charged Higgs, has lowest discriminating capacity between the signal and background. However, its large cross-section enables us to achieve substantial signal significance. On the other hand, BP4, which corresponds to the heaviest charged Higgs has the best discriminating power among all the BPs. But its meagre production cross-section makes it difficult to obtain a good significance. However, as we can rely on various good separation variables in case of BP4, we expect significant improvement over the cut-based analysis when we perform multivariate analysis. Evidently, for BP2 and BP3 there are good optimisations between production cross section and signal-background separation and consequently they yield considerable significance even with the rectangular CBA.
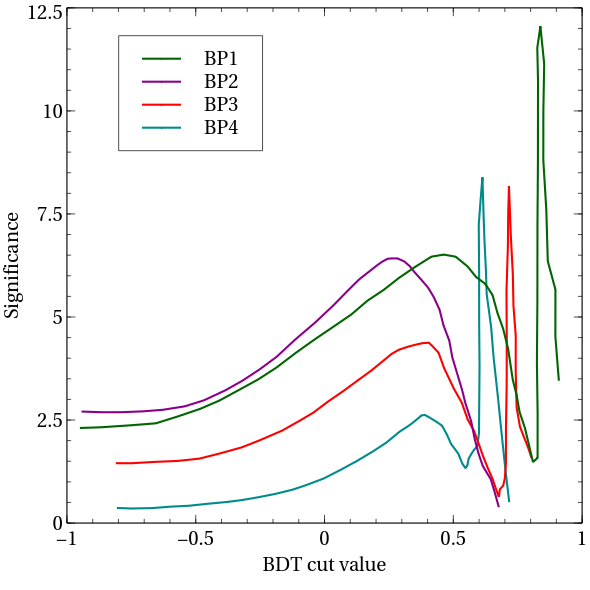
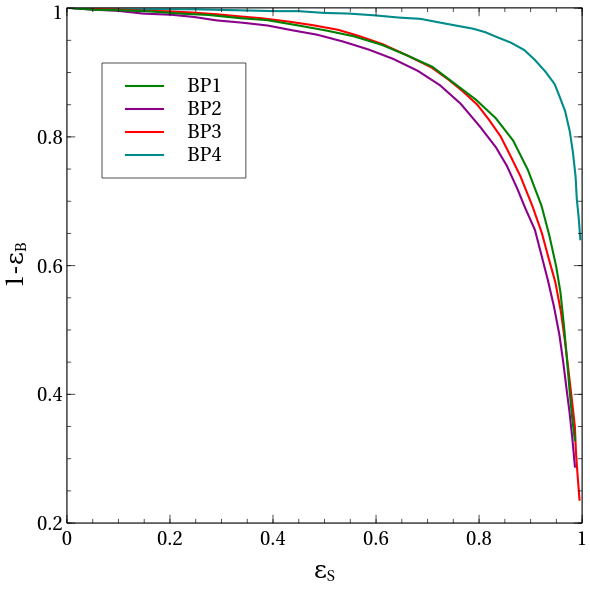
Next we proceed to perform the MVA using BDTD algorithm with the hope of improving the significance with respect to that obtained from CBA. Details of BDTD algorithm along with the definitions of the BDTD parameters are already discussed in subsection IV.1. Thus we shall avoid repeating that here. Let us move on to Table 11, where all the tuned BDT parameters like NTrees, MinNodeSize, MaxDepth, nCuts, KS-scores (both for signal and backgrounds) and BDT score for four benchmarks are tabulated. The signal and background distributions along with their KS-scores are depicted in Fig.19 in Appendix A. From this figure it can be inferred that the best possible signal background separation occurs for BP4. The variation of significance with BDT cut value or BDT score, depicted in Fig.6(a) shows that the significance becomes highest for a particular value of BDT score. While computing the final signal significance, we use the BDT cut values for which the significances are maximised for four benchmarks. Fig.6(b) represents the ROC curves for four benchmarks. it can be clearly seen that the background rejection efficiency for BP4 is best compare to the rest. Inspite of having the best background rejection efficiency, BP4 has the lowest signal significance owing to small signal cross section (Table 9). According to the ability to differentiate between the signal and background, let us choose following thirteen kinematic variables:
| (14) |
where and are the pseudorapidity of the system of two leading light jets and between the two leading jets respectively. is the azimuthal angle separation between the two -jet system and the system of lepton with two leading light jets, and the rest of the variables have their usual meaning. The most important variables to distinguish between the signal and backgrounds are . While doing the analysis, we have set and we fix the branching ratio of the decay to be . The normalised distributions of the best kinematic variables for different are shown in Fig. 5. After doing the BDTD analysis, we summarise the results in Table 16.
| GeV | ||
| Process | Yield at 15 ab-1 | |
| Background | lep | |
| semi-lep | ||
| Total | ||
| Signal | ||
| Signal significance ( ) | ||
| Signal significance ( ) | ||
| GeV | ||
| Process | Yield at 15 ab-1 | |
| Background | lep | |
| semi-lep | ||
| Total | ||
| Signal | ||
| Signal significance ( ) | ||
| Signal significance ( ) | ||
| GeV | ||
| Process | Yield at 15 ab-1 | |
| Background | lep | |
| semi-lep | ||
| Total | ||
| Signal | ||
| Signal significance ( ) | ||
| Signal significance ( ) | ||
| TeV | ||
| Process | Yield at 15 ab-1 | |
| Background | lep | |
| semi-lep | ||
| Total | ||
| Signal | ||
| Signal significance ( ) | ||
| Signal significance ( ) | ||
Comparing the results obtained from BDTD analysis (Table. 16) and those from cut-based analysis (Table 12-15) we can see that BP1 is hardly improved by the BDTD analysis. Since the kinematic variables do not offer a good separation in this case, the BDTD will perform marginally better than an optimized cut-based analysis. The results improve slightly in case of BP2. The improvement becomes striking in case of BP3 and BP4, because these benchmarks correspond to observables with significant discriminating power. Considering and systematic uncertainties, the significances has also been calculated and tabulated in Table 16.
Similar to what was done for the previous channel, we next display the contours of constant signal significance in the -BR) plane in Fig. 7.
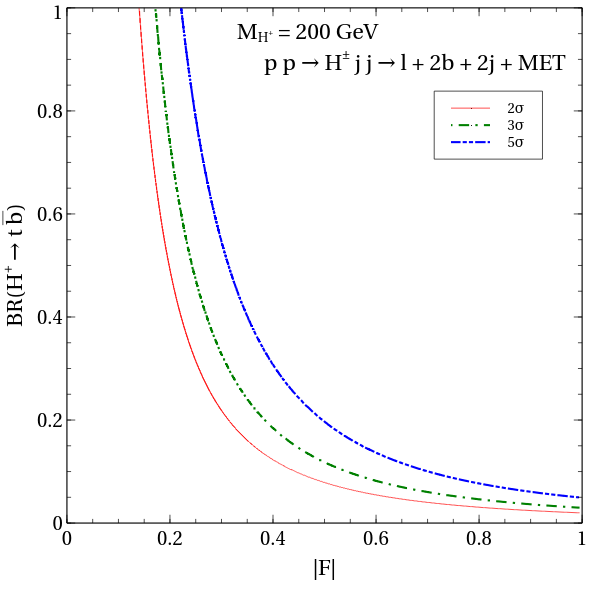
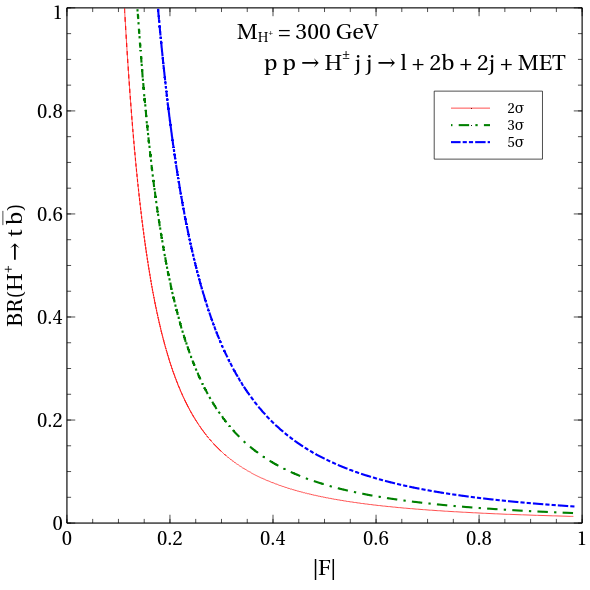
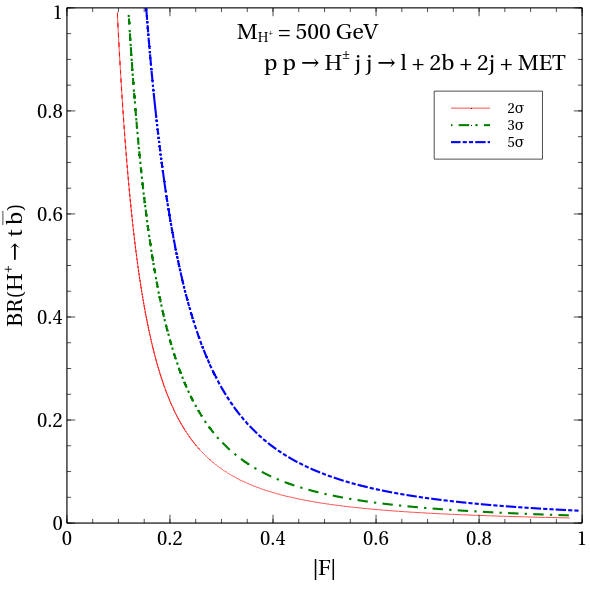
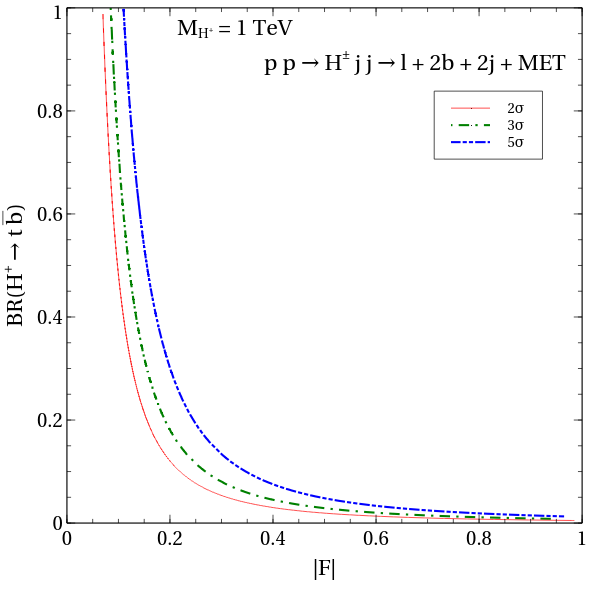
IV.3 The channel
With the results of the VBF analyses in hand, we turn our attention to the channel. To elaborate a bit, the here is produced in association with a -boson via an -channel exchange of the -boson and it subsequently leads to the hadronically quiet decay cascade. The other -boson also decays leptonically. The Feynman diagram corresponding to this signal can be found in Fig.1(c). Throughout this analysis, we remain agnostic to the fact that the prospects of observing an in this channel could be low and this would be attributed to a small signal cross section(s).
Background processes leading to an exactly final state are and . Subleading backgrounds come from and . Mis-identification of a lepton as missing energy can lead to a state originating from the former. As for the latter, obtaining the same final state as the signal would entail mis-identification of one lepton and 2 -jets. We show the cross sections for the signal and the backgrounds in Table 17.
| Signal / Backgrounds | Process | Cross section (fb) |
|---|---|---|
| Signal | ||
| BP1 ( GeV) | ||
| BP2 ( GeV) | ||
| BP3 ( GeV) | ||
| BP4 ( TeV) | ||
| Backgrounds | 7.93 (LO) | |
| 6.85 (LO) | ||
| 1.13 (LO) | ||
| 1.42 (NLO) |

| NTrees | MinNodeSize | MaxDepth | nCuts | KS-score for | BDT Score | |
|---|---|---|---|---|---|---|
| Signal(Background) | ||||||
| BP1 | 160 | 4 % | 2.0 | 30 | 0.023(0.051) | -0.02 |
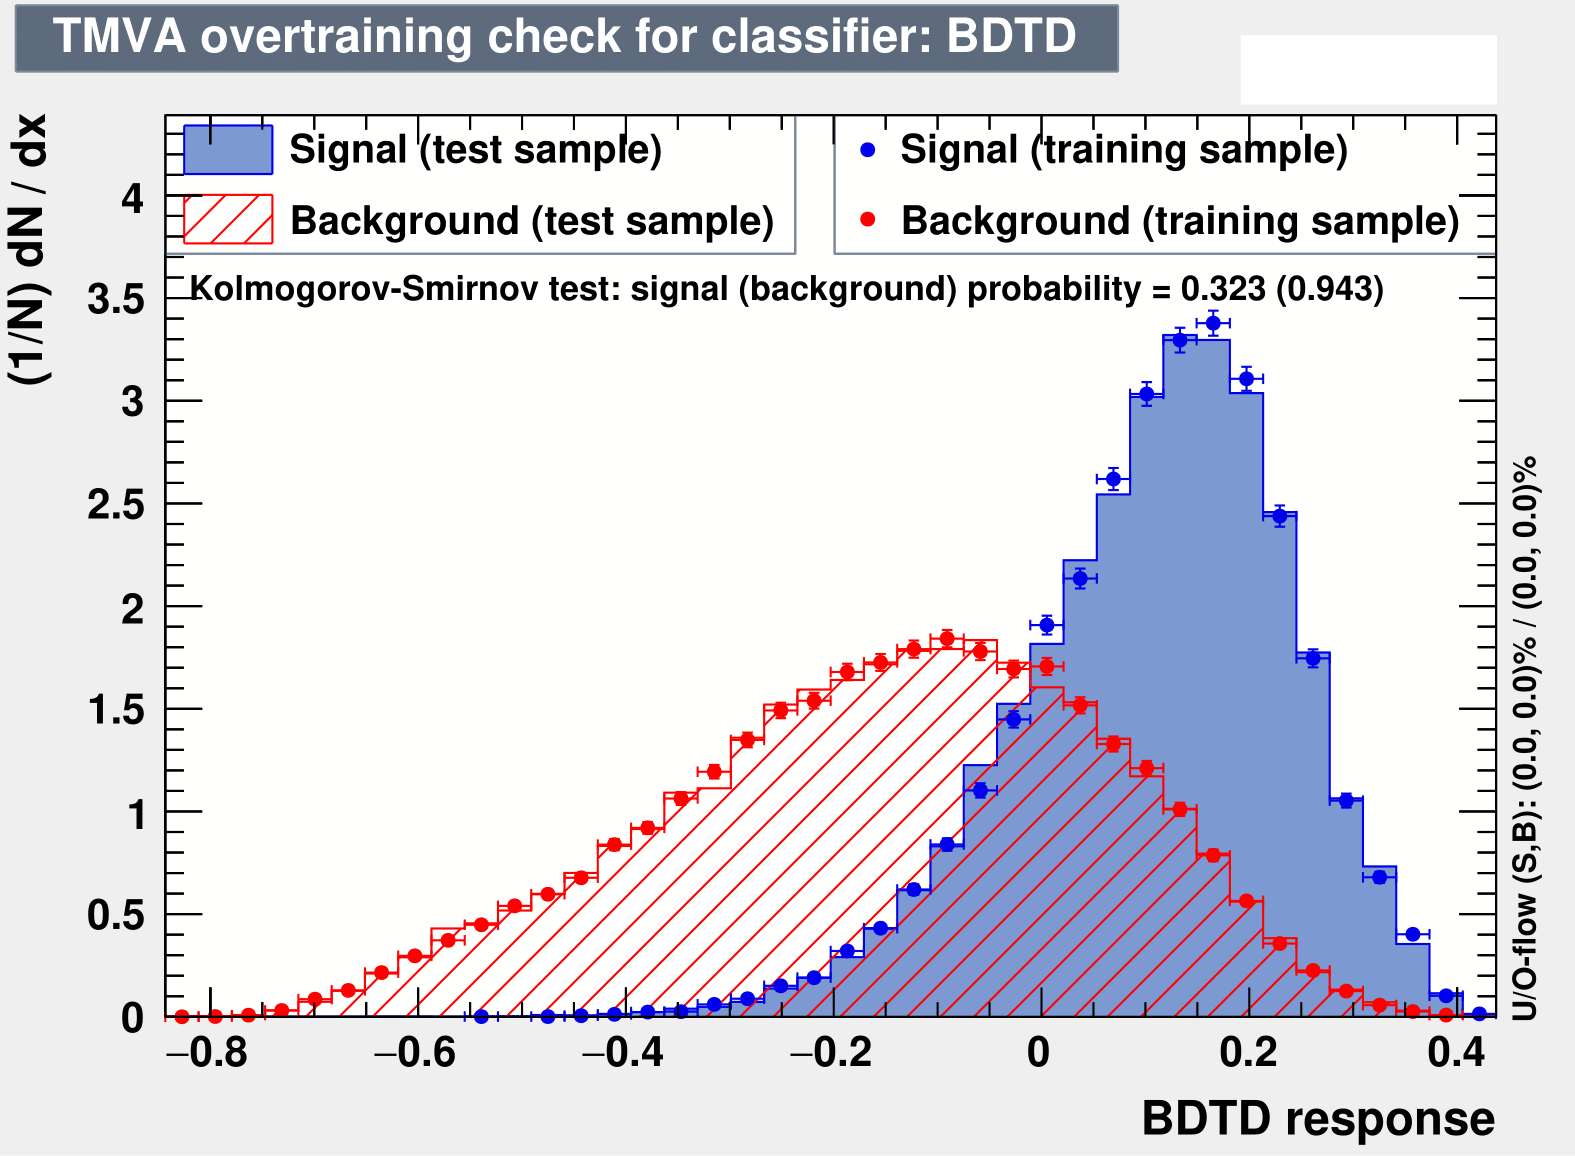
| BP2 | 180 | 3 % | 2.0 | 39 | 0.323(0.943) | 0.06 |
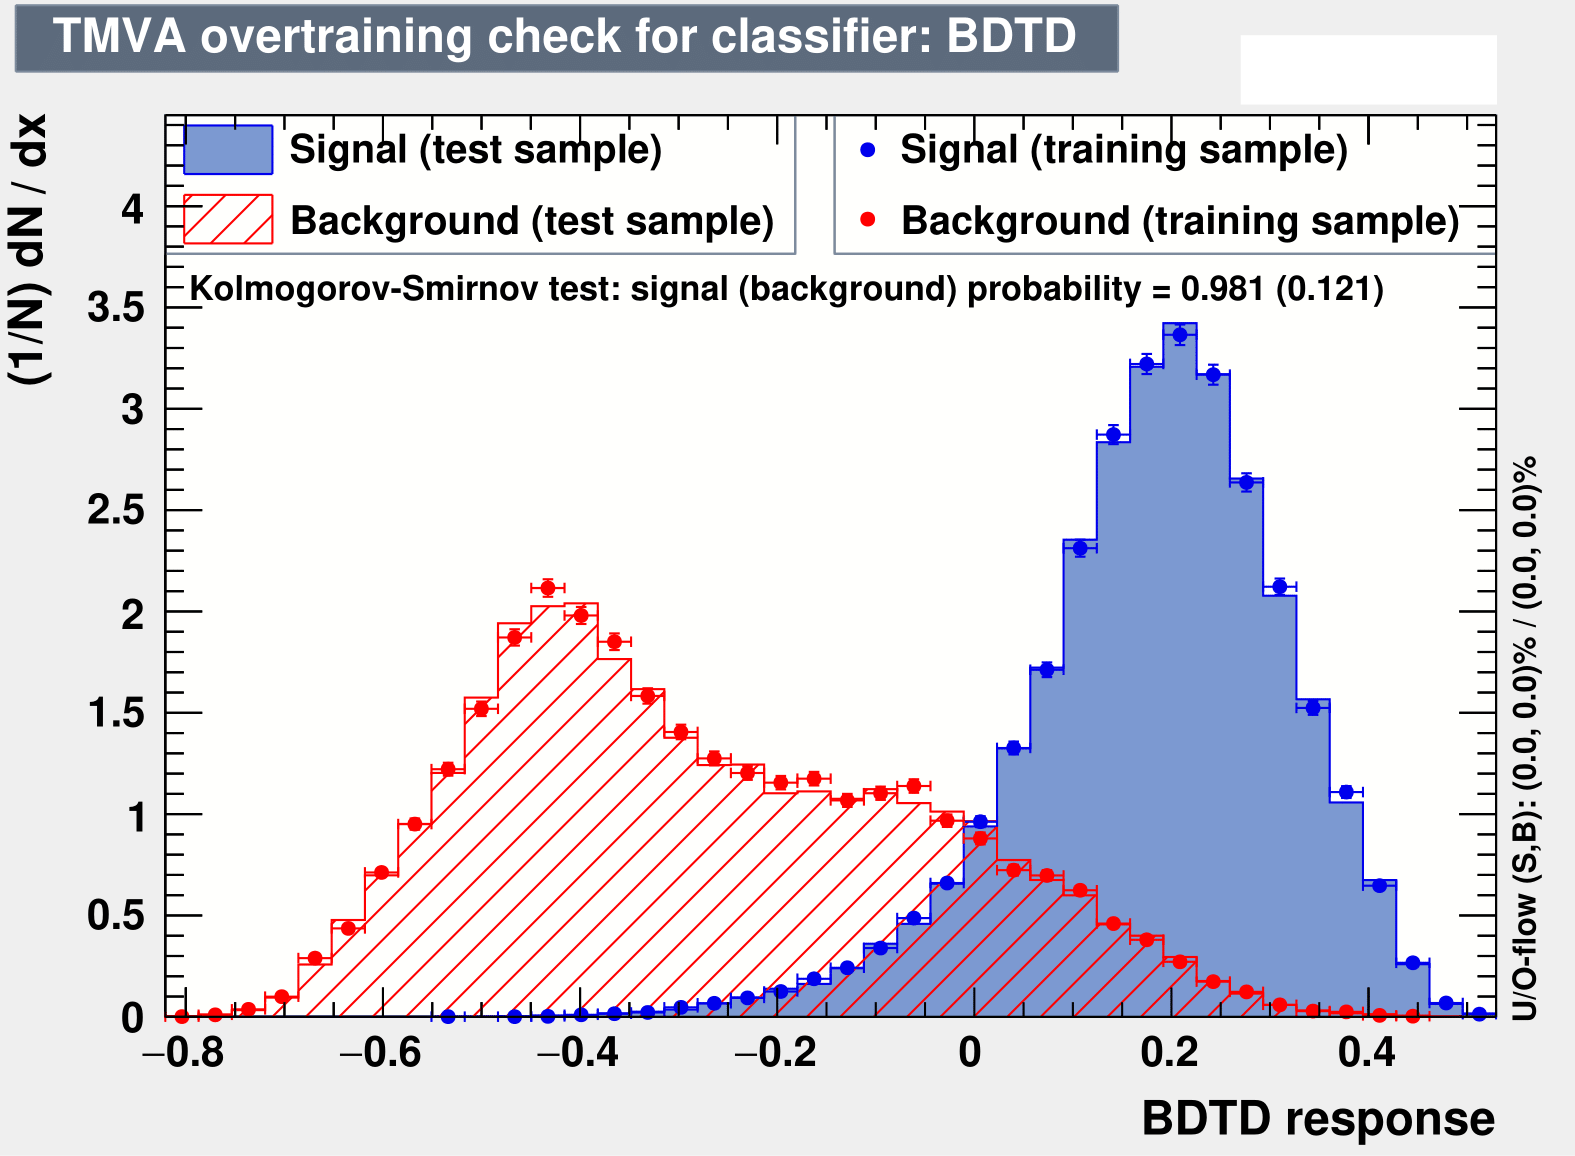
| BP3 | 200 | 3 % | 2.0 | 40 | 0.981(0.121) | 0.17 |
BP4 is excluded from the subsequent analysis owing to the small signal cross section. We start by vetoing the -jets and -jets in the final state, so that the final state (comprising of five leptons) is completely leptonic. Here by lepton we mean and have taken all possible combinations of those five leptons leading to two same flavour opposite sign (SFOS) pairs and one isolated lepton.
Since the MVA was found to outperform the CBA for the two VBF signals, we choose to omit the CBA for this process. Different BDT parameters used to carry out the MVA, are given in Table 18. Fig.20 in Appendix A depicts the distribution for signal and backgrounds along with the KS-scores for this channel. In Fig.9(a) and Fig.9(b) we show the variation of significance with BDT score and ROC curves for three benchmarks respectively. It can be seen that the background rejection efficiency increases with increasing . The following twenty kinematic variables are chosen according to the degree of distinguishing capability to initiate the MVA.
| (15) |
Here we reconstruct the two -boson invariant masses and by combinatorially identifying the corresponding two SFOS lepton pairs. Any cut on these is expected to suppress the and backgrounds appropriately that do not involve a pair of on-shell -bosons. Next, the invariant mass of the two pairs of SFOS lepton system (), originating from the decay of two -bosons, is constructed. Since for the background, decays into , the distribution of peaks around 125 GeV in Fig.8. Thus a veto cut on around 125 GeV for all values of would help suppressing the aforementioned background to a large extent. Similarly to what was done for the channel, we construct the invariant mass of the system () that comes from . For background, are not originated from the decay of a single mother particle as in the signal. Therefore one can rely on this variable which has substantial discriminatory power between the signal and the backgrounds. Here is the azimuthal angle between and the missing transverse energy vector. Rest of the aforementioned kinematic variables have been defined earlier. Among these twenty variables, turn out to be the best performing having high discerning ability to separate signal and backgrounds. Corresponding yields for signal and backgrounds at for and along with the signal significances are given in Table 19. The maximum significance of 4.24 is predicted for GeV following the BDTD analysis. The significance declines for the higher charged Higgs masses. Significances with and systematic uncertainties are presented in Table 19.
| GeV | ||
| Process | Yield at 15 ab-1 | |
| Background | ||
| Total | ||
| Signal () | ||
| Significance ( ) | ||
| Signal significance ( ) | ||
| GeV | ||
| Process | Yield at 15 ab-1 | |
| Background | ||
| Total | ||
| Signal () | ||
| Significance ( ) | ||
| Signal significance ( ) | ||
| GeV | ||
| Process | Yield at 15 ab-1 | |
| Background | ||
| Total | ||
| Signal () | ||
| Significance ( ) | ||
| Signal significance ( ) | ||
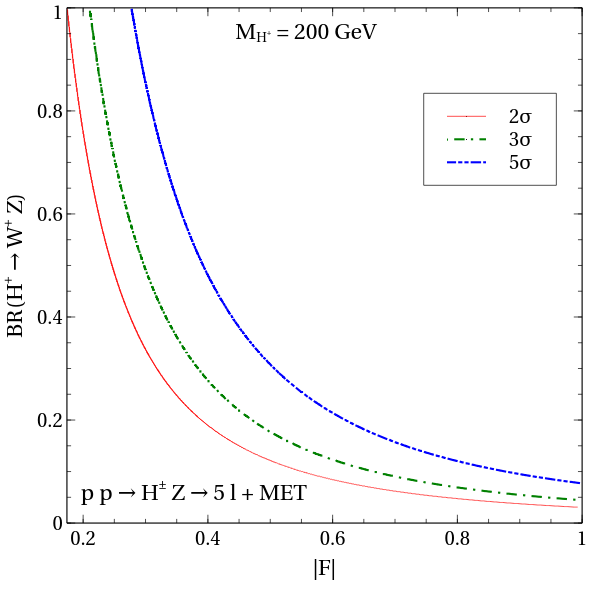
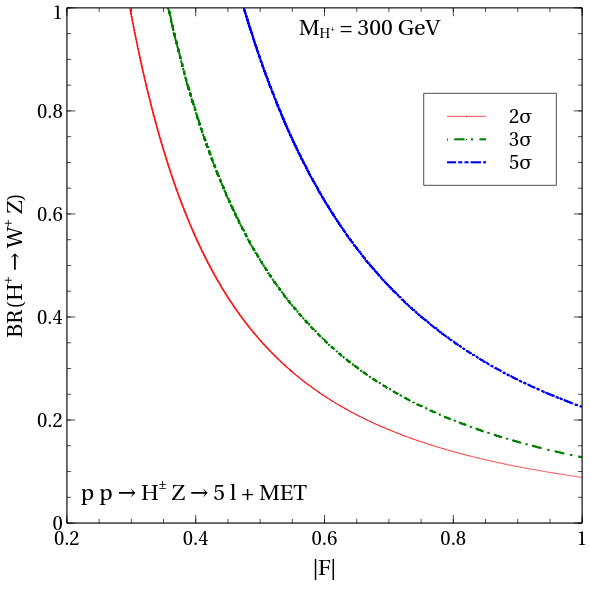
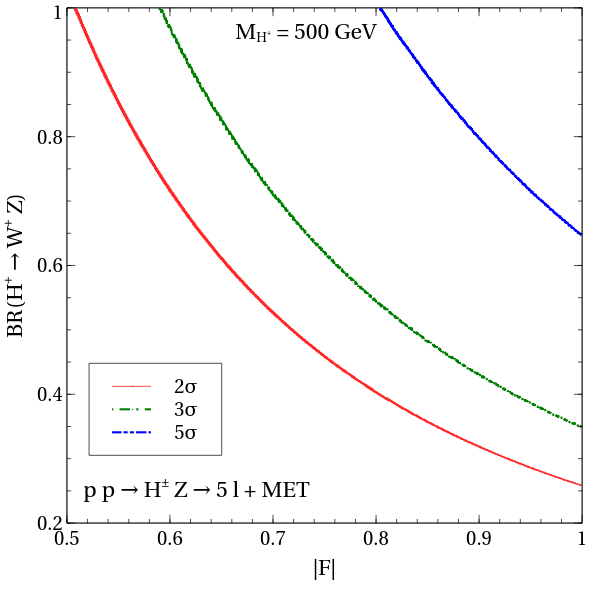
Fig. 10 displays the 2, 3 and 5 contours in the -BR() plane. Upon comparing it with Fig. 4, one concludes that for an decaying to the massive gauge bosons, production has a much lower reach compared to VBF production. To quote a few numbers, an of mass 500 GeV that corresponds to = 0.4 can be discovered at 5 for BR() via the final state. In contrast, the final state demands and BR() to attain the same discovery potential.
IV.4 The channel
This subsection contains the analysis for the signal where following production in association with a , the charged boson decays to . In addition to decay, we have the leptonic decay in this case. This gives rise to three lepton final state with two -tagged jets and . The dominant contribution to the background in this final state comes from the type production where . The and production, and are the sub-dominant backgrounds in this channel owing to their smaller cross section compared to the previous ones. We present the cross sections of chosen signal benchmarks and background processes in Table 20.
| Signal / Backgrounds | Process | Cross section (fb) |
| Signal | ||
| BP1 ( GeV) | 0.9 | |
| BP2 ( GeV) | 0.224 | |
| BP3 ( GeV) | 0.034 | |
| BP4 ( TeV) | 0.0022 | |
| Backgrounds | (NLO) bkg | 2860.0 |
| (NLO) Lazopoulos et al. (2008) | 3477.02 | |
| (LO) | 986.58 | |
| (LO) | 0.5 | |
| (LO) | 0.07 | |
| (NNLO QCD + NLO EW) bkg | 0.057 | |
| (NNLO QCD + NLO EW) bkg | 0.185 | |
| (LO) | 0.005 |
We generate all of these backgrounds with the application of following generation level cuts :
| (16) |
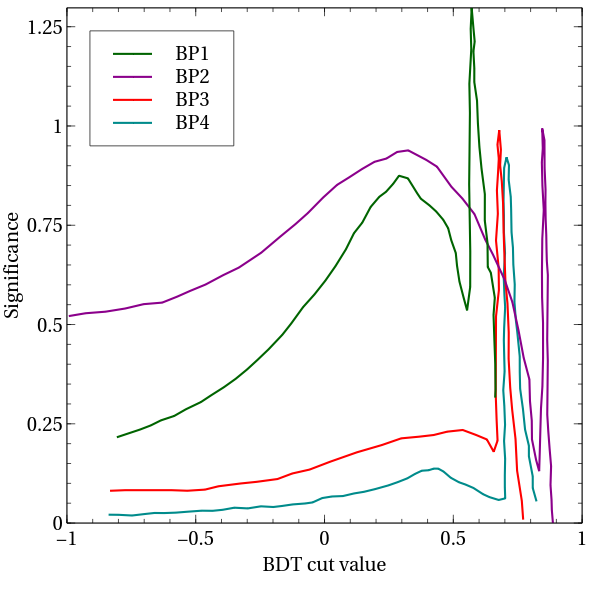
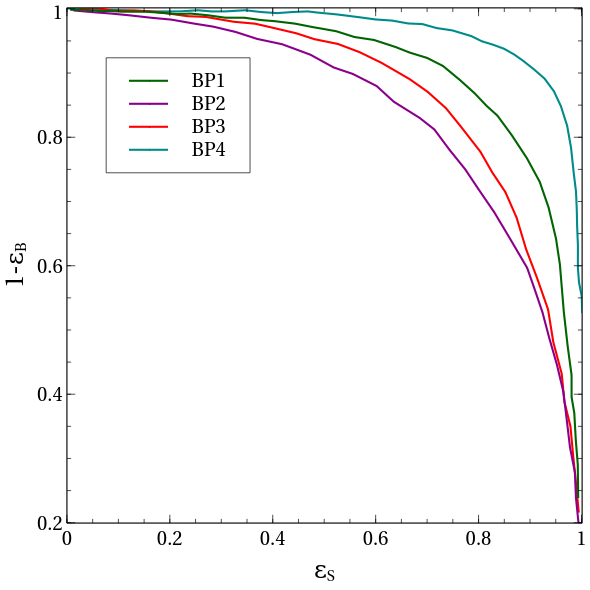
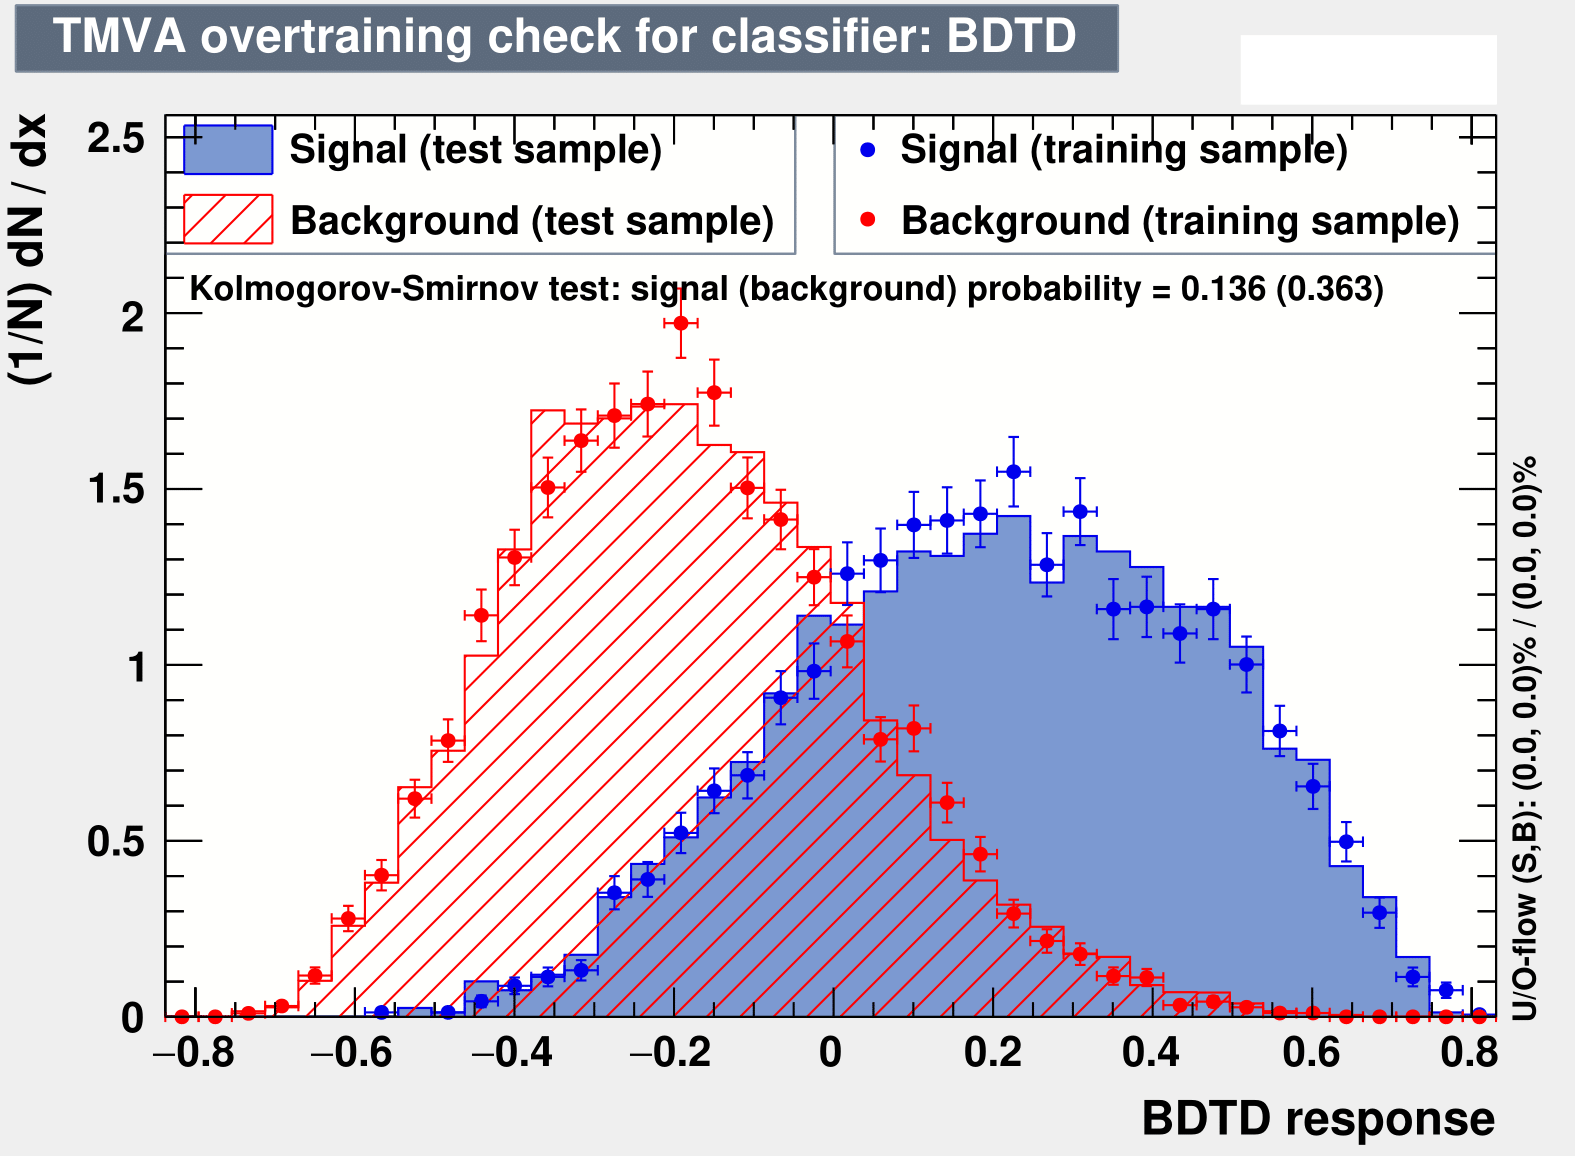
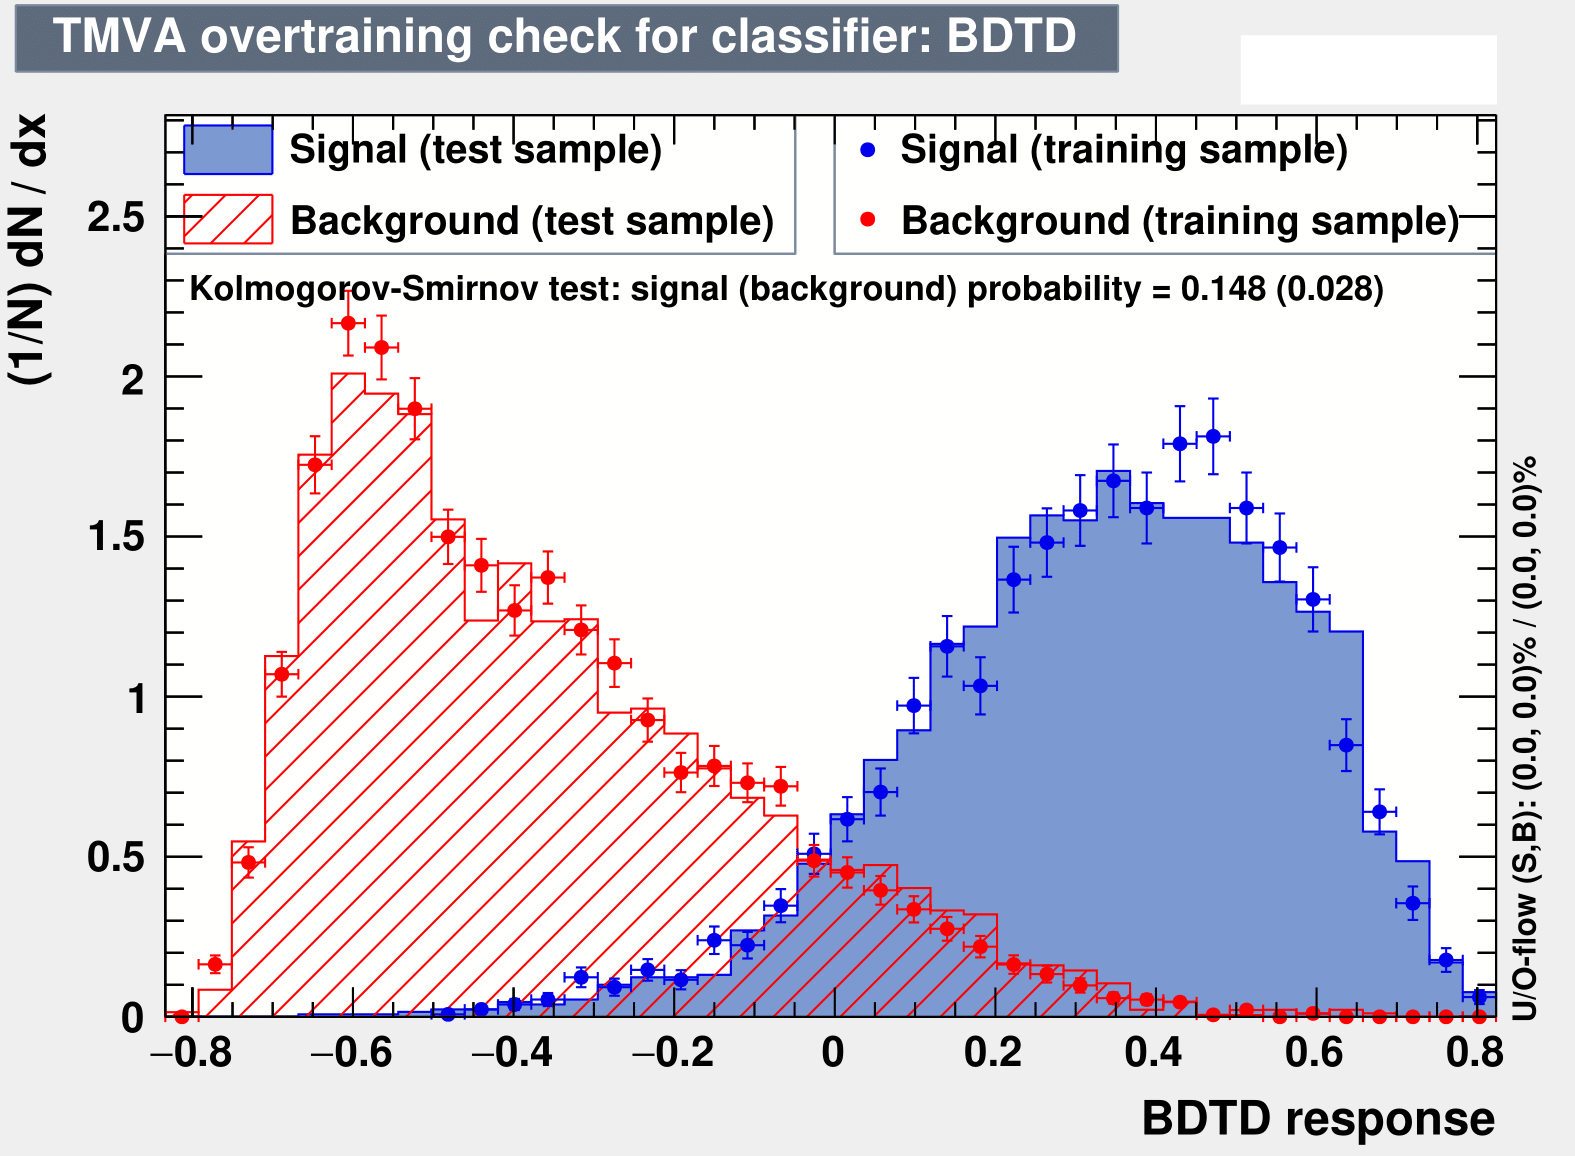
Further, exactly two -tagged jets and three isolated leptons with the aforementioned transverse momenta satisfying are demanded. Out of these three leptons we first construct the invariant mass of the SFOS lepton pair, which must peak at . Then the remaining lepton along with the and -jets is used to reconstruct the charged Higgs mass. We apply the same technique to reconstruct as described in section IV.2. Next, we perform the MVA by adjusting the BDT parameters as mentioned in Table 21. The signal and background distributions and the KS-scores are depicted in Fig.21 in Appendix A. The significance vs. BDT score plot has been presented in Fig.12(a). Degree of rejecting the backgrounds can be identified from the ROC curves for three benchmarks in Fig.12(b). Following the ranking of the kinematic variables provided by BDTD algorithm we choose the following twelve kinematic variables:
| (17) |
Here, , and are constructed from the two SFOS leptons which satisfy -mass criteria discussed at the beginning of this section, while the remaining third lepton refers to the in the kinematic variable . and are the reconstructed -boson mass and charged Higgs mass respectively. The and are the visible transverse momentum of the charged Higgs and total system ( and -boson) respectively. is the azimuthal angle separation between the charged Higgs and -boson system, whereas is the contransverse mass of the -system, constructed as defined in section IV.2. The other kinematic variables have their usual meaning. Among all these kinematic variables, are the most important to maximise the signal significance. The results are summarised in Table. 22. In addition, the signal significances considering and systematic uncertainty have been relegated in Table 22. Also, We show the normalised distributions of the kinematic variables having best discriminatory power between the signal and the backgrounds in Fig. 11.


| NTrees | MinNodeSize | MaxDepth | nCuts | KS-score for | BDT Score | |
|---|---|---|---|---|---|---|
| Signal(Background) | ||||||
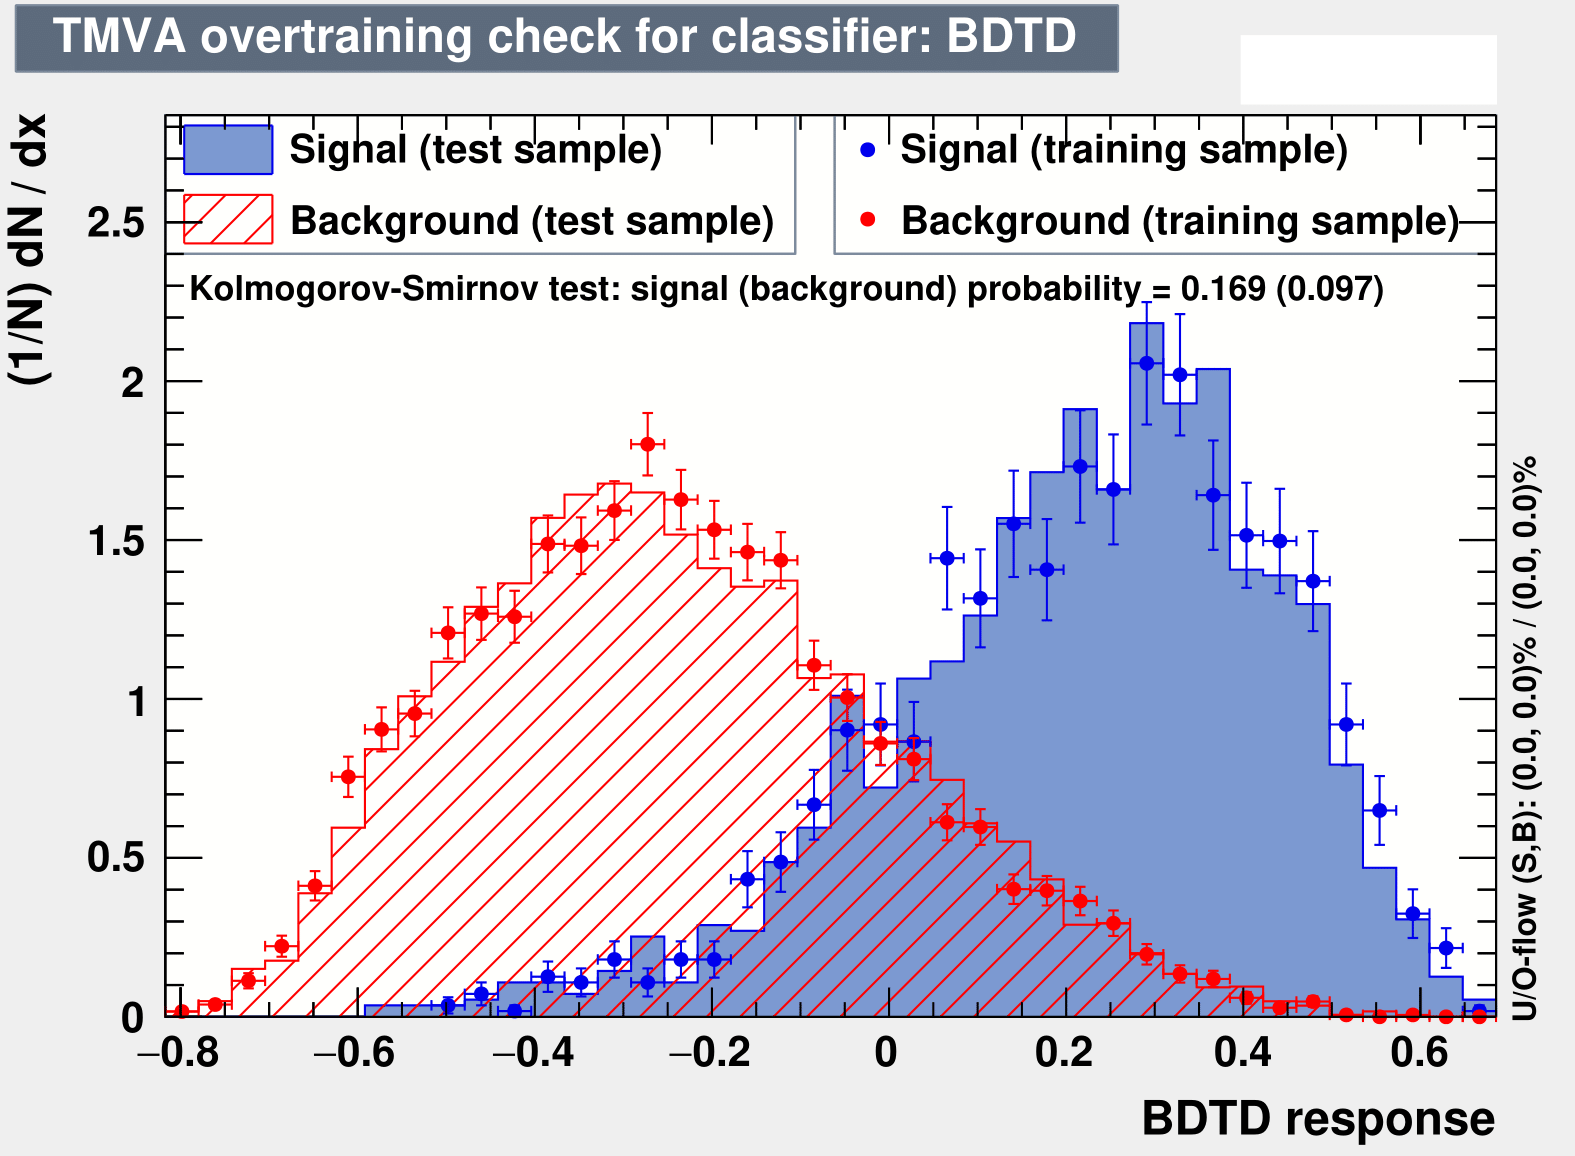
| BP1 | 100 | 3 % | 2 | 20 | 0.169(0.097) | 0.1 |
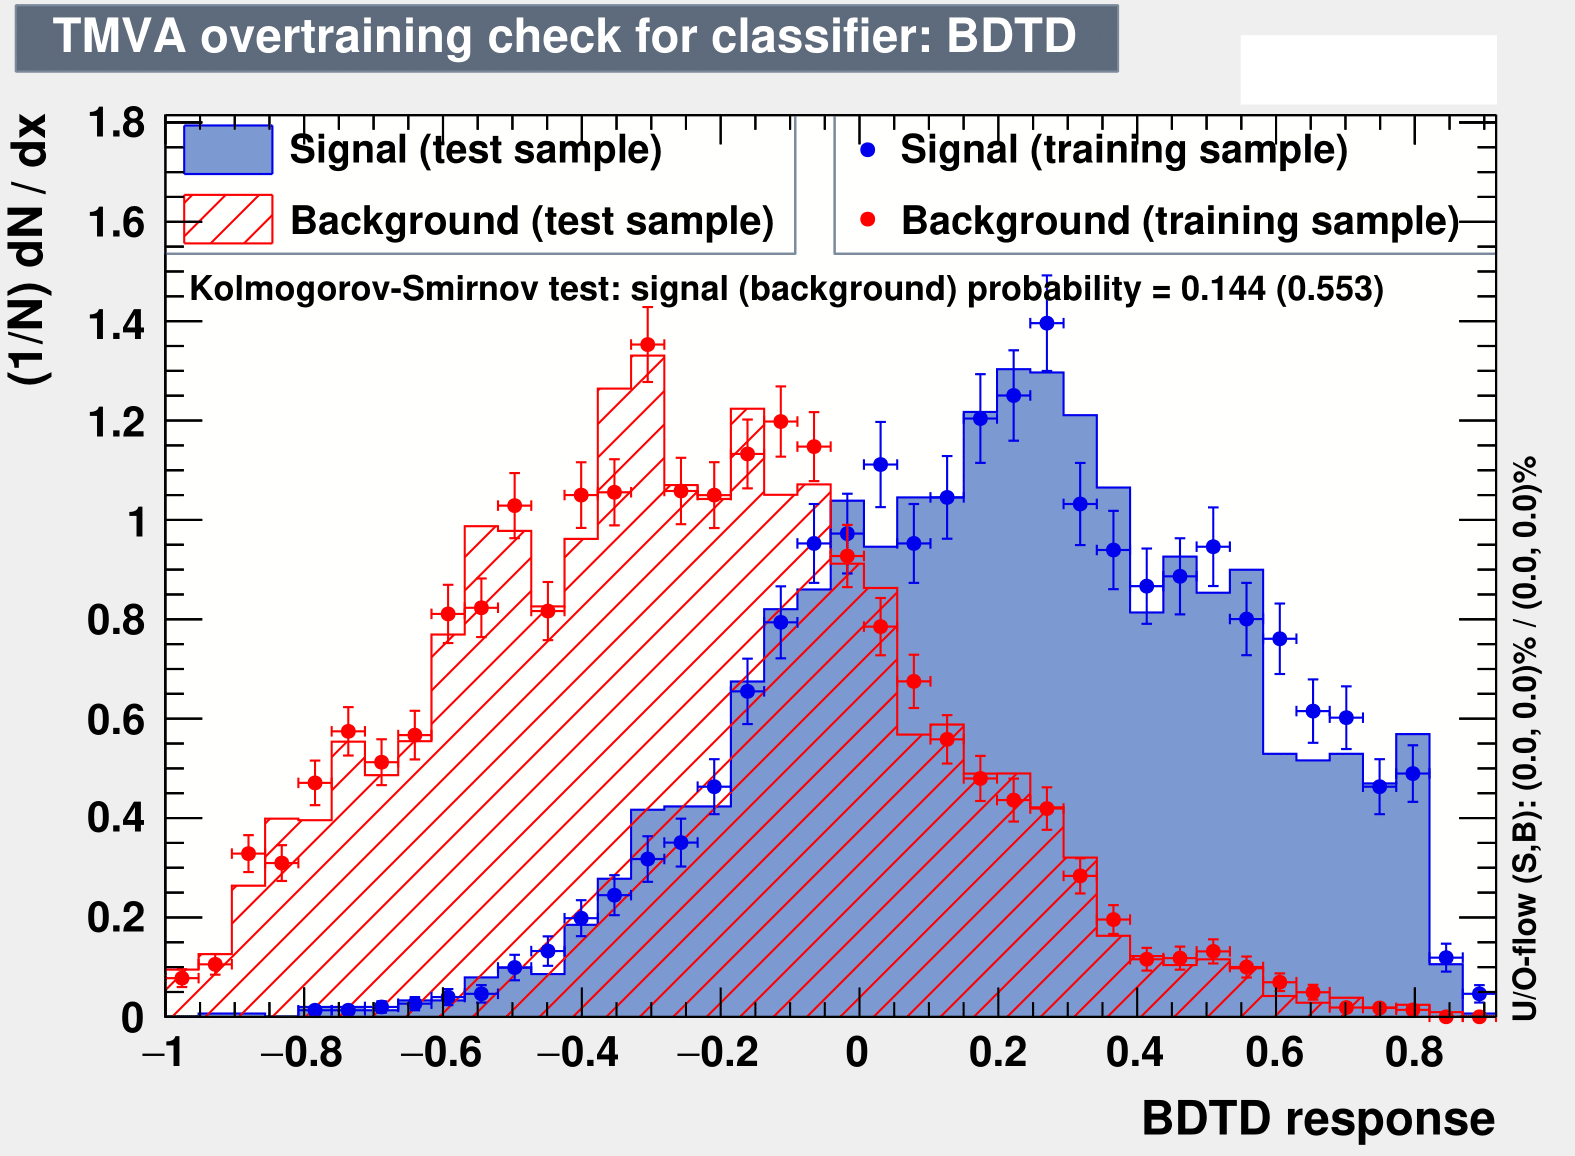
| BP2 | 30 | 4 % | 2 | 20 | 0.144(0.553) | -0.04 |
| BP3 | 95 | 3 % | 2 | 20 | 0.136(0.363) | 0.3 |
| BP4 | 90 | 3 % | 2 | 20 | 0.148(0.028) | 0.3 |
| GeV | ||
| Process | Yield at | |
| Background | ||
| Total | ||
| Signal | ||
| Signal significance ( ) | ||
| Signal significance ( ) | ||
| GeV | ||
| Process | Yield at | |
| Background | ||
| Total | ||
| Signal | ||
| Signal significance ( ) | ||
| Signal significance ( ) | ||
| GeV | ||
| Process | Yield at | |
| Background | ||
| Total | ||
| Signal | ||
| Signal significance ( ) | ||
| Signal significance ( ) | ||
| TeV | ||
| Process | Yield at | |
| Background | ||
| Total | ||
| Signal | ||
| Signal significance ( ) | ||
| Signal significance ( ) | ||
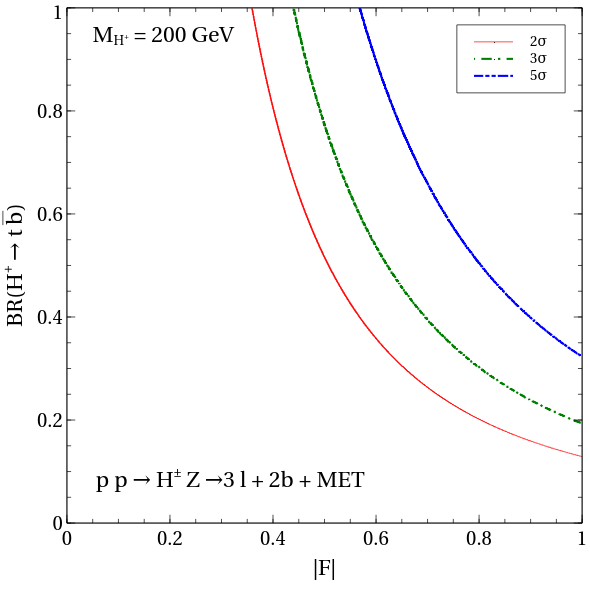
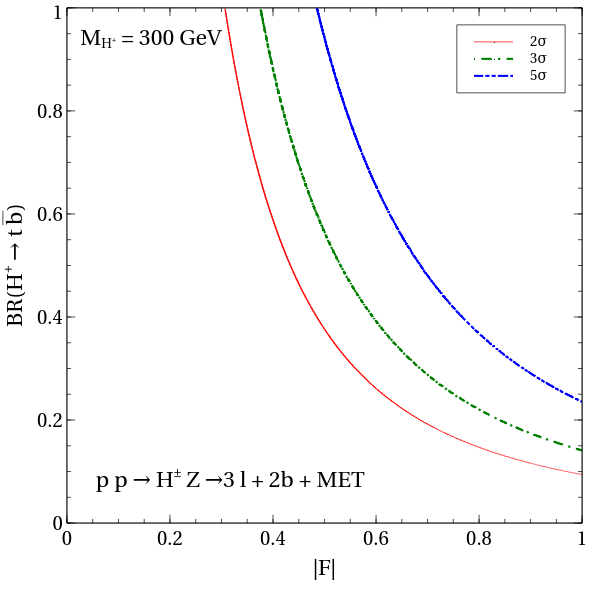
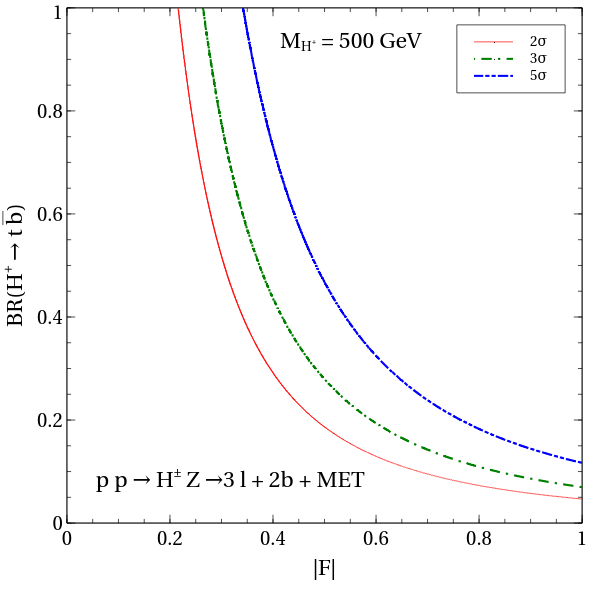
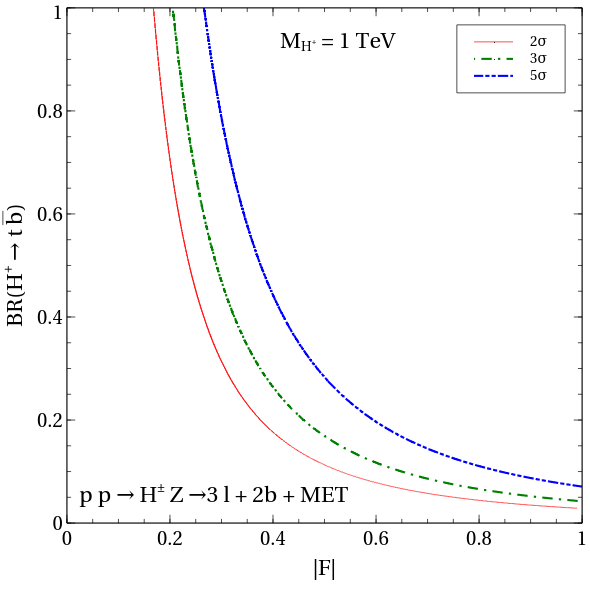
After computing the signal significance for our proposed signal () corresponding to the BPs and a specific value of the coupling and BR) = 40%, we present the contours of constant signal significance in the -BR) plane in Fig. 13. A straightforward comparison with Fig. 7 establishes that for too, the prospects of the production process is much weaker compared to the VBF process in searching for an . We quote a few numbers to put this into perspective. For = 0.4, the VBF process offers 5 observability for BR 15. This correspondingly weakens to BR 70 in case of .
V Comparing the VBF sensitivities
In this section, we compare the sensitivities of the various channels in the - plane. The magenta (sky blue) area in Fig.14 is excluded by the search. Since the process statistically outperforms the process, we choose it to compare the sensitivities of the decay channels corresponding to the former. The dashed (solid) red, green and blue lines in Fig.14 respectively correspond to the 2-exclusion, 3-discovery and 5-discovery contours for the () channel. These contours are drawn by appropriately scaling the results of the multivariate analysis of either channel.
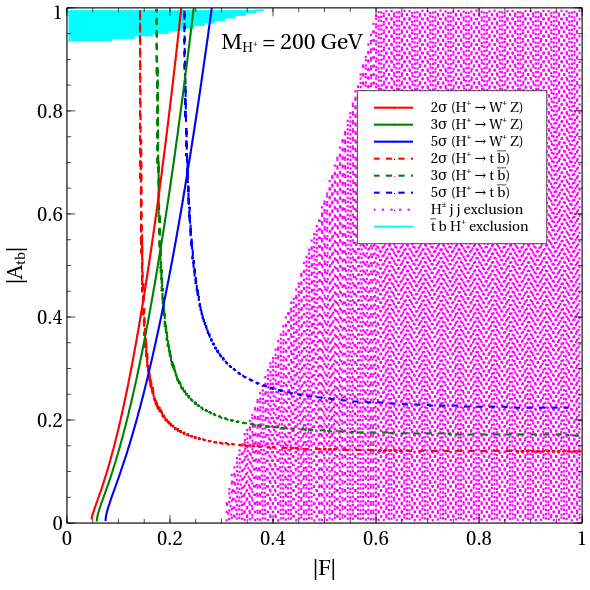
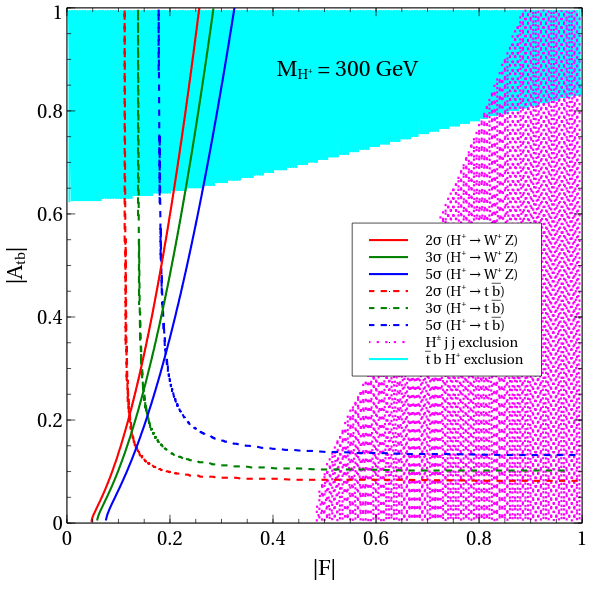
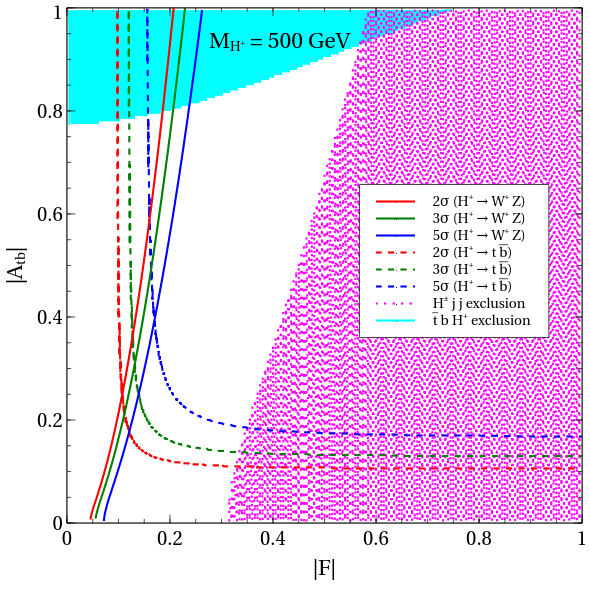
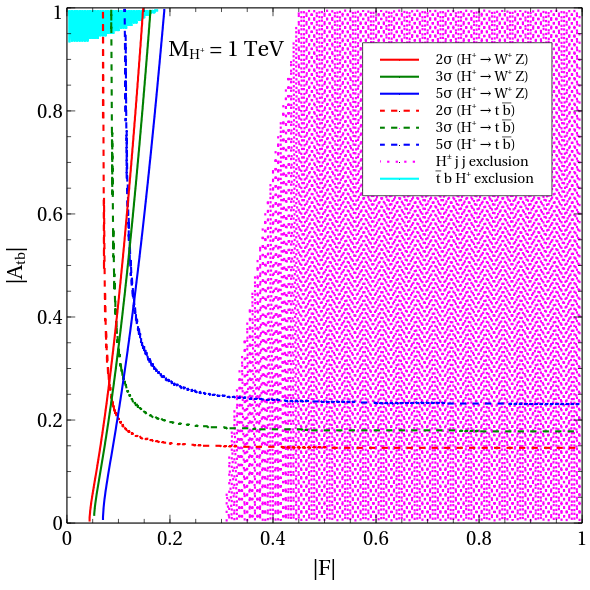
An inspection of Fig. 14 reveals that the final state is useful in probing high values of for low for all . In case of = 200 GeV, can be probed at 5 statistical yield for . A higher statistical yield corresponding to a higher expectedly enhances the sensitivity in the plane. This is concurred by an inspection of Fig. 14. An of mass 500 GeV is seen to offer a 5 observability when and .
On the other hand, the final state comes handy in probing simultaneously low values of and . The reason to this can be traced back to the fact that and therefore increasing (decreasing) while keeping the significance fixed requires increasing (decreasing) too. This is how the lower left corner of the plane gets accessible, a region the signal is blind to. For example, 0.1 for = 200 GeV prospects a 5-discovery potential. A complementarity between the two search channels is thus seen.
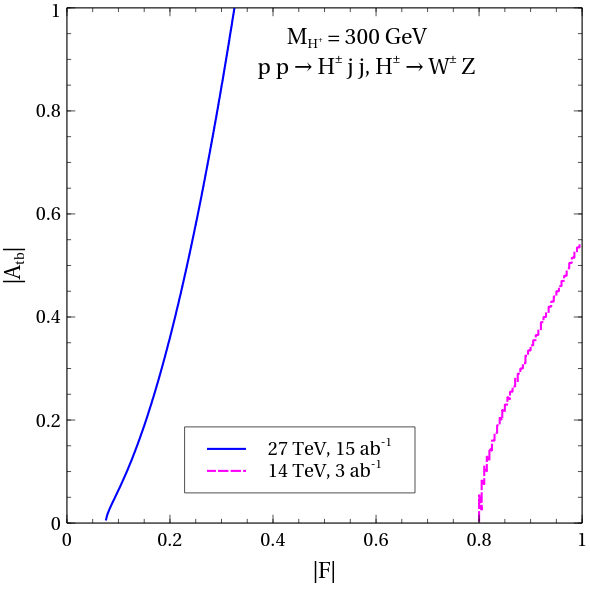
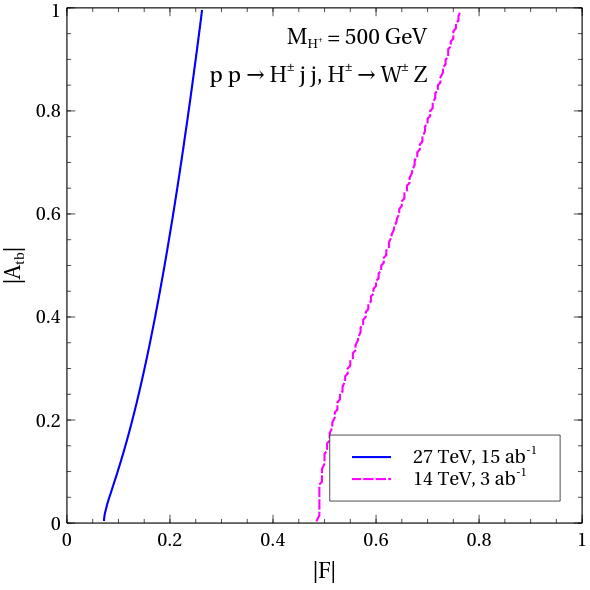
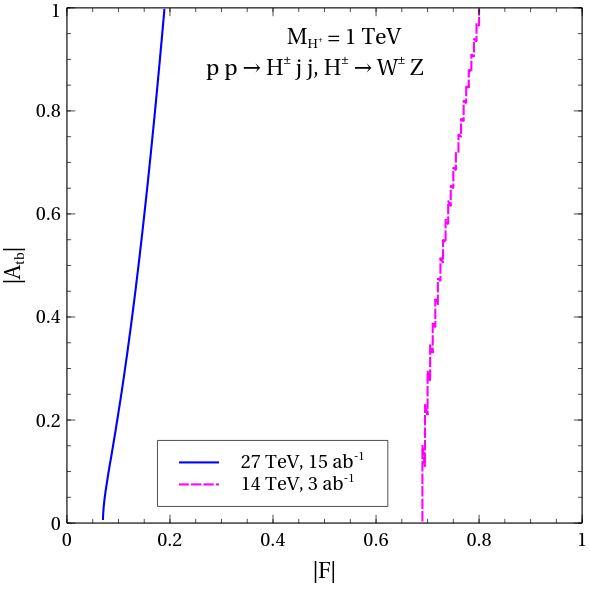
In order to see how the present analyses for a 27 TeV collider fares against the 14 TeV HL-LHC, we extrapolate the 13 TeV, 3 ab-1 analyses of the two VBF channels as reported in Cen et al. (2019), to 14 TeV. The extrapolation procedure makes use of the fact that kinematical distributions, and hence, the cut-efficiencies do not change appreciably upon changing from = 13 TeV to 14 TeV. Keeping the integrated luminosity fixed, one can write in that case, where and denote the number of signal (background) events at 13 TeV and 14 TeV respectively. The subscripts and superscripts of a cross section follow a similar notation. The contours in the plane for 13 TeV can thus be extrapolated to 14 TeV (pink curve) as shown in Figs.15 and 16. The 5 discovery contours corresponding to the channel are compared for 14 TeV and 27 TeV in Fig.15. The 27 TeV collider at 15 ab-1 is seen to improve the sensitivity of the channel by a great margin. For example, the lowest value of the HL-LHC can probe at 5 is 0.67 and one requires a large = 1 for it. The senstivity for higher is also seen to be much better for 27 TeV.
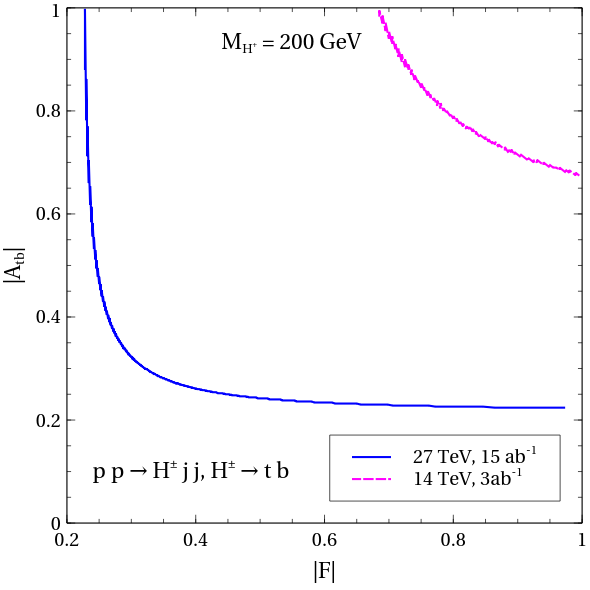
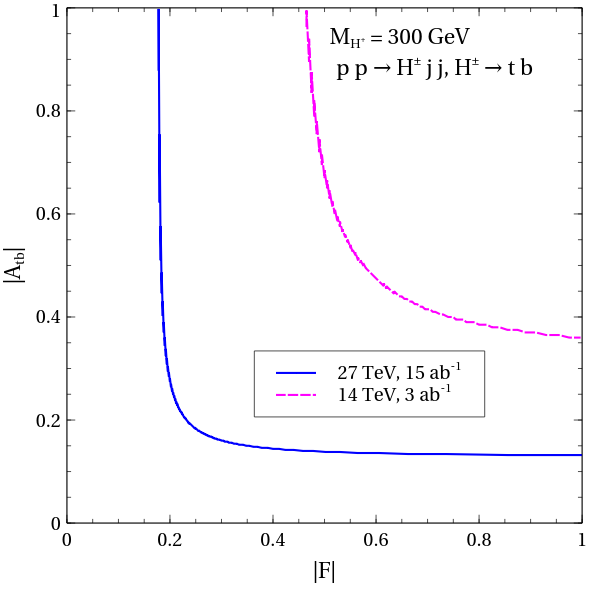
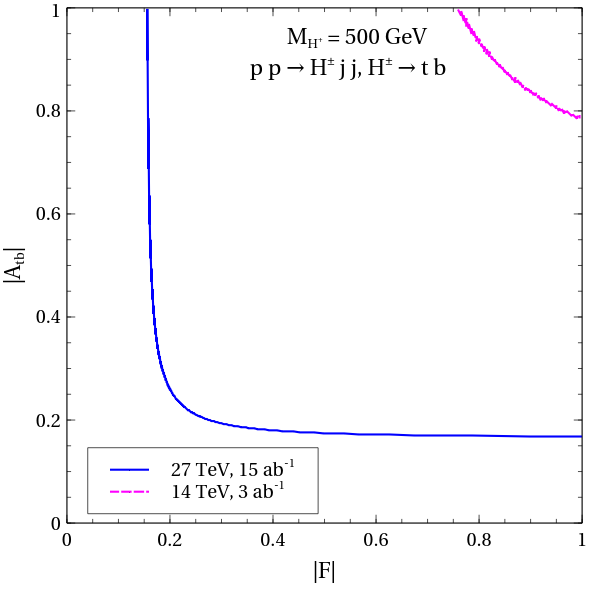
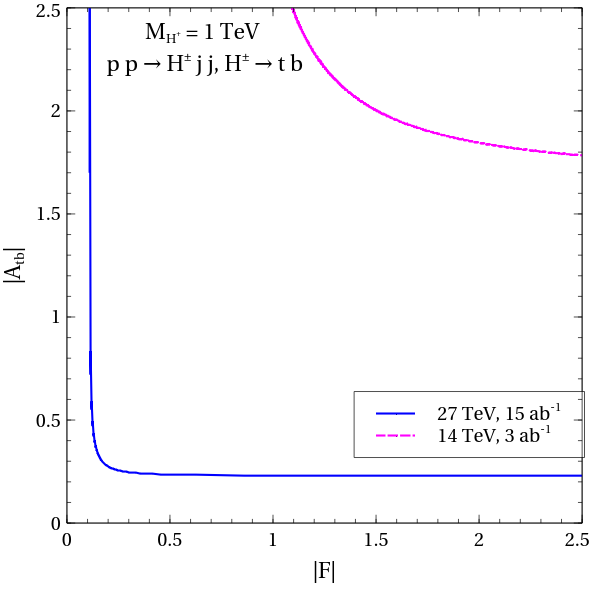
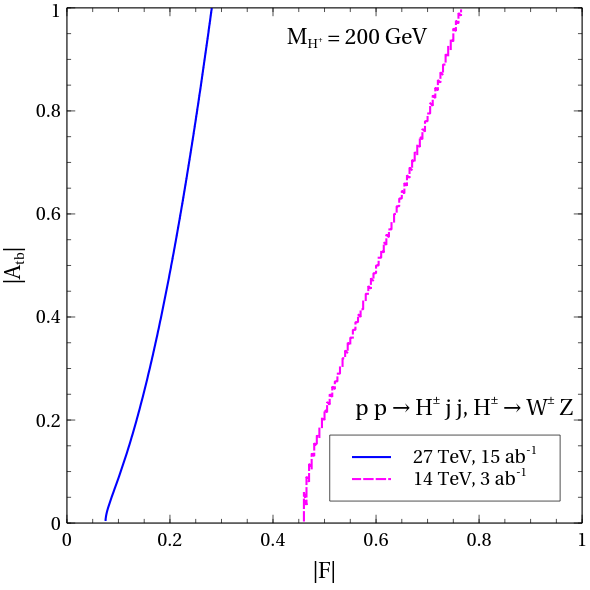
Fig.16 compares the 2 exclusion contours corresponding to the channel. For = 200 and = 0.1, the HL-LHC demands 0.5 for 2 exclusion as opposed to the much lower 0.1 in case of 27 TeV. The exclusion by a 27 TeV collider is seen to be much stronger than 14 TeV for the other masses also. In all, it is clearly established that a 27 TeV collider with 15 ab-1 integrated luminosity leads to a significant improvement of the VBF senstivities.
The sensitivity we obtain in terms of the generic parameters and can be straightforwardly translated to a realistic model containing singly charged boson(s) coupling dominantly to and . As discussed before, a prime example is the Georgi-Machacek (GM) model Georgi and Machacek (1985) whose scalar sector comprises a real triplet and a complex triplet over and above the regular doublet. The triplets can be expressed as,
| (18a) | |||
Here refers to the vacuum expectation value (VEV) of the triplet . With denoting the VEV of the scalar doublet, one has = 246 GeV. A custodial-symmetric scalar potential such as in the GM model demands in which case there is no constraint on from the -parameter.
Counting the singly charged boson coming from the scalar doublet, the total number of singly charged scalars in the GM model becomes three. The corresponding mass matrix is diagonalised by the action of a mixing angle giving rise to a charged goldstone , and, the physical scalars and . Most importantly, both couple to and the third generation quarks for an arbitrary . More precisely,
| (19a) | |||
| (19b) | |||
being the cosine of Weinberg angle.
That the interaction is proportional to the triplet VEV is a generic feature of models featuring scalar triplets. The sensitivity contours in the - plane can therefore be mapped to the -|sin| plane for the GM model for a given charged boson.
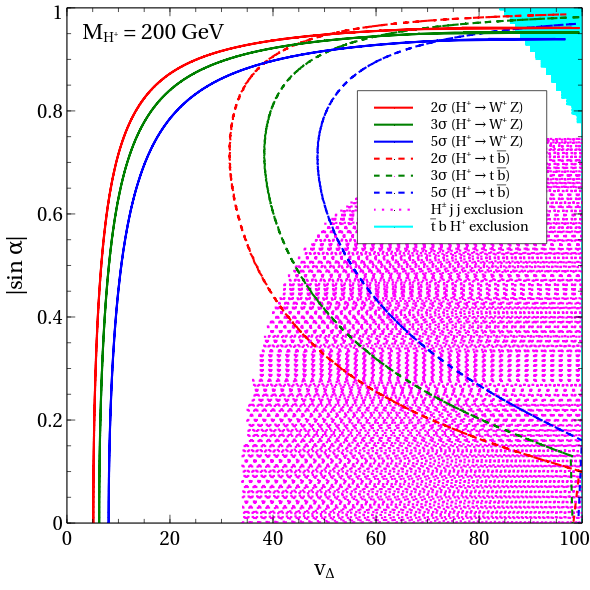
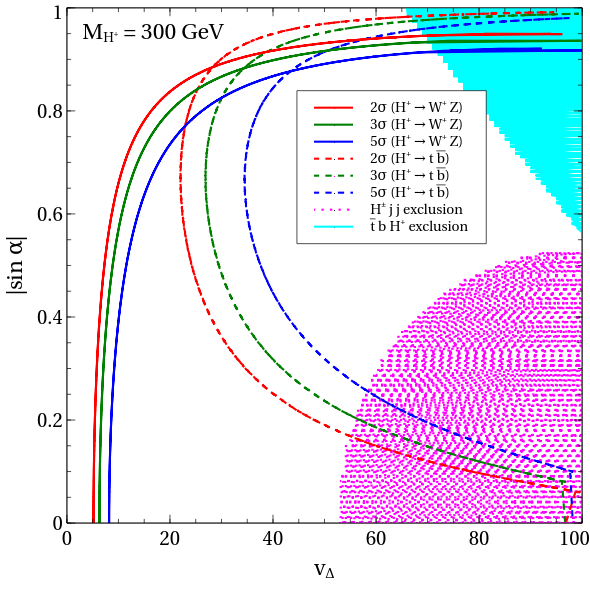
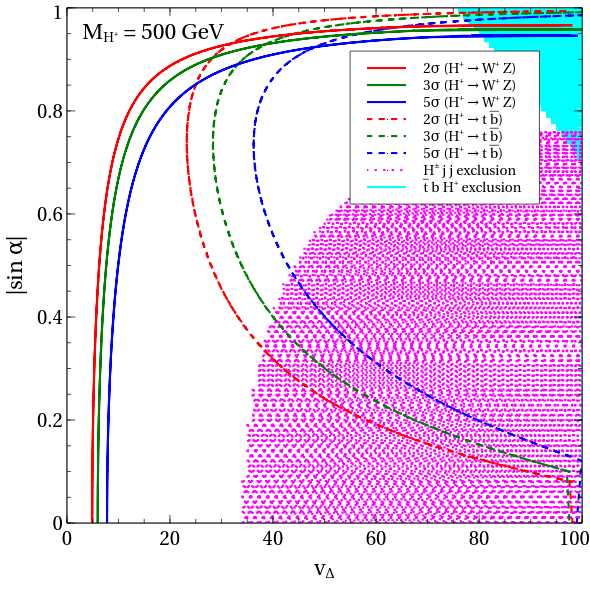
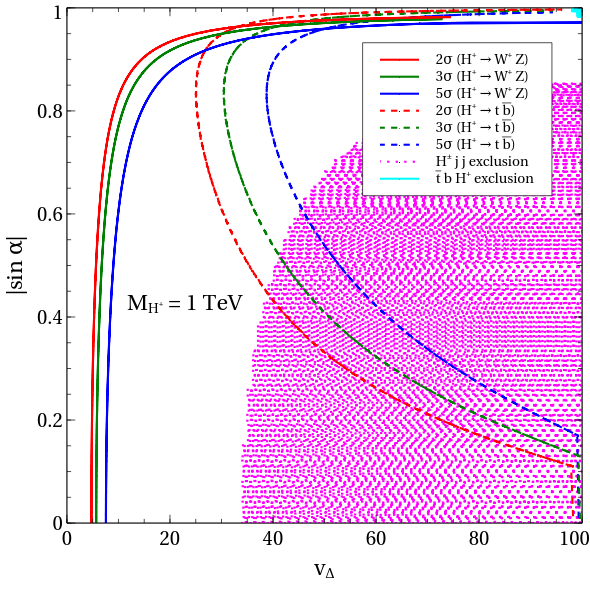
Fig.17 displays the contours for 888There exist other GM model parameters Keeshan et al. (2020); Cen et al. (2018) such as scalar couplings, masses and mixing angles that directly do not enter a parameter region shown in the plane. It can therefore be inferred that the entire plane gets allowed by electroweak precision measurements by a judicious choice of the other model parameters. Hence, the impact of electroweak precision constraints is not separately investigated for this mostly model-independent study. and the colour-coding remains the same as in Fig.14999We assume that is heavier than so that the decay is disallowed kinematically.. It is worthwhile here to comment on how the choice of impacts the observability. The cross section of the process is proportional to . Therefore, the cross section becomes maximum around maximal mixing, i.e, thereby also maximising the observability. We find that a 27 TeV hadronic collider with an integrated luminosity of 15 ab-1 excludes an of mass 200 GeV at 95 confidence level for GeV in the vicinity of maximal mixing, a significant improvement over an earlier 13 TeV study Chiang et al. (2019) that reports GeV to be the corresponding exclusion limit. The discovery potential also markedly improves upon switching from 13 TeV to 27 TeV. We read from Fig.17 that a maximally mixing of mass 200 GeV can be discovered at 5 for 48 GeV. For = 300 GeV, 500 GeV and 1 TeV, the minimum values of leading to a 5 observability are 35 GeV, 37 GeV and 39 GeV respectively. In complementarity with a discussion on maximal mixing, low values of sin can be probed taking high . For example, taking = 90 GeV implies that the lowest |sin| allowing for a 5-discovery of an of mass equaling 200 GeV, 300 GeV, 500 GeV and 1 TeV are 0.21, 0.12, 0.15 and 0.20 respectively.
The lower left corner of the plane that the process can probe maps to the low -low |sin| region of the GM model. This is concurred by an inspection of Fig 17. For |sin| = 0.2, an of mass 200 GeV is excluded by the present analysis for 6 GeV. Considering the corresponding bound from the CMS analysis 13 TeV and 36 fb-1 stands at 50 GeV, we deem our analysis a considerable improvement over the former and demonstrative of the potential of a 27 TeV -collider. A 5-discovery is predicted for 9 GeV. The sensitivity of this channel for the higher masses remains approximately the same in this corner of the -|sin| plane as can be read from Fig. 17.
Prior to closing this section, we add that the results we obtained in this study can be interpreted in context of any NP scenario that predicts singly charged Higgs bosons dominantly coupling to the third generation quarks and . The non-minimal variants of the GM model can straightforwardly similarly be examined for observability of the singly charged scalars. However, we would like to comment on the observability in case of multi-doublet models where is radiatively suppressed. As stated in the introduction, the Type-I 2HDM and its inert or color octet extensions predict which is below the sensitivity threshold of the present analysis. That said, there is still the option of arbitarily increasing the number of scalar doublets to enhance and bring it within the sensitivity reach. However, such models are theoretically contorted and tightly constrained by experimental data. Overall, it can therefore be concluded that despite such a huge enhancement in sensitivity compared to the HL-LHC, the 27 TeV machine with 15 ab-1 integrated luminosity cannot probe the radiative vertex, at least in the minimal multi-doublet models such as 2HDMs and 3HDMs.
VI Summary and conclusions
In this work, we have investigated the prospects of observing a gauge-phillic singly charged Higgs boson at the 27 TeV upgrade of the LHC attaining 15 ab-1 integrated luminosity. Motivated by certain realistic scenarios, it is assumed that the charged scalar dominantly interacts with () and () via the generic couplings and respectively. Two kinematically distinct topologies for production, i.e., the VBF process and are proposed for detailed study. The so produced decays to the and pairs and complete leptonic cascades of the same are chosen for detailed analyses. That is, the following signals were analysed. (a) , (b) , (c) and (d) , where . We took = 200 GeV, 300 GeV, 500 GeV and 1 TeV as benchmark mass points for the ensuing analysis. In addition to using the conventional cut-based method, multivariate techniques stemming from the boosted-decision-tree algorithm were also adopted. We summarise below our key results.
-
•
The statistical yield of the VBF production process supersedes that of the process for both and .
-
•
The two VBF channels are seen to probe somewhat complementary regions of the - plane, which clearly is an upshot of the present analysis. The signal is found to be able to probe the lower left corner of the - plane.
-
•
The generic nature of the study has enabled to interpret the obtained results in context of the Georgi-Machacek model. The relevant parameters for this case are the VEV and the mixing angle . The signal predicts 5 discovery of a 500 GeV charged scalar for a 38 GeV. With the , the 5 threshold lowers to 8 GeV.
As a passing remark, our study highlights that the vertex is an important interaction to search for a singly charged Higgs boson. It also establishes that a = 27 TeV collider with an integrated luminosity of 15 ab-1 can be a powerful tool to improve the discovery potential of a charged Higgs via such an interaction over the earlier analyses carried out at lower centre-of-mass energies. The present analysis therefore serves as an important case study on the efficacy of a 27 TeV hadronic collider.
Acknowledgements.
The authors sincerely thank Biplob Bhattacherjee for crucial inputs throughout the course of this work, and, for a careful reading of the manuscript. NC is financially supported by IISc (Indian Institute of Science) through the C.V.Raman postdoctoral fellowship. NC also acknowledges support from DST, India, under grant number IFA19- PH237 (INSPIRE Faculty Award). IC acknowledges support from DST, India, under grant number IFA18-PH214 (INSPIRE Faculty Award), and, hospitality extended by IISc while this work was in progress. The work of JL is supported by funding available from the Department of Atomic Energy, Government of India, for the Regional Centre for Accelerator-based Particle Physics (RECAPP), Harish-Chandra Research Institute.Appendix A Plots
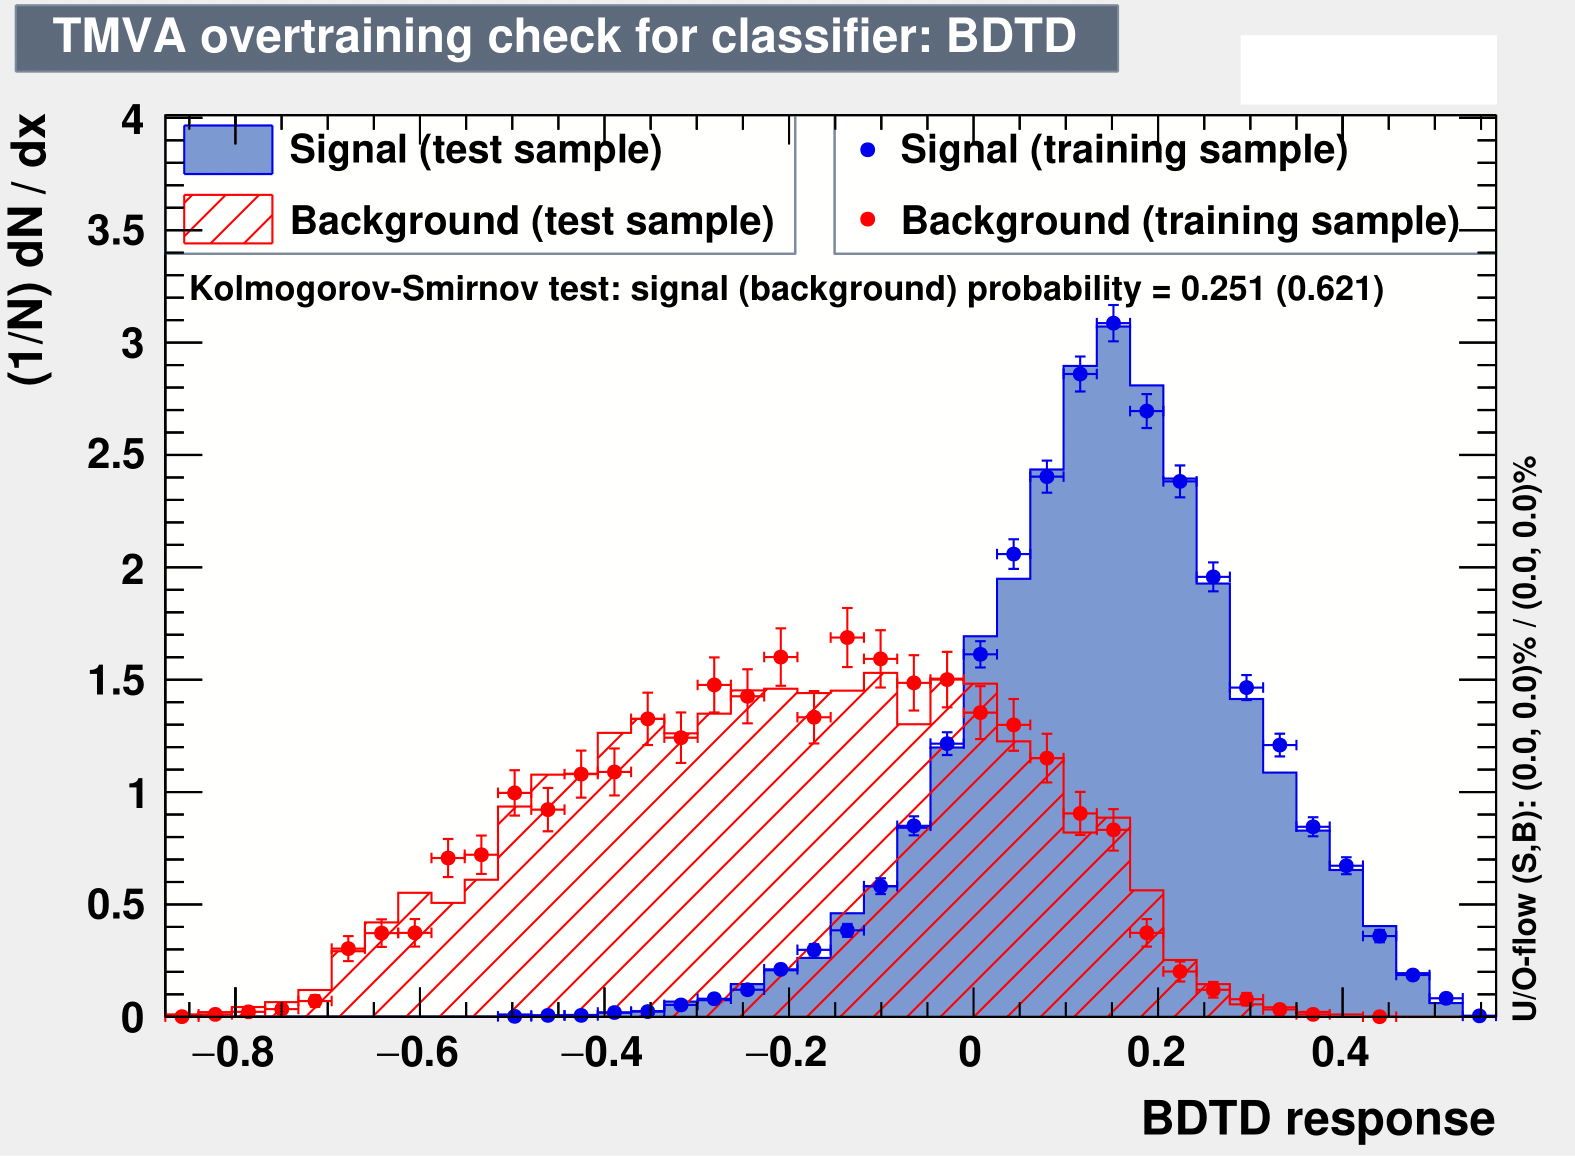
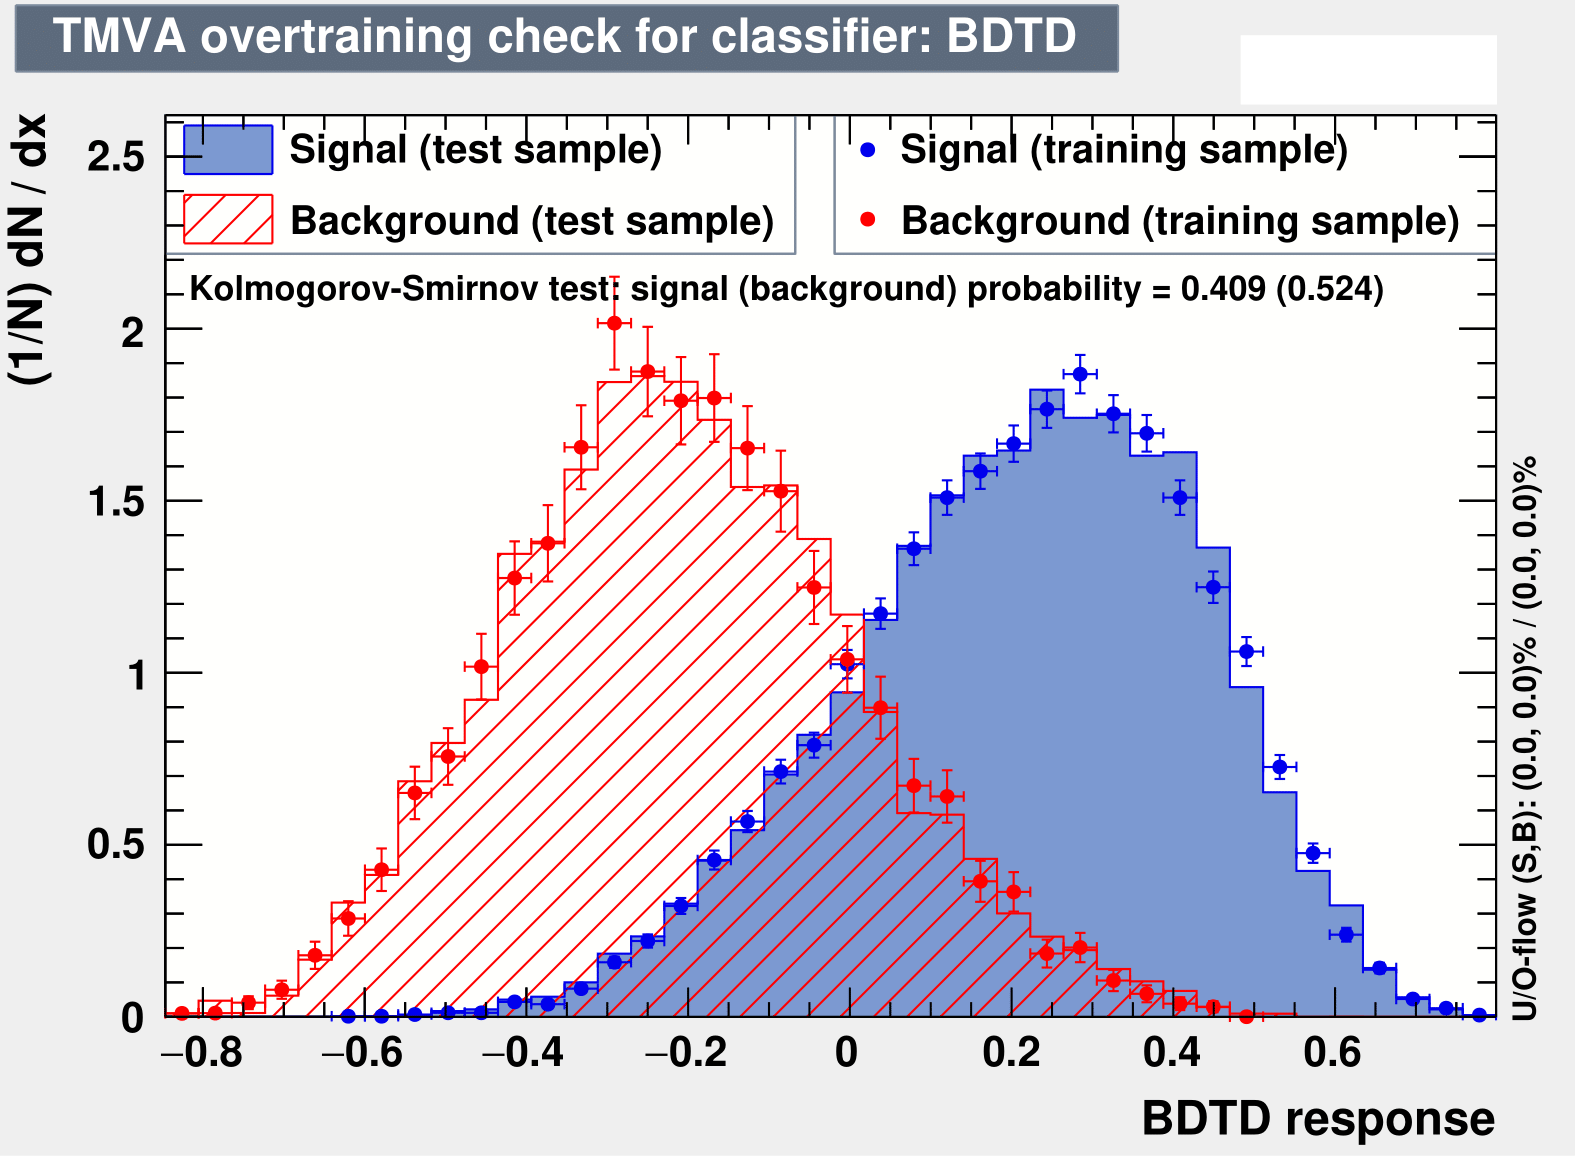
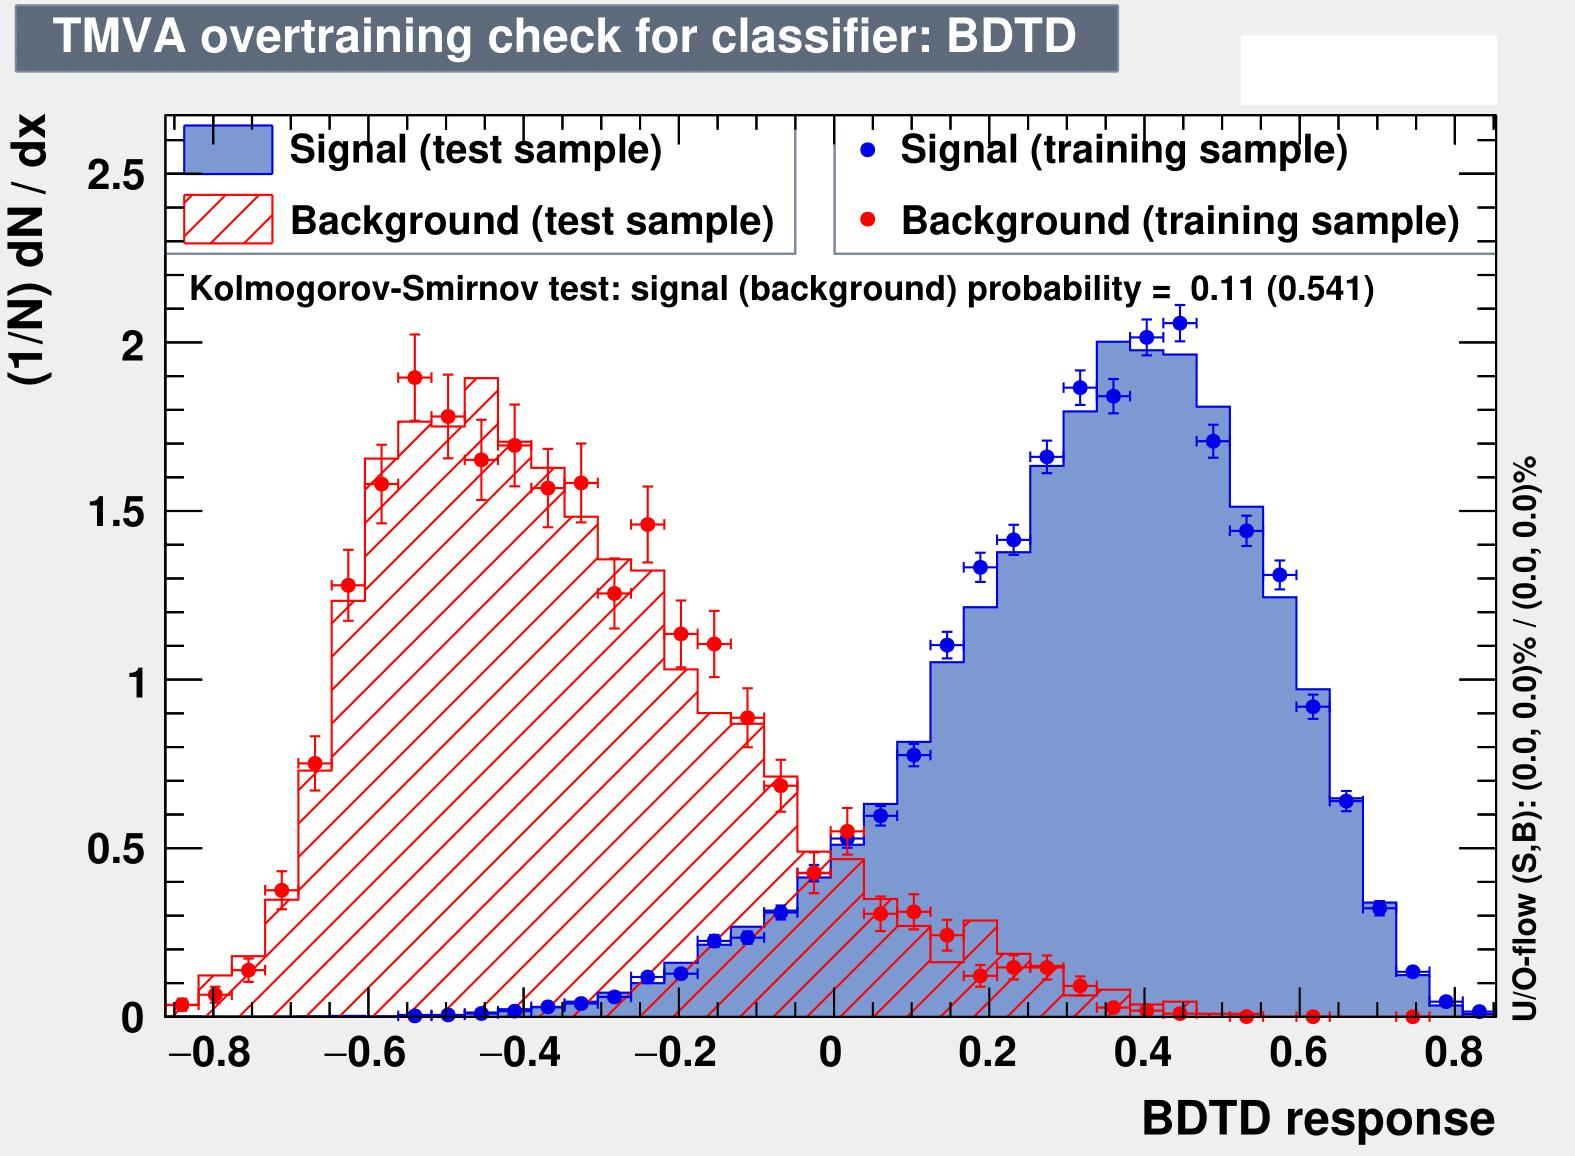
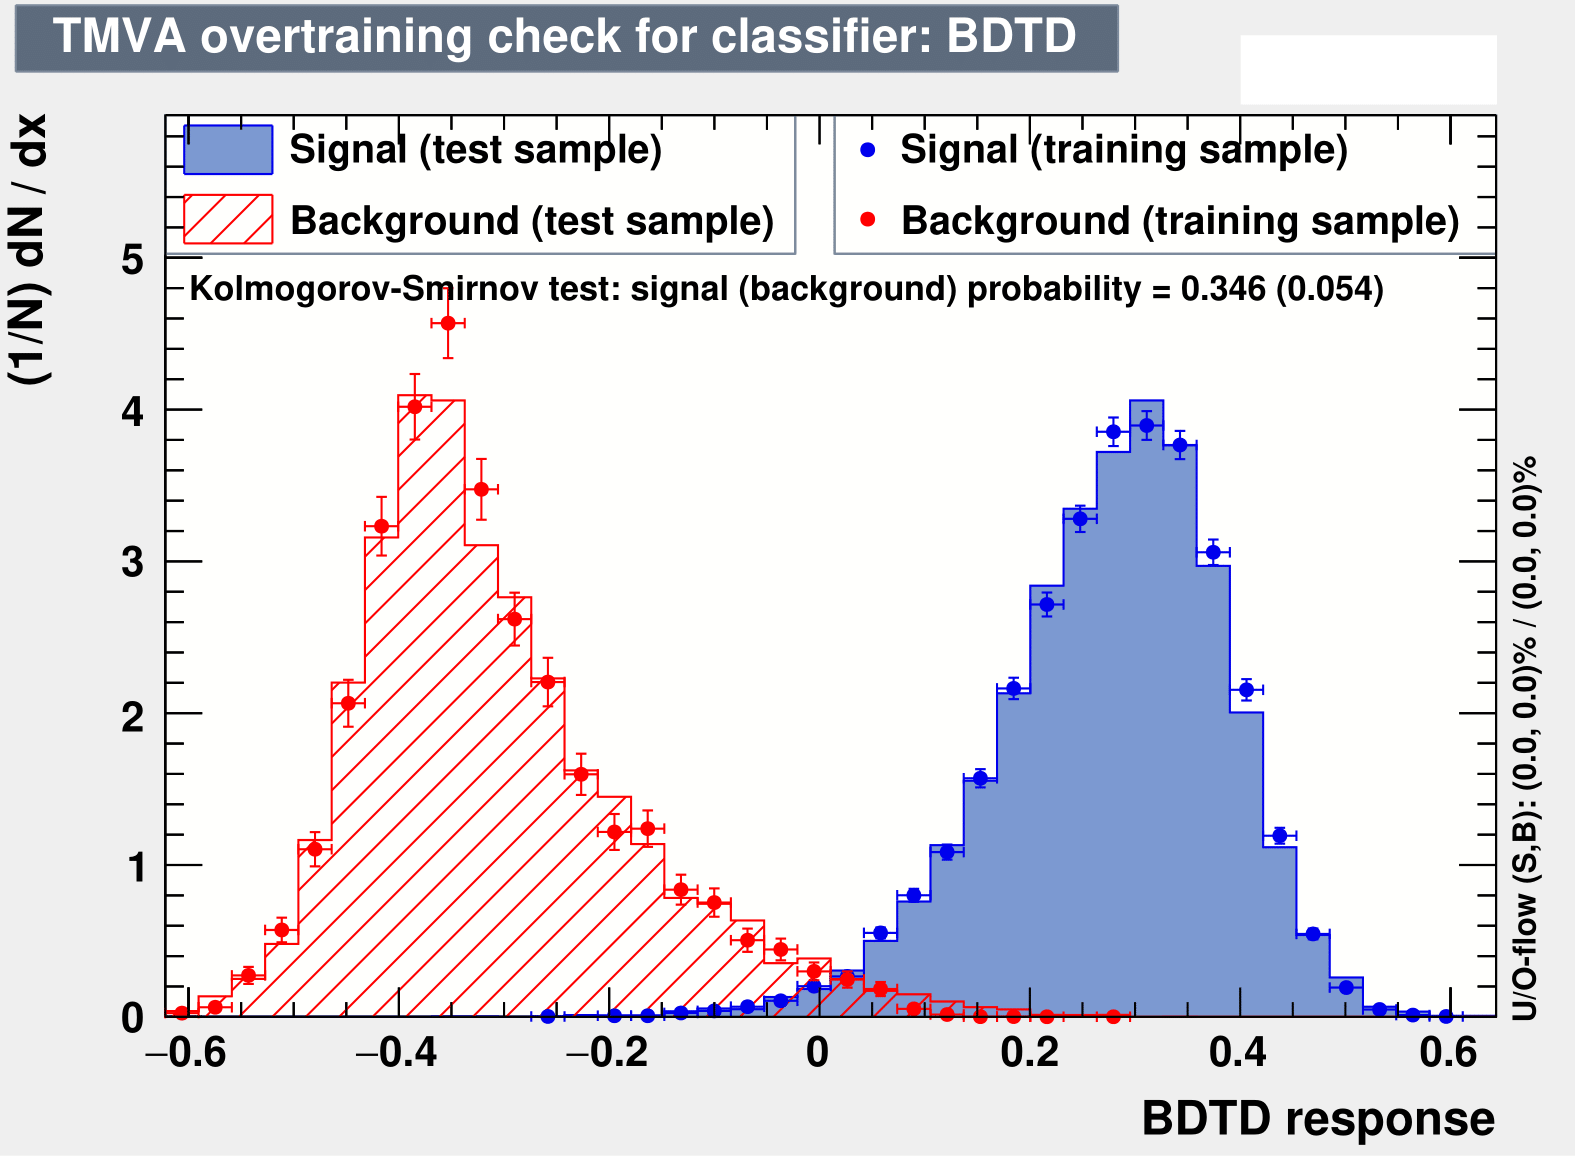
We depict below the distribution of signal and backgrounds along with the KS-scores for each BP corresponding to the four channels.
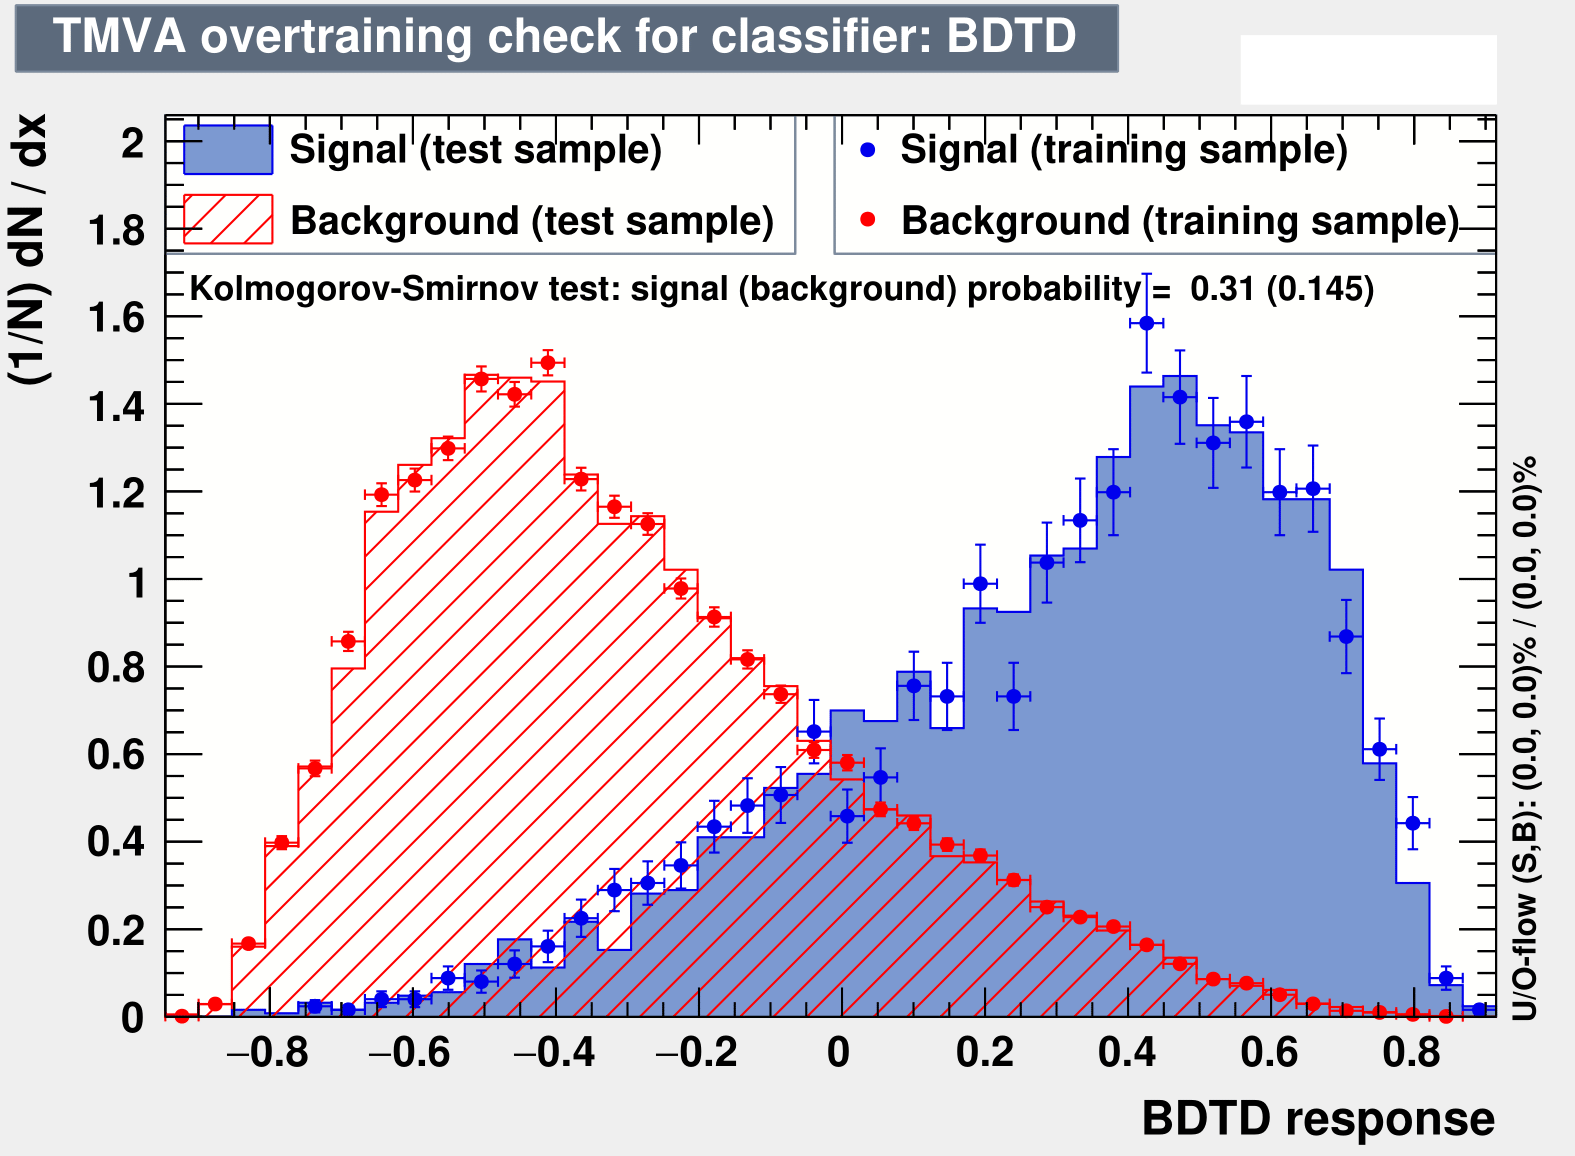
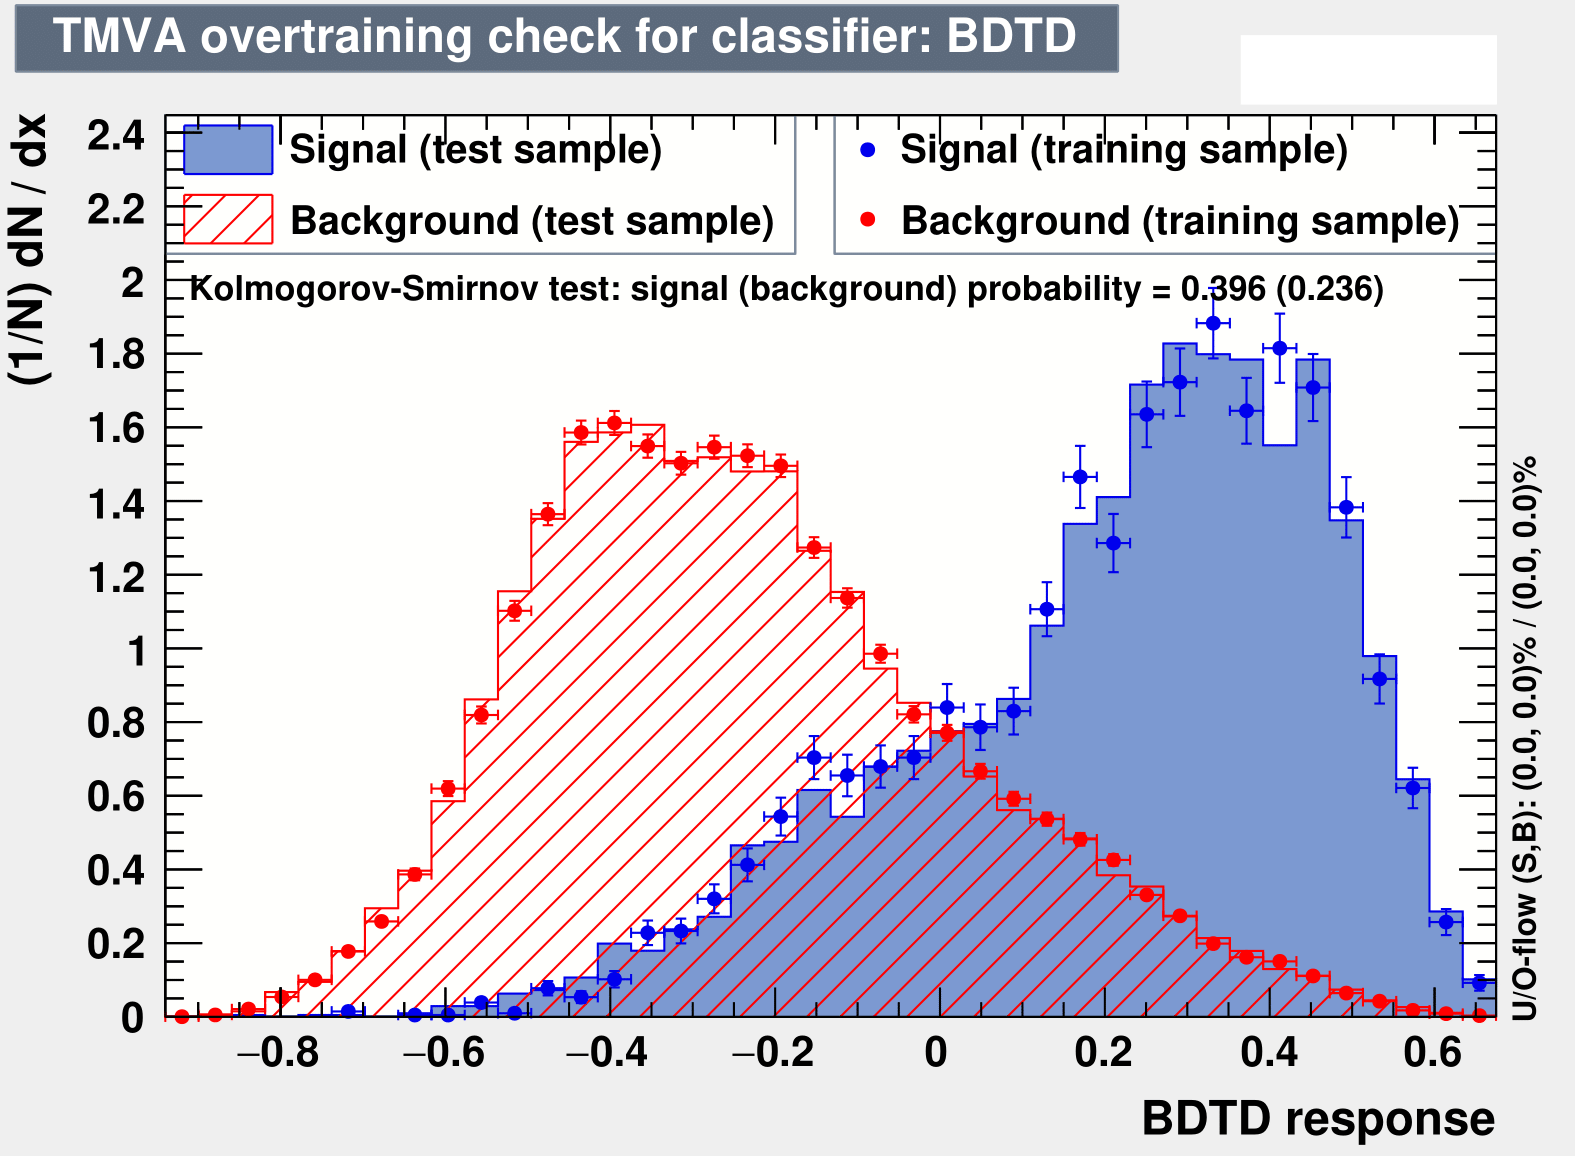
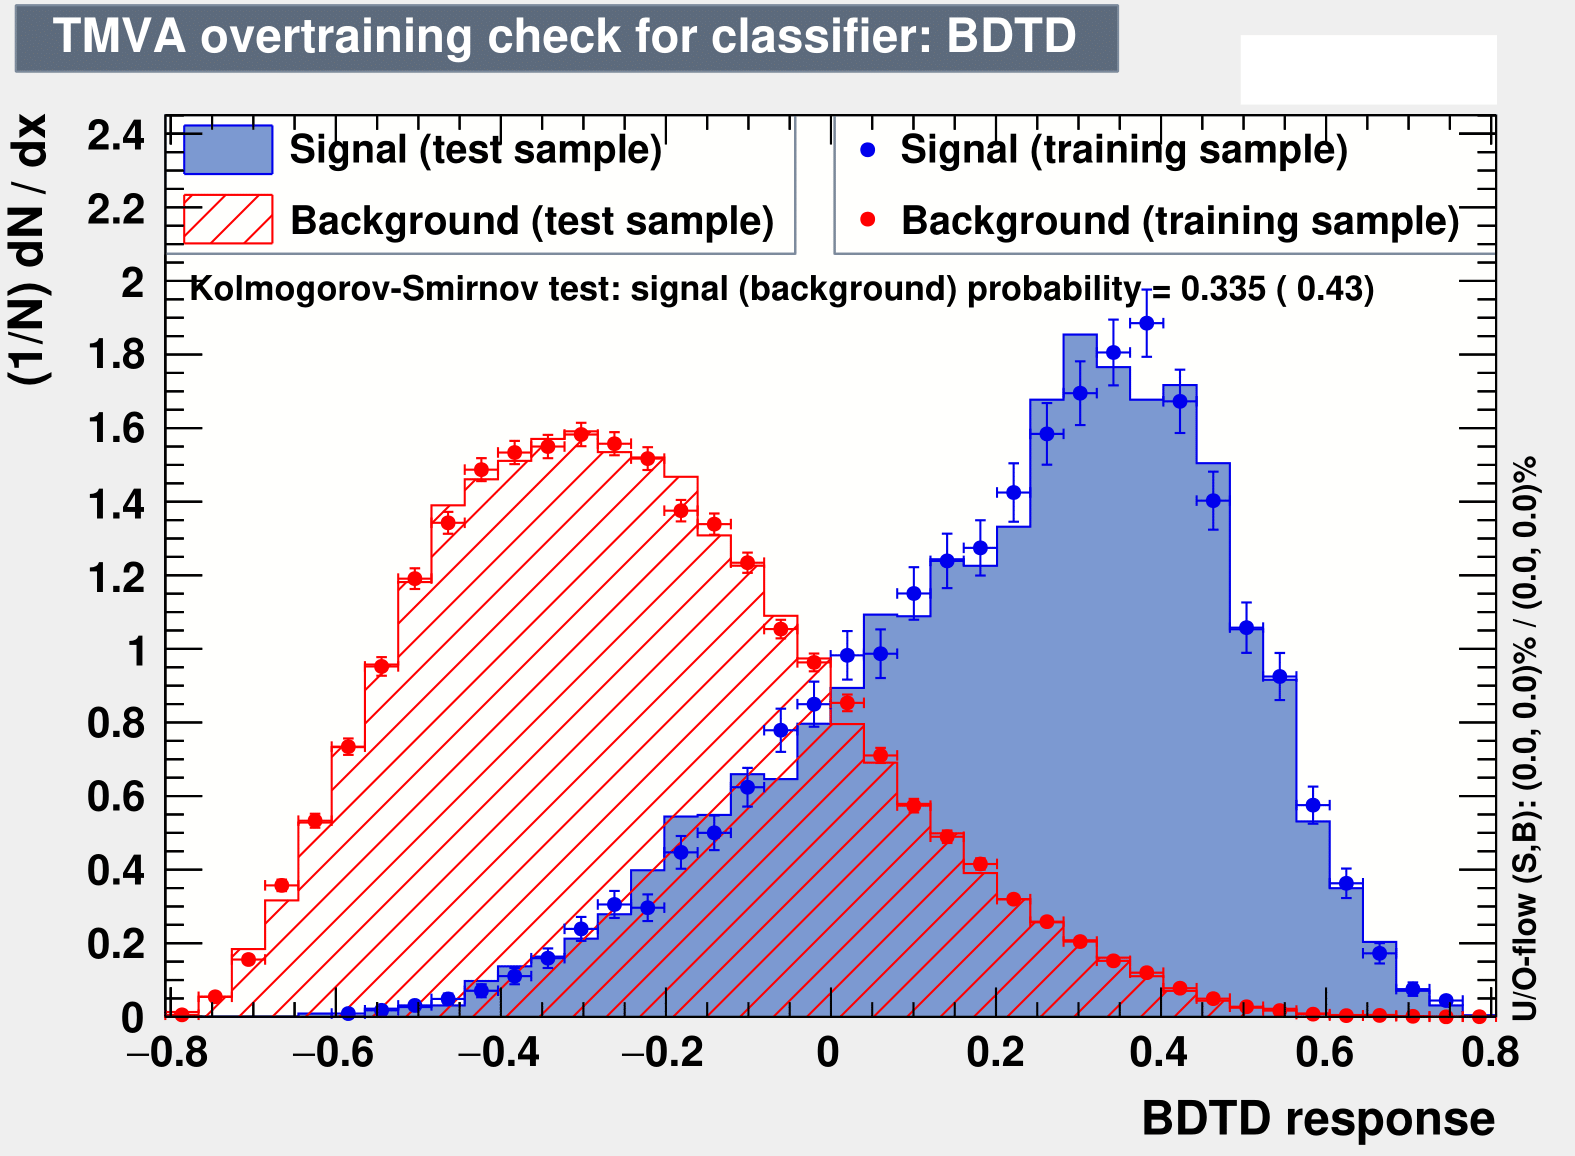
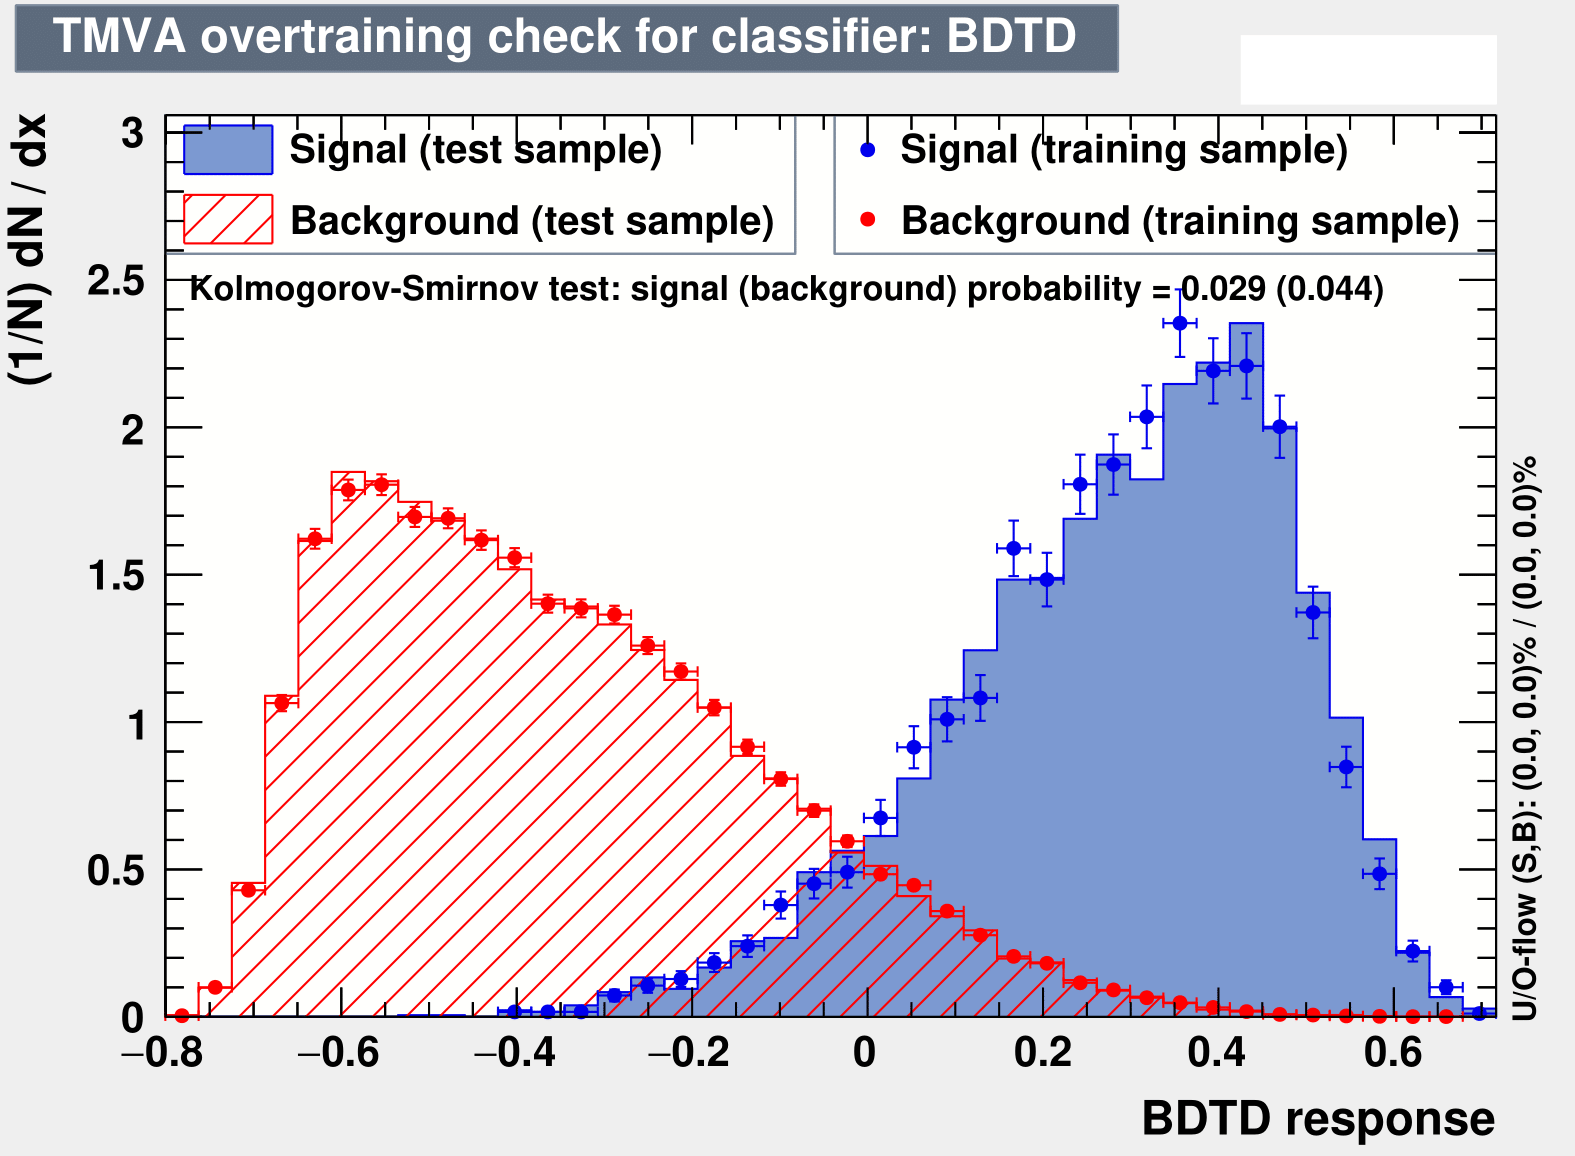
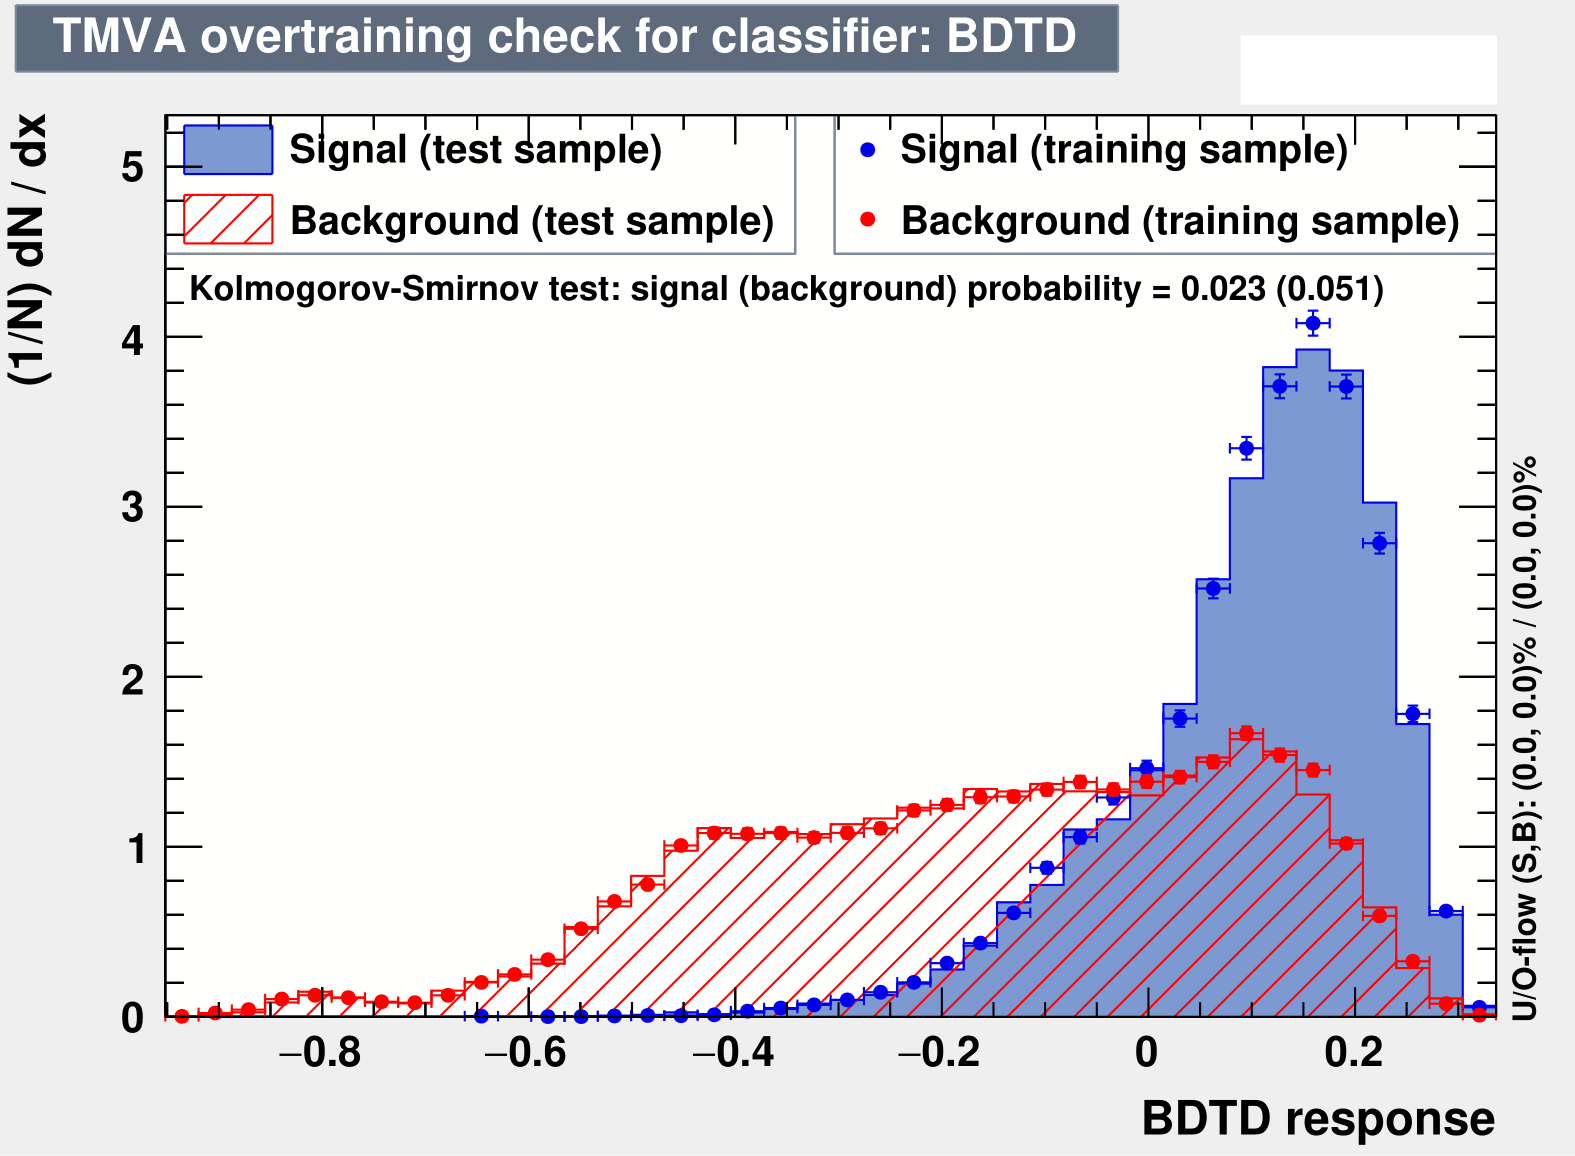
References
- Aad et al. (2012) G. Aad et al. (ATLAS), Phys. Lett. B 716, 1 (2012), arXiv:1207.7214 [hep-ex] .
- Chatrchyan et al. (2012) S. Chatrchyan et al. (CMS), Phys. Lett. B 716, 30 (2012), arXiv:1207.7235 [hep-ex] .
- Deshpande and Ma (1978) N. G. Deshpande and E. Ma, Phys. Rev. D18, 2574 (1978).
- Branco et al. (2012) G. C. Branco, P. M. Ferreira, L. Lavoura, M. N. Rebelo, M. Sher, and J. P. Silva, Phys. Rept. 516, 1 (2012), arXiv:1106.0034 [hep-ph] .
- Grifols and Méndez (1980) J. A. Grifols and A. Méndez, Phys. Rev. D 22, 1725 (1980).
- Gunion et al. (2000) J. F. Gunion, H. E. Haber, G. L. Kane, and S. Dawson, Front. Phys. 80, 1 (2000).
- Kanemura (2000a) S. Kanemura, Phys. Rev. D61, 095001 (2000a), arXiv:hep-ph/9710237 [hep-ph] .
- Kanemura (2000b) S. Kanemura, Eur. Phys. J. C17, 473 (2000b), arXiv:hep-ph/9911541 [hep-ph] .
- Abbas et al. (2018) G. Abbas, D. Das, and M. Patra, Phys. Rev. D98, 115013 (2018), arXiv:1806.11035 [hep-ph] .
- Arhrib et al. (2007) A. Arhrib, R. Benbrik, M. Chabab, W. T. Chang, and T.-C. Yuan, Supersymmetry at LHC: Theoretical and experimental perspectives. Proceedings, CTP Symposium, Cairo, Egypt, March 11-14, 2007, Int. J. Mod. Phys. A22, 6022 (2007), arXiv:0708.1301 [hep-ph] .
- Schechter and Valle (1980) J. Schechter and J. W. F. Valle, Phys. Rev. D 22, 2227 (1980).
- Magg and Wetterich (1980) M. Magg and C. Wetterich, Phys. Lett. 94B, 61 (1980).
- Lazarides et al. (1981) G. Lazarides, Q. Shafi, and C. Wetterich, Nucl. Phys. B181, 287 (1981).
- Cheng and Li (1980) T. P. Cheng and L.-F. Li, Phys. Rev. D 22, 2860 (1980).
- Georgi and Machacek (1985) H. Georgi and M. Machacek, Nucl. Phys. B262, 463 (1985).
- Chanowitz and Golden (1985) M. S. Chanowitz and M. Golden, Phys. Lett. 165B, 105 (1985).
- Gunion et al. (1990) J. F. Gunion, R. Vega, and J. Wudka, Phys. Rev. D42, 1673 (1990).
- Aoki and Kanemura (2008) M. Aoki and S. Kanemura, Phys. Rev. D77, 095009 (2008), [Erratum: Phys. Rev.D89,no.5,059902(2014)], arXiv:0712.4053 [hep-ph] .
- Chiang and Yagyu (2013) C.-W. Chiang and K. Yagyu, JHEP 01, 026 (2013), arXiv:1211.2658 [hep-ph] .
- Hartling et al. (2014) K. Hartling, K. Kumar, and H. E. Logan, Phys. Rev. D90, 015007 (2014), arXiv:1404.2640 [hep-ph] .
- Hartling et al. (2015) K. Hartling, K. Kumar, and H. E. Logan, Phys. Rev. D91, 015013 (2015), arXiv:1410.5538 [hep-ph] .
- Chiang et al. (2014) C.-W. Chiang, S. Kanemura, and K. Yagyu, Phys. Rev. D90, 115025 (2014), arXiv:1407.5053 [hep-ph] .
- Blasi et al. (2017) S. Blasi, S. De Curtis, and K. Yagyu, Phys. Rev. D96, 015001 (2017), arXiv:1704.08512 [hep-ph] .
- Logan and Rentala (2015) H. E. Logan and V. Rentala, Phys. Rev. D92, 075011 (2015), arXiv:1502.01275 [hep-ph] .
- Keeshan et al. (2020) B. Keeshan, H. E. Logan, and T. Pilkington, Phys. Rev. D102, 015001 (2020), arXiv:1807.11511 [hep-ph] .
- Ghosh et al. (2020) N. Ghosh, S. Ghosh, and I. Saha, Phys. Rev. D101, 015029 (2020), arXiv:1908.00396 [hep-ph] .
- Banerjee et al. (2019) A. Banerjee, G. Bhattacharyya, and N. Kumar, Phys. Rev. D99, 035028 (2019), arXiv:1901.01725 [hep-ph] .
- Azevedo et al. (2021) D. Azevedo, P. Ferreira, H. E. Logan, and R. Santos, JHEP 03, 221 (2021), arXiv:2012.07758 [hep-ph] .
- Moultaka and Peyranère (2020) G. Moultaka and M. C. Peyranère, (2020), arXiv:2012.13947 [hep-ph] .
- Ismail et al. (2021) A. Ismail, B. Keeshan, H. E. Logan, and Y. Wu, Phys. Rev. D103, 095010 (2021), arXiv:2003.05536 [hep-ph] .
- Zhou et al. (2019) R. Zhou, W. Cheng, X. Deng, L. Bian, and Y. Wu, JHEP 01, 216 (2019), arXiv:1812.06217 [hep-ph] .
- Sun et al. (2017) H. Sun, X. Luo, W. Wei, and T. Liu, Phys. Rev. D96, 095003 (2017), arXiv:1710.06284 [hep-ph] .
- Degrande et al. (2017) C. Degrande, K. Hartling, and H. E. Logan, Phys. Rev. D96, 075013 (2017), [Erratum: Phys. Rev.D98,no.1,019901(2018)], arXiv:1708.08753 [hep-ph] .
- Chang et al. (2017) J. Chang, C.-R. Chen, and C.-W. Chiang, JHEP 03, 137 (2017), arXiv:1701.06291 [hep-ph] .
- Aaboud et al. (2018a) M. Aaboud et al. (ATLAS), JHEP 11, 085 (2018a), arXiv:1808.03599 [hep-ex] .
- Aad et al. (2016) G. Aad et al. (ATLAS), JHEP 03, 127 (2016), arXiv:1512.03704 [hep-ex] .
- Khachatryan et al. (2015a) V. Khachatryan et al. (CMS), JHEP 11, 018 (2015a), arXiv:1508.07774 [hep-ex] .
- Aaboud et al. (2018b) M. Aaboud et al. (ATLAS), JHEP 09, 139 (2018b), arXiv:1807.07915 [hep-ex] .
- Aad et al. (2015a) G. Aad et al. (ATLAS), JHEP 03, 088 (2015a), arXiv:1412.6663 [hep-ex] .
- Sirunyan et al. (2018) A. M. Sirunyan et al. (CMS), JHEP 11, 115 (2018), arXiv:1808.06575 [hep-ex] .
- Khachatryan et al. (2015b) V. Khachatryan et al. (CMS), JHEP 12, 178 (2015b), arXiv:1510.04252 [hep-ex] .
- Patrick et al. (2018) R. Patrick, P. Sharma, and A. G. Williams, Phys. Lett. B780, 603 (2018), arXiv:1710.08086 [hep-ph] .
- Patrick et al. (2017) R. Patrick, P. Sharma, and A. G. Williams, Nucl. Phys. B917, 19 (2017), arXiv:1610.05917 [hep-ph] .
- Li et al. (2016) J. Li, R. Patrick, P. Sharma, and A. G. Williams, JHEP 11, 164 (2016), arXiv:1609.02645 [hep-ph] .
- Moretti et al. (2016) S. Moretti, R. Santos, and P. Sharma, Phys. Lett. B760, 697 (2016), arXiv:1604.04965 [hep-ph] .
- Coleppa et al. (2014) B. Coleppa, F. Kling, and S. Su, JHEP 12, 148 (2014), arXiv:1408.4119 [hep-ph] .
- Coleppa et al. (2020) B. Coleppa, A. Sarkar, and S. K. Rai, Phys. Rev. D101, 055030 (2020), arXiv:1909.11992 [hep-ph] .
- Sirunyan et al. (2017) A. M. Sirunyan et al. (CMS), Phys. Rev. Lett. 119, 141802 (2017), arXiv:1705.02942 [hep-ex] .
- Aad et al. (2015b) G. Aad et al. (ATLAS), Phys. Rev. Lett. 114, 231801 (2015b), arXiv:1503.04233 [hep-ex] .
- Bandyopadhyay et al. (2015a) P. Bandyopadhyay, K. Huitu, and A. Sabanci Keceli, JHEP 05, 026 (2015a), arXiv:1412.7359 [hep-ph] .
- Bandyopadhyay et al. (2015b) P. Bandyopadhyay, C. Coriano, and A. Costantini, JHEP 09, 045 (2015b), arXiv:1506.03634 [hep-ph] .
- Bandyopadhyay et al. (2016) P. Bandyopadhyay, C. Corianò, and A. Costantini, Phys. Rev. D94, 055030 (2016), arXiv:1512.08651 [hep-ph] .
- Bandyopadhyay and Costantini (2018) P. Bandyopadhyay and A. Costantini, JHEP 01, 067 (2018), arXiv:1710.03110 [hep-ph] .
- Akeroyd et al. (2017) A. G. Akeroyd et al., Eur. Phys. J. C77, 276 (2017), arXiv:1607.01320 [hep-ph] .
- Azzi et al. (2019) P. Azzi et al., CERN Yellow Rep. Monogr. 7, 1 (2019), arXiv:1902.04070 [hep-ph] .
- Barger et al. (1990) V. D. Barger, J. L. Hewett, and R. J. N. Phillips, Phys. Rev. D41, 3421 (1990).
- Cen et al. (2019) J.-Y. Cen, J.-H. Chen, X.-G. He, G. Li, J.-Y. Su, and W. Wang, JHEP 01, 148 (2019), arXiv:1811.00910 [hep-ph] .
- Diaz-Cruz et al. (2001) J. Diaz-Cruz, J. Hernandez-Sanchez, and J. Toscano, Phys. Lett. B 512, 339 (2001), arXiv:hep-ph/0106001 .
- Moretti et al. (2015) S. Moretti, D. Rojas, and K. Yagyu, JHEP 08, 116 (2015), arXiv:1504.06432 [hep-ph] .
- Chakrabarty et al. (2020) N. Chakrabarty, I. Chakraborty, and D. K. Ghosh, Eur. Phys. J. C80, 1120 (2020), arXiv:2003.01105 [hep-ph] .
- Chowdhury and Eberhardt (2018) D. Chowdhury and O. Eberhardt, JHEP 05, 161 (2018), arXiv:1711.02095 [hep-ph] .
- Tanabashi et al. (2018) M. Tanabashi et al. (Particle Data Group), Phys. Rev. D 98, 030001 (2018).
- Chiang et al. (2019) C.-W. Chiang, G. Cottin, and O. Eberhardt, Phys. Rev. D99, 015001 (2019), arXiv:1807.10660 [hep-ph] .
- Roe et al. (2005) B. P. Roe, H.-J. Yang, J. Zhu, Y. Liu, I. Stancu, and G. McGregor, Nucl. Instrum. Meth. A543, 577 (2005), arXiv:physics/0408124 [physics] .
- ATLAS-CONF-2020-039 (2020) ATLAS-CONF-2020-039 (ATLAS), (2020).
- Alwall et al. (2014) J. Alwall, R. Frederix, S. Frixione, V. Hirschi, F. Maltoni, O. Mattelaer, H. S. Shao, T. Stelzer, P. Torrielli, and M. Zaro, JHEP 07, 079 (2014), arXiv:1405.0301 [hep-ph] .
- Sjöstrand et al. (2015) T. Sjöstrand, S. Ask, J. R. Christiansen, R. Corke, N. Desai, P. Ilten, S. Mrenna, S. Prestel, C. O. Rasmussen, and P. Z. Skands, Comput. Phys. Commun. 191, 159 (2015), arXiv:1410.3012 [hep-ph] .
- de Favereau et al. (2014) J. de Favereau, C. Delaere, P. Demin, A. Giammanco, V. Lemaître, A. Mertens, and M. Selvaggi (DELPHES 3), JHEP 02, 057 (2014), arXiv:1307.6346 [hep-ex] .
- Hoecker et al. (2007) A. Hoecker, P. Speckmayer, J. Stelzer, J. Therhaag, E. von Toerne, H. Voss, M. Backes, T. Carli, O. Cohen, A. Christov, D. Dannheim, K. Danielowski, S. Henrot-Versille, M. Jachowski, K. Kraszewski, A. Krasznahorkay, Jr., M. Kruk, Y. Mahalalel, R. Ospanov, X. Prudent, A. Robert, D. Schouten, F. Tegenfeldt, A. Voigt, K. Voss, M. Wolter, and A. Zemla, ArXiv Physics e-prints (2007), physics/0703039 .
- Cowan et al. (2011) G. Cowan, K. Cranmer, E. Gross, and O. Vitells, Eur. Phys. J. C 71, 1554 (2011), [Erratum: Eur.Phys.J.C 73, 2501 (2013)], arXiv:1007.1727 [physics.data-an] .
- Tovey (2008) D. R. Tovey, JHEP 04, 034 (2008), arXiv:0802.2879 [hep-ph] .
- (72) https://twiki.cern.ch/twiki/bin/view/LHCPhysics/LHCHXSWG1HELHCXsecs.
- Lazopoulos et al. (2008) A. Lazopoulos, T. McElmurry, K. Melnikov, and F. Petriello, Phys. Lett. B666, 62 (2008), arXiv:0804.2220 [hep-ph] .
- Cen et al. (2018) J.-Y. Cen, J.-H. Chen, X.-G. He, and J.-Y. Su, Int. J. Mod. Phys. A 33, 1850152 (2018), arXiv:1803.05254 [hep-ph] .