It's All in the Name: A Character Based Approach To Infer Religion
Abstract
Demographic inference from text has received a surge of attention in the field of natural language processing in the last decade. In this paper, we use personal names to infer religion in South Asia—where religion is a salient social division, and yet, disaggregated data on it remains scarce. Existing work predicts religion using dictionary based method, and therefore, can not classify unseen names. We use character based models which learn character patterns and, therefore, can classify unseen names as well with high accuracy. These models are also much faster and can easily be scaled to large data sets. We improve our classifier by combining the name of an individual with that of their parent/spouse and achieve remarkably high accuracy. Finally, we trace the classification decisions of a convolutional neural network model using layer-wise relevance propagation which can explain the predictions of complex non-linear classifiers and circumvent their purported black box nature. We show how character patterns learned by the classifier are rooted in the linguistic origins of names.
1 Introduction
Religion is an important marker of identity and is vital in shaping preferences, behavior and economic development outcomes. In India, Hindus are the religious majority comprising 79.8% of the total population (Census, 2011). Muslims, constituting 14.23% are the largest minority. Others include Christians (2.30%), Sikhs (1.72%), Buddhists (0.70%) and Jains (0.37%). Hindus and Muslims have often engaged in violent conflict (varshney2004dataset). Therefore, the distinction between these two is especially salient. Despite its social and economic relevance, there is a lack of fine-grained data on religion. While such data is collected at the individual level in the Indian Census, it is publicly released as an aggregate only upto the tehsil (sub-district) level. This limits studies on religious demography to only coarse or small scale analyses. This is in contrast to developed countries such as the United States where microdata on race is readily available and has informed studies on racial discrimination as well as residential segregation (cutler1999rise).
In this paper, we use personal names to predict religion using character based models. Names are often associated with ethnic identity. bertrand2004emily demonstrate this for the U.S., where they show evidence of racial discrimination in the labor market by sending fictitious resumes which are randomly assigned African-American or White-sounding names. In South Asia, personal names are especially well known to signify religious identity. gaikwad2017majority assign distinctive Hindu or Muslim sounding names to fictitious internal migrants to elicit attitudes of natives towards them in a face to face survey in Mumbai and show that people indeed associate names with religion.
Name lists are often publicly available at high geographic resolutions. Sources such as electoral rolls, below poverty line (BPL) lists, land records, and beneficiary lists of social security programs such as job cards for Mahatma Gandhi National Rural Employment Guarantee Act (MNREGA), Swachh Bharat Mission (SBM) etc. provide multiple related names for millions of households but do not disclose religion. Our work can be used to compile detailed statistics on religion and uncover evidence of discrimination in the allocation of targeted welfare programs. Similarly, compiling religion from names on social media platforms such as Twitter, which lack demographic attributes, can guide network and sentiment analysis of users across religious groups. In an applied work, chaturvedi2020importance use one of our models to find the religion of all the households (over 25 million) in rural Uttar Pradesh, India. They study how gender quotas in local elections interact with preferences of religious groups to affect provision of public goods.
1.1 Linguistic Origins of South Asian Names
We also shine light on the distinct orthography of Muslim and non-Muslim names in South Asia. Understanding the differences in linguistic patterns in names belonging to these two classes is particularly interesting from an NLP standpoint as they differ phonologically owing to their linguistic roots. While Classical Arabic is the liturgical language of Islam, Sanskrit is the principal liturgical language of Hinduism. Buddhism, Sikhism and Jainism also have Sanskrit or languages closely related to Sanskrit such as Pali, Punjabi and Magadhi Prakrit as their liturgical languages. Moreover, people who adopt Christianity in India through religious conversions often retain their original names. In line with this, Islamic names in South Asia are derived mostly from Classical Arabic as well as from Persian and Turkish (schimmel1997islamic). non-Muslim names, on the other hand, are rooted in Sanskrit or Dravidian languages emeneau1978towards. These differences manifest in character patterns across names.
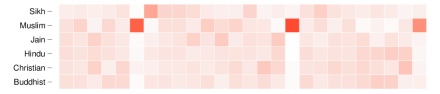
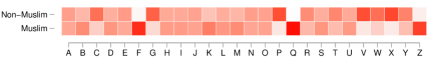
Figure 1 shows raw relative character frequency distributions in our data set. This is obtained for each alphabet A–Z by dividing the average frequency of occurrence of each character by average name length for each religion. We find that Muslim names have a relative abundance of `F', `Q' and `Z' as the phonemes [f], [q] and [z] corresponding to these alphabets are not part of the Sanskrit phonemic inventory. On the other hand, the characters `P', `V' and `X' are rare among Muslim names owing to the absence of the phonemes [p], [] and [] in Classical Arabic. Hindu, Sikh, Jain and Buddhist names have similar distributions owing to their common linguistic origins.
We systematically uncover prominent linguistic patterns by applying layer-wise relevance propagation (LRP) technique proposed by bach2015pixel. LRP overcomes the black box nature of complex non-linear machine learning models by estimating the extent to which each input contributes towards a particular classification decision. We discuss this in more detail in Section LABEL:sec:lrp.
1.2 Related Literature
We contribute to a growing literature in NLP which focuses on demographic inference from names. Early papers in this literature almost exclusively use dictionary based methods to identify ethnicity (see mateos2007review for a detailed review). Others use sub-name features to classify names into nationality, gender and ethnicity using hierarchical decision trees and hidden Markov model (ambekar2009name), Bayesian inference (chang2010epluribus), multinomial logistic regression (treeratpituk2012name; torvik2016ethnea) and support vector machine (SVM) (knowles2016demographer). More recently, deep neural networks (DNN) have been used to infer nationality (lee2017name), gender and ethnicity (wood2018predicting) using names. ye2017nationality and ye2019secret learn name embeddings to predict ethnicity, gender and nationality. A vast literature on demographic inference also utilizes social media text (mislove2011understanding; burger2011discriminating; pennacchiotti2011machine; nguyen2013old; ciot2013gender; liu2013s; nguyen2014predicting; volkova2015inferring).
However, religion inference, which is at least as relevant as ethnicity inference has only received a limited attention. An exception is susewind2015s, who uses a string matching algorithm to predict religion based on a given reference list. However, being a dictionary based method, the algorithm suffers from low coverage and can not classify unseen names or names that can not be matched due to spelling variations. We show that simple bag-of-n-grams models such as logistic regression (LR) and support vector machines (SVM) combined with term frequency-inverse document frequency (TF-IDF) weights perform at least as well as complex neural models such as convolutional neural networks (CNN), and both outperform the existing work on religion classification.
Much of the applied work on religion in social sciences relies partly or wholly on manual classification of names to infer religion. In particular, sachar2006social highlight economic and social disadvantages as well as discrimination faced by Indian Muslims in getting access to credit, by manually classifying religion using personal names. Others use candidate names from the ballot to study the effect of co-religiosity on voting behaviour and Muslim political representation on education and health outcomes of constituents (bhalotra2014religion; heath2015muslim). Similarly, field2008segregation use names in electoral rolls of Ahmedabad to identify religion and study the link between residential segregation and communal violence between Hindus and Muslims during the 2002 Gujarat riots. However, manual classification of names is not feasible for large data sets. Therefore, we hope that our work can contribute towards a richer understanding of economic conditions of various religious groups, discrimination, residential segregation, conflict and the political economy of religion.
REDS Rural U.P. Observations 115,180 20,000 # Unique names 98,853 12,348 # Unique characters 27 27 Average name length 15.57 8.82 Longest name length 40 29 % Buddhist 0.30 – % Christian 2.46 – % Hindu 84.47 – % Jain 0.42 – % Sikh 3.22 – % Muslim 9.13 13.31 % Non-Muslim 90.87 86.69
2 Data
2.1 Data Sources
REDS
We use Rural Economic & Demographic Survey (REDS) data collected by the National Council of Applied Economic Research to train our models. The data set is proprietary and not publicly accessible. It constitutes a nationally representative sample of rural households from 17 major Indian states. We use information on the respondent's name, their parent/spouse's name and self-reported religion from more than 115,000 households from a sample of villages surveyed in 2006. We split the REDS data set into three parts—training, validation and test set in the ratio 70:15:15.
U.P. Rural Households
One possible concern with self-reported religion in the REDS data set could be that some people might not accurately reveal their religion, for example, due to fear of persecution. This might be a source of noise in our data, and we expect that our models would have been even more accurate if there was no misreporting. Keeping this concern in mind and the fact that REDS data contains sensitive information that can not be shared publicly, we use a second test set to further validate our models. Due to lack of public availability of data sets containing a mapping of names to religion, the authors of this paper annotate the religion of 20,000 randomly selected household heads from a data set comprising over 25 million households in rural Uttar Pradesh (U.P.)—the largest state of India.111We share the annotated data publicly. These names are in public domain and scraped from https://sbm.gov.in. Note that Hindus (comprising 83.66%) and Muslims (comprising 15.55%) are the predominant religious groups in rural U.P. and form over 99.2% of the population. Therefore, the annotators classify the religion as either Non-Muslim (largely comprising Hindus) or Muslim for this data set. The annotations are done independently by the two annotators using the names of household heads as well as the names of their parent/spouse. As discussed earlier, manually annotating religion is in line with the existing literature in the field. The inter-annotator agreement rate is 99.91% and Kohen's Kappa is 0.9959 indicating that names strongly reflect religious identity for this sample. The small number of disagreements were resolved on a case-by-case basis in consultation with a Professor of Sanskrit language. Table 1 shows descriptive statistics for both data sets. The religious composition in our sample closely matches the respective rural population shares for all religious groups.
2.2 Pre-processing
We pre-process the data by removing special characters, numbers and extra spaces and retain only alphabetic characters. We then convert all the names to upper case. We enclose each part of name using special start of word and end of word characters. For combining person names with those of their relative, we use special separator character. Each religion is treated as a distinct class.
3 Models
We make predictions using single names as well as two names (i.e., primary name and parent/spouse name) in each household. For single name models, we also include the father/spouse's name as a primary name to enrich our training set as it is highly likely that they share the same religion. Since REDS is a nationally representative survey, we do not remove duplicate names to take into account the frequency with which a name occurs within a religion.
3.1 Baseline: Name2community
We use a dictionary based classification algorithm name2community proposed by susewind2015s as the baseline. It first extracts each name part (i.e. the first name, last name etc.) and counts their frequency in each religious class in a given reference list using spelling (S) and pronunciation (P) matches based on the fuzzy Indic Soundex algorithm. The algorithm then computes a certainty index I for each name part X for each community Y using the formula given below and multiplies it by ``quality factors'' based on spelling and pronunciation and defined as the percentage of unambiguous name parts in the reference list:
These indices are then aggregated over all name parts to get the certainty index for the entire name N belonging to a certain community as follows:
Where refers to the total number of matches of a given name part in the reference list. Finally, each name is assigned the religion with the highest certainty index.222The implementation of the algorithm is available at https://github.com/raphael-susewind/name2community.
3.2 Bag-of-n-grams Models
We convert each name (or document) to its n-gram feature representation using term frequency-inverse document frequency (TF-IDF). In our case this improves performance over the feature construction procedure described in knowles2016demographer who separately extract handcrafted features for a name.333These include up to four character long prefix and suffix, the entire name, and categorical variables representing whether a particular name begins or ends with a vowel. TF-IDF captures the importance of each character n-gram (or token) in a document normalized by its importance in the entire corpus without taking into account its relative position in the document. For each token t and document d, the TF-IDF score is calculated as follows:
is the number of occurrences of token in document ; is length of document ; is the number of documents containing token ; and is the count of documents in the corpus.444The TF-IDF vectors for each document are further normalized to have Euclidean norm 1.
We use linear SVM and Logistic Regression (LR) classifiers vectors with l2 regularization. Since the classes are highly imbalanced, we use balanced class weights.
3.3 Convolutional Neural Network
Well known for their ability to extract local feature correlations using far fewer parameters and highly parallelizable architectures, convolutional neural networks (CNN) (lecun1990handwritten) have found much appeal in NLP tasks (collobert2008unified). zhang2015character make use of the CNN architecture using character level input data.
In our implementation, we first apply zero padding on names so that all the names have equal length which is the maximum name length in our data after adding the special characters. Thereafter, each character is converted to a 29 or 30 dimensional embedding vector. We use a single CNN layer with max pooling over time. We use kernel sizes ranging from 1–7, with 50–305 filters. We get best results with tanh or ELU activation in CNN layer. The name representation so obtained is finally passed through a fully connected layer with sigmoid activation. This gives us the probabilities of names belonging to each class. The model is trained to minimize binary cross-entropy loss with balanced class weights. We implement the model using Keras deep learning framework (chollet2015keras). The Kernel weights are randomly initialized using He uniform or Glorot Uniform distributions (he2015delving). To prevent overfitting, we use dropout rates of 0.01–0.02 on embedding layer and 0.2 after the CNN layer (hinton2012improving). We use Nadam optimizer (dozat2016incorporating) and reduce learning rate by a factor of 0.5 if our validation loss does not improve for 2 or 3 epochs. We train the models for 80 epochs using mini-batch size of 512 and save the model with the least validation loss. Table LABEL:hyperparameters and LABEL:hyperparameterrange, Appendix LABEL:sec:appendix list the hyperparameters and the range over which we conduct the hyperparameter search.
We find that the use of more complex architectures such as stacked CNN or dilated CNN to learn skip-gram features did not result in any improvement for our task. We also find that Long short-term memory (hochreiter1997long) and CNN-LSTM (kim2016character) models don't result in further improvement.