Blazar OJ 287 After First VHE Activity: Tracking the Re-emergence of the HBL like Component in 2020
Abstract
We report the re-emergence of a new broadband emission through a detailed and systematic study of the multi-wavelength spectral and temporal behavior of OJ 287 after its first-ever reported VHE activity in 2017 to date, which includes the second-highest X-ray flux of the source. The source shows high optical to X-ray flux variations, accompanied mainly by strong spectral changes. The optical to X-ray flux variations are correlated and simultaneous except for two durations when they are anti-correlated. The flux variations, however, are anti-correlated with the X-ray spectral state while correlated with optical-UV (ultraviolet). Weekly binned Fermi-LAT data around the duration of the highest X-ray activity show a few detections with a log-parabola model but none with a power-law; yet the extracted LAT spectral energy distribution (SED) of the high activity duration for both the models is similar and show a hardening above 1 GeV. Further, near-infrared (NIR) data indicate strong spectral change, resembling a thermal component. Overall, the combined optical to gamma-ray broadband spectrum establishes the observed variations to a new high-energy-peaked (HBL) broadband emission component, similar to the one seen during the highest reported X-ray flux state of the source in 2017. The observed activities indicate some peculiar features that seem to be characteristic of this emission component while its appearance, a few years around the claimed -year optical outbursts strongly indicate a connection between the two.
1 Introduction
Blazars are the most prominent and persistent non-thermal emitters with a continuum powered by a relativistic jet roughly aligned with our line of sight. The continuum shows variations on all accessible timescales and spread across the entire accessible electromagnetic (EM) spectrum. Detailed multi-wavelength (MW) studies, especially since the launch of the Fermi observatory, have revealed that the variability is pervasive – seen in all: flux, spectra, and polarization with time with changes in one often accompanied by changes in others. These studies have also firmly established or confirmed many phenomenological features e.g. the variations are stochastic (e.g. Sobolewska et al., 2014), the broadband emission show a characteristic bi-modal spectral energy distribution (SED) with one peak in-between infra-red to UV/X-ray energies and the other at MeV/GeV energies (e.g. Abdo et al., 2010). Interestingly, despite being extreme among the accretion-powered sources and a jet-originated continuum, in terms of temporal flux variability, their long-term variations broadly exhibits the statistical behavior shown by accretion-powered sources (e.g. Scaringi et al., 2015; Kushwaha et al., 2016, 2017, and references therein).
The most unique and characteristic observational feature of blazars’ highly variable broadband emission is the broad bi-modal SED extending from the lowest accessible EM band i.e. the radio to the highest accessible i.e. GeV-TeV -rays. The broadband SED of all blazars can be clubbed into three different spectral sub-classes: low-energy-peaked (LBL/LSP), intermediate-energy-peaked (IBL/ISP), and high-energy-peaked (HBL/HSP; Fossati et al., 1998; Abdo et al., 2010) based on the location of the low-energy hump. A remarkable property of each spectral sub-class is the stability of the location of the two peaks despite huge variations in flux and often spectral shape. Only in a few rare instances, an appreciable shift in the location of the peaks has been observed e.g. the 1997 outburst of Mrk 501 (Pian et al., 1998; Ahnen et al., 2018) and the end-2015 to the mid-2017 activity of OJ 287 (Kushwaha et al., 2018b, c). Even these two cases are remarkably different. In the case of Mrk 501, the location of both the peak shifted to higher energies. On the contrary, in OJ 287, a shift in the location of only the high-energy peak was observed during the 2015 – 2016 activity (Kushwaha et al., 2018b, a) while in the 2016 – 2017, a new broadband emission component overwhelmed the overall emission, appearing as an overall shift in both the peaks as revealed in the detailed study by Kushwaha et al. (2018c). The SED being the prime observable for exploration of the yet debated high-energy emission mechanisms, such changes offer invaluable insights about the emission processes. For example, in the Mrk 501, the shift in both peaks strongly imply the same particle distribution for the overall emission while for OJ 287, the shift of only the high-energy peak can be reproduced either by inverse Compton scattering of the broad-line region photon field (Kushwaha et al., 2018b) or emission of hadronic origin (Oikonomou et al., 2019; Rodríguez-Ramírez et al., 2020).
In terms of spectral variations and spectral state, OJ 287 is the most dynamic blazar known so far (Isobe et al., 2001; Siejkowski & Wierzcholska, 2017; Komossa et al., 2017; Kushwaha et al., 2018c, b; Pal et al., 2020; Kushwaha, 2020; Komossa et al., 2020, and references therein). Contrary to a few of the blazars that have shown a very different SED compared to the SED considered normal of them and is the basis of their spectral classification in the blazar spectral sequence once or twice (e.g. Mrk 501; Pian et al., 1998; Ahnen et al., 2018), OJ 287 is been in a different broadband SED states since its 2015 activity to date (Kushwaha et al., 2018b, c, 2013). It belongs to the BL Lacertae subclass of blazars – the blazar subclass characterized by a lack of strong or completely absent emission line features in their optical spectrum. Located at a redshift of (Sitko & Junkkarinen, 1985; Nilsson et al., 2010), it is one of the most bright and dynamic sources at optical and radio energies. In addition to exhibiting typical stochastic variability of blazars (e.g. Goyal et al., 2018), it is the blazar with the highest number of claims of QPO (e.g. Visvanathan & Elliot, 1973; Valtaoja et al., 1985; Sillanpaa et al., 1988; Pihajoki et al., 2013a; Bhatta et al., 2016; Dey et al., 2018; Kushwaha et al., 2020) with some persistent ones, notably a recurring -yr optical outbursts (QPOs; Sillanpaa et al., 1988; Dey et al., 2018, and references therein), a probable -yr periodicity structure in the motion of bright radio knots and an yearly modulation in the location of quasi-stationary knots (Britzen et al., 2018) as well as a -yr periodic feature (Cohen, 2017), that have made it an excellent source to explore various aspects of active galactic nuclei physics (e.g. Agudo et al., 2011; Sasada et al., 2018; Dey et al., 2018; Britzen et al., 2018; Kushwaha, 2020, and references therein).
As per broadband SED, OJ 287 is a low-frequency-peaked/low-synchrotron-peaked (LBL/LSP) blazar with a low-energy peak around near-infrared (NIR) energies and the high-energy peak around 100 MeVs (Abdo et al., 2010; Kushwaha et al., 2013). However, since the start of a dynamic MW activity in mid-November 2015, studies have reported drastic spectral variations in optical to MeV-GeV bands and very different and distinct broadband spectral phases (Komossa et al., 2017; Kushwaha et al., 2018b, c; Kapanadze et al., 2018; Kushwaha, 2020; Komossa et al., 2020) compared to its well-known LBL SED. The associated temporal flux variations were also different with lags and leads compared to generally seen simultaneous MW variations. The overall temporal and spectral activity during this duration can be categorized into two episodes. While the first activity episode from mid-November 2015 to May 2016 was temporally similar to its typical reported behavior – showing simultaneous MW variability, the broadband spectrum was very different; with two new changes – a break in the NIR-optical spectrum from its well-known (smooth) power-law form and a shift in the location of the high-energy peak to higher energies (Kushwaha et al., 2018b). The NIR-optical break was found to be consistent with a standard accretion-disk emission of a black hole while the shift in high-energy peak can be explained by inverse Compton scattering of broad line photons (Kushwaha et al., 2018b). The explanation of NIR-optical break being a standard accretion-disk emission, if true, has direct implications to another ongoing debate about the central engine of the source invoked to explain the recurrent -yr optical outbursts. Both, the mass of the central SMBH inferred from the NIR-optical explanation and the temporal coincidence of its appearance currently favor the binary disk-impact model (Kushwaha, 2020, and references therein).
The second MW activity immediately followed the first phase in mid-2016 and continued till mid-2017 (Komossa et al., 2017; Kushwaha et al., 2018c; Komossa et al., 2020). Contrary to the activity in the first phase, it was unique spectrally and temporally. While the source reached the strongest yet reported optical to X-ray emission (Grupe et al., 2017), it was rather steady with a low level of emission despite detection on daily timescale in the LAT energy band (Kushwaha et al., 2018c). A detailed study by Kushwaha et al. (2018c) revealed that at the beginning of the activity, optical was leading X-ray while the variations were simultaneous in-between and finally ended with X-ray leading the optical. Tracking of spectro-temporal evolution further revealed that the observed variability was driven by a new high-energy-peaked emission component, corroborated also by the first-ever detection of the source at very high energies (VHEs, E GeVs; Brien & VERITAS Collaboration, 2017).
In 2020 also, the source again exhibited a very high optical to X-ray activity and achieved the second brightest reported X-ray flux (Komossa et al., 2020, 2020). The optical to X-ray flux evolution show strong changes driven by a very soft X-ray spectral state (Komossa et al., 2020), similar to the one seen during the 2017 high optical to X-ray activity. The continued follow-up of the 2020 activity revelaed, for the first time, a signature of iron absorption in the XMM-Newton data, though it was absent in the NuSTAR data taken 10 days after the XMM-Newton observation.
Here, we present a detailed exploration of spectro-temporal evolution and spectral changes from optical to LAT gamma-ray energies between May 27, 2017 to June 10, 2020 (MJD: 57900 – 59010) and compare the behaviors with the 2017 activity that was also driven by the soft X-ray spectrum. The period covered here corresponds to the end-phase of the first VHE activity and the highest recorded X-ray flux state to the end of the second highest reported X-ray flux. This allows a continuous access to the flux and spectral behavior of the source and in turn, to the evolutionary track of the new broadband emission component that was responsible for the 2017 activity and its revival, resulting in the 2020 activity. The work is presented in five sections with the next section describing the data sources and reduction procedures. In section §3, we explore the spectral and temporal behavior with a comparative discussion in §4. Finally we summarize and conclude in §5.
2 MW Data Reduction
The MW data used in this work are taken from the public archives of different observatories. The optical to X-ray data is mainly taken from the Swift observatory and a study focusing on optical to X-ray flux and X-ray spectral variations is already presented in Komossa et al. (2020) (a part of long-term monitoring program of OJ 287; Komossa et al., 2017). Our focus is on optical to X-ray spectro-temporal evolution and broadband spectral changes and thus, we reanalyzed the Swift data and supplemented these with the -ray data from the Fermi-LAT (Large Area Telescope) during the high optical to X-ray flux state. In addition, we also attempted observations at optical from ARIES and NIR from Mount Abu Infrared Observatory (MIRO) at Mt Abu, Rajasthan, India (Banerjee & Ashok, 2012) after the report of increased activity at optical energies (Hosokawa et al., 2020) following the X-ray peak. However, due to adverse observing conditions, we could only observe the source at NIR from MIRO.
Swift-UVOT: We used the level-2 sky images of all the Swift-UVOT (Ultra-Violet Optical Telescope; Roming et al., 2005) filters (V, B, U, UVW1, UVM2, UVW2) to extract the magnitude/flux density. For this, we used the uvotsource task available within HEASOFT package (version 6.28) with a source region of 5 and an annular region for the background (free of any source) with an inner and outer radius of 10 and 20, respectively. Observations in which the source location was on bad pixels were discarded. We used the updated callibration file that also account for the loss of sensitivity of the UV detector with time111https://www.swift.ac.uk/analysis/uvot/index.php. Finally, the extracted flux densities were corrected for interstellar reddening using an E(B-V) = 0.0241 (Schlafly & Finkbeiner, 2011).
Swift-XRT: We only used the pointing mode data taken in the photon counting (PC) and window timing (WT) mode by the Niel Gherel Swift Observatory (Burrows et al., 2005) and followed the standard recommended data reduction procedures. Firstly, each observation was reprocessed using the standard default filtering criterion and latest calibration files (updated on 20200504) with the xrtpipeline (version 0.13.5) task. Then for each observation, we generated a source spectrum from a circular region of 47 and a background spectrum from an annular region with inner and outer radius of 80 and 176 using the xselect task. We also checked for pile-up in the PC222None of the WT mode data has source region count rate counts/s when pile-up is expected mode data whenever the source count rate exceeded 0.5 counts/s and corrected following the recommended procedure333http://www.swift.ac.uk/analysis/xrt/pileup.php by discarding the central 2-4 pixels. The corresponding ancillary response files were generated through the xrtmkarf task. Finally, we binned the source spectrum files with a minimum count of one per bin using the grppha tool for spectral fitting.
We performed the spectral fitting in XSPEC (version 12.11.1) employing Cash statistic following the approach adopted in Kushwaha et al. (2018c). We used both power-law (PL: ) and log-parabola model (LP: ) and the best-fit model was chosen based on the F-test probability. The LP model was selected as the best-fit model if the F-test probability was . In the fitting process, all the parameters were free to vary initially. The hydrogen column density () value was fixed to the Galactic value of cm-2 (HI4PI Collaboration et al., 2016) whenever the fit value was below the Galactic value or consistent with it. The best-fit model was used to estimate the unabsorbed flux in 0.3 – 10.0 keV band using the cflux task.
We verified our result using chi-squared statistics by binning the spectra with 20 counts per bin and found that both results are consistent except when the counts are low allowing only fewer bins444 While fitting with all parameters free to vary initially, in some cases, despite good exposure and photon counts (similar to other Ids), we got large errors in the derived flux values, mainly due to data quality at low energies. In such cases, we first tried a lower fit energy value of 0.5 keV instead of 0.3 keV. If this failed, we fixed the to the Galactic value and chose the lower fit range again to 0.3 keV. If all these failed, we simply fitted a PL model between 0.3 – 10 keV and derived the fluxes..
NuSTAR: NuSTAR (Harrison et al., 2013) observed OJ 287 on May 4, 2020 (MJD 58973) and we reanalyzed the data presented in Komossa et al. (2020), mainly for joint fitting with optical to X-ray data from Swift observatory (ref. 3.2.3). To reduce the observational data, we followed the standard reduction procedure by using the NuSTAR Data Analysis Software (NUSTARDAS). We used the nupipeline (version 0.4.8) task for data reduction with the latest available calibration files (CALDB no. 20200813). For generating the spectra from both the FPMA and FPMB modules, we selected a circular region of 50 keeping the source at the center, and also we used a circular region of 100 for background away from the source. We produced the spectra and corresponding response files using the nuproducts tool available within the NUSTARDAS. We grouped the spectrum with a minimum one count per bin using the grppha tool.
Fermi-LAT: We used the LAT (Atwood et al., 2009) data processed with the latest PASS-8 instrument response function (P8R3) during the high X-ray activity duration of the source (MJD: 58785.0-59010.0) and analyzed it following the standard analysis procedure555https://fermi.gsfc.nasa.gov/ssc/data/analysis/scitools/python_tutorial.html using the data reduction package Fermitools (version 1.0.1). For each time bin of interest, we selected the “SOURCE” class events () from a circular region of (ROI) centered on the source. Further, we restricted the energy range to within 0.1 – 300 GeV and applied the standard zenith angle cut of . Following these selections, we generated good time intervals (GTIs) using the standard expression: “(DATA_QUAL0)(LAT_CONFIG==1)”. We then generated the exposure map on the ROI and an additional annular region of around it. Finally, to extract the relevant physical quantities like photon flux, spectrum, and energy flux, we performed the likelihood fitting using the “unbinned maximum likelihood” method “gtlike” incorporated in the data reduction package with a source model XML file generated from the fourth Fermi-LAT point source catalog (4FGL; Abdollahi et al., 2020). The XML model file included the Galactic and extra-galactic contributions through the respective template files “gll_psc_v21.fits” and ”iso_P8R3_SOURCE_V2_v1.txt“ respectively.
Firstly, we performed a fit to 0.1–300 GeV of LAT data for the whole duration666we did not find any photon of E GeV. using the default source model LP for the source as in the 4FGL catalog following the iterative approach adopted in Kushwaha et al. (2014) by removing insignificant sources – measured by test Statistics (TS) 0. This best-fit XML model file was then used for the light curve and SED extraction over the relevant time bins. Though LP is the default model for the source in 4FGL, our analysis of monthly binned LAT data presented in Kushwaha et al. (2020) shows that, in general, the PL model adequately describes the source spectrum fairly well. On the other hand, studies of LAT data presented in Kushwaha et al. (2018c) and Kushwaha et al. (2018b) show that the source has shown depature from a simple PL spectrum at LAT energies, especially after its 2015 activity and during 2016–2017 high optical to X-ray activity. Since the X-ray activity during the current duration is similar to the 2016–2017 activity of the source, we used both LP and PL for the light curve and SED extraction. For gamma-ray SED, we divided the 0.1-300 GeV range into six logarithmically equi-spaced energy bins: 0.1–0.3, 0.3–1, 1–3, 3–10, 10–100, and 100-300 GeV and used both PL and LP to extract the energy flux. For both light curve and SED, only data points with TS 9, corresponding to detection were used for the scientific analysis.
MIRO: The NIR observations of OJ 287 were carried out in the and bands using the Near-infrared Camera and Spectrograph (NICS) instrument on the PRL’s 1.2m, f/13 telescope in the imaging mode on 4 June 2020 (MJD 59004). The NICS provides 1 arcsec seeing over an un-vignetted field of view of 88 arcmin2 with 10241024 pixels array configuration.
A set of five frames of the source along with field stars were taken in (1.17–1.33 m, centered at 1.25m) and (1.99–2.310 m, centered at 2.15 m) filters at five dithered positions with exposures of 40 s and 25 s, respectively. The data were reduced by using the IRAF package (Tody, 1986, 1993) as described in Naik et al. (2010). In the beginning, the sky-frame was generated using median-combine of all raw and dithered images and then subtracted from raw images to get the clean images. Aperture photometry was done using the PHOT task of IRAF. Six nearby field-stars were used as the standard stars to get the apparent magnitude of the target star OJ 287. In this process, the and -band magnitudes of OJ 287 were estimated to be 12.9110.014 and 12.3880.018, respectively. The reddening corrected magnitude was then converted to flux using the zero point flux given in Cohen et al. (2003).
The correction of observed X-ray fluxes for the galactic absorption and the de-redenning of the optical to UV fluxes leads to increment in the flux values. However, the mentioned hydrogen column density affects only the spectrum (fluxes) below 1 keV while the de-reddening of optical-UV fluxes modify the flux at most by a factor of 1.07 to 1.24. As we show in the later part of this work, these changes are negligible compared to reported flux changes at optical-UV and X-ray energies ( 10 between the minimum and the maximum) and thus, has no bearing at all on the HBL component claim and our findings.
3 MW Variations
3.1 Temporal
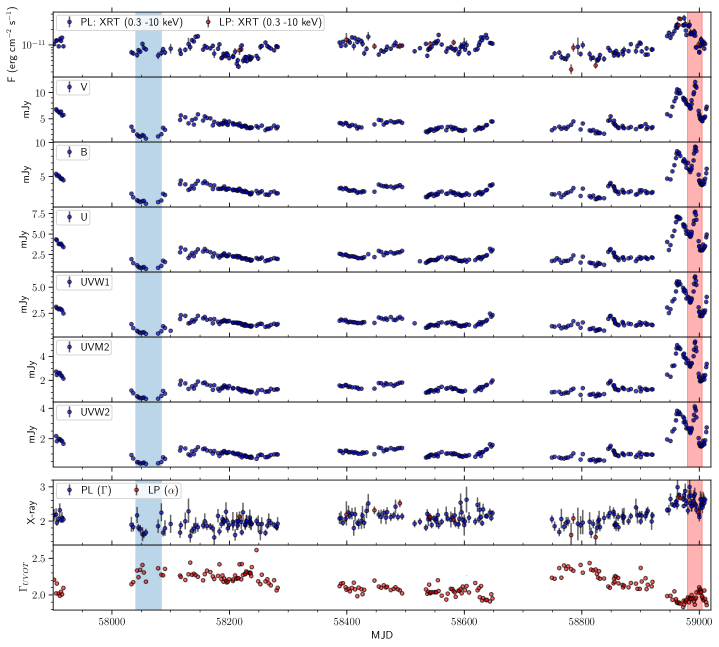
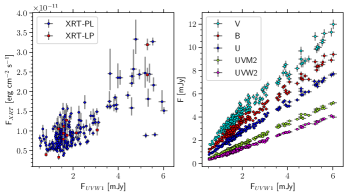
The MW optical to X-ray emission for the duration May 27, 2017 to June 10, 2020 (MJD: 57900 – 59010) is shown in Figure 1. Except for the two durations shown by shadowed regions in Figure 1, visual inspection shows that the optical to X-ray variations are simultaneous within the observational cadence. An interesting aspect is that most of the flux variations are associated with changes in the spectral index in the optical-UV777we assumed a simple PL model for optical-UV spectrum and the X-ray bands. Also, the spectral changes in optical-UV are anti-correlated with X-ray – a hardening at optical-UV is associated with a softening of X-ray spectrum and vice-versa. This is also apparent from Figure 2 with optical-UV following each other linearly while X-ray, though shows correlated flux variation, the trend is more complex than linear.
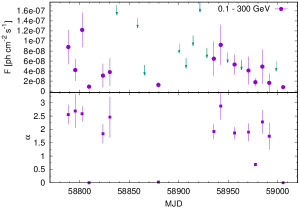
Figure 3 shows the weekly light curve from Fermi-LAT in 0.1–300 GeV band along with the spectral index of the LP model and the SEDs from both the spectral models (PL and LP). We used both PL and LP model for the light curve and SED extraction to accommodate spectral changes (ref. §2). However, the two models for OJ 287 resulted in contrary outputs. While there are a few detections (TS 9) with the LP model, the PL model resulted in none. Looking at the SED from both the model (Fig. 3 bottom panel), the non-detection with a PL model could be due to the source being weaker at LAT and the spectral changes. Further, based on LP spectral index, a clear hardening of spectral shape is apparent for the duration when the X-ray flux started rising (MJD 57875 onward) leading to the second brightest reported X-ray flux (Komossa et al., 2020).
3.2 MW SEDs
3.2.1 Fermi-LAT Spectrum
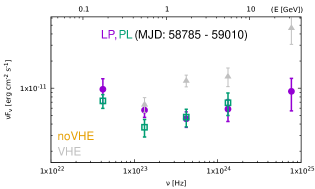
As mentioned above, the source is too weak even on a week binning of the LAT data. Thus, we used the whole duration around the high X-ray activity (MJD: 58785 – 59010) and extracted the LAT SED in six bands: 0.1–0.3, 0.3–1, 1-3, 3-10, 10-100, and 100-300 GeV. The resulting LAT SEDs for both the spectral models (PL, LP) are shown in the bottom panel of Figure 3. The SED extracted using both the models are consistent with each other and so is the observed trend in the spectrum except that with the LP model, OJ 287 is also detected in the 10–100 GeV band (the highest energy data point). There is a clear spectral hardening above GeV. Combined with the optical-X-ray spectrum (ref Fig. 4), it indicates a new broadband emission component, similar to the one seen during its highest X-ray activity duration in 2016 – 2017 (Kushwaha et al., 2018c). For comparison, the LAT spectra from the soft X-ray spectrum dominated 2016–2017 MW before and during the VHE detection from Kushwaha et al. (2018c) is also shown. It clearly shows that the source is relatively weaker at MeV-GeV energies in the current episode.
3.2.2 Optical to X-ray Spectral Evolution and MW SEDs
As noted above, the temporal flux variations seen here are often accompanied by a change in the optical to X-ray spectrum. This can be seen clearly from the optical to X-ray SED in Figure 4 where we show a collection of optical to X-ray SED, representative of spectral changes seen during this period. It also shows the best-fit spectral model for the X-ray along with the 1 region.
The most notable aspect of this strong spectral evolution is the drastic evolution shown by the high-energy-end of this broadband component responsible for the softer X-ray spectrum. This behavior is clear from focusing on the SED of duration corresponding to the shaded regions in Figure 1. Though there is a hardening of optical to UV spectrum, and often an increase in the level of emission as well, the X-ray spectrum remains similar except for a change in the level of emission e.g. SEDs of MJD 58054.3 and 58174.2 in the 1st panel of Figure 4 and SED of MJD 58994.3 and 59006.7 in the last panel. These trends and behaviors are similar to the one seen during its highest reported X-ray activity in 2016–2017 (Kushwaha et al., 2018c).
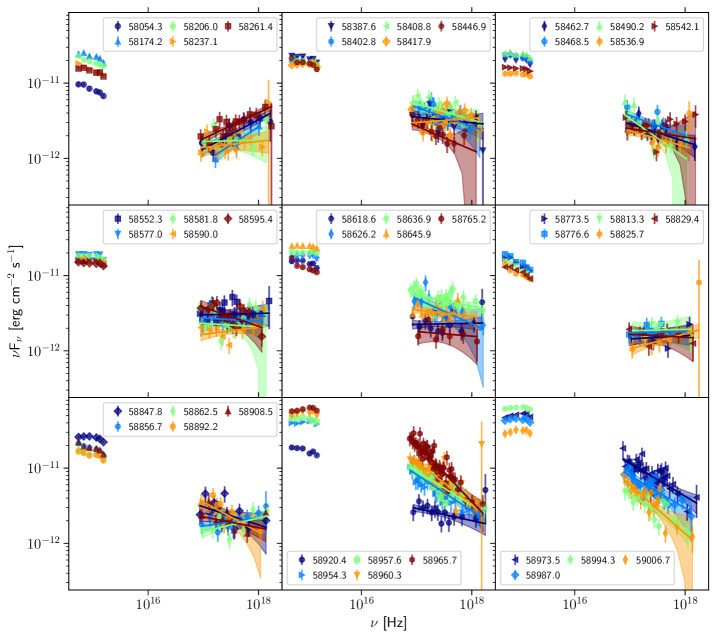
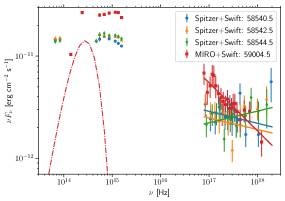
Figure 5 shows the NIR to X-ray SED on June 4, 2020 (MJD 59004.5). The NIR data indicates a strong spectral change from the well-known power-law optical to NIR spectrum of OJ 287, similar to the change observed during 2015 activity of OJ 287 (Kushwaha et al., 2018b; Kushwaha, 2020). Since the NIR-optical change reported during 2015 observation was consistent with a standard accretion-disk spectrum (Kushwaha et al., 2018b), here too we again explored this aspect. As per (Table 3; Dey et al., 2018), the 2019 impact is at 9 gravitational radius of the primary SMBH of mass , where is the mass of the Sun. Plotting the standard accretion disk spectrum of a SMBH with the outer disk radius truncated at the impact radius suggest that this sharp NIR spectrum again could be the disk emission (see also §3.2.3).
To track whether this change of NIR state was like this even before, we also used the Spitzer IR observation presented in Laine et al. (2020). Only the last measurement on September 6, 2019 (MJD 58732.7) indicates a hint of a possible change in NIR spectral state (Table 1; Laine et al., 2020). However, the lack of IR/NIR data thereafter prohibits any further conclusion whether the IR spectral change was persistent, like the way it was in 2015 outburst (Kushwaha et al., 2018b) and is present since then or transient. For the overlapping days of Swift and Spitzer’s observations, the IR to X-ray SEDs is shown in Figure 5.
3.2.3 Joint Spectral modeling
OJ 287 was also observed with NuSTAR on May 4, 2020 (MJD 58973) and the joint XMM-Newton+NuSTAR X-ray spectral fit is presented in Komossa et al. (2020). Here, we explored the joint optical to X-ray fit using the Swift and NuSTAR data in XSPEC. We first fitted a PL model to the Swift-XRT and NuSTAR data in 3-50 keV range. We then extended the lower energy range to 0.3 keV and modified the PL model for Galactic absorption via tbabs and fixed the column density to . Additionally, we added a constant function constant to cross-calibrate various instruments and fixed it to unity for the FPMA module and free for others. The fit resulted in , where dof is degree of freedom. There were no significant features in the residuals for the PL model. We found a PL photon index in the 3-50 keV. We then added XRT data down to 0.3 keV. Extending the PL fit below 3 keV showed some excess. So we first froze the above PL components and fitted this feature by an additional PL model. This fit resulted in a . The best-fit PL index was found to be . Finally, we let the frozen parameters of the PL model vary and the fit resulted in .
| Model Parameter | Model component |
|---|---|
| Intrinsic Reddening() | |
| Reddening () | |
| Statistic |
The above fit indicates two statistically different photon spectral indices ( and ), suggesting that a broken PL model could be fitted in the entire 0.3-50 keV band. We replaced the two PL models by a broken PL model (bknpl). The fit resulted in . We also used the LP model: tbabslogpar and the fit resulted in .
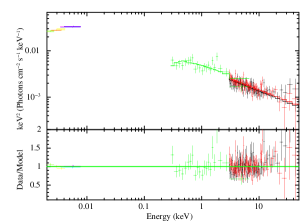
We then added the UV-optical data corresponding to the X-ray observation. Since optical-UV and X-ray have different spectral indices, we used a bknpl model for the whole optical to X-ray data. Further, for reddening correction, we added the redden model and fixed the reddening factor due to our Galaxy with (Schlafly & Finkbeiner, 2011). We also added a redshifted reddening model zredden to modify reddening intrinsic to the OJ 287. When we extrapolated the best-fit model fitted on the X-ray data down to optical data, we got large residuals. Refitting the entire optical to X-ray spectrum resulted in . An expected black body was added to check any improvement in the fit. With two free parameters, the redshifted black-body zbbody model did not improve the fit statistic. The best-fit model, data, and residuals are shown in Figure 6 and the corresponding parameters are listed in Table 1.
4 Discussion
The MW spectral and temporal study presented here covers a duration of 3 years, from June 16, 2017 (MJD 57920) to June 20, 2020 (MJD 59020). This corresponds to the duration after the end phase of the highest reported X-ray flux state of OJ 287 in 2017 (Grupe et al., 2017; Kushwaha et al., 2018c) to the end of the second-highest X-ray flux state, observed in April 2020 (Komossa et al., 2020). The coverage thus provides inhibited access to the evolution and track of the emission state of the source after the highest X-ray flux state which was due to a new broadband emission component (Kushwaha et al., 2018c), thereby, allowing a view of this elusive and rare behavior of the source (see also Komossa et al., 2020).
4.1 Flux evolution
The period considered here shows intense optical to X-ray activity, with most of the variations associated with a change in the optical-UV and X-ray spectral state of the source (ref Fig. 1 bottom plot). The optical to X-ray variations are correlated (in general) and simultaneous within the observational cadence except for two durations (shaded regions in Fig. 1) when the flux changes show a complex trend. Though the variations are anti-correlated during both the shaded periods, in the blue-shaded period (MJD: 58040 – 58085), X-ray shows a flare while optical-UV flux density is towards the minimum of the current duration. Contrary to this, in the red shaded region (MJD: 58980 – 59005), the optical-UV is at maximum while X-ray is quite close to the minimum of the considered duration. Further, the optical-UV flux-flux variations are linear (right panel Fig. 2) but not the optical/UV with X-ray except for a few.
In the -ray band at Fermi-LAT energies, the analysis around the high X-ray flux state indicates that the source is rather weak even over weekly intervals with only a few detections if we use an LP spectral profile – the default 4FGL model of the source (ref. Fig. 3 top panel). Changing the source model to PL result in no detection at all over weekly time-bins. The no detection at all in the PL model could be a combined effect of relatively low flux state of the source (e.g. Kushwaha et al., 2013, state 3 SED) and the non-PL MeV-GeV spectrum (bottom panel Fig. 3). Surprisingly, LAT detections suggest flare much before the observed second brightest X-ray flare.
The optical to X-ray flux variation trends are quite similar to the one observed during the 2016–2017 activity except for the amplitude and duration of the activity – peak X-ray flux being smaller (Komossa et al., 2020) and also a quite shorter duration of activity during the current period (Kushwaha et al., 2018c; Komossa et al., 2020). Like the 2016–2017 activity, some period of current duration also suggests lag between UV and X-rays (Kalita et al., 2020).
4.2 Spectral evolution
The spectral evolution trends are much more complex. Broadly, we can see an anti-correlation between the optical-UV and X-ray emission spectra (ref. Fig 1 bottom plot) but this is clear only for the latter half period (MJD 58500). For optical-UV, the flux is anti-correlated with the optical-UV spectrum throughout i.e. flux increase is associated with hardening of the optical-UV spectrum and vice-versa. For X-ray, on the other hand, the trend is clear only in the latter half (after MJD 58500) and is opposite of optical-UV i.e. an increase in X-ray flux is associated with a softening of the spectrum and vice-versa. This anti-correlation between optical-UV and X-ray spectrum has been reported before (Siejkowski & Wierzcholska, 2017), however, the current spectral state is very different. Looking at the optical to X-ray SED (ref. Fig. 4) evolution, one can see that the high-energy-end of the component responsible for optical-UV hardening is very dynamic and often becomes too steep – like a cutoff (ref. panels 1, 5, and 7 of Fig. 4), making a negligible contribution at X-ray energies. Hence, we see a softening and flux increment in the latter half when this high-energy-end is not that steep.
At LAT -ray energies as well, an appreciable hardening in the MeV-GeV spectra is visible (, Fig. 3) around the highest X-ray flux state. This is also visible in the MeV-GeV SED, showing a hardening over GeV, contrary to its characteristic simple PL SED (e.g. Abdo et al., 2010; Kushwaha et al., 2013). Spitzer and Swift SEDs show that the spectral shape of IR SED is consistent with the generic SED of OJ 287 where the low energy peak is around the NIR band. However, MIRO observation shows a departure from its typical smooth PL NIR to optical SED (e.g. Kushwaha, 2020), similar to the one observed during the 2015 outburst (Kushwaha et al., 2018b). Within the disk-impact binary SMBH model (Dey et al., 2018), this NIR spectrum can be reproduced fairly well by the standard accretion disk spectrum of the primary SMBH with outer disk truncated at the impact point i.e. 9 gravitational radius (Fig. 5). A thermal component (T K) is also hinted by the joint fitting of optical to X-ray data from Swift and NuSTAR with a broken power-law model (Fig. 6 and Table 1). This temperature is similar to the one found during the 2015 outburst, responsible for the break in the NIR and optical SED (Kushwaha et al., 2018b). Alternately, a thermal bremsstrahlung can also reproduce this spectral change (Rodríguez-Ramírez et al., 2020) as claimed in the disk-impact model of OJ 287 central engine (Dey et al., 2018).
The observed spectral changes reported here, from optical to X-ray as well as MeV-GeV energies, unambiguously establish the changes to a new HBL like broadband emission component, similar to the one observed during the highest reported X-ray flux and activity state of OJ 287 in 2016–2017 (Kushwaha et al., 2018c). The spectral evolution presented here shows that the HBL like emission component seen during 2016 – 2017 activity has not vanished completely as the X-ray spectrum has not reverted to the known power-law spectrum with an index of as seen during the shaded blue period (MJD 58040 – 58085, Fig. 1) when optical-UV is minimum. Following the trend presented in Kushwaha et al. (2018c) with results here show that it had continued to weaken till it has reached the hard X-ray spectrum around MJD when the UVOT measurement touched the lowest in the current episode. It remains so for about days and then this X-ray spectrum starts to become softer while optical-UV becomes harder, marking the revival of this component. After this, it remains present more or less, eventually becoming stronger, reaching the 2nd highest reported X-ray flux in end-April 2020 (MJD ; Komossa et al., 2020, and references therein).
4.3 Traditional HBL vs OJ 287 new Broadband Emission Component
Though the overall optical to MeV-GeV spectrum points to an HBL like broadband component with the synchrotron peak in UV region, the high-energy-end (after UV bands) of this component in the case of OJ 287 appears dynamically very different and uncharacteristic of traditionally known HBL blazars. The X-ray photon spectral index (; 0.3–10 keV) around the peak flux is typical of well-known HBLs that have synchrotron peak around UV energies (e.g. Mrk 421; Baloković et al., 2016), but it is drastically variable in OJ 287 and often becomes too steep – more like a spectral cutoff (ref Fig. 4; spectra of shaded periods of Fig. 1).
Apart from the similarity of observed spectral variations during both the activity periods (2016–2017 and current) driven by an extremely soft X-ray spectrum, another correlation seems to be the strength of the modified MeV-GeV spectrum and the peak X-ray flux exhibited by the source. The modified MeV-GeV spectrum during the current high activity period is similar to the one observed during 2016–2017 activity but the level of emission is lower (ref Fig. 3, bottom panel), as is the peak X-ray flux which is lower in the current episode compared to its peak during 2016–2017 activity. Further, based on the MeV-GeV spectrum, VHE emission is expected but there is no such report for the current activity. Given the spectral similarity of optical to X-ray and MeV-GeV emission, some inferences can be drawn regarding the lack of VHE based on the 2016–2017 activity (Brien & VERITAS Collaboration, 2017; Kushwaha et al., 2018c). In general, the observed VHE spectrum is expected to be steeper due to attenuation caused by the extra-galactic background light (EBL; Domínguez et al., 2011). The VHE spectrum during the 2016–2017 activity is consistent with a PL photon spectral index () of (Brien & VERITAS Collaboration, 2017). Correcting this for EBL leads to an intrinsic , similar to the X-ray photon spectral index () during and around the peak X-ray flux (Grupe et al., 2017; Brien & VERITAS Collaboration, 2017; Kushwaha et al., 2018c). Since during and around the peak X-ray flux during the current activity is , assuming a similar intrinsic VHE spectrum would lead to a due to EBL attenuation. This steepness and a low MeV-GeV flux in the current episode combined with the empirical fact that the amplitude of high-energy hump in HBL is lower than the low-energy hump could be one of the reasons for non-detection of the source at VHE energies. Though there can be other reasons, it should be noted that even during the 2016–2017 activity, the VHE was detected quite late (Brien & VERITAS Collaboration, 2017) – almost by 3 – 4 months with respect to the commencement of such optical to X-ray spectral state (Komossa et al., 2017; Kushwaha et al., 2018c).
Another supporting evidence is that during the 2016–2017 high X-ray activity, the X-ray spectrum was quite steeper () and fluctuating in the beginning and the end while it was relatively flatter () and stable during the duration of VHE detection (MJD 57750 – 57840; Brien & VERITAS Collaboration, 2017). A similar pattern can be noticed during the high X-ray flux of the current activity episode. We would also like to point out that in the broadband SED modeling in Kushwaha et al. (2018c), the VHE spectrum is not corrected for EBL absorption (Domínguez et al., 2011) and thus, though the conclusion and inferences remain valid, the model parameters for the 2nd zone are not. In fact, as shown above, the EBL corrected VHE spectrum reported by the VERITAS (Brien & VERITAS Collaboration, 2017) is consistent with the X-ray spectral index, indicating that inverse Compton scattering responsible for VHE emission happened in the Thomson scattering regime.
A noticeable and important difference between the current MeV-GeV spectrum from LAT with the one seen during the 2016–2017 activity is that the traditional MeV-GeV spectrum is comparatively stronger and clearly visible in the LAT spectrum of the current duration (Fig. 3).
4.4 Unique Trends of the New Spectral State
There are a few unique spectral and temporal features common during both the episodes of high X-ray activity driven by the new HBL like emission component (shaded regions in Fig. 1). The most prominent being a minimum in optical-UV when the X-ray is relatively high or probably at a base level flux with a hardened X-ray spectral state, followed subsequently by a low in X-ray but a high one in optical-UV (the red shaded region, Fig. 1), after the peak X-ray flux (Kushwaha et al., 2018c, see also Komossa et al. (2020)). The time separation between the two, however, is different. It was 10 days in 2016–2017 activity (Table 1 and associated texts; Kushwaha et al., 2018c) while it is 30 days during the current activity episode. Another feature could be a minimum in optical-UV but a base or flaring in X-ray (the blue shaded region, Fig. 1). Unfortunately, unless we catch this feature in future observations, it will remain ambiguous given our lack of predicting its time of occurrence and our inability to continuously monitor an astrophysical source.
The other unique feature is the drastic evolution of the high-energy-end of this new emission component which goes from a PL shape to a very steep, more like a cutoff within a few days. This steepness is the reason for dramatic flux dimming in X-ray without much change in optical-UV emission level and spectral shape (Fig. 4, e.g. SEDs labeled 58965.7 and 58994.3).
4.5 The New Spectral State and 12-yr optical QPOs
Though X-ray observations of OJ 287 before the year 2000 are only a few, mainly around the claimed 12-year outbursts and hence any long-term inferences derived using them may be biased, these records do indicate such soft X-ray spectral state within a few years around the peculiar 12-year outburst (Isobe et al., 2001; Kushwaha, 2020, and references therein). However, the 2005 and 2007 outbursts do not show such X-ray state or even hardening in optical-UV. For the latest two of these outbursts, happened in 2015 and 2019, such extremely soft X-ray spectral state appeared respectively and months (this work; see also Komossa et al. (2020)) after the claimed disk-impact outbursts (Dey et al., 2018; Laine et al., 2020) within the limits of observational records in the literature. The records and timing, thus, clearly indicate a connection between the two and also point to the peculiarity of these outbursts compared to typical OJ 287 outbursts (see also Kushwaha, 2020).
In addition to predicting and explaining the recurrent 12-year optical outbursts, the disk-impact binary SMBH model also predicts activity as a result of perturbation and tidal effects (Valtonen et al., 2009; Pihajoki et al., 2013b). The current observational results – strong and rapid variability as well as the broadband spectral features, on the other hand, unambiguously indicate the emission to the jet as also pointed out by Komossa et al. (2020) based on variability, spectral evolution, and high polarization (Zola et al., 2020). Thus, whether the observed variations are an outcome of these effects reaching the jet, thereby indicating a jet-disk connection – an unsolved and highly debated research topic, or something else is still unclear at the moment.
5 Summary
We presented a detailed study of the spectro-temporal evolution and broadband spectral behavior of OJ 287 between May 27, 2017 to June 10, 2020. The period corresponds to the end phase of the highest reported X-ray activity of OJ 287 in 2016–2017 to the end phase of its second highest X-ray flux state that occurred in end-April 2020. This continuation provides the view of evolutionary fate of the new HBL like broadband emission component that was responsible for the 2016-2017 extreme optical to X-ray variability. A summary of observed spectral and temporal behavior and inferences is as follow:
-
•
Except for two period of duration 50 and 10 days, optical to X-ray light curves exhibit strong, correlated variability for the rest, associated with spectral changes, especially at X-ray energies. At LAT -ray energies, the light curve around highest X-ray flux reveal that the source is weaker, with only a few detection. For optical-UV emission, the spectrum and flux variations are correlated while the trend is opposite for variations in X-ray band.
-
•
IR to MeV-GeV spectra show very different spectral state compared to its well-known spectrum, indicating new spectral features in all the bands. The resultant broadband SED (IR to MeV-GeV) establishes the observed spectral and temporal variations to a highly dynamic HBL like emission component, similar to the one seen during the 2016–2017 high X-ray activity period of OJ 287.
-
•
The optical-UV and X-ray flux variations are anti-correlated for the above mentioned two periods (exhibiting odd behaviors), and are mainly due to the steepening of the high-energy end of the HBL emission component.
-
•
The new emission component responsible for the strong optical to X-ray activity during the current and the 2016–2017 period though appears similar to the well-known blazars HBL component, its high-energy end is extremely dynamic and become too steep within a day and thus, untypical in this sense.
-
•
The observation of a dip in X-ray but a high optical-UV flux after the highest X-ray flux state during the current and 2016–2017 activity indicates this behavior to be a characteristic feature of this new broadband emission component.
Acknowledgments
We thank the anonymous referee for his/her invaluable inputs. PK acknowledges support from ARIES A-PDF grant (AO/A-PDF/770). MP thanks the financial support of UGC, India program through DSKPDF fellowship (grant No. BSR/ 2017-2018/PH/0111). N Kalita acknowledges funding from the Chinese Academy of Sciences President’s International Fellowship Initiative Grant No. 2020PM0029. ACG is partially supported by Chinese Academy of Sciences (CAS) President’s International Fellowship Initiative (PIFI) (grant no. 2016VMB073). EMGDP acknowledges support from the Brazilian funding agencies FAPESP (grant 2013/10559-5) and CNPq (grant 308643/2017-8 ). MFG acknowledges support from the National Science Foundation of China (11873073). The work at Physical Research Laboratory is supported by the Department of Space, Govt. of India. This research has made use of the XRT Data Analysis Software (XRTDAS) developed under the responsibility of the ASI Science Data Center (ASDC), Italy.
References
- Abdo et al. (2010) Abdo, A. A., Ackermann, M., Agudo, I., et al. 2010, ApJ, 716, 30, doi: 10.1088/0004-637X/716/1/30
- Abdollahi et al. (2020) Abdollahi, S., Acero, F., Ackermann, M., et al. 2020, ApJS, 247, 33, doi: 10.3847/1538-4365/ab6bcb
- Agudo et al. (2011) Agudo, I., Jorstad, S. G., Marscher, A. P., et al. 2011, ApJL, 726, L13, doi: 10.1088/2041-8205/726/1/L13
- Ahnen et al. (2018) Ahnen, M. L., Ansoldi, S., Antonelli, L. A., et al. 2018, A&A, 620, A181, doi: 10.1051/0004-6361/201833704
- Atwood et al. (2009) Atwood, W. B., Abdo, A. A., Ackermann, M., et al. 2009, ApJ, 697, 1071, doi: 10.1088/0004-637X/697/2/1071
- Baloković et al. (2016) Baloković, M., Paneque, D., Madejski, G., et al. 2016, ApJ, 819, 156, doi: 10.3847/0004-637X/819/2/156
- Banerjee & Ashok (2012) Banerjee, D. P. K., & Ashok, N. M. 2012, Bulletin of the Astronomical Society of India, 40, 243. https://arxiv.org/abs/1306.0343
- Bhatta et al. (2016) Bhatta, G., Zola, S., Stawarz, Ł., et al. 2016, ApJ, 832, 47, doi: 10.3847/0004-637X/832/1/47
- Brien & VERITAS Collaboration (2017) Brien, S. O., & VERITAS Collaboration. 2017, in International Cosmic Ray Conference, Vol. 301, 35th International Cosmic Ray Conference (ICRC2017), 650
- Britzen et al. (2018) Britzen, S., Fendt, C., Witzel, G., et al. 2018, MNRAS, 478, 3199, doi: 10.1093/mnras/sty1026
- Burrows et al. (2005) Burrows, D. N., Hill, J. E., Nousek, J. A., et al. 2005, Space Sci. Rev., 120, 165, doi: 10.1007/s11214-005-5097-2
- Cohen (2017) Cohen, M. 2017, Galaxies, 5, 12, doi: 10.3390/galaxies5010012
- Cohen et al. (2003) Cohen, M., Wheaton, W. A., & Megeath, S. T. 2003, AJ, 126, 1090, doi: 10.1086/376474
- Deil et al. (2017) Deil, C., Zanin, R., Lefaucheur, J., et al. 2017, in International Cosmic Ray Conference, Vol. 301, 35th International Cosmic Ray Conference (ICRC2017), 766. https://arxiv.org/abs/1709.01751
- Dey et al. (2018) Dey, L., Valtonen, M. J., Gopakumar, A., et al. 2018, ApJ, 866, 11, doi: 10.3847/1538-4357/aadd95
- Domínguez et al. (2011) Domínguez, A., Primack, J. R., Rosario, D. J., et al. 2011, MNRAS, 410, 2556, doi: 10.1111/j.1365-2966.2010.17631.x
- Fossati et al. (1998) Fossati, G., Maraschi, L., Celotti, A., Comastri, A., & Ghisellini, G. 1998, MNRAS, 299, 433, doi: 10.1046/j.1365-8711.1998.01828.x
- Goyal et al. (2018) Goyal, A., Stawarz, Ł., Zola, S., et al. 2018, ApJ, 863, 175, doi: 10.3847/1538-4357/aad2de
- Grupe et al. (2017) Grupe, D., Komossa, S., amp, & Falcone, A. 2017, The Astronomer’s Telegram, 10043, 1
- Harrison et al. (2013) Harrison, F. A., Craig, W. W., Christensen, F. E., et al. 2013, ApJ, 770, 103, doi: 10.1088/0004-637X/770/2/103
- HI4PI Collaboration et al. (2016) HI4PI Collaboration, Ben Bekhti, N., Flöer, L., et al. 2016, A&A, 594, A116, doi: 10.1051/0004-6361/201629178
- Hosokawa et al. (2020) Hosokawa, R., Adachi, R., Murata, K. L., et al. 2020, The Astronomer’s Telegram, 13755, 1
- Hunter (2007) Hunter, J. D. 2007, Computing in Science & Engineering, 9, 90, doi: 10.1109/MCSE.2007.55
- Isobe et al. (2001) Isobe, N., Tashiro, M., Sugiho, M., & Makishima, K. 2001, PASJ, 53, 79, doi: 10.1093/pasj/53.1.79
- Kalita et al. (2020) Kalita, N., Gupta, A. C., & Gu, M. 2020, Galaxies, 8, doi: 10.3390/galaxies8030058
- Kapanadze et al. (2018) Kapanadze, B., Vercellone, S., Romano, P., et al. 2018, MNRAS, 480, 407, doi: 10.1093/mnras/sty1803
- Komossa et al. (2020) Komossa, S., Grupe, D., & Gomez, J. L. 2020, The Astronomer’s Telegram, 13658, 1
- Komossa et al. (2020) Komossa, S., Grupe, D., Parker, M. L., et al. 2020, Monthly Notices of the Royal Astronomical Society: Letters, 498, L35, doi: 10.1093/mnrasl/slaa125
- Komossa et al. (2017) Komossa, S., Grupe, D., Schartel, N., et al. 2017, in New Frontiers in Black Hole Astrophysics, ed. A. Gomboc, Vol. 324, 168–171, doi: 10.1017/S1743921317001648
- Kushwaha (2020) Kushwaha, P. 2020, Galaxies, 8, 15, doi: 10.3390/galaxies8010015
- Kushwaha et al. (2016) Kushwaha, P., Chandra, S., Misra, R., et al. 2016, ApJL, 822, L13, doi: 10.3847/2041-8205/822/1/L13
- Kushwaha et al. (2018a) Kushwaha, P., de Gouveia Dal Pino, E. M., Gupta, A. C., & Wiita, P. J. 2018a, in International Conference on Black Holes as Cosmic Batteries: UHECRs and Multimessenger Astronomy. 12-15 September 2018. Foz do Iguaçu, 22. https://arxiv.org/abs/1901.10768
- Kushwaha et al. (2013) Kushwaha, P., Sahayanathan, S., & Singh, K. P. 2013, MNRAS, 433, 2380, doi: 10.1093/mnras/stt904
- Kushwaha et al. (2020) Kushwaha, P., Sarkar, A., Gupta, A. C., Tripathi, A., & Wiita, P. J. 2020, MNRAS, 499, 653, doi: 10.1093/mnras/staa2899
- Kushwaha et al. (2014) Kushwaha, P., Singh, K. P., & Sahayanathan, S. 2014, ApJ, 796, 61, doi: 10.1088/0004-637X/796/1/61
- Kushwaha et al. (2017) Kushwaha, P., Sinha, A., Misra, R., Singh, K. P., & de Gouveia Dal Pino, E. M. 2017, ApJ, 849, 138, doi: 10.3847/1538-4357/aa8ef5
- Kushwaha et al. (2018b) Kushwaha, P., Gupta, A. C., Wiita, P. J., et al. 2018b, MNRAS, 473, 1145, doi: 10.1093/mnras/stx2394
- Kushwaha et al. (2018c) —. 2018c, MNRAS, 479, 1672, doi: 10.1093/mnras/sty1499
- Laine et al. (2020) Laine, S., Dey, L., Valtonen, M., et al. 2020, ApJ, 894, L1, doi: 10.3847/2041-8213/ab79a4
- Naik et al. (2010) Naik, S., Banerjee, D. P. K., Ashok, N. M., & Das, R. K. 2010, MNRAS, 404, 367, doi: 10.1111/j.1365-2966.2010.16292.x
- Nigro et al. (2019) Nigro, C., Deil, C., Zanin, R., et al. 2019, A&A, 625, A10, doi: 10.1051/0004-6361/201834938
- Nilsson et al. (2010) Nilsson, K., Takalo, L. O., Lehto, H. J., & Sillanpää, A. 2010, A&A, 516, A60, doi: 10.1051/0004-6361/201014198
- Oikonomou et al. (2019) Oikonomou, F., Murase, K., Padovani, P., Resconi, E., & Mészáros, P. 2019, MNRAS, 489, 4347, doi: 10.1093/mnras/stz2246
- Pal et al. (2020) Pal, M., Kushwaha, P., Dewangan, G. C., & Pawar, P. K. 2020, ApJ, 890, 47, doi: 10.3847/1538-4357/ab65ee
- Pian et al. (1998) Pian, E., Vacanti, G., Tagliaferri, G., et al. 1998, ApJ, 492, L17, doi: 10.1086/311083
- Pihajoki et al. (2013a) Pihajoki, P., Valtonen, M., & Ciprini, S. 2013a, MNRAS, 434, 3122, doi: 10.1093/mnras/stt1233
- Pihajoki et al. (2013b) Pihajoki, P., Valtonen, M., Zola, S., et al. 2013b, ApJ, 764, 5, doi: 10.1088/0004-637X/764/1/5
- Rodríguez-Ramírez et al. (2020) Rodríguez-Ramírez, J. C., Kushwaha, P., de Gouveia Dal Pino, E. M., & Santos-Lima, R. 2020, MNRAS, 498, 5424, doi: 10.1093/mnras/staa2664
- Roming et al. (2005) Roming, P. W. A., Kennedy, T. E., Mason, K. O., et al. 2005, Space Sci. Rev., 120, 95, doi: 10.1007/s11214-005-5095-4
- Sasada et al. (2018) Sasada, M., Jorstad, S., Marscher, A. P., et al. 2018, ApJ, 864, 67, doi: 10.3847/1538-4357/aad553
- Scaringi et al. (2015) Scaringi, S., Maccarone, T. J., Kording, E., et al. 2015, Science Advances, 1, e1500686, doi: 10.1126/sciadv.1500686
- Schlafly & Finkbeiner (2011) Schlafly, E. F., & Finkbeiner, D. P. 2011, ApJ, 737, 103, doi: 10.1088/0004-637X/737/2/103
- Siejkowski & Wierzcholska (2017) Siejkowski, H., & Wierzcholska, A. 2017, MNRAS, 468, 426, doi: 10.1093/mnras/stx495
- Sillanpaa et al. (1988) Sillanpaa, A., Haarala, S., Valtonen, M. J., Sundelius, B., & Byrd, G. G. 1988, ApJ, 325, 628, doi: 10.1086/166033
- Sitko & Junkkarinen (1985) Sitko, M. L., & Junkkarinen, V. T. 1985, PASP, 97, 1158, doi: 10.1086/131679
- Sobolewska et al. (2014) Sobolewska, M. A., Siemiginowska, A., Kelly, B. C., & Nalewajko, K. 2014, ApJ, 786, 143, doi: 10.1088/0004-637X/786/2/143
- Tody (1986) Tody, D. 1986, in Society of Photo-Optical Instrumentation Engineers (SPIE) Conference Series, Vol. 627, Instrumentation in astronomy VI, ed. D. L. Crawford, 733, doi: 10.1117/12.968154
- Tody (1993) Tody, D. 1993, in Astronomical Society of the Pacific Conference Series, Vol. 52, Astronomical Data Analysis Software and Systems II, ed. R. J. Hanisch, R. J. V. Brissenden, & J. Barnes, 173
- Valtaoja et al. (1985) Valtaoja, E., Lehto, H., Teerikorpi, P., et al. 1985, Nature, 314, 148, doi: 10.1038/314148a0
- Valtonen et al. (2009) Valtonen, M. J., Nilsson, K., Villforth, C., et al. 2009, ApJ, 698, 781, doi: 10.1088/0004-637X/698/1/781
- Visvanathan & Elliot (1973) Visvanathan, N., & Elliot, J. L. 1973, ApJ, 179, 721, doi: 10.1086/151911
- Zola et al. (2020) Zola, S., Reichart, D. E., Kouprianov, V., et al. 2020, The Astronomer’s Telegram, 13637, 1