The stratified disk wind of MCG-03-58-007
Abstract
Past Suzaku, XMM-Newton and NuSTAR observations of the nearby () bright Seyfert 2 galaxy MCG-03-58-007 revealed the presence of two deep and blue-shifted iron K-shell absorption line profiles. These could be explained with the presence of two phases of a highly ionized, high column density accretion disk wind outflowing with and . Here we present two new observations of MCG-03-58-007: one was carried out in 2016 with Chandra and one in 2018 with Swift. Both caught MCG-03-58-007 in a brighter state ( erg cm-2 s-1) confirming the presence of the fast disk wind. The multi-epoch observations of MCG-03-58-007 covering the period from 2010 to 2018 were then analysed. These data show that the lower velocity component outflowing with is persistent and detected in all the observations, although it is variable in column density in the range cm-2. In the 2016 Swift observation we detected again the second faster component outflowing with , with a column density ( cm-2), similar to that seen during the Suzaku observation. However during the Chandra observation two years earlier, this zone was not present ( cm-2), suggesting that this faster zone is intermittent. Overall the multi-epochs observations show that the disk wind in MCG-03-58-007 is not only powerful, but also extremely variable, hence placing MCG-03-58-007 among unique disk winds such as the one seen in the famous QSO PDS456. One of the main results of this investigation is the consideration that these winds could be extremely variable, sometime appearing and sometime disappearing; thus to reach solid and firm conclusions about their energetics multiple observations are mandatory.
keywords:
galaxies: active – galaxies: individual (MCG-03-58-007) – X-rays: galaxies1 Introduction
Less than twenty years after the discovery of the first examples of highly-ionized (log (), massive and fast () outflowing absorbers (PDS 456, Reeves et al. 2003, PG1211+143, Pounds et al. 2003 and APM 08279+5255, Chartas et al. 2002), it is now largely accepted that fast disk winds are commonly observed in nearby bright AGN (Tombesi et al. 2010, 2012; Gofford et al. 2013, 2015). Although a lot of observational and theoretical effort has been invested in understanding their nature and their possible role in shaping the host galaxies (King 2010; King et al. 2011; Nardini & Zubovas 2018 and references therein), several questions still remain open including their main driving mechanism, their variability and their real impact on the host galaxy.
The velocities measured for these winds can reach up to (PDS 456 Reeves et al. 2009, 2014, APM 08279+5255 Chartas et al. 2002), suggesting that they most likely originate in the innermost region of the accretion disk (see King & Pounds 2015) and therefore could be linked to the accretion process itself (King & Pounds 2003; King 2010; King & Pounds 2015). They could be driven either by the radiation pressure (Proga et al. 2000; Proga & Kallman 2004; Sim et al. 2008, 2010), by magneto-rotational forces (MHD models: Kato et al. 2004; Kazanas et al. 2012; Fukumura et al. 2010, 2017) or a combination of both.
The measured relativistic velocities and high column densities imply that, although affected by high uncertainties, the outflow rates and kinetic output can be huge and match or exceed the conventional threshold of % for an efficient AGN feedback on the host galaxy (Hopkins & Elvis 2010; Di Matteo et al. 2005). These disk winds might indeed drive the
massive molecular outflows seen on kpc-scales (Cicone et al. 2014, 2015; Fiore et al. 2017) and thus influence the host galaxies by sweeping away the interstellar medium and suppressing star formation (King & Pounds 2015; Zubovas & King 2012, 2016). Thus these disk winds could play a major role in the feedback process that shapes the formation of the stellar bulges and simultaneously self regulate the growth of the super massive black hole (SMBH), leading to the observed AGN-host galaxy relationships like the relation (Magorrian et al. 1998; Ferrarese & Merritt 2000; Gebhardt et al. 2000).
The first detections of powerful X-ray disk winds in two Ultra Luminous Infrared Galaxies (ULIRGs), where massive large-scale molecular outflows are also present (Mrk 231; Feruglio et al. 2015 and IRASF 11119+3257; Tombesi et al. 2015) seemed to support a scenario where the molecular outflows are driven by an energy conserving disk wind. Here, when the disk wind propagates and shocks with the ISM it does not cool efficiently and the large-scale outflow receives a momentum boost (King 2010; Faucher-Giguère & Quataert 2012). However, recent results on other ultra fast disk winds observed with the Atacama Large Millimeter/submillimeter Array (ALMA) show that not all outflows lie on the energy conserving relation. Actually, with the more recent IRAM and ALMA data, only Mrk 231 and IRAS 17020+4544 (Longinotti et al. 2018) are consistent with the above scenario. An energy conserving wind can be clearly ruled out for both the prototype of the fast disk winds PDS 456 (Bischetti et al. 2019) and the powerful wind of I Zw 1 (Reeves & Braito 2019). This hints for a range of efficiencies in transferring the kinetic energy of the inner wind out to the large-scale molecular component (Mizumoto et al. 2019), which suggest that the role of the powerful disk winds in the galaxy evolution may be more complex that what we thought. Several scenarios can indeed explain the lack of a powerful molecular outflow; among them the large scale gas could be clumpy as seen in the ALMA observation of PDS456 (Bischetti et al. 2019) or it could be ionized. Furthermore, once we consider that the typical dynamical timescales of the large scale outflows are of the order of yr, it is not unexpected that we do not observe the two phases simultaneously. Indeed, there could be a substantial delay between the onset of the fast X-ray wind and the large-scale energy conserving wind (King et al. 2011).
| Mission | Start Date (UT Time) | Instrument | Elapsed Time (ks) | Exposure(net) (ks) |
|---|---|---|---|---|
| Suzaku | 2010-06-03 16:50 | XIS | 187.4 | 87.0 |
| XMM-Newton | 2015-12-06 12:15 | EPIC-pn | 131.3 | 59.9 |
| NuSTAR | 2015-12-06 10:36 | FPMA | 281.8 | 131.4 |
| Chandra | 2016-09-25 05:14 | ACIS-S | 44 | 39.8 |
| Chandra | 2016-09-20 09:23 | ACIS-S | 17 | 15.5 |
| Swift | 2018-04-15 13:22 | XRT | - | 19.6 |
| Swift | 2018-04-19 00:27 | XRT | - | 17.6 |
| Swift | 2018-04-20 00:29 | XRT | - | 6.1 |
| Swift | 2018-04-22 03:28 | XRT | - | 19.7 |
| Swift | 2018-04-23 23:58 | XRT | - | 3.0 |
| Swift | 2018-04-25 03:01 | XRT | - | 3.8 |
It is clear that, if we want to establish the role of the AGN disk winds at driving the large scale outflows, we need more examples of disk winds in conjunction with multiwavelength observations of the host galaxies, which can reveal the large-scale component of the outflows, as well as further investigate the most compelling cases of X-ray disk winds. First of all it is essential to establish if the fast wind is persistent or not, then we need to refine the measurement of the persistent component of the wind, so that we do not introduce an error on the estimates of the mass and energetics of the disk wind. We note, that with the exception of PDS 456, the variability of the X-ray disk winds is poorly studied. In the best studied examples the fast disk wind can be variable in ionisation, column density () and even velocity (e.g. PDS 456, Reeves et al. 2018a; Matzeu et al. 2017; IRASF 11119+3257, Tombesi et al. 2017; PG 1211+143, Reeves et al. 2018b and APM 08279+5255, Saez & Chartas 2011). This observational evidence is in agreement with disk wind simulations where the stream is not expected to be a homogeneous and constant flow (Proga & Kallman 2004; Giustini & Proga 2012). The observed variations could be either explained with our line of sight intercepting different clumps or streams of the winds or with a response of the wind to the luminosity of the X-ray source. Recently, a direct correlation between the outflow velocity and the intrinsic ionising luminosity was reported for PDS 456 (Matzeu et al. 2017), IRAS 13224-3809 (Chartas & Canas 2018) and APM 08279+5255 (Saez & Chartas 2011), while a correlation between the ionisation of the disk wind and the X-ray luminosity was reported for IRAS 13224-3809 by Pinto et al. (2018). This indicates the importance of the incident radiation upon the wind: as the luminosity and thus the radiation pressure increases, a faster wind is driven.
MCG-03-58-007 is a bright and nearby Seyfert 2 galaxy ( erg cm-2 s-1, ; Sirressi et al. 2019). The first deep Suzaku (Mitsuda et al. 2007) observation performed in 2010 showed a spectrum of an obscured AGN (cm-2) and, surprisingly, two deep ( eV) blue-shifted absorption troughs at keV and keV (Braito et al. 2018, hereafter B18). These are most likely associated with two zones of a highly ionized (log (erg cm s-1)) and high column density ( cm-2) outflowing wind with and . The derived kinetic output ( erg s-1) is % of the bolometric luminosity (or % of ), placing MCG-03-58-007 among the most powerful disk winds. A deep follow-up observation was carried out in 2015 with XMM-Newton & NuSTAR (of 130 ksec net exposure each). This follow-up confirmed the presence of the slow component of the wind, but did not confirm the keV feature previously observed in the Suzaku spectra. This observation unveiled also a possible faster () component of the wind. Remarkably, during this XMM-Newton & NuSTAR observation we witnessed an X-ray eclipse caused by a denser (cm-2) streamline of the wind moving across our line of sight that lasted ksec, which is outflowing at . A further investigation of the broad band X-ray emission, performed adopting a more self-consistent model for the pc-scale toroidal absorber (mytorus, Murphy & Yaqoob 2009) confirmed that the short-term X-ray spectral variability cannot be accounted for by variations of the neutral absorber, but certainly requires a variable highly ionized fast wind (Matzeu et al. 2019, hereafter M19).
MCG-03-58-007 was also observed with ALMA, revealing a component that likely corresponds to a low velocity ( km s -1) molecular outflow in the central 4 kpc. However, as for PDS 456 and I Zw 1 (Reeves & Braito 2019), the kinetic power of the putative molecular outflow is at least two orders of magnitude below the expected value for an energy conserving wind (; Sirressi et al. 2019).
Here we present the results of two follow-up observational campaigns performed with Chandra in 2016 and with Swift in 2018, both of which caught MCG-03-58-007 in a brighter state ( erg cm-2 s-1).
We will show that the slowest component of the wind is persistent, as it is detected in all the observations with a similar velocity of and it is variable in column density, confirming its clumpy nature. On the contrary the second component of the wind seen
during the Suzaku observation appears more sporadic.
The paper is structured as follows: in §2 we briefly summarise the previous
Suzaku, XMM-Newton & NuSTAR observations, which were already discussed in B18 and in M19. The data reduction of the Swift and Chandra observations is also presented in detail in §2. In §3 we present the spectral modelling focusing on the variability of the wind components. The discussion of the disk wind and the implications of the long term variability are presented in §4. Throughout the paper we assume a concordance cosmology with km s-1 Mpc-3, and =0.27. For the abundances we used those of Wilms et al. (2000).
2 Observations and data reduction
2.1 Earlier observations: Suzaku, XMM and NuSTAR
MCG-03-58-007 was observed in the X-ray band in four epochs with five different satellites; in Table 1 we report the observation dates, instruments and the net exposure times for the all the available observations.
For the Suzaku, XMM-Newton and NuSTAR observations we adopt the same spectra as already described in detail in B18 and M19. As per the previous analysis, the XMM-Newton & NuSTAR observations were split into two main intervals: slice A and slice B (see Fig. 5 of B18), where slice A is the relatively unobscured half of the observation and slice B is where MCG-03-58-007 dropped in flux and appeared to go into a more obscured state (see B18 and M19 for details). For simplicity, here we considered only the EPIC-pn spectrum as the agreement with the MOS spectrum is already discussed in M19. In this analysis we combined the NuSTAR FPMA and FPMB spectra, because the individual detectors were consistent, and then grouped the resulting spectrum to reach at least 50 total counts per bin. For these two epochs we will limit our analysis to the best fits obtained in the previous works and simply test a new grid of photoionised absorbers (see below).
2.2 Chandra
MCG-03-58-007 was observed with Chandra in September 2016; the observation was split into two shorter exposures (see Table 1) that were carried out five days apart.
The observations were performed with the Advanced CCD Imaging spectrometer (ACIS-S; Garmire et al. 2003) in the 1/8 sub-array mode. We reduced the data with the Chandra Interactive Analysis of Observation software (CIAO v. 4.10; Fruscione et al. 2006) and the latest Chandra Calibration Data Base (CALDB version 4.8.1). We followed the standard reduction procedures and extracted source and background spectra using a circular region of and radius, respectively. We then inspected the spectra extracted from the two exposures and verified that there was no evidence for strong spectral variability and only a moderate flux variation between the two spectra (%). We thus added the spectra and combined the responses files with appropriate weighting. The resulting spectrum was then binned to a minimum of 20 total counts per bin and modelled over the keV energy range.
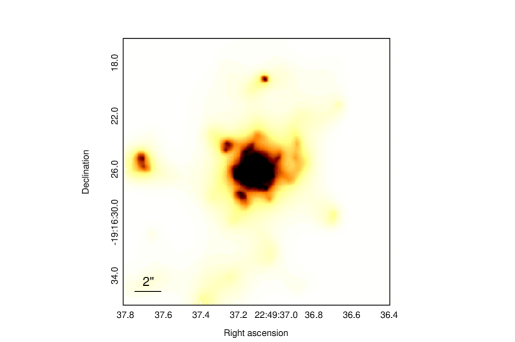
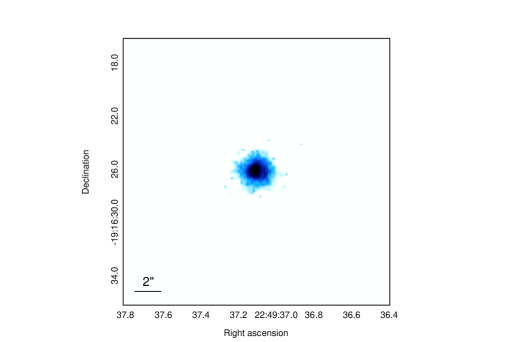
We also extracted soft (0.5–2 keV) and hard (2–8 keV) X-ray images. We first corrected the absolute astrometry of the images adjusting the aspect solution file and the event file astrometry with the CIAO tools wcs_update and reproject_events. We then merged the event files of the two observations using the CIAO tool dmerge. Soft and hard X-ray images were then created using a binning at of the native pixel size and then adaptively smoothed using the tool dmimgadapt, which assumes a gaussian function with sigma values ranging fro 1 to 30 image pixels and a minimum convolution kernel of 2 counts111For details see: https://cxc.cfa.harvard.edu/ciao/ahelp/dmimgadapt.html. The inspection of the images shows that most of the X-ray emission originates in the innermost 1′′ (or pc), with only a weak residual soft X-ray emission extending up to (see Fig. 1). This is in agreement with the RGS spectral analysis presented in M19, where the soft X-ray emission was attributed to the presence of gas that is mainly photoionised by the central AGN and possibly associated with the emission of the circumnuclear Narrow Line Region gas.
2.3 Swift
Swift observed MCG-03-58-007 in 2018 for a total exposure time of 70 ksec. The observational campaign consisted of six XRT exposures in the standard PC-mode, with three long ( ksec each) exposures and three shorter observations (see Table 1). The observations were performed as a monitoring program aimed at investigating the possible variability of the neutral absorber on time scales as short as a day. The observations were performed in April 2018 covering about 10 days.
We extracted the source and background spectra from each of the observations adopting a circular region with a radius of 42′′ and 78′′, respectively. We also extracted broadband as well as soft (0.3–2 keV) and hard (2–10 keV) X-ray light curves and found no evidence for spectral variability and only minor flux variations within %. The inspection of the spectra extracted from all the observations suggests that MCG-03-58-007 was caught in a similar state in each of them. Before adding all the six spectra, we fitted all of them with a baseline continuum model composed of: an absorbed power component, a scattered power-law emission and a thermal emission component, finding consistent spectral parameters and only moderate flux variations.
We also note that the residuals of all three longest observations show a drop above 7 keV. However, the low count statistics in the individual spectra prevent us from investigating the nature of the drop in the single observations, therefore we combined all of them into a single spectrum. We then binned the combined spectrum to a minimum of 20 total counts per bin and considered the keV energy range for the following spectral analysis.
3 Spectral analysis
3.1 Baseline model
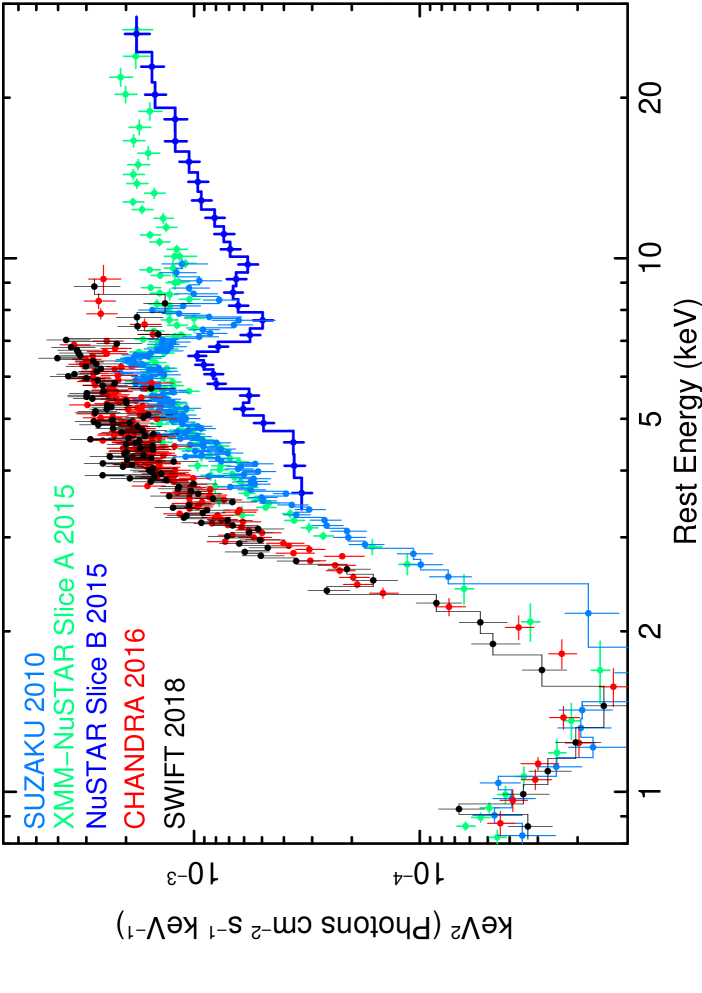
In Fig. 2 we show the fluxed spectra of all the X-ray observations, obtained by unfolding the data against a power law model with . Two facts emerge by comparing all the observations. First of all, the spectral curvature, that we can ascribe to the presence of the neutral absorber, appears to be similar in all the spectra, with the exception of the second part of the NuSTAR observation (slice B, see Fig. 2, dark blue spectrum). Second and more importantly all the spectra show a drop around keV.
We also note that in the two new observational campaigns (Fig. 2, red and black data points for the Chandra and Swift spectra, respectively) we caught MCG-03-58-007 in a relatively brighter state ( erg cm-2 s-1; see Table 2).
The best fit model found for the first two epochs (e. g. B18) was defined as:
Here tbabs represents the neutral Galactic absorption ( cm-2; Dickey & Lockman 1990), zpowscatt is the scattered power-law component; the cold reflection component is modelled with pexmon (Nandra et al. 2007), which includes also the Fe K, Fe K and the Ni emission lines as well as the Fe K Compton shoulder. We fixed the inclination angle to 60 degrees and the high energy cutoff to 100 keV. We fixed also the amount of reflection , while the normalisation is allowed to vary. For the reflection component we tied its photon index to the primary power-law component, while we allow the scattered power-law component to have a different slope to account for any soft excess. For the soft X-ray emission the best fit models include both the emission from a collisionally ionized plasma (mekal component, with keV) and the optically thin gas photoionized by the AGN (xstarem; see M19). Finally, xstarFeK,1 and xstarFeK,2 are the two photoionised absorbers.
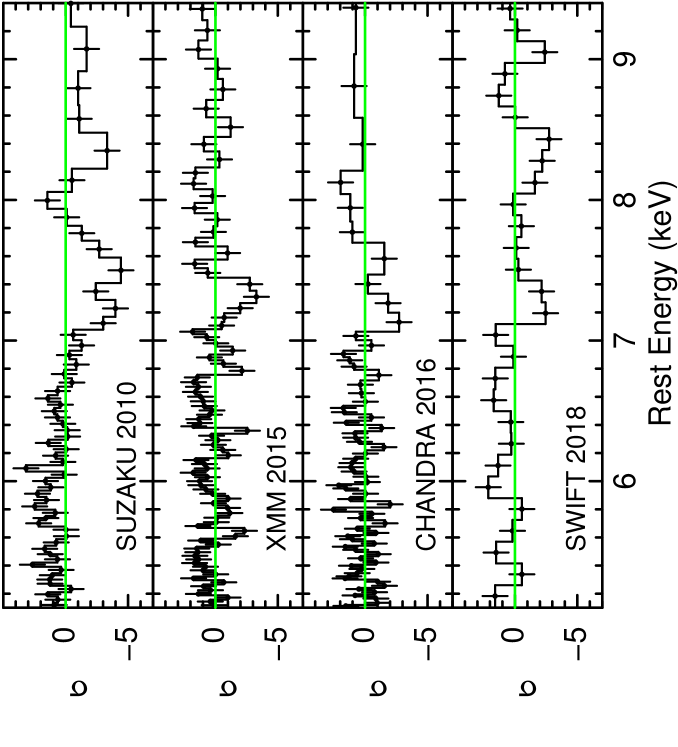
We first proceeded to fit the new Chandra and Swift spectra with the best fit continuum model found for the previous observations, minus the two photoionised absorbers. In Fig. 3 we show the residuals in the iron absorption region of all the spectra to the baseline continuum model, where for completeness we also report the residuals of the previous Suzaku and XMM-Newton & NuSTAR spectra. For simplicity for the 2015 observation, here we only show the XMM-pn data of slice A. A similar comparison between slice A and the slice B residuals is shown in Fig. 8 of B18. We note that for the XMM-Newton & NuSTAR spectra (both slice A and slice B) we included a neutral reflection component to the baseline continuum model (as above), which we modelled with the pexmon component allowing only its normalisation to vary. For the Chandra & Swift datasets, which lack the bandpass above 10 keV, this is not required. Two main facts emerge when inspecting the residuals. First of all a trough at keV appears to be present in all the observations, albeit it may vary in depth; as we investigate below this may be ascribed to the variable lower velocity zone of the disk wind. The second fact that emerges is that a higher energy absorption structure is seen at keV in only two of the four epochs, the Suzaku and Swift spectra.
We then reapplied the best fit model, which includes two multiplicative grids of ionised absorption models, to the previous Suzaku, XMM-Newton & NuSTAR spectra (both slice A and slice B) and also to the new Chandra and Swift observations.
We considered each observation separately, with the exception of the Chandra & Swift observations, which caught MCG-03-58-007 with a similar continuum and flux level, where we tied only the main parameters of the continuum, but we allowed the of two ionised absorbers to be independent from each other. We assumed for all the observations the same photon index as currently measured with NuSTAR (, see Table 2), because we lack any coverage above 10 keV, where the primary continuum emission emerges. We note that the derived here is marginally different from the one reported by M19 for a similar configuration (Model A in M19: ); however it is well within the errors. Similarly to what was found by M19, when the photon index of the soft scattered component is allowed to vary it tends to a high value (). However, the precise modelling of the soft X-ray emission does not affect the parameters of the neutral absorber or of the disk wind (see also M19).
A difference of the fits presented here is that to model the two zones disk wind we generated a new grid of photoionised absorbers with the xstar photoionisation code (Kallman et al. 2004). The grid was generated assuming a high turbulence velocity ( km s-1). We assumed a SED similar to IZW1, where the soft (between 0.3 and 1.2 keV) photon index () is and the hard X-ray is 2.2 (see Reeves & Braito 2019). This is justified by the fit reported by M19, where the soft X-ray slope was indeed of the order of 3, in agreement with the slope measured here (see above). The grid was optimised for high column density ( - cm-2) and high ionisation (log() absorbers. The main difference to the grid used in the previous works is that this new grid has finer steps222The xstar grid was generated with 20 linear steps for and 10 logaritmic steps for . (i. e. it interpolates between a larger number of ionized absorbers). The choice of the high turbulence velocity is justified by the broadening measured for the absorption features. For instance, if we model the two absorption features seen in the Suzaku spectra with two Gaussian absorption lines, we measure keV (or km s-1, see also B18). Nevertheless, we also tested grids with a lower turbulence velocity (i. e. km s-1), which resulted in worse fits. In particular, for km s-1 the fit of the Suzaku spectra is worse by ; the predicted absorption features are too narrow and cannot reproduce the breadth and depth of the observed profiles. Note that, as discussed in B18, the equivalent widths of the absorption lines seen in the Suzaku spectra is of the order of eV. Another difference with the previous fits is that here we assumed the ionisation of the two zones to be the same.
In Table LABEL:tab:bestfits, we report the new parameters obtained for these observations, using the new grid of models.
3.2 Slower outflow component
Given the known degeneracy between and log , we proceeded to investigate the variability of the Fe K absorption troughs by allowing only the column density to vary and assumed a constant ionisation (see below). We also allowed the outflow velocity to vary between the observations.
In Table LABEL:tab:bestfits we summarise the results of the best fits for each of the datasets. The inclusion of the first zone of the wind improves all the fits for a , and for the Suzaku, slice A & slice B and the Chandra & Swift data, respectively.
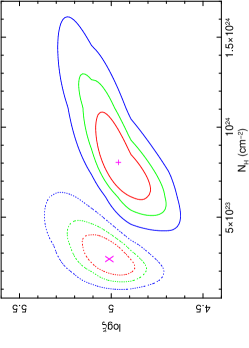
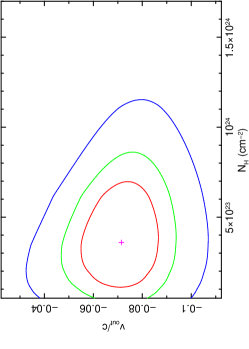
We found that, with the exception of the obscured slice B, the outflow velocity is consistent within errors over all the epochs, ranging from to , while the column density of this lower velocity zone varies among all of the observations. The wind opacity is at its maximum level during the Suzaku observation in 2010 ( cm-2; see Table 2) and it is at its lowest level in slice A with a measured cm-2. Despite this large variation in column density, the fluxes of these two epochs are identical. This likely rules out changes where the absorber is only reacting to the continuum, via changes in ionisation and implies that the absorber variations are intrinsic and due to the column density. Finally we investigated if, in our best-fit models, there is any physical degeneracy between the column density, the ionisation or the outflow velocity. We therefore consider the Suzaku and the non-occulted part of the XMM-Newton & NuSTAR observations and allowed also the ionisation to be independent. In Figure 4 (upper panel) we show the confidence contours obtained for the ionisation versus the for both these observations. Although the elongated shape of the contours suggests some degeneracy between log and , it is clear that the inferred variability of the opacity of this zone of the wind does not depend on the assumption of a constant ionisation. For the Chandra and Swift observations, since the ionisation is poorly constrained, we investigated the dependence of the and the wind velocity. The relative contours for the Swift spectrum are shown in Figure 4 (lower panel).
3.3 Faster outflow components
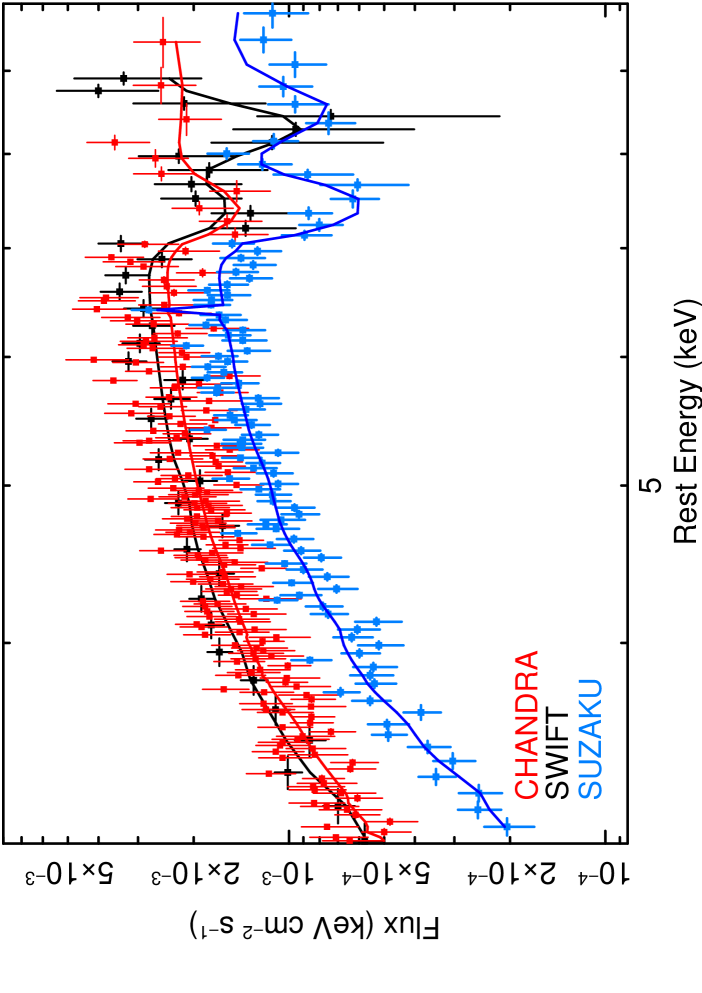
Regarding the second fast zone, responsible for the 8.5 keV absorption feature, the fit substantially improves only for the Suzaku () and Swift () observations. Note that in both cases the fit improvement indicates that this zone is required at a % confidence level. There is no evidence for this zone in the Chandra spectrum, where we are able to derive a rather stringent upper limit for the of this faster zone of cm-2. We found that the column density and outflow velocity (; see Table 2) of this zone are rather similar between the 2010 and 2018 observations, suggesting that our line of sight intercepts a similar inner zone in both observing periods. In Fig. 5 we compare the Suzaku, Chandra and Swift spectra and the best fit models. It is noticeable that during the Swift observation the faster zone is similar to the fast zone detected in 2010. It is also clear that such a zone is not present during the Chandra observation, despite that it caught MCG-03-58-007 at a similar flux level as seen in the 2018 Swift campaign.
As already discussed in B18 and M19, an even faster zone could be present during the 2015 NuSTAR observation () with an outflowing velocity of and an cm-2. In contrast to what was assumed in the previous works, here the ionisation of this zone was tied to the ionisation of the slow component. We note that the assumed value is within the errors of the log previously reported. The imprint of this zone is the absorption structure seen in the NuSTAR spectra at around 10 keV (see Fig. 8 of B18); thereby we cannot assess if it is a persistent or sporadic streamline as it cannot be detected in the other observations, which lack the higher energy bandpass required to detect it.
| Model Component | Parameter | Suzaku | Slice A | Slice B | Chandra | Swift |
|---|---|---|---|---|---|---|
| Primary Power-law | 2.17f | 2.17f | 2.17f | |||
| Norm.a | ||||||
| Neutral absorber | cm-2) | |||||
| Zone 1 | ( cm-2) | |||||
| log | ||||||
| 107.5/3 | ||||||
| Zone 2 | ( cm-2) | |||||
| log | ||||||
| 35.0/2 | ||||||
| (erg cm-2 s-1) | 2.0 | 1.0 | 3.6 | |||
| (erg s-1) | 1.4 | 0.8 | 2.2 | |||
| 230.1/202 | ||||||
4 Discussion
We have presented the analysis of the current X-ray observations of the disk wind in MCG-03-58-007. Here, multiple and variable wind components with velocities ranging from to (and potentially up to ) are seen at different times. Multi epoch observations of disk winds, like the one presented here, are crucial for revealing all the possible phases of the disk wind. For example, over a decade worth of observations of PDS 456 revealed that the wind is most likely clumpy and/or stratified with the ionisation ranging from log ( erg cm s-1 up to log ( erg cm s-1 and velocities ranging from up to (Reeves et al. 2016, 2018a, 2020). It is possible, as suggested in other examples of ultra fast disk winds, that we are looking at a stratified wind, where multiple components are launched at different disk radii, but not all of them are always detected. This adds MCG-03-58-007 to the small but growing list of multiphase fast X-ray winds. Other examples of AGN with at least two variable phases of the X-ray winds are PG 1211+143 (Pounds et al. 2016; Reeves et al. 2018b), IRAS 13224-3809 (Chartas & Canas 2018; Parker et al. 2017; Pinto et al. 2018), 1H 0707-495 (Kosec et al. 2018), IRAS 17020+4544 (Longinotti et al. 20155) and PG 1114+445 (Serafinelli et al. 2019). In those cases, multiple phases with a common or different outflowing velocities are detected in the X-ray band. In contrast to most of the cases reported so far, neither of the two phases seen in MCG-03-58-007 requires a different ionisation (aside from slice B) suggesting that we are seeing different streamlines of the same highly ionized flow. The only exception could be the eclipsing event seen in 2015, where a solution is found with a lower ionisation for the Fe K intervening absorber. However, what we most likely see during this occultation event is a higher density and lower ionisation clump of the wind, which could be faster because its higher opacity makes it easier to accelerate (Waters et al. 2017). Note that this does not imply that the soft X-ray wind components, like the ones seen for example in PDS 456 or PG 1211+143, are not present; in contrast to the other examples, MCG-03-58-007 is seen through a relatively high column density ( cm-2, see Table 2) neutral absorber, therefore these phases may be hidden behind it. MCG-03-58-007 is not the only example where multiple Fe-K zones with the same ionisation and outflowing with different velocities had been detected in a single observation. For instance, two simultaneous Fe-K phases were detected at least twice in PDS456 (Reeves et al. 2018a, 2020) and possibly in PG 1211+143 (Pounds et al. 2016) and IRAS 13349+2438 (Parker et al. 2020).
We now discuss the properties of the various phases of the disk wind and the implications for the overall energetics. Evidently, if we want to understand the possible impact of the disk wind on the host galaxy, it is important not only to estimate the mass outflow rate and kinetic energy that the outflow can transport at a specific epoch, but also to account for all the phases of the wind and their variability. Crucially, what we need to establish is whether or not the wind is persistent and if variable, its average kinetic energy. Overall, the wind detected in MCG-03-58-007 is at least composed by two variable zones: a persistent slow component with an outflow velocity of and a sporadic second faster zone with a velocity of .
4.1 The slower outflow component
For the estimate of the outflow rates, we first concentrate on the lowest velocity zone, because it is clear that this phase (zone 1) is persistent as it is detected in all the observations analysed so far. We note that this zone shows an extreme variability with both long and short term variations of the , suggesting that the wind is inhomogeneous. While the of this zone varies among the different epochs, the velocity appears to be constant within the errors (see Table 2, slice B excepted). In particular, while the hard X-ray luminosity varies by a factor of (see Table 2), the wind does not appear to directly respond to it in either velocity or ionization.
Our interpretation is that we are most likely seeing the same component, which is always present but clumpy as indeed we have already witnessed an occultation event, when during slice B our line of sight intercepted a higher opacity clump of the wind (see Table LABEL:tab:bestfits).
The crucial parameter needed to infer the energetics of the disk wind is its mass outflow rate (). This can be derived using the equation (see Nardini et al. 2015):
| (1) |
where is a constant factor set to for solar abundances, is the wind solid angle, is the disk wind radius, and are the column density and the velocity of the disk wind.
Since we do not know the exact geometry for MCG-03-58-007, following the same argument presented in Gofford et al. (2015) and Tombesi et al. (2013), we assumed that the wind subtends . Indeed, the systematic search of fast disk winds in bright nearby local AGN resulted in a detection rate of about 40%, suggesting these winds have a wide opening angle. Note that a large solid angle of about was derived for the wind in PDS 456 from its P-Cygni Fe K profile (Nardini et al. 2015).
The main parameter that we now need to quantify is the launching radius of the wind; a lower limit of the radial distance can be derived from the outflow velocity assuming that the wind is launched at its escape radius . We note that by adopting this radius, we derive the most conservative estimate of the mass outflow rate and energetics (see Gofford et al. 2013; Tombesi et al. 2012).
As the main uncertainty in this latter equation is the black hole mass of MCG-03-58-007, we decided to normalise the mass outflow rate to the Eddington rate:
| (2) |
where is the Thomson cross section and is the accretion efficiency. Thus combining equation (1) and (2) and substituting for we obtain:
| (3) |
The kinetic power () of the wind can also be normalised to the Eddington luminosity (). Thus substituting for and the wind kinetic power is:
| (4) |
| Observation | parameter | zone 1a | zone |
| Suzaku 2010 | |||
| log | 44.5 | ||
| () | 2.7 | 2.0 | |
| XMM-NuSTAR2015 slice A | |||
| log | 44.0 | ||
| () | 0.9 | 1.0 | |
| Chandra 2016 | |||
| log | 44.1 | ||
| () | 1.2 | ||
| Swift 2018 | |||
| log | 44.1 | 44.8 | |
| () | 1.2 | 2.3 | |
| ALMAd | (yr-1) | 54 | |
| ALMA | log | 42 | |
| ALMA | () | 0.8 |
In Table 3 we report the resulting values for all the phases of the X-ray wind; there we list the outflow rate () and the kinetic output () of the wind normalised to the Eddington rates. The errors are calculated by propagating the 90% errors on the column density and velocity of the disk wind (see Table 2). It is clear that the wind seen during the Suzaku observation, with a higher and , is much stronger than during the XMM-Newton slice A. On the other hand, the wind seen in the Chandra and Swift spectra, because of the large errors, could be consistent with either of the two previous epochs. While all the derived are a substantial fraction of the Eddington rate, the are typically constrained in MCG-03-58-007 to within 1-3% of Eddington, in line with the typical estimates for powerful winds in other AGN (e.g. Gofford et al. 2015).
In order to compare the disk wind kinematics with the ones reported for the possible kpc-scale molecular outflow (Sirressi et al. 2019), we considered the values obtained for the persistent component (zone 1) and converted the to the absolute values of the kinetic output by adopting the estimated black hole mass of MCG-03-58-007 of M⊙ (see B18 and Sirressi et al. 2019). The kinetic power of this zone ranges from erg s-1, as measured during the first part of the XMM-Newton observations, to erg s-1 for the Suzaku observation (see Table 3).
Thus on average the derived kinetic output of this zone is of the order of erg s-1, which is , where the bolometric luminosity of MCG-03-58-007 is erg s-1(B18). Regardless of the variability, all the estimates of the kinetic energy of the X-ray wind are at least two orders of magnitude above the kinetic energy carried by the molecular gas phase (with ranging from to ; Sirressi et al. 2019). Note that, despite the large errors on the and the uncertainties on the black hole mass, we cannot reconcile the different measurements of the X-ray wind energetics versus the large scale CO wind. Even if we consider the lowest possible measurement of (e.g the 90% lower value for the Swift observation, see Table 3) we derive erg s-1. Therefore we would need a times smaller black hole mass (e. g. ) to have erg s-1in order to be compatible with the CO wind kinetic power. This is implausible, because such a low black hole mass would make MCG-03-58-007 a super Eddington source, given its bolometric luminosity of erg s-1.
The momentum rate of the X-ray wind is ; here was calculated again by adopting M⊙. The momentum rates of the disk wind listed in Table 3 are all normalised to the momentum rate of the radiation . Hence the X-ray wind momentum rate ranges from (slice A) to (Suzaku observation). Although these estimates are clearly affected by large uncertainties, the momentum rates derived in each of the observations is of the same order of the radiation momentum rate (see Table 3), suggesting that this stream of the wind could be radiation driven with only a moderate force multiplier.
We note that the momentum rate of the molecular outflow is consistent with that of the X-ray wind suggesting that the outflow is more likely to be momentum rather than energy conserving on large scales. A similar scenario also applies to other powerful X-ray winds such as PDS 456 (Bischetti et al. 2019), IZw 1 (Reeves & Braito 2019), IRASF 11119 + 3257 (Veilleux et al. 2017; Nardini & Zubovas 2018) and the high redshift QSO, APM 08279 + 5255 (Feruglio et al. 2017). We note that recent hydrodynamical simulations of small scale winds in galaxies predict larger scale energy conserving winds, because the Compton cooling times are expected to be short compared to the dynamical times of the inner winds (Costa et al. 2020), meaning the solely momentum-driven wind can hardly happen. It is possible that a more energetic large scale outflow is present in MCG-03-58-007, but it is ionized rather than molecular gas. Interestingly, in the optical spectrum from the 6dF Galaxy Survey (6dFGS, Jones et al. 2009), there is evidence for possible blue wings in the profiles of the [O III] Å emission lines blue-shifted by km s-1; unfortunately from the currently available spectrum we cannot derive an estimate on the morphology and energetics of this possible ionised large scale outflow. Future spatially resolved optical spectroscopy using the VLT Multi-Unit Spectroscopic Explorer (MUSE) could reveal the structure and kinematics of this ionised component of the large scale outflow and provide an estimate its energetics, which could then be compared with the X-ray and large scale molecular winds.
We would like to stress the following consideration; had we not witnessed that the slice B spectrum is due to a rare occultation event, as if for example this was the only observation of the wind, we would have inferred an incomplete picture of the disk wind. First of all, we note that with the finer grid we now measure a less extreme wind parameters of and , which are similar to the values measured during the Suzaku observation. However, if the wind is at the escape radius, which can be derived from ( cm), its ionisation should be higher, of the order of log(. This can be derived using the relation 333where is the ionising luminosity in the 1-1000 Rydberg range ( erg s-1 as derived in B18) and is density of the gas assuming that the size of the absorber is . However, if we adopt the more realistic location of the wind of cm, as derived by B18 from the absorption variability, we infer a much higher mass outflow rate (). The kinetic output would be of the order of 10% of . These more extreme values are likely implausible and the transient nature of the slice B absorption suggests that this is due to a passing wind clump of higher than usual density (and consequently lower ionisation). Such clumps likely have a lower filling factor which is confirmed by the fact that this state is seen only once among all the 11 observations (see Table 1) that we have for MCG-03-58-007. We note that no spectral variability was seen amongst all the Swift observations, whereas an obscuration event like the one seen in slice B, would have been easily detected. In particular, although we could not characterise the wind in each of the short Swift observations, we would have been able to detect the strong curvature imprinted by this denser patch in the 3-6 keV band. This stresses even more the importance of multi epoch observations to understand the nature of the X-ray winds.
4.2 Faster outflow components
Regarding the two faster zones of the X-ray wind, which are outflowing with and with , a possible scenario is that they are innermost streamlines of the wind closer to the black hole. In the discussion below, we concentrate on the outflow, which has been independently confirmed in two of the observations.
For the component outflowing with , from its velocity we can infer that this zone is most likely launched at a distance of cm (or ); this implies that the density has to be of the order of cm-3 so that the iron is not fully ionized and we are able to detect it. This in turn implies a rather small size scale for the streamline or clumps of the wind of cm, which is comparable to the X-ray source size (). Thanks to the multi epochs observations, it is now clear that zone 2 is sporadic; indeed, we can place a rather stringent upper limit on the of this zone to be less than cm-2 during the Chandra observation (see Fig. 5).
The appearance of this zone seems to be irregular and uncorrelated to the X-ray luminosity. A possible scenario is that this faster zone is always present but, being launched from closer in, is generally more ionized and we are able to detect it only when our line of sight intercepts, like in slice B, a denser and/or lower ionisation clumps. Alternatively it is possible that this inner streamline corresponds to different ejecta events. In terms of its energetics, while its mass outflow rate is smaller or comparable to the mass carried by the slower phase of the wind, the kinetic output is higher given the higher velocity and could be of the order of erg s-1, which correspond to % of . Taken at face value this would imply that this phase could be even more important in terms of the feedback on the host galaxy. Nonetheless, as this phase could be intermittent, the derived kinetic output, although apparently high, may not be important in terms of its feedback as the fast component could be a short lived phase.
We have very recently performed a new series of four simultaneous XMM-Newton & NuSTAR observations of MCG-03-58-007, covering a time period of a month, that will allow us to probe the short term variability of the wind and if and how it reacts to changes of the X-ray source luminosity. These observations will crucially allow us also to probe the connection between the two faster zones of the wind (Braito et al. in prep.).
5 acknowledgements
We thank the referee for his/her useful comments that improved the paper. This research has made use of data obtained from Suzaku, a collaborative mission between the space agencies of Japan (JAXA) and the USA (NASA). Based on observations obtained with XMM-Newton, an ESA science mission with instruments and contributions directly funded by ESA Member States and the USA (NASA). This work is based on observations obtained with the Neil Gehrels Swift Observatory. This work has been partially supported by the ASI-INAF program I/004/11/4. This work made use of data from the NuSTAR mission, a project led by the California Institute of Technology, managed by the Jet Propulsion Laboratory, and funded by NASA. This research has made use of the NuSTAR Data Analysis Software (NuSTARDAS) jointly developed by the ASI Science Data Center and the California Institute of Technology. VB acknowledges financial support through the NASA grant 80NSSC20K0793 and the Chandra grant GO7-18091X. VB, RDC, PS and RS acknowledge financial contribution from the agreements ASI-INAF n.2017-14-H.0. GAM is supported by ESA research fellowships.
6 Data Availability
The data used for this research can be accessed at https://heasarc.gsfc.nasa.gov/docs/archive.html.
References
- Bischetti et al. (2019) Bischetti, M., Piconcelli, E., Feruglio, C., et al. 2019, A&A, 628, A118
- Braito et al. (2018) Braito, V., Reeves, J. N., Matzeu, G. A., et al. 2018, MNRAS, 479, 3592
- Chartas et al. (2002) Chartas, G., Brandt, W. N., Gallagher, S. C., & Garmire, G. P. 2002, ApJ, 579, 169
- Chartas & Canas (2018) Chartas, G., & Canas, M. H. 2018, ApJ, 867, 103
- Cicone et al. (2014) Cicone, C., Maiolino, R., Sturm, E., et al. 2014, A&A, 562, A21
- Cicone et al. (2015) Cicone, C., Maiolino, R., Gallerani, S., et al. 2015, A&A, 574, A14
- Costa et al. (2020) Costa, T., Pakmor, R., & Springel, V. 2020, arXiv e-prints, arXiv:2006.05997
- Dickey & Lockman (1990) Dickey, J. M., & Lockman, F. J. 1990, ARA&A, 28, 215
- Di Matteo et al. (2005) Di Matteo, T., Springel, V., & Hernquist, L. 2005, Nature, 433, 604
- Faucher-Giguère & Quataert (2012) Faucher-Giguère, C.-A., & Quataert, E. 2012, MNRAS, 425, 605
- Fiore et al. (2017) Fiore, F., Feruglio, C., Shankar, F., et al. 2017, A&A, 601, A143
- Fruscione et al. (2006) Fruscione, A., McDowell, J. C., Allen, G. E., et al. 2006, Proc. SPIE, 6270, 62701V
- Ferrarese & Merritt (2000) Ferrarese, L., & Merritt, D. 2000, ApJ, 539, L9
- Feruglio et al. (2015) Feruglio, C., Fiore, F., Carniani, S., et al. 2015, A&A, 583, A99
- Feruglio et al. (2017) Feruglio, C., Ferrara, A., Bischetti, M., et al. 2017, A&A, 608, A30
- Fukumura et al. (2010) Fukumura, K., Kazanas, D., Contopoulos, I., & Behar, E. 2010, ApJ, 715, 636
- Fukumura et al. (2017) Fukumura, K., Kazanas, D., Shrader, C., et al. 2017, Nature Astronomy, 1, 0062
- Gandhi et al. (2009) Gandhi, P., Horst, H., Smette, A., et al. 2009, A&A, 502, 457
- Garmire et al. (2003) Garmire, G. P., Bautz, M. W., Ford, P. G., Nousek, J. A., & Ricker, G. R., Jr. 2003, Proc. SPIE, 4851, 28
- Gebhardt et al. (2000) Gebhardt, K., Bender, R., Bower, G., et al. 2000, ApJ, 539, L13
- Giustini & Proga (2012) Giustini, M., & Proga, D. 2012, ApJ, 758, 70
- Gofford et al. (2013) Gofford, J., Reeves, J. N., Tombesi, F., et al. 2013, MNRAS, 430, 60
- Gofford et al. (2015) Gofford, J., Reeves, J. N., McLaughlin, D. E., et al. 2015, MNRAS, 451, 4169
- Harrison et al. (2013) Harrison, F. A., Craig, W. W., Christensen, F. E., et al. 2013, ApJ, 770, 103
- Jones et al. (2009) Jones, D. H., Read, M. A., Saunders, W., et al. 2009, MNRAS, 399, 683
- Hopkins & Elvis (2010) Hopkins, P. F., & Elvis, M. 2010, MNRAS, 401, 7
- Kallman et al. (2004) Kallman, T. R., Palmeri, P., Bautista, M. A., Mendoza, C., & Krolik, J. H. 2004, ApJS, 155, 675
- Kato et al. (2004) Kato, Y., Mineshige, S., & Shibata, K. 2004, ApJ, 605, 307
- Kazanas et al. (2012) Kazanas, D., Fukumura, K., Behar, E., Contopoulos, I., & Shrader, C. 2012, The Astronomical Review, 7, 92
- King & Pounds (2003) King, A. R., & Pounds, K. A. 2003, MNRAS, 345, 657
- King (2010) King, A. R. 2010, MNRAS, 402, 1516
- King et al. (2011) King, A. R., Zubovas, K., & Power, C. 2011, MNRAS, 415, L6
- King & Pounds (2015) King, A., & Pounds, K. 2015, ARA&A, 53, 115
- Kosec et al. (2018) Kosec, P., Buisson, D. J. K., Parker, M. L., et al. 2018, MNRAS, 481, 947
- Krongold et al. (2007) Krongold, Y., Nicastro, F., Elvis, M., et al. 2007, ApJ, 659, 1022
- Longinotti et al. (2015) Longinotti, A. L., Krongold, Y., Guainazzi, M., et al. 2015, ApJ, 813, L39
- Longinotti et al. (2018) Longinotti, A. L., Vega, O., Krongold, Y., et al. 2018, ApJ, 867, L11
- Magorrian et al. (1998) Magorrian, J., Tremaine, S., Richstone, D., et al. 1998, AJ, 115, 2285
- Mitsuda et al. (2007) Mitsuda, K., et al. 2007, PASJ, 59, 1
- Matzeu et al. (2017) Matzeu, G. A., Reeves, J. N., Braito, V., et al. 2017, MNRAS, 472, L15
- Matzeu et al. (2019) Matzeu, G. A., Braito, V., Reeves, J. N., et al. 2019, MNRAS, 483, 2836
- Mewe et al. (1985) Mewe, R., Gronenschild, E. H. B. M., & van den Oord, G. H. J. 1985, A&AS, 62, 197
- Mizumoto et al. (2019) Mizumoto, M., Izumi, T., & Kohno, K. 2019, ApJ, 871, 156
- Murphy & Yaqoob (2009) Murphy, K. D., & Yaqoob, T. 2009, MNRAS, 397, 1549
- Nandra et al. (2007) Nandra, K., O’Neill, P. M., George, I. M., & Reeves, J. N. 2007, MNRAS, 382, 194
- Nardini et al. (2015) Nardini, E., Reeves, J. N., Gofford, J., et al. 2015, Science, 347, 860
- Nardini & Zubovas (2018) Nardini, E., & Zubovas, K. 2018, MNRAS, 478, 2274
- Parker et al. (2017) Parker, M. L., Pinto, C., Fabian, A. C., et al. 2017, Nature, 543, 83
- Parker et al. (2020) Parker, M. L., Matzeu, G. A., Alston, W. N., et al. 2020, MNRAS, 498, L140
- Pinto et al. (2018) Pinto, C., Alston, W., Parker, M. L., et al. 2018, MNRAS, 476, 1021
- Pounds et al. (2003) Pounds, K. A., Reeves, J. N., King, A. R., et al. 2003, MNRAS, 345, 705
- Pounds et al. (2016) Pounds, K., Lobban, A., Reeves, J., et al. 2016, MNRAS, 457, 2951
- Proga et al. (2000) Proga, D., Stone, J. M., & Kallman, T. R. 2000, ApJ, 543, 686
- Proga & Kallman (2004) Proga, D., & Kallman, T. R. 2004, ApJ, 616, 688
- Reeves et al. (2003) Reeves, J. N., O’Brien, P. T., & Ward, M. J. 2003, ApJ, 593, L65
- Reeves et al. (2009) Reeves, J. N., O’Brien, P. T., Braito, V., et al. 2009, ApJ, 701, 493
- Reeves et al. (2014) Reeves, J. N., Braito, V., Gofford, J., et al. 2014, ApJ, 780, 45
- Reeves et al. (2016) Reeves, J. N., Braito, V., Nardini, E., et al. 2016, ApJ, 824, 20
- Reeves et al. (2018a) Reeves, J. N., Braito, V., Nardini, E., et al. 2018a, ApJ, 854, L8
- Reeves et al. (2018b) Reeves, J. N., Lobban, A., & Pounds, K. A. 2018b, ApJ, 854, 28
- Reeves & Braito (2019) Reeves, J. N., & Braito, V. 2019, ApJ, 884, 80
- Reeves et al. (2020) Reeves, J. N., Braito, V., Chartas, G., et al. 2020, ApJ, 895, 37
- Saez & Chartas (2011) Saez, C., & Chartas, G. 2011, ApJ, 737, 91
- Serafinelli et al. (2019) Serafinelli, R., Tombesi, F., Vagnetti, F., et al. 2019, A&A, 627, A121
- Sim et al. (2008) Sim, S. A., Long, K. S., Miller, L., & Turner, T. J. 2008, MNRAS, 388, 611
- Sim et al. (2010) Sim, S. A., Proga, D., Miller, L., Long, K. S., & Turner, T. J. 2010, MNRAS, 408, 1396
- Sirressi et al. (2019) Sirressi, M., Cicone, C., Severgnini, P., et al. 2019, MNRAS, 489, 1927
- Tombesi et al. (2010) Tombesi, F., Cappi, M., Reeves, J. N., et al. 2010, A&A, 521, A57
- Tombesi et al. (2012) Tombesi, F., Cappi, M., Reeves, J. N., & Braito, V. 2012, MNRAS, 422, L1
- Tombesi et al. (2013) Tombesi, F., Cappi, M., Reeves, J. N., et al. 2013, MNRAS, 430, 1102
- Tombesi et al. (2015) Tombesi, F., Meléndez, M., Veilleux, S., et al. 2015, Nature, 519, 436
- Tombesi et al. (2017) Tombesi, F., Veilleux, S., Meléndez, M., et al. 2017, ApJ, 850, 151
- Veilleux et al. (2017) Veilleux, S., Bolatto, A., Tombesi, F., et al. 2017, ApJ, 843, 18
- Waters et al. (2017) Waters, T., Proga, D., Dannen, R., et al. 2017, MNRAS, 467, 3160
- Wilms et al. (2000) Wilms, J., Allen, A., & McCray, R. 2000, ApJ, 542, 914
- Zubovas & King (2012) Zubovas, K., & King, A. 2012, ApJ, 745, L34
- Zubovas & King (2016) Zubovas, K., & King, A. 2016, MNRAS, 462, 4055