Field-induced quantum critical point in the new itinerant antiferromagnet Ti3Cu4
Abstract
New phases of matter emerge at the edge of magnetic instabilities, which can occur in materials with moments that are localized, itinerant or intermediate between these extremes. In local moment systems, such as heavy fermions, the magnetism can be tuned towards a zero-temperature transition at a quantum critical point (QCP) via pressure, chemical doping, and, rarely, magnetic field. By contrast, in itinerant moment systems, QCPs are more rare, and they are induced by pressure or doping, and there are no known examples of field-induced transitions. This means that no universal behaviour has been established across the whole itinerant-to-local moment range, a substantial gap in our knowledge of quantum criticality. Here we report the discovery of a new itinerant antiferromagnet Ti3Cu4 that can be tuned to a QCP by a small magnetic field. We see signatures of quantum criticality and the associated non-Fermi liquid behaviour in thermodynamic and transport measurements, while band structure calculations point to an orbital-selective, spin density wave ground state, a consequence of the square net structural motif in Ti3Cu4. Ti3Cu4 thus provides a platform for the comparison and generalisation of quantum critical behaviour across the whole spectrum of magnetism.
Quantum critical points (QCPs) emerge upon the continuous (second order) suppression of magnetic order to zero temperature via a non-thermal tuning parameters such as doping, pressure or magnetic field. The interplay of magnetism, electron correlations, and quantum critical fluctuations in the vicinity of quantum phase transitions (QPTs) has been linked to novel emergent physics like unconventional superconductivity Johnston (2010); Keimer et al. (2015); Dai et al. (2012); Dai (2015), non-Fermi liquid (NFL) behavior Julian et al. (1998); Stewart (2001); Löhneysen et al. (2007); Coleman et al. (2001), and heavy fermion behavior Schröder et al. (2000); Custers et al. (2003); Gegenwart et al. (2008a).
Even though QPTs have been induced by pressure and doping in numerous systems, including local and itinerant magnetic compounds, these tuning parameters present experimental challenges: the former often requires experimentally difficult high pressure values to suppress the transition to , while the latter results in convoluted effects of disorder and quantum criticality, often difficult to resolve separately. Magnetic field appears as an advantageous tuning parameter to study quantum criticality Heuser et al. (1998), although there are much fewer experimental observations of field-induced QCPs. Field induced quantum criticality has been reported in the heavy-fermions YbRh2Si2 Gegenwart et al. (2002, 2006, 2008b), YbAgGe Tokiwa et al. (2013), CePdAl Zhao et al. (2019), CeCoIn5 Paglione et al. (2003), CeAuSb2 Balicas et al. (2005), YbPtIn Morosan et al. (2006), CePtIn4 Das et al. (2019), Bose-Einstein condensates (BECs) in quantum magnets Zapf et al. (2014), or the metamagnets with either f electrons as in CeRu2Si2 Daou et al. (2006) and UCoAl Aoki et al. (2011), or d electrons in Sr3Ru2O7 Tokiwa et al. (2016); Grigera et al. (2003); Rost et al. (2009); A. et al. (2001). No universal behavior can so far be established across the whole itinerant-to-local moment range Hertz (1976); Millis (1993); Gegenwart et al. (2008a); Millis et al. (2002); Belitz and Kirkpatrick (2017), in large because of the complexities associated with local moments hybridizing with conduction electrons. It thus seems advantageous to study purely itinerant magnets, i.e., magnetic systems with no partially filled electronic shells. While the only known such itinerant magnets ZrZn2 Matthias and Bozorth (1958); Sokolov et al. (2006), Sc3.1In Matthias et al. (1961); Svanidze et al. (2015a), and TiAu Svanidze et al. (2015b, 2017), have been tuned to QCPs by doping, the lack of experimental observation of field-induced QCPs in the extreme limit of itinerant moments is likely a reflection of the larger magnetic energy scales associated with d-electron systems compared to their f-electron counterparts. Furthermore, the magnetism in Cr, the prototypical spin-density wave (SDW) system, can be suppressed to a QCP with doping Yeh et al. (2002); Jaramillo et al. (2009) or pressure Jaramillo et al. (2010), but magnetic field has little or no effect on the ordering temperature Fawcett (1988). On the other hand, Sr3Ru2O7 Tokiwa et al. (2016); Grigera et al. (2003); Rost et al. (2009); A. et al. (2001), a paramagnet in zero magnetic field, can be tuned to a quantum critical end point (QCEP), where a line of first-order itinerant metamagnetic transitions terminates at = 0, motivating new theories of first-order metamagnetic itinerant quantum criticality Millis et al. (2002); Belitz and Kirkpatrick (2017). Thus the experimental realization of a field-induced second-order QPT in a purely itinerant magnetic system has until now remained elusive.
Here we report the discovery of the itinerant antiferromagnetic (AFM) metal Ti3Cu4, where Ti and Cu have empty or filled d shells, and therefore neither carry a local moment. The Néel temperature 11.3 K is continuously suppressed to zero at a magnetic field-induced QCP at a critical field T. Concurrently, the magnetic Grüneisen ratio diverges as and , with a sign change and divergence in at , accompanied by a NFL-FL crossover. The continuous suppression of the magnetic order to by magnetic field, together with the divergence of thermodynamic properties (such as the magnetic Grüneisen ratio) are the benchmarks for identifying QPTs. Ti3Cu4 provides a unique platform to study a field-induced QCP at a low field scale for a d-electron itinerant magnet, and without the complexities of the interplay between local and itinerant moments.
I Results
Flux-grown single crystals form as flat plates, with typical dimensions of 2 mm 2 mm 0.5 mm (Fig. 1). Ti3Cu4 crystallizes in the tetragonal space group Schubert et al. (1964). The crystal growth and structural characterization details are given in the Methods. X-ray diffraction measurements with the beam incident on the as-grown surface reveal a series of sharp Bragg reflections shown in Fig. 1a, consistent with the symmetry. This layered structure shown in Fig. 1a, right, contains two different crystallographic sites for both Cu (light and dark red) and Ti (light and dark blue). Alternating layers of Ti are arranged in buckled (Ti1) and square (Ti2) nets, separated by staggered buckled nets of Cu. The connectivity of the Ti2 atoms in Ti3Cu4 is likely responsible for its remarkable electronic and magnetic properties, as discussed below.
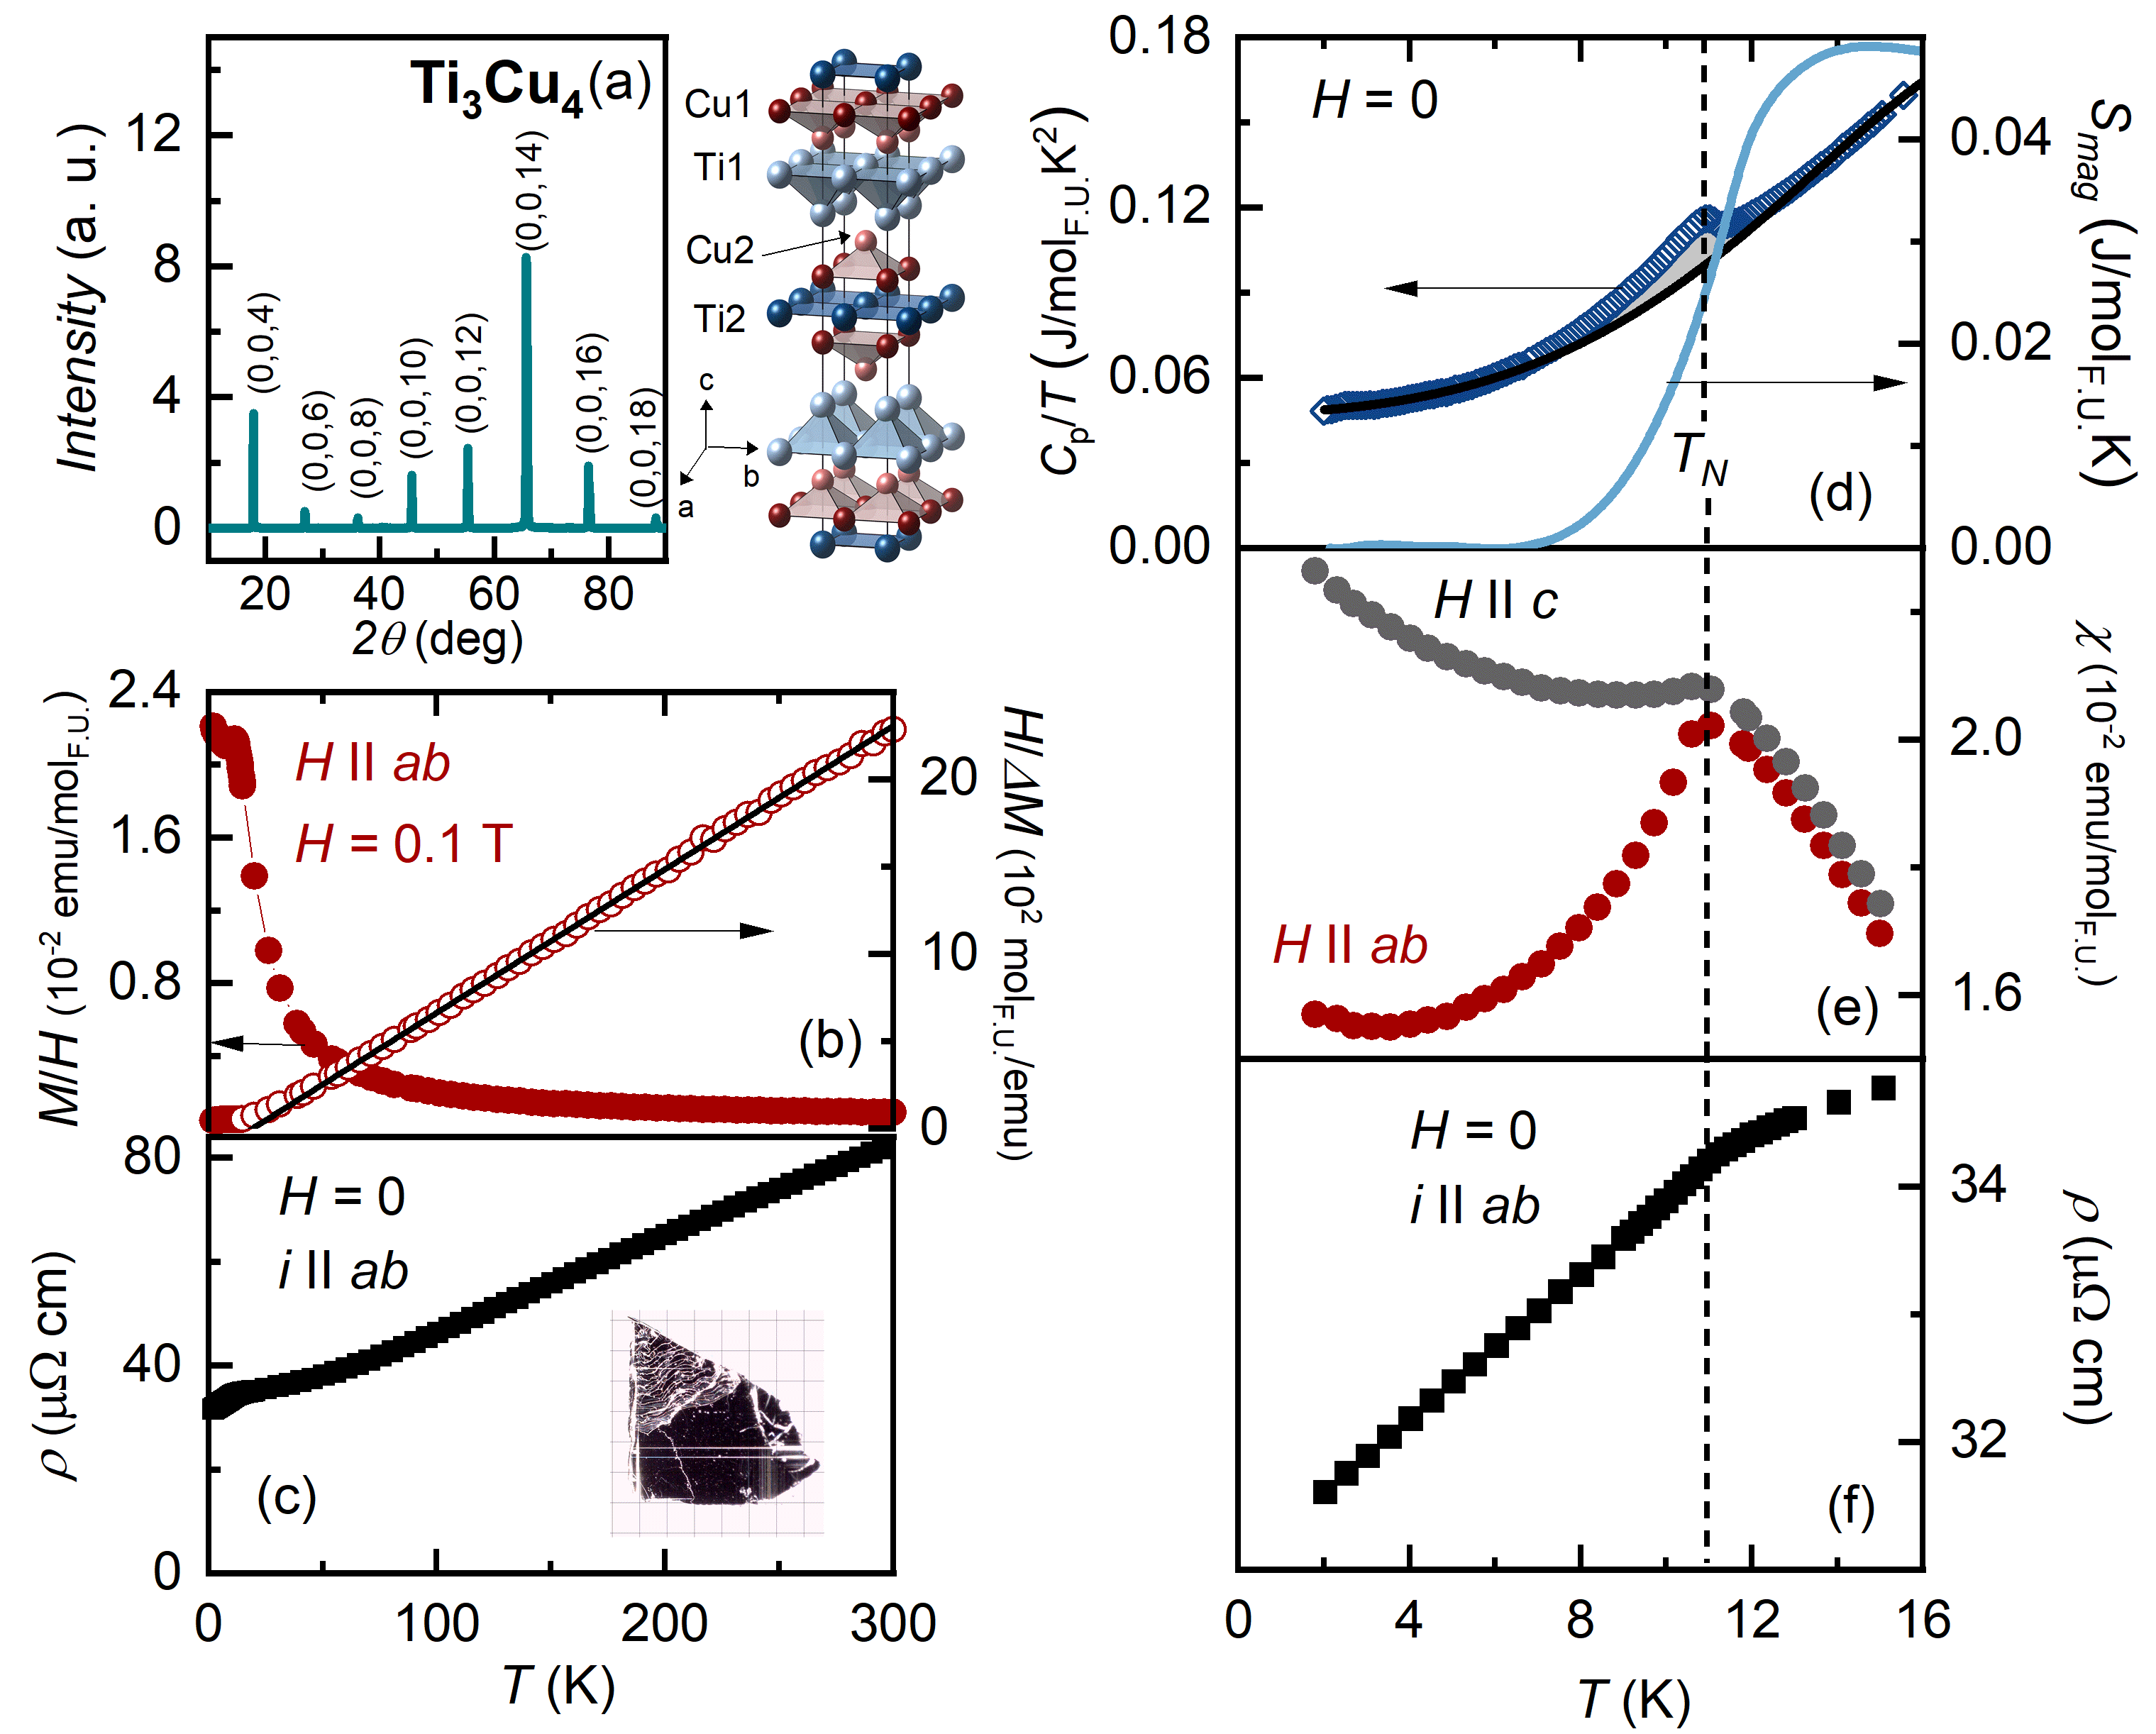
The DC magnetic susceptibility for T (Fig. 1b, full symbols, left axis), shows Curie-Weiss-like temperature dependence, with no irreversibility in the field-cooled (FC) and zero-field-cooled (ZFC) data. Throughout the paper, only ZFC data is shown for clarity. Indeed, the inverse susceptibility is linear in down to 20 K (Fig. 1b, open symbols, right axis), where corresponds to the magnetization after a small temperature-independent Pauli term, = 4.5 10-4 emu/molF.U., has been subtracted. In the same temperature range, = 0 resistivity measurements (Fig. 1c) reveal the metallic character of Ti3Cu4, as decreases monotonically with decreasing T, before a drop at the lowest temperatures. Together, these two measurements provide preliminary indication of itinerant moment magnetism in Ti3Cu4, which will be more convincingly demonstrated once the nature of the low temperature phase transition is established.
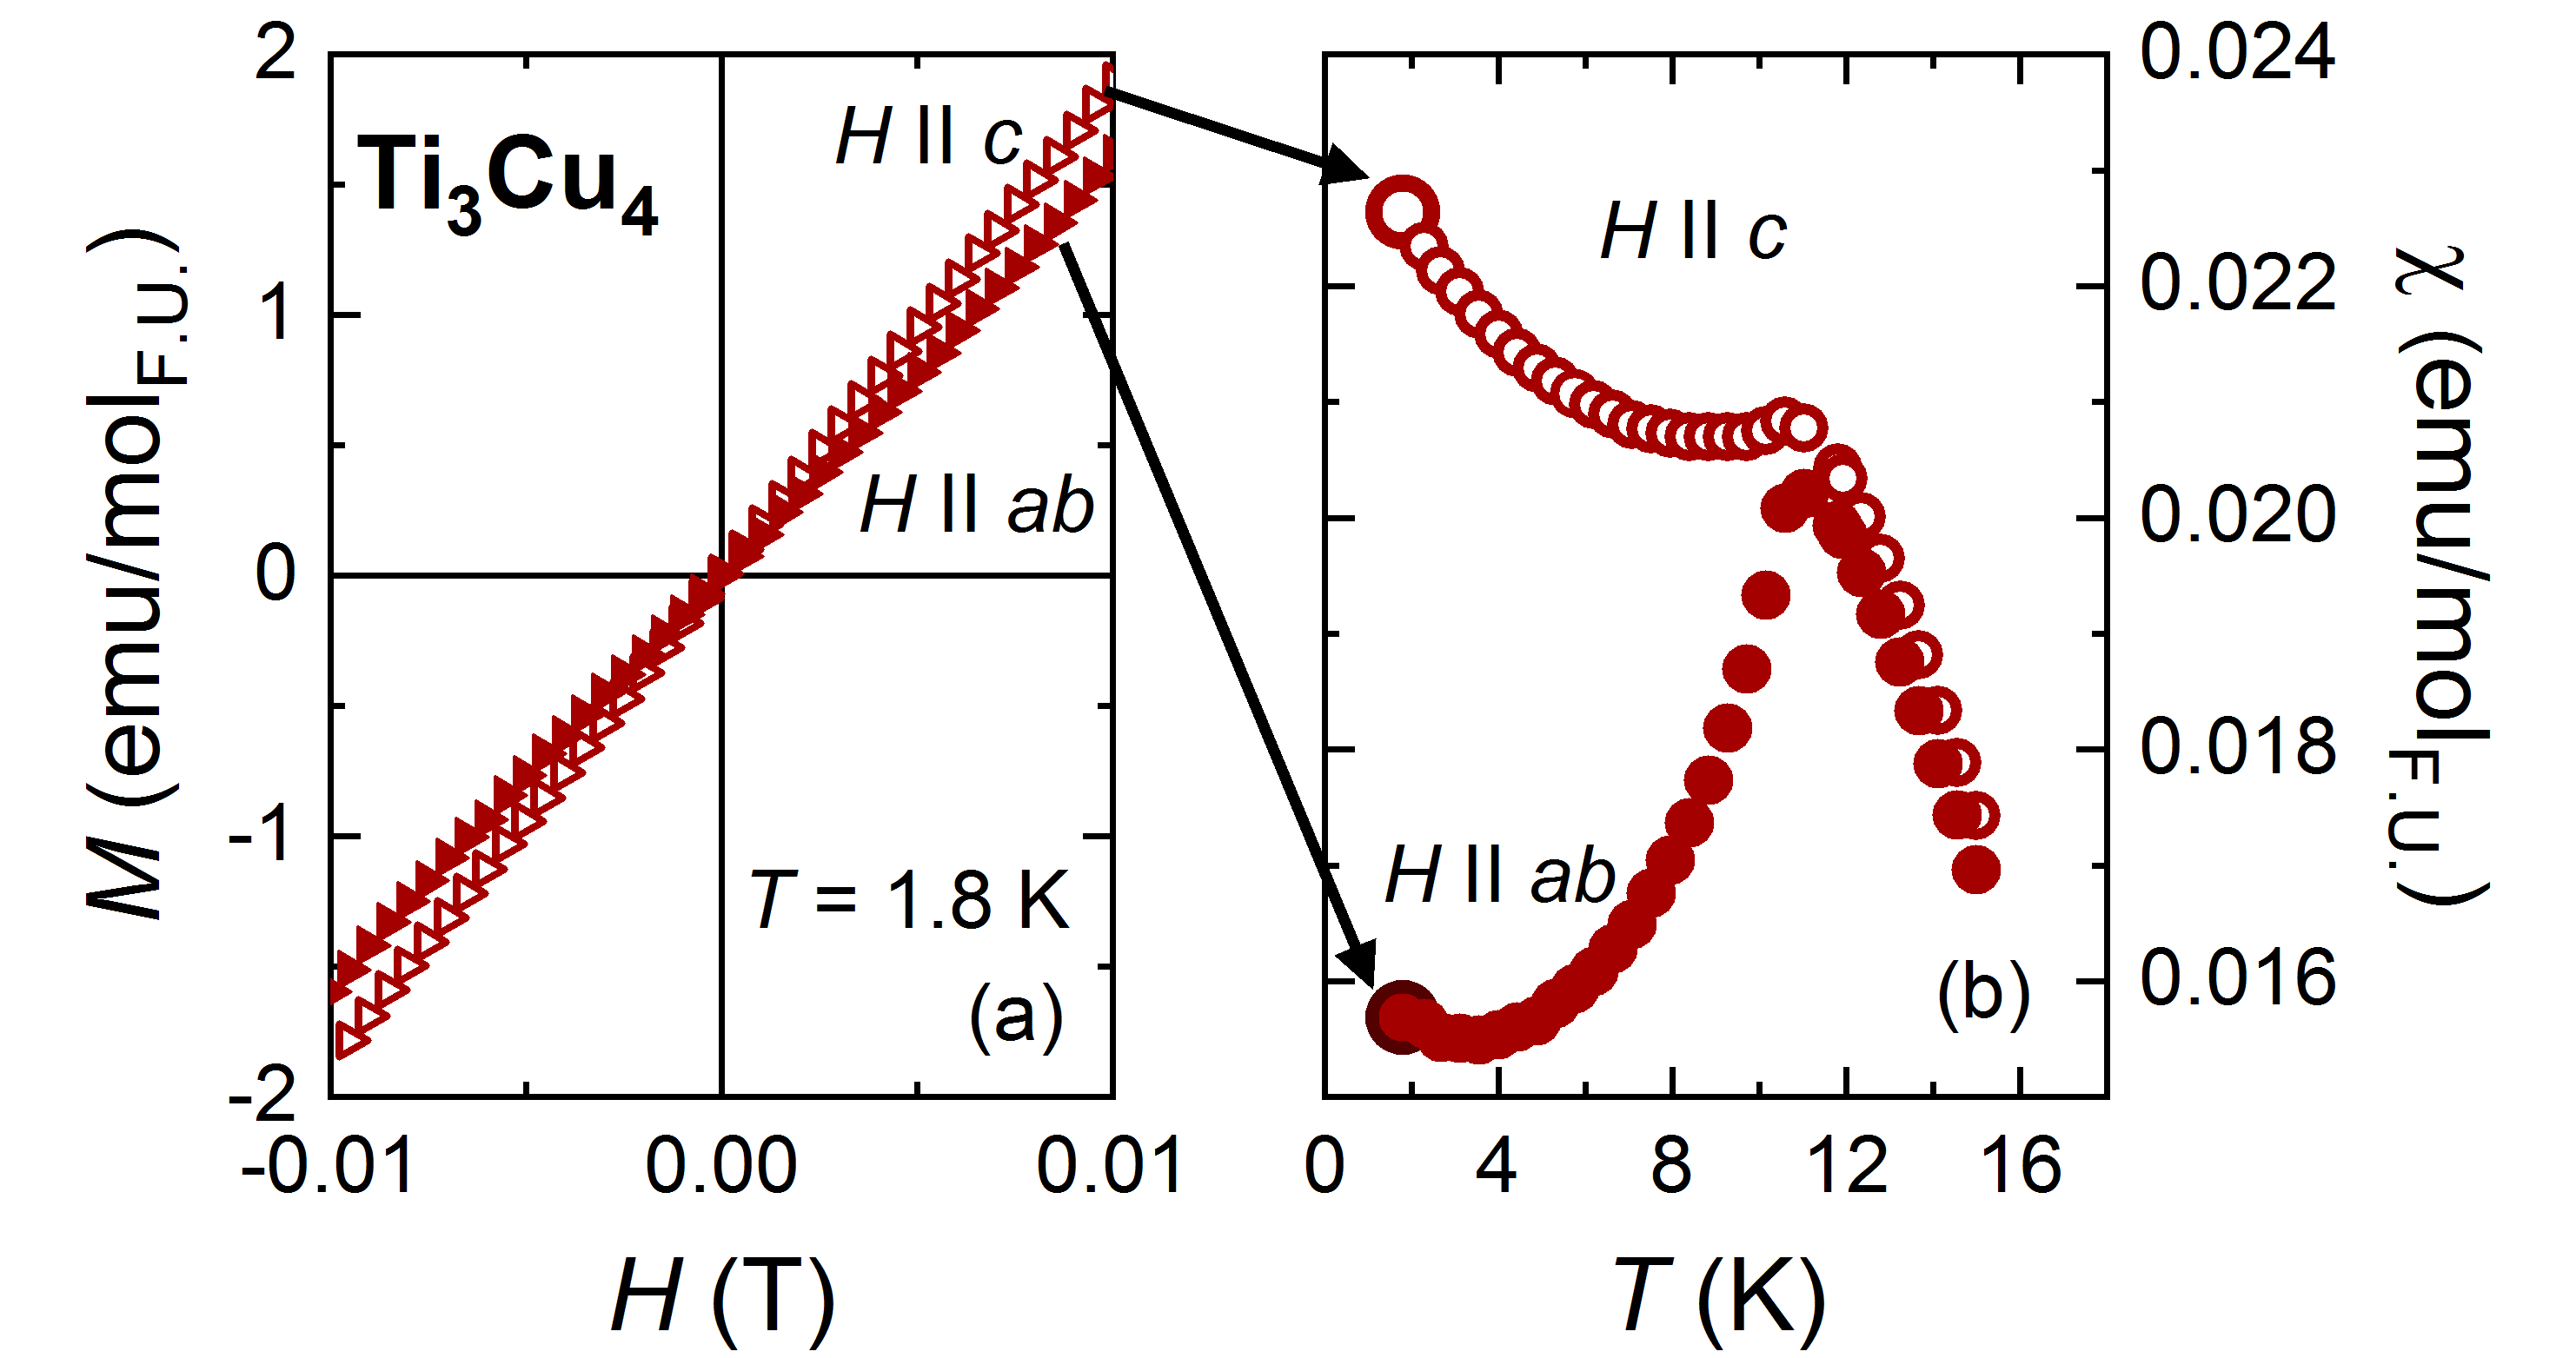
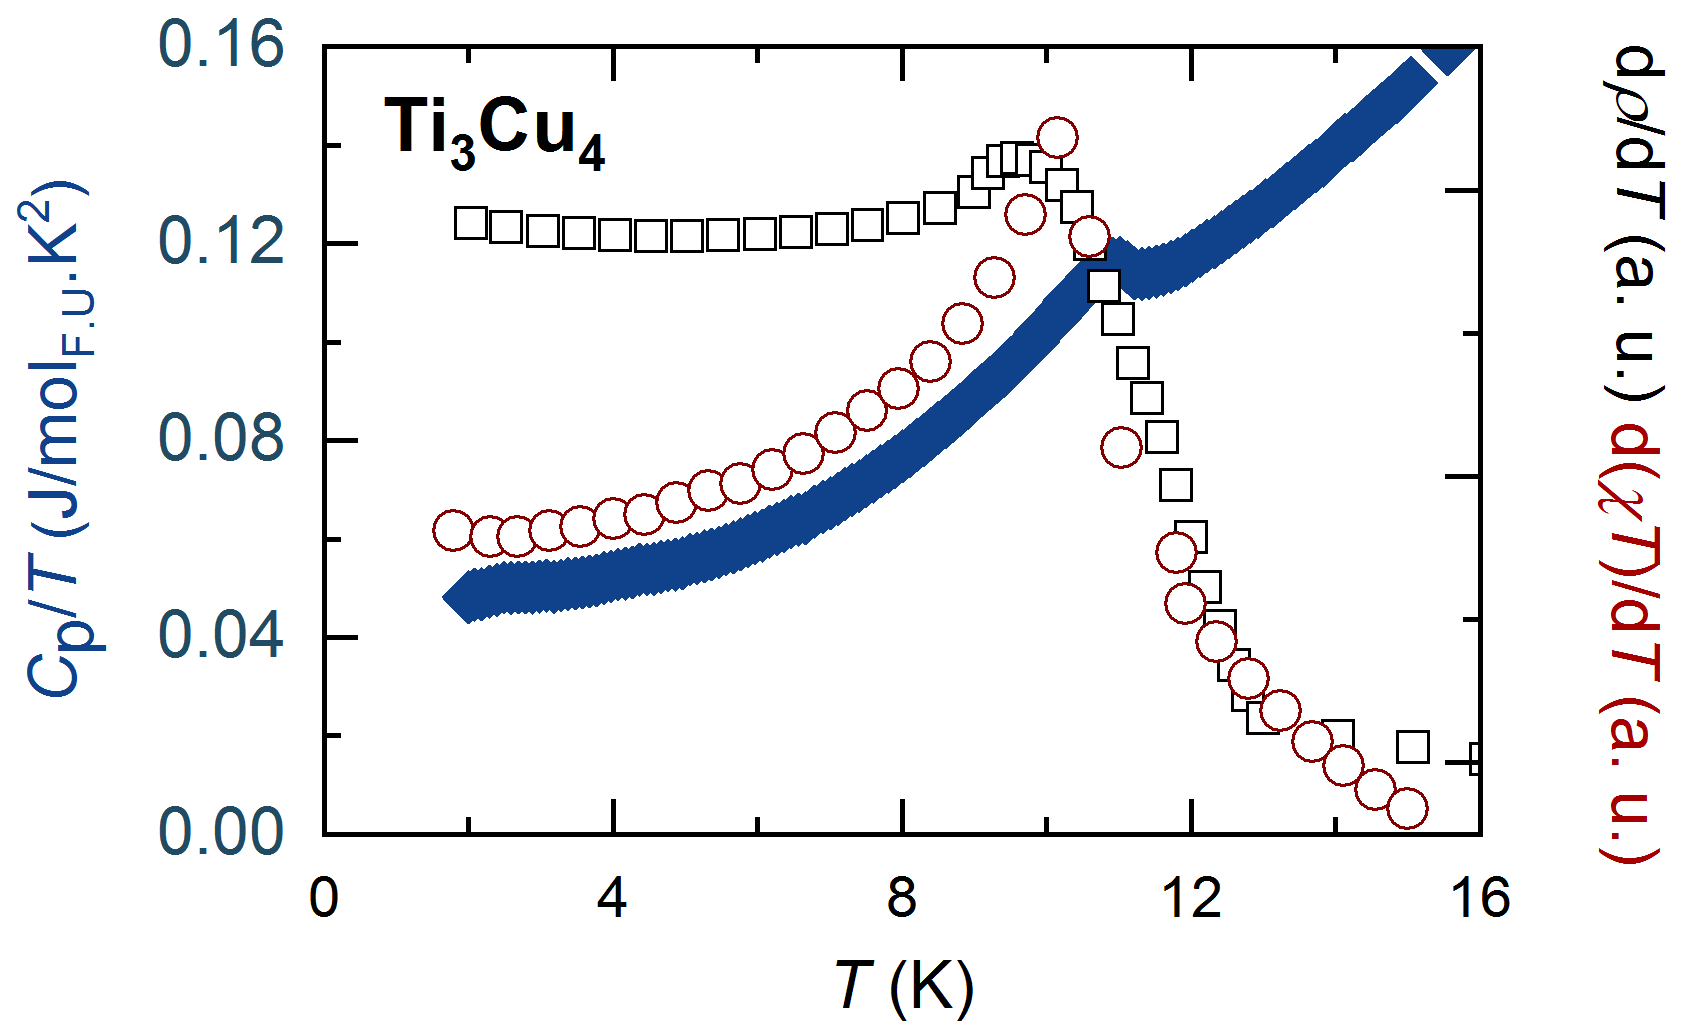
The low temperature thermodynamic and transport data show that a phase transition in Ti3Cu4 occurs around 11 K (Fig. 1d-f), first revealed by the small peak in the specific heat scaled by temperature (symbols, Fig. 1d, left axis). While such a transition could have a structural component, this is ruled out by single crystal neutron diffraction experiments (discussed below) that show no detectable change to the crystal structure down to 5 K. The antiferromagnetic order at = 11.3 K is confirmed by the = 0 susceptibility and electrical resistivity (Fig. 1e-f). Anisotropic data (determined from low magnetization isotherms , as described in the Supplementary Materials (Fig. S1) reveal a peak at for (red symbols, Fig. 1e), and a nearly temperature-independent plateau below for (grey symbols, Fig. 1e). In a local moment picture, such magnetic anisotropy would be consistent with an AFM ordered state; the susceptibility peaks at when the field is parallel to the direction of the ordered moments. The implication for the itinerant AFM order in Ti3Cu4 is that the moments are likely oriented within the plane, consistent with the single crystal elastic neutron scattering experiments discussed later. Upon cooling through , a drop in resistivity signals loss of spin-disorder scattering (full symbols, Fig. 1f), with a peak in the resistivity derivative , coincident with the peak in C and susceptibility derivative (Fig. S2) Fisher (1962); Fisher and Langer (1968).
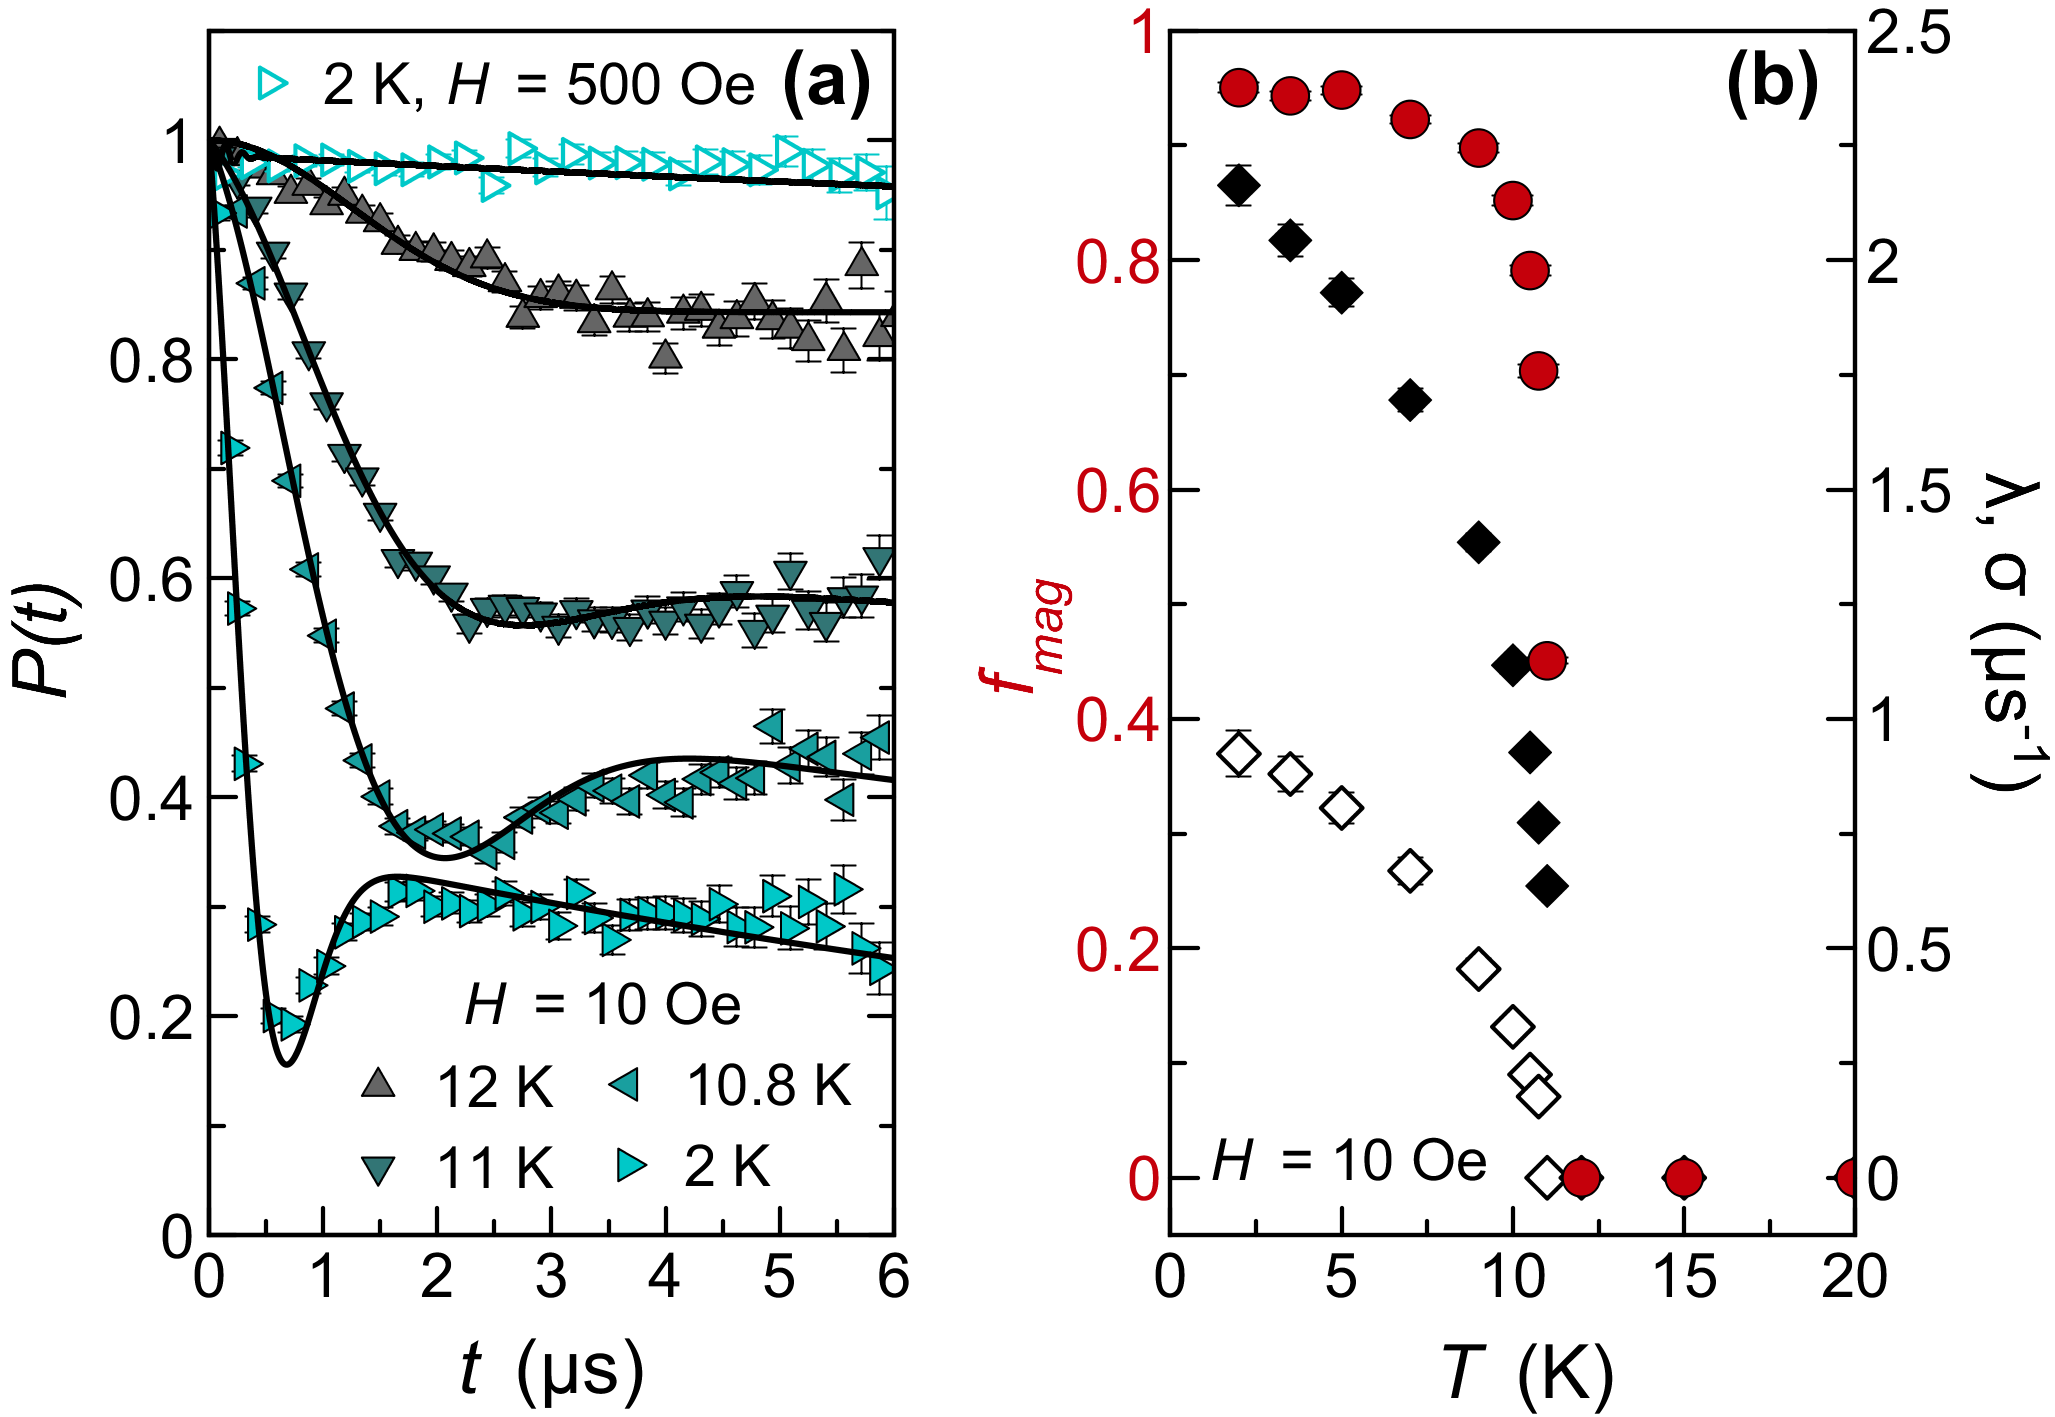
Muon spin relaxation (SR) measurements were performed, in order to confirm that the magnetic order at K in Ti3Cu4 is intrinsic, and not arising from a small impurity phase. Several representative muon decay asymmetry spectra are plotted in Fig. 2a. A small Oe field was applied to decouple any relaxation due to nuclear dipoles. From 12 to 20 K, is temperature independent and exhibits slow relaxation, consistent with a paramagnetic state. Upon cooling through K, there is a sharp increase in the relaxation at early times. Within the magnetically ordered state, takes a characteristic Kubo-Toyabe form Hayano et al. (1979) with a minimum at early times followed by a recovery to 1/3 of the initial asymmetry. The solid lines in Fig. 2a are fits to of the following form:
| (1) | ||||
Muons that land in the non-magnetic fraction of the sample, , experience a weak temperature-independent exponential relaxation. The magnetic fraction of the sample, , is well-described by a combined Kubo-Toyabe function, where the Gaussian relaxation is given by and the Lorentzian relaxation by . The dynamics in the 1/3 tail are phenomenologically captured by the inclusion of an exponential relaxation. The temperature dependence of the fitted parameters, , , and , is presented in Fig. 2b, where each is observed to sharply increase below K. At the lowest temperatures, (full circles, left axis) is close to 100%, confirming that the magnetsim in Ti3Cu4 is an intrinsic bulk property. The static nature of the magnetic order is confirmed through longitudinal field SR measurements, where the relaxation is significantly decoupled by fields as small as Oe and fully decoupled by a field of Oe (open triangles, Fig. 2a).
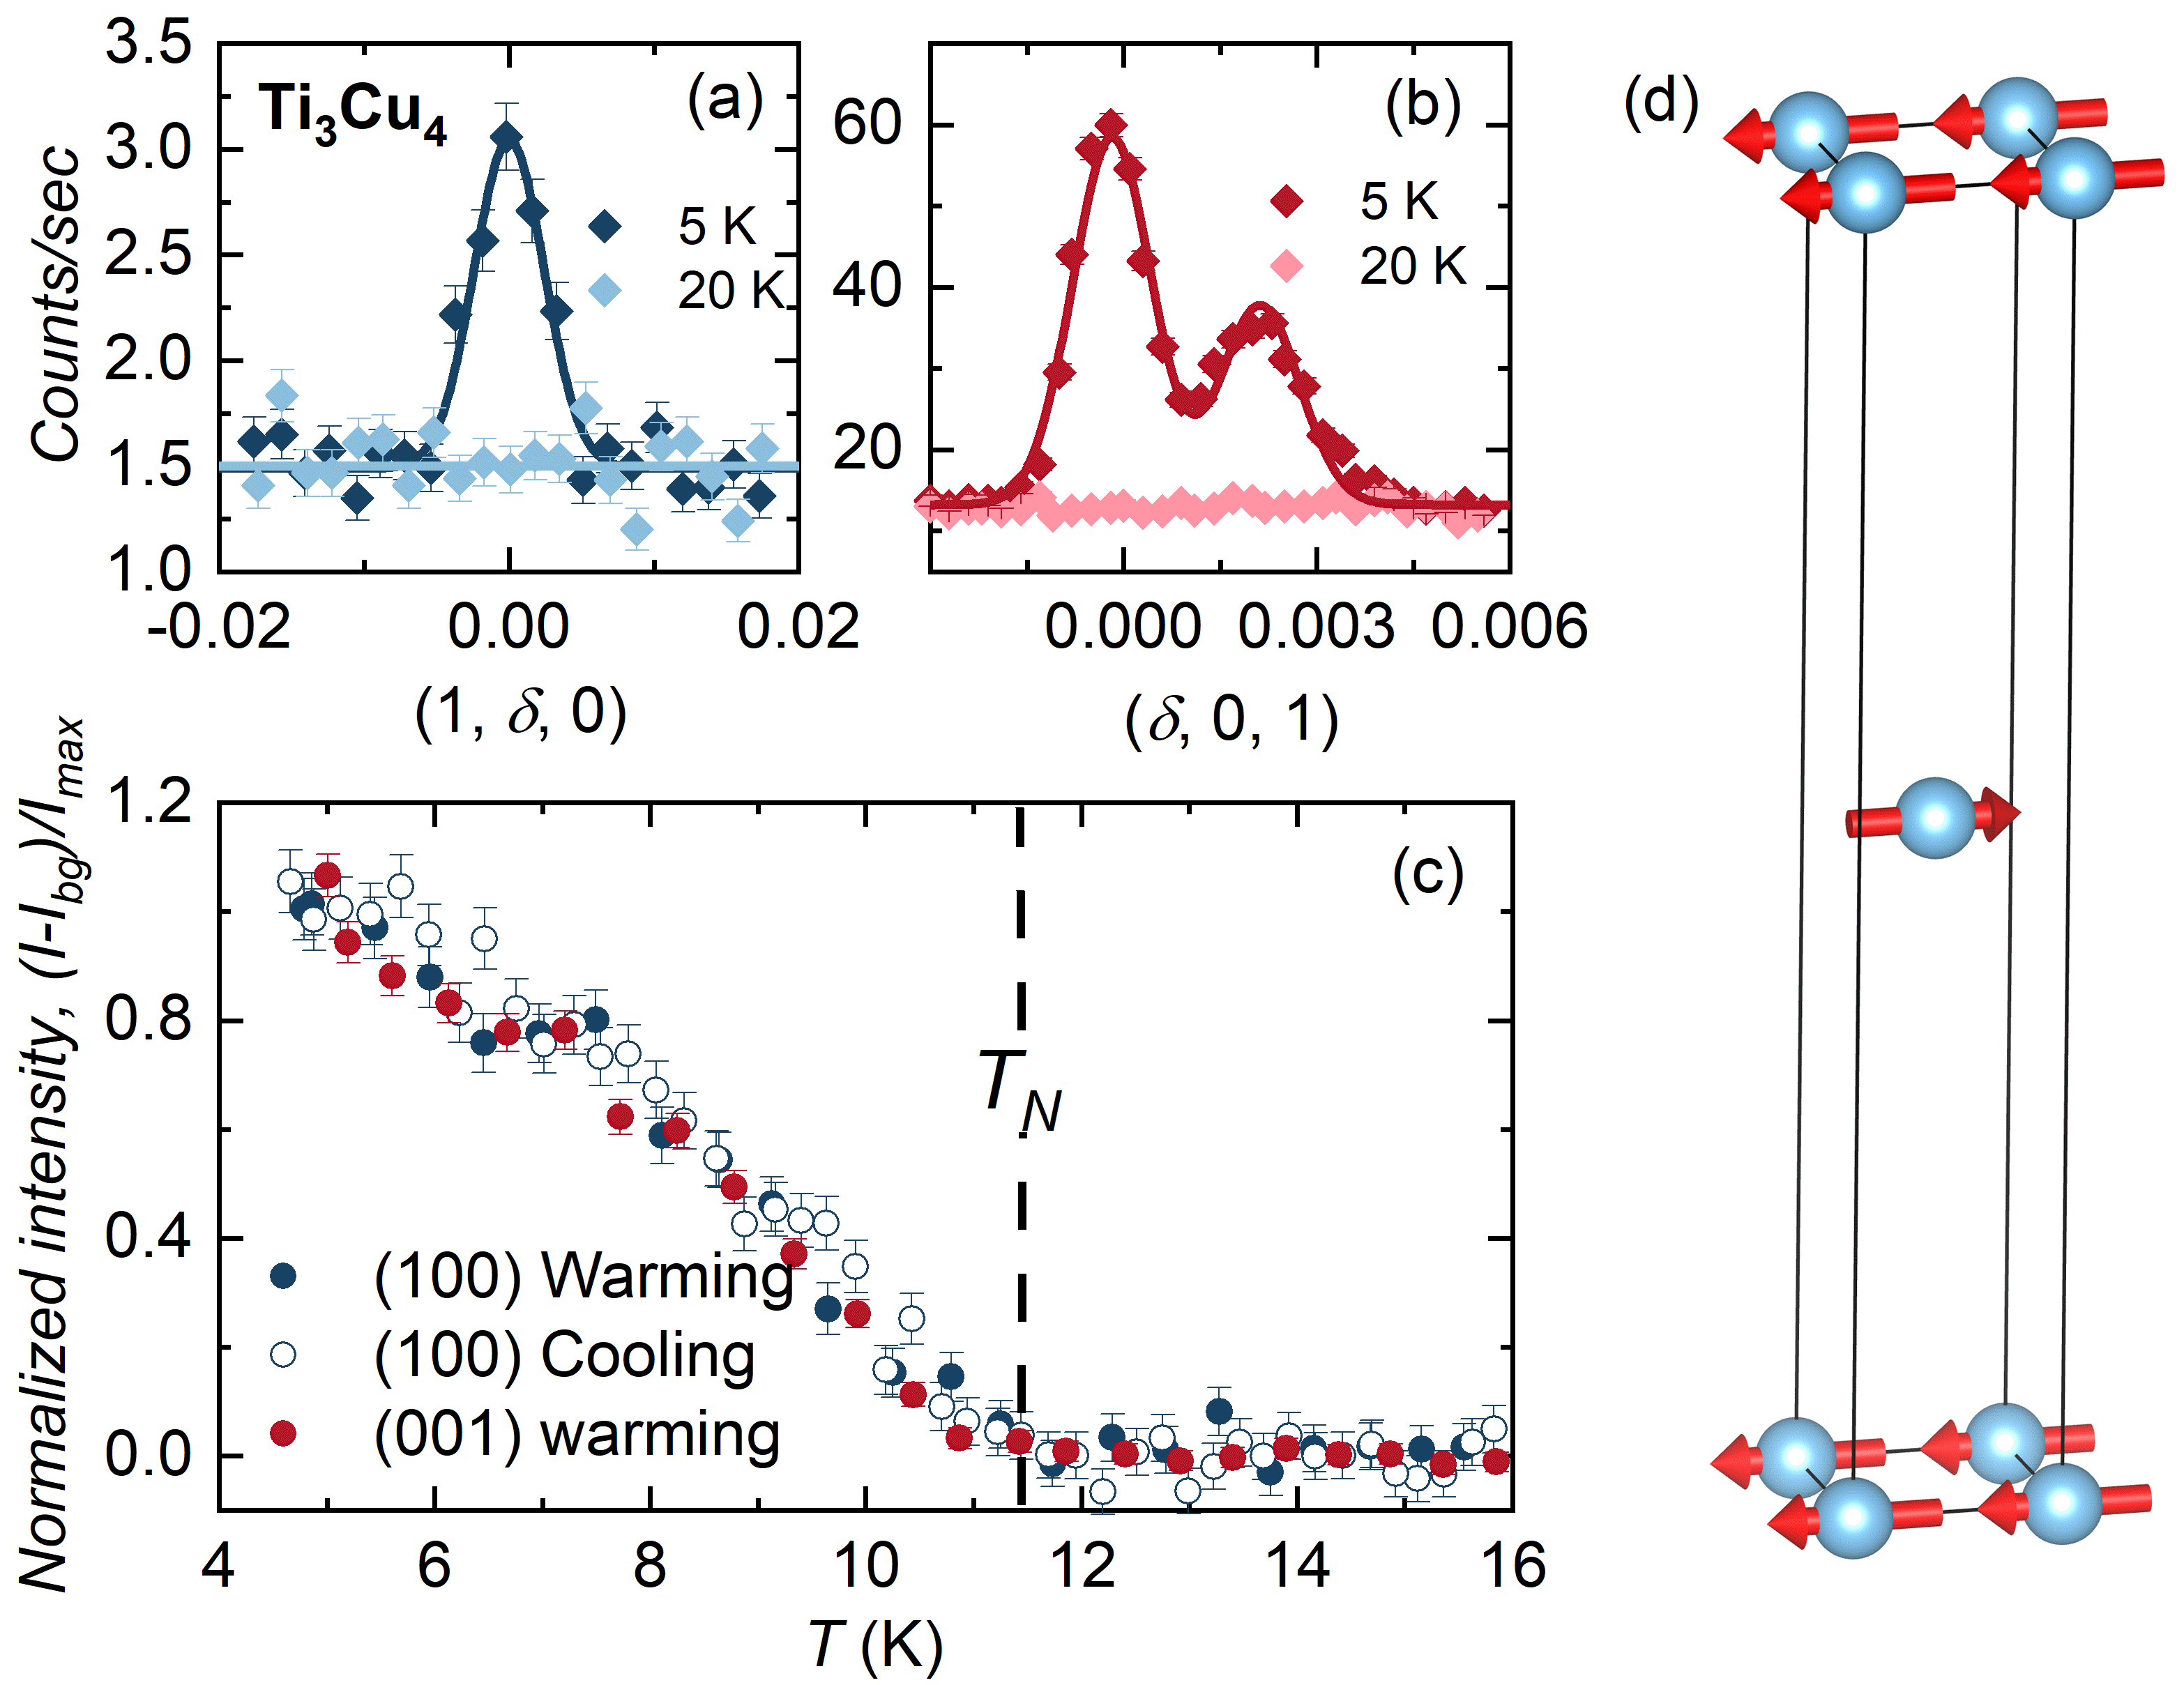
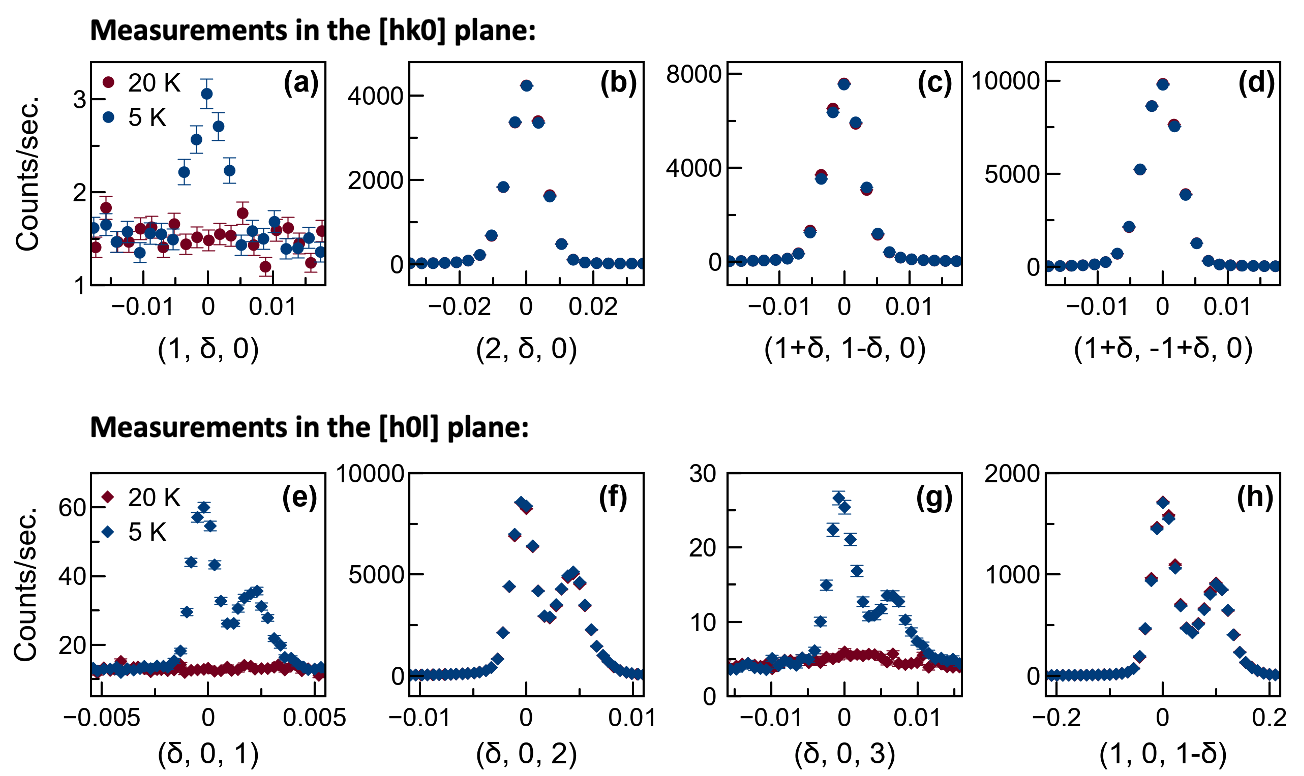
With SR measurements confirming the intrinsic magnetism, we performed single crystal elastic neutron scattering measurements to investigate the nature of the magnetically ordered state in Ti3Cu4. Measurements above ( K) and below ( K) reveal the formation of magnetic Bragg peaks on several high symmetry positions, including (100) and (001), as shown in the rocking curve scans in Fig. 3a,b (for all measured reflections see Supplemental Material Fig. S4). The double peak that appears for (001) and the other reflections with non-zero component are not intrinsic, but rather the result of two closely-aligned grains. The intensity of the (100) and (001) Bragg peaks (measured both on warming and cooling) as a function of temperature is presented in Fig. 3c, confirming that the onset of magnetic order occurs at K without measurable hysteresis. While the (001) and (100) Bragg peaks were measured in different sample geometries, and therefore their intensities cannot be directly compared, it is nonetheless evident that (001) is significantly more intense than (100), indicative of ordered moments that lie in the -plane, consistent with the low field susceptibility.
The commensurate positions where magnetic Bragg peaks form in Ti3Cu4 are not allowed by the body-centered selection rules () for the structure and therefore no nuclear Bragg peaks are observed on these positions. We can index these magnetic Bragg reflections with a propagation vector of . We proceed by assuming that, as indicated by the DFT calculations discussed later, the magnetism in Ti3Cu4 originates from the conduction bands of the Ti atoms which occupy the Wyckoff site (Ti2). It should be emphasized that the neutron data cannot independently distinguish which of the atomic sites in Ti3Cu4 is responsible for the magnetism. There are two symmetry-allowed irreducible representations for the Wyckoff site with a propagation vector within the space group: (-axis antiferromagnet) and (-plane antiferromagnet). While both of these magnetic structures produce Bragg peaks at (100), only yields intense reflections at (001) and (003), consistent with our experiment. The periodicity of this structure is shown in Fig. 3d, consistent with a transverse commensurate spin density wave order. Linear combinations of the two basis vectors that make up allow a continuous rotation within the -plane and we cannot determine the exact moment orientation in an unpolarized neutron experiment. The magnitude of the ordered moment, which was estimated by comparing the intensity of the nuclear and magnetic reflections in the () plane measurements and assuming a Ti3+ magnetic form factor, is 0.17(5) , in good agreement with the high field magnetization data discussed next.
With the bulk antiferromagnetic magnetic order below firmly established, we turn to further evidence of itinerant moment magnetism in Ti3Cu4. Recalling the linear inverse susceptibility of Ti3Cu4 (Fig. 1b), we recognize it as signature of either local or itinerant moment magnetism, albeit with very different origins. For the former case, mean field theory predicts , where is the paramagnetic moment, and is a measure of the inter-atomic moment coupling. For the latter case, Moriya’s theory of spin fluctuations Moriya and Kawabata (1973); Hasegawa and Moriya (1974); Takahashi and Moriya (1985); Nakayama and Moriya (1987); Konno and Moriya (1987); Moriya (1981) predicts , where is a measure of the intra-atomic coupling. In Ti3Cu4, the slope and intercept of the linear fit to between 50 and 300 K (solid line, Fig. 1b) yield a paramagnetic moment = 1.0 F.U. and K, respectively, where is analogous to the Weiss temperature in local moment systems. The positive is consistent with ferromagnetic in-plane interactions characteristic of the magnetic structure, where the direction coupling is AFM.
While the linear inverse susceptibility alone is not enough to indicate itinerant moments in Ti3Cu4, the paramagnetic moment is too small to be explained by a local moment scenario, in which the smallest possible unscreened moment would be 1.73 F.U. corresponding to at the Ti2 site (all other sites in this structure have higher multiplicities and would therefore produce even larger magnetic moments per F.U.).
The magnetic entropy Smag (estimated from the grey area under the peak in Fig. 1d) falls in line with the same conclusion: Smag (thin line, right axis in Fig. 1d) reaches only 1% Rln2 up to 16 K (above ). Such small entropy release is consistent with small moment ordering, likely smaller even than that in the itinerant antiferromagnet TiAu Svanidze et al. (2015b) where was close to 3% . This indicates that the paramagnetic moment in Ti3Cu4 is best explained as originating from itinerant spin fluctuations, a scenario corroborated below by our ab initio calculations.
Another empirical signature of itinerant moment magnetism is a divergent Rhodes-Wohlfarth ratio 1, where and correspond to the number of magnetic carriers above and below the ordering temperature Rhodes and Wohlfarth (1963). Experimentally, is extracted from the paramagnetic moment determined from high temperature fits of the inverse magnetic susceptibility:
| (2) |
and is determined from the low temperature (ordered) moment
| (3) |
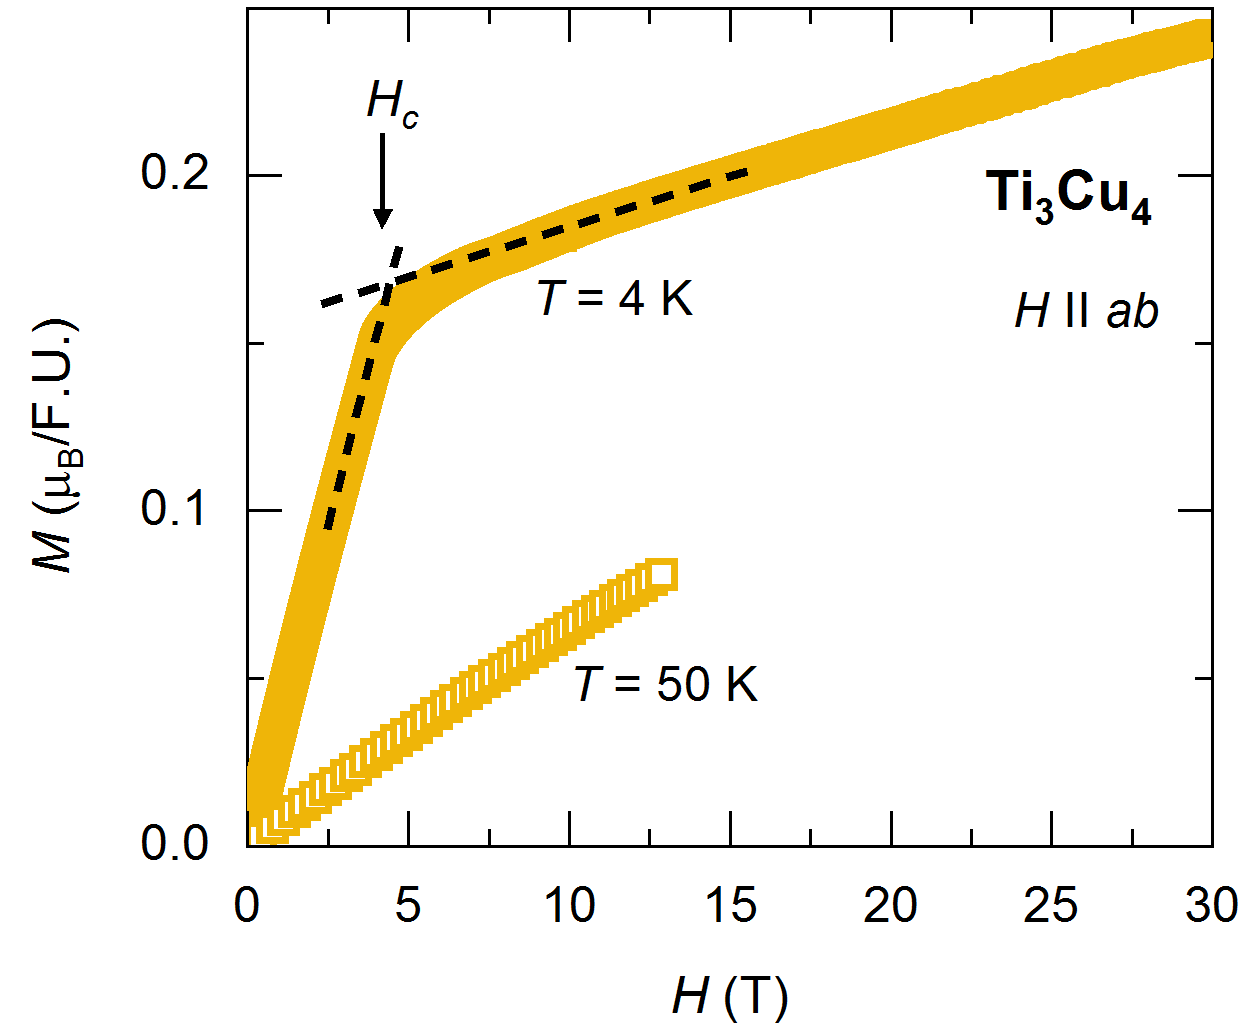
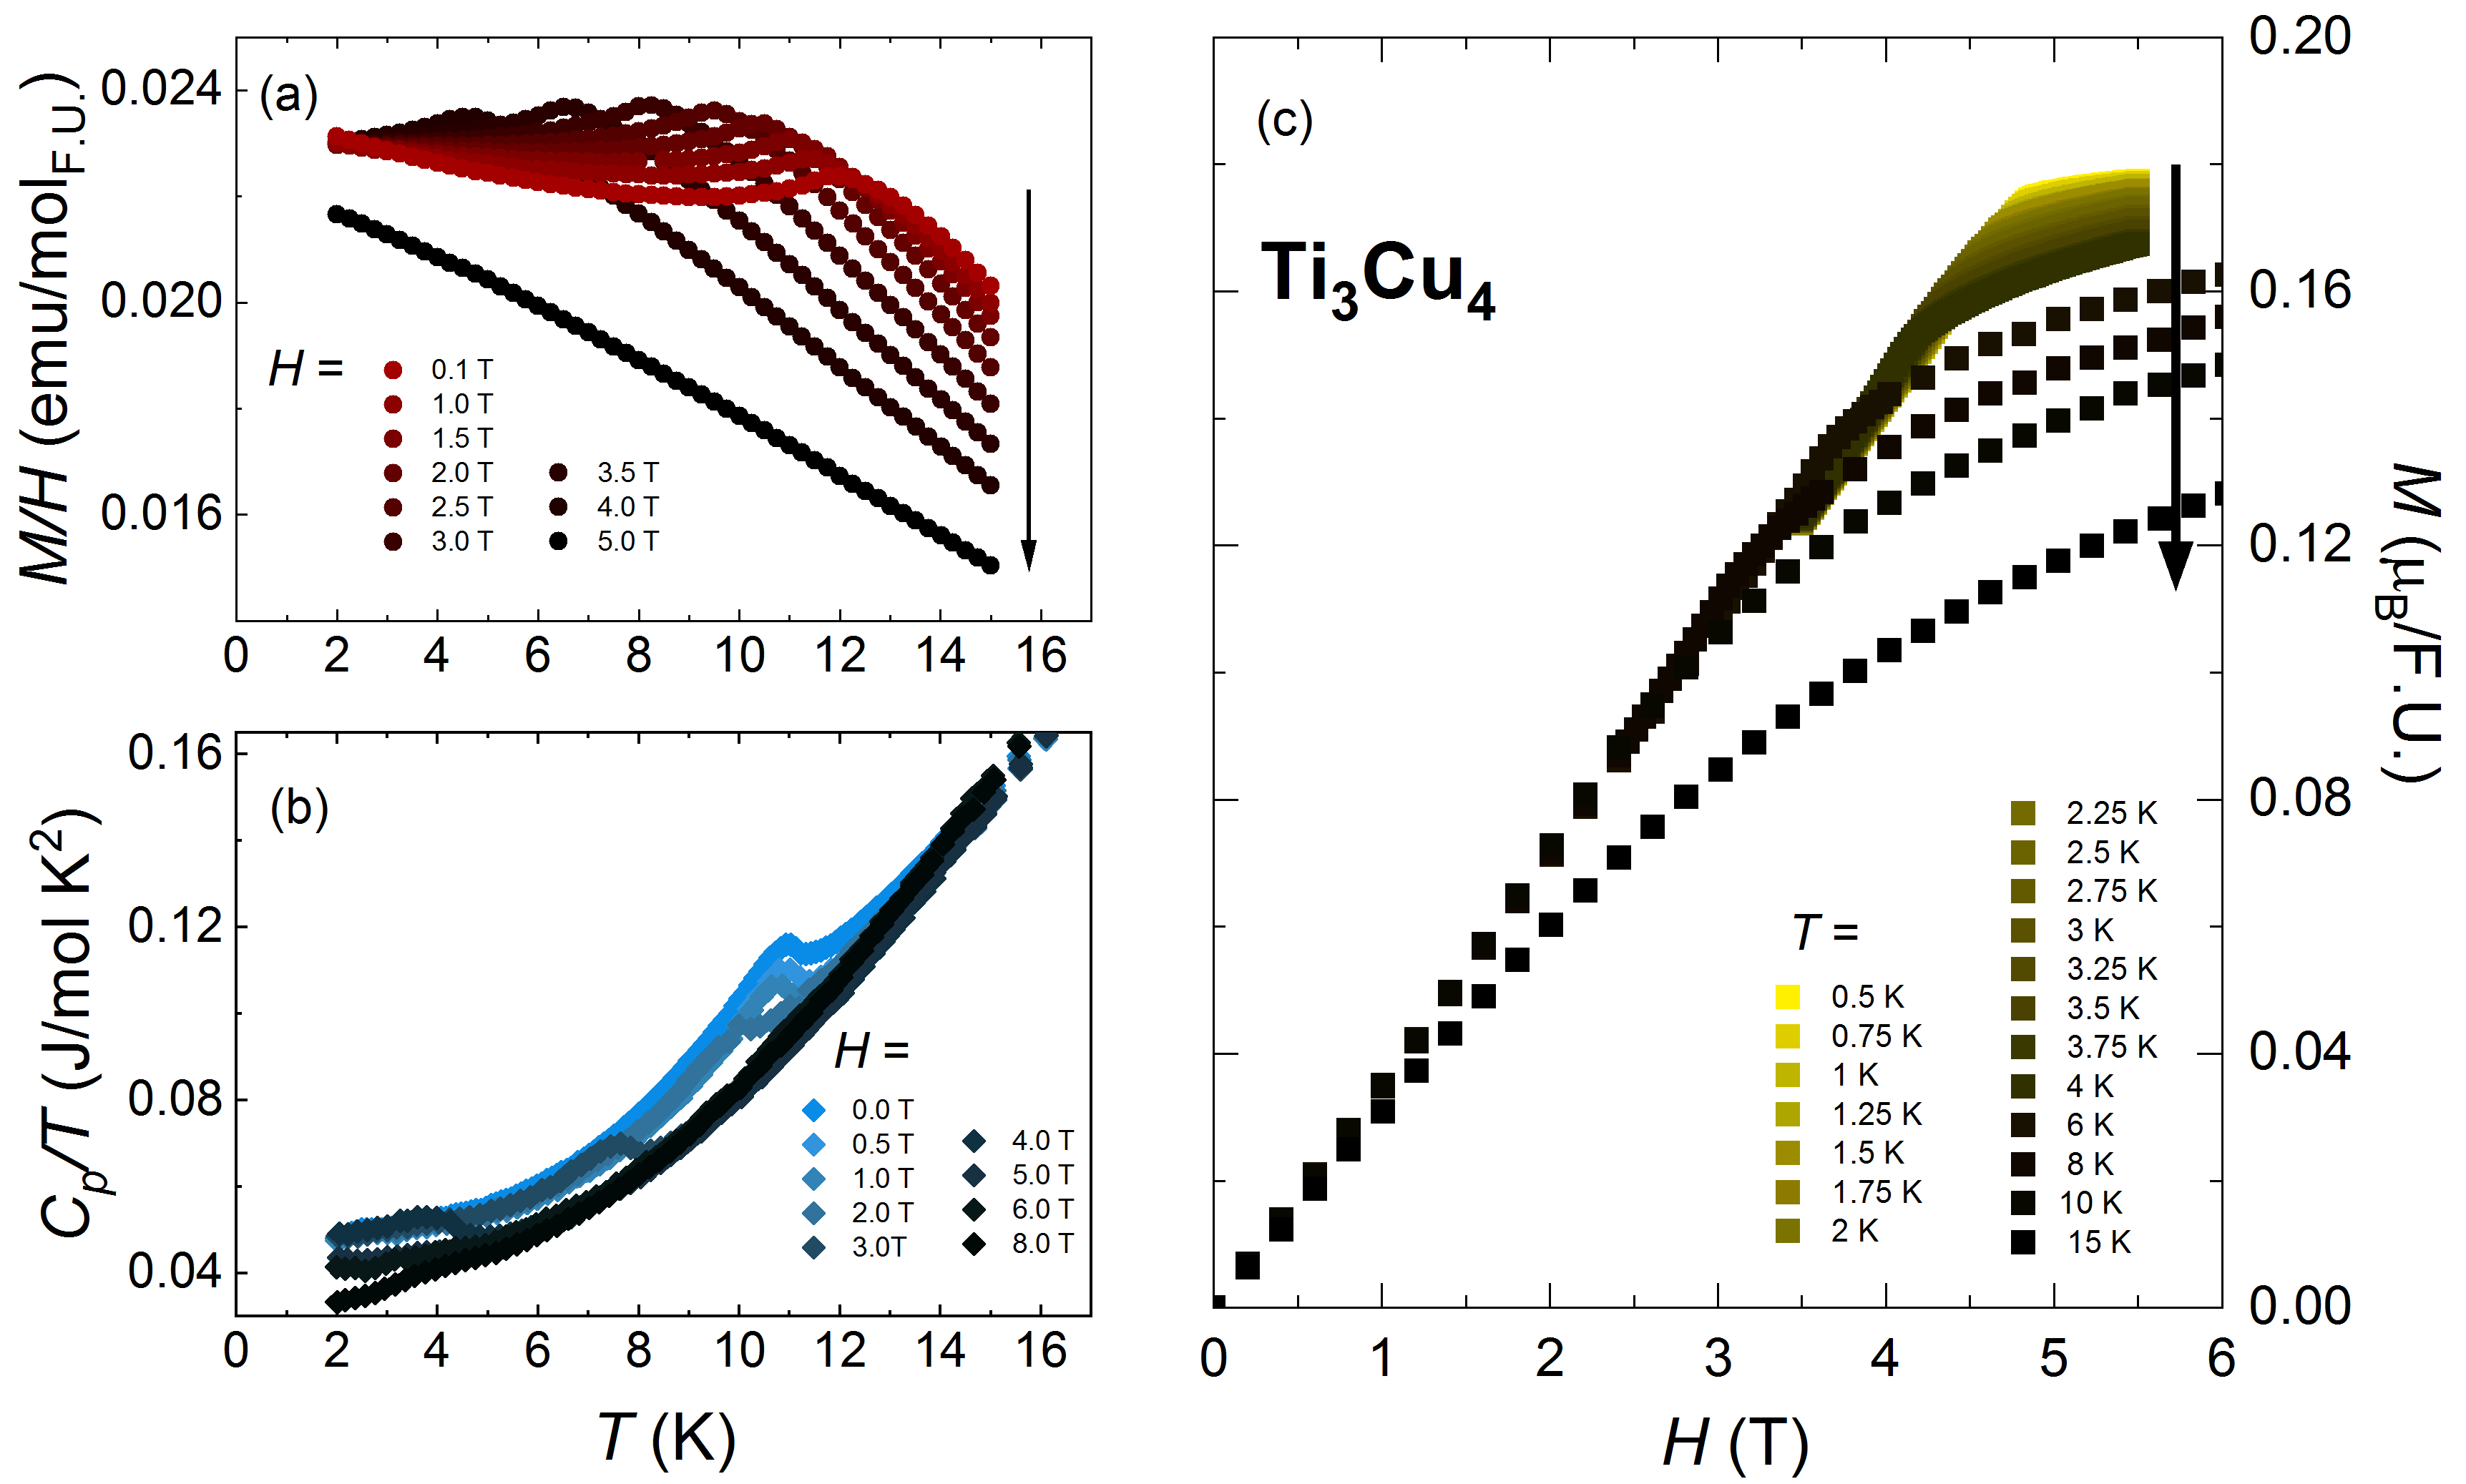
The Rhodes-Wohlfarth ratio close to unity corresponds to the local moment scenario, while an increase in with lower ordering temperature indicates an increased degree of itinerancy Rhodes and Wohlfarth (1963). Magnetization measurements () for Ti3Cu4 (Fig. 4) point to a small , while single crystal neutron measurements indicate that the ordered moment is even smaller, . These values result in a large 2.4, reinforcing the itinerant magnetism picture in Ti3Cu4.
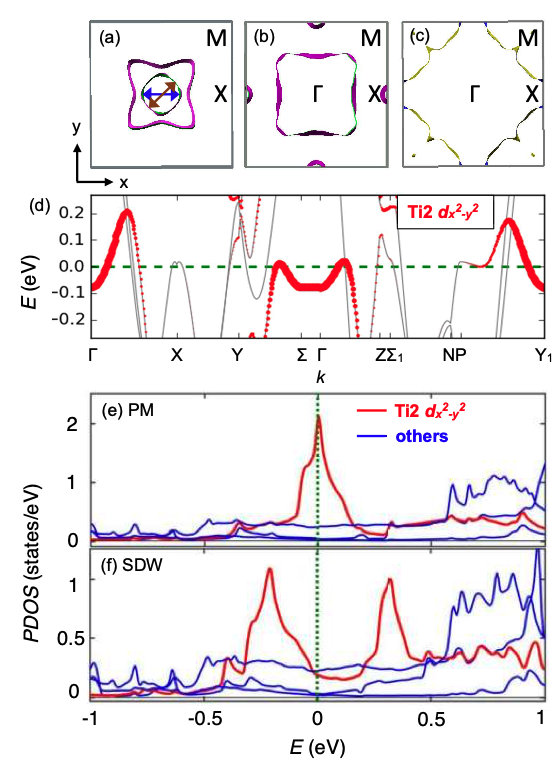
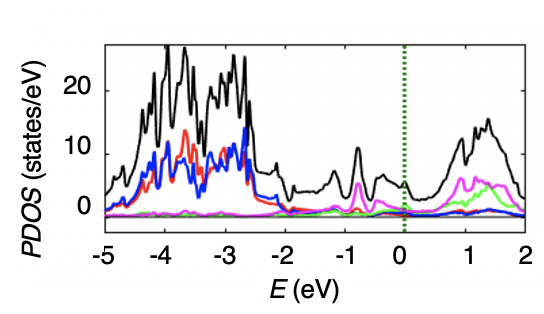
In order to glean insight into the nature of the magnetic order, and in particular the small value of the ordered moment, we performed first principles calculations based on density functional theory (DFT), with the methodology detailed in Supplementary Materials. The calculations reveal a Fermi surface consisting of four sheets centered around the point, and a small pocket around the point (Fig. 5a-c). The analysis of the orbital-projected band structure (so-called “fat bands”) in Fig. 5d shows that the main contribution to the nested Fermi surface sheet in Fig. 5a comes from the orbital on the Ti2 atom, whereas the partial contributions from the other orbitals and from Ti1 atoms are much smaller, as demonstrated by the projected density of states (DOS) in Fig. 5e. The reason for this orbital selectivity appears to be connected to the square net geometry of the Ti2 layer, where the orbital lies along the Ti2-Ti2 bonds, reminiscent of the cuprates Comin and Damascelli (2016).
The calculations performed in the magnetically ordered phase, with the experimentally determined wavevector show that the DOS gets depleted around the chemical potential (Fig. 5f), and that the sharp DOS peak present in the PM phase (Fig. 5e) is split into two peaks separated by about 0.5 eV, with a pseudogap in between. This peak separation, due to the internal staggered magnetic field, is quantitatively consistent with the DFT-predicted ordered moment of 0.25 per Ti2 ion. Interestingly, the calculations show zero ordered moment on the buckled Ti1 layer. The reason is that the center of mass of the Ti1 band lies far below the Fermi level (close to eV) due to greater hybridization with the and orbitals within the buckled layer, thus unable to participate in the formation of the magnetic order on the Ti1 sites.
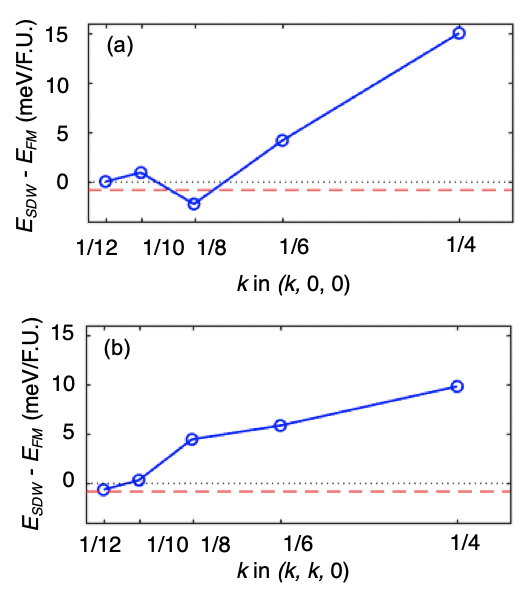
The above analysis, combined with the smallness of the magnetic moment on the Ti2 ion, clearly indicates the itinerant nature of the magnetism in Ti3Cu4. Of note, the Fermi sheets in Fig. 5a-c appear to be nested, suggesting that a spin-density wave (SDW) order is likely to be realized with wavevectors along either (brown arrow in panel a) or (blue arrow). However, the neutron diffraction instead shows an out-of-plane wave-vector . In order to elucidate this puzzling behaviour, we performed a series of ab initio calculations with various ordering wavevectors, as described in the Supplementary Materials. Figure S6 shows that the candidate SDW states with various commensurate wave-vectors along and are all higher in energy than that of the experimentally observed state, with one notable exception: the noncollinear state is predicted to lie slightly (about 1 meV/f.u.) lower in energy. This energy difference is however within the error bars of the DFT calculation and is therefore not significant. We conclude that the nested nature of the Fermi surfaces allows for several candidate SDW states very close in energy. We therefore rely on the neutron diffraction study to deduce the ordered state with the wavevector .
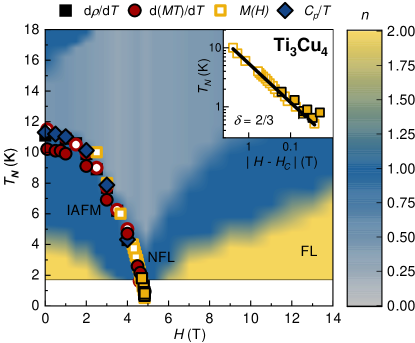
We return to the field-induced transition in Ti3Cu4. Increasing magnetic field continuously suppresses as seen in , , , and measurements for both and (Supplementary Materials Fig. S3 and S7). A field 4.87 T suppresses the magnetic order all the way to zero temperature, as shown in the phase diagram in Fig. 6 and S7, raising the possibility of a field-induced QCP in Ti3Cu4. Down to 0.5 K, the transition is continuous, with no apparent hysteresis. The log-log plot around is linear (inset, Fig. 6), such that the phase boundary in the vicinity of can be described by an exponential behavior T , with = 4.87 and = . This corresponds to the expected Hertz-Millis exponent for a 3D AFM Hertz (1976); Millis (1993); Stewart (2001) or Bose-Einstein condensation of magnons Giamarchi and Tsvelik (1999); nik ; Nohadani et al. (2004).
Thermodynamic measurements provide convincing evidence of the field-induced quantum criticality Rost et al. (2009); Gen et al. (2019); Tokiwa et al. (2009), so in Ti3Cu4, we turn to the magnetic Grüneisen ratio defined as Zhu et al. (2003)
| (4) |
which measures the slope of the isentropes of the magnetic phase boundary in the plane Garst and Rosch (2005). Across a classical phase transition, is expected to be finite and temperature-independent Zhu et al. (2003). Near a QCP, an entropy ridge is expected to form where the system is maximally undecided between the ordered state and the disordered state (for d, ( when and ( when ), which is reflected by a sign change of at the QCP Garst and Rosch (2005). Furthermore, in the low-temperature limit, the singularities in and cancel out in Eq. 4, leaving only singularities associated with Zhu et al. (2003). Zhu et al. showed that scales as as and at Zhu et al. (2003). Here is the exponent of the correlation length and is the dynamical critical exponent. Together, the sign change of at and the scaling relations are definitive proof of a field induced QCP Garst and Rosch (2005); Zhu et al. (2003); Gegenwart (2016).
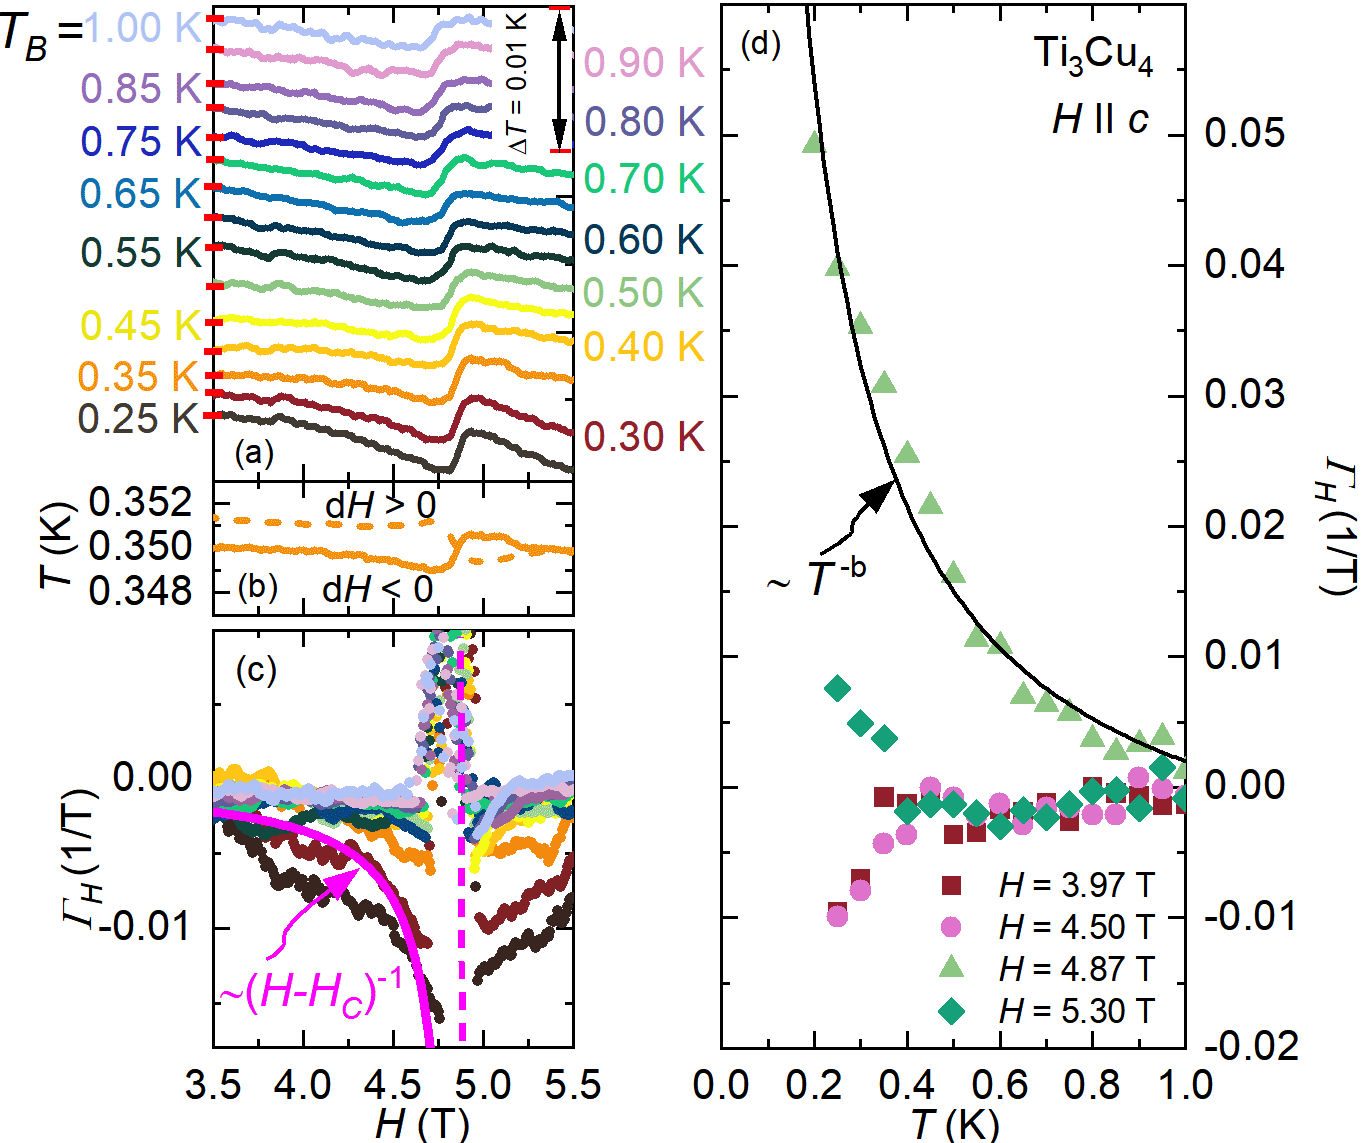
We obtain by measuring the magnetocaloric effect (MCE) () under quasi-adiabatic conditions ( constant for a duration smaller than it takes for the thermometer to relax). In Fig. 7a, we plot MCE, i.e. the temperature change driven by ramping the magnetic field across from 3.5 T to 5.5 T at various bath temperatures for . Upon increasing from below Hc, decreases, such that . Since is a positive quantity, the sign of is always opposite to the sign of . Consequently, the decrease in during the field upsweep indicates an increase in magnetic entropy (). Near , there is a sudden increase in , indicating a sudden reduction of the magnetic entropy. Subsequently, decreases again due to the measurement apparatus relaxing back to . To confirm that the decrease in above is indeed related to the measurement apparatus relaxation and not intrinsic to the sample, we measured the MCE sweeping down from 5.5 T to 3.5 T (Fig. 7b, dashed line). Upon decreasing H above , decreases indicating an increase in magnetic entropy as the QCP is approached. The sudden increase in reflects a decrease in magnetic entropy as crosses . Upon further decreasing , the temperature again relaxes towards before increasing due to a reduction of magnetic entropy as the distance from is increased.
Figure 7c shows at selected , approximated as . Though we cannot reliably extract the exponents due to the quasi-adiabatic nature of our experiments, as it is apparent that diverges as , as illustrated by the pink solid line. Furthermore, (Fig. 7d) switches signs across and diverges as (black solid line) for . While the quasi-adiabiatic conditions render the exponents’ determination uncertain, the MCE power law divergence is unambiguous: assuming constant heat loss, the exponent may vary, but such a scenario cannot cause a divergence. For a classical phase transition, the Grüneisen ratio is a constant, and therefore the divergence must come from the QCP. Together, the sign change of across and the divergences at and provide ample evidence for a field induced QCP at Zhu et al. (2003); Garst and Rosch (2005).
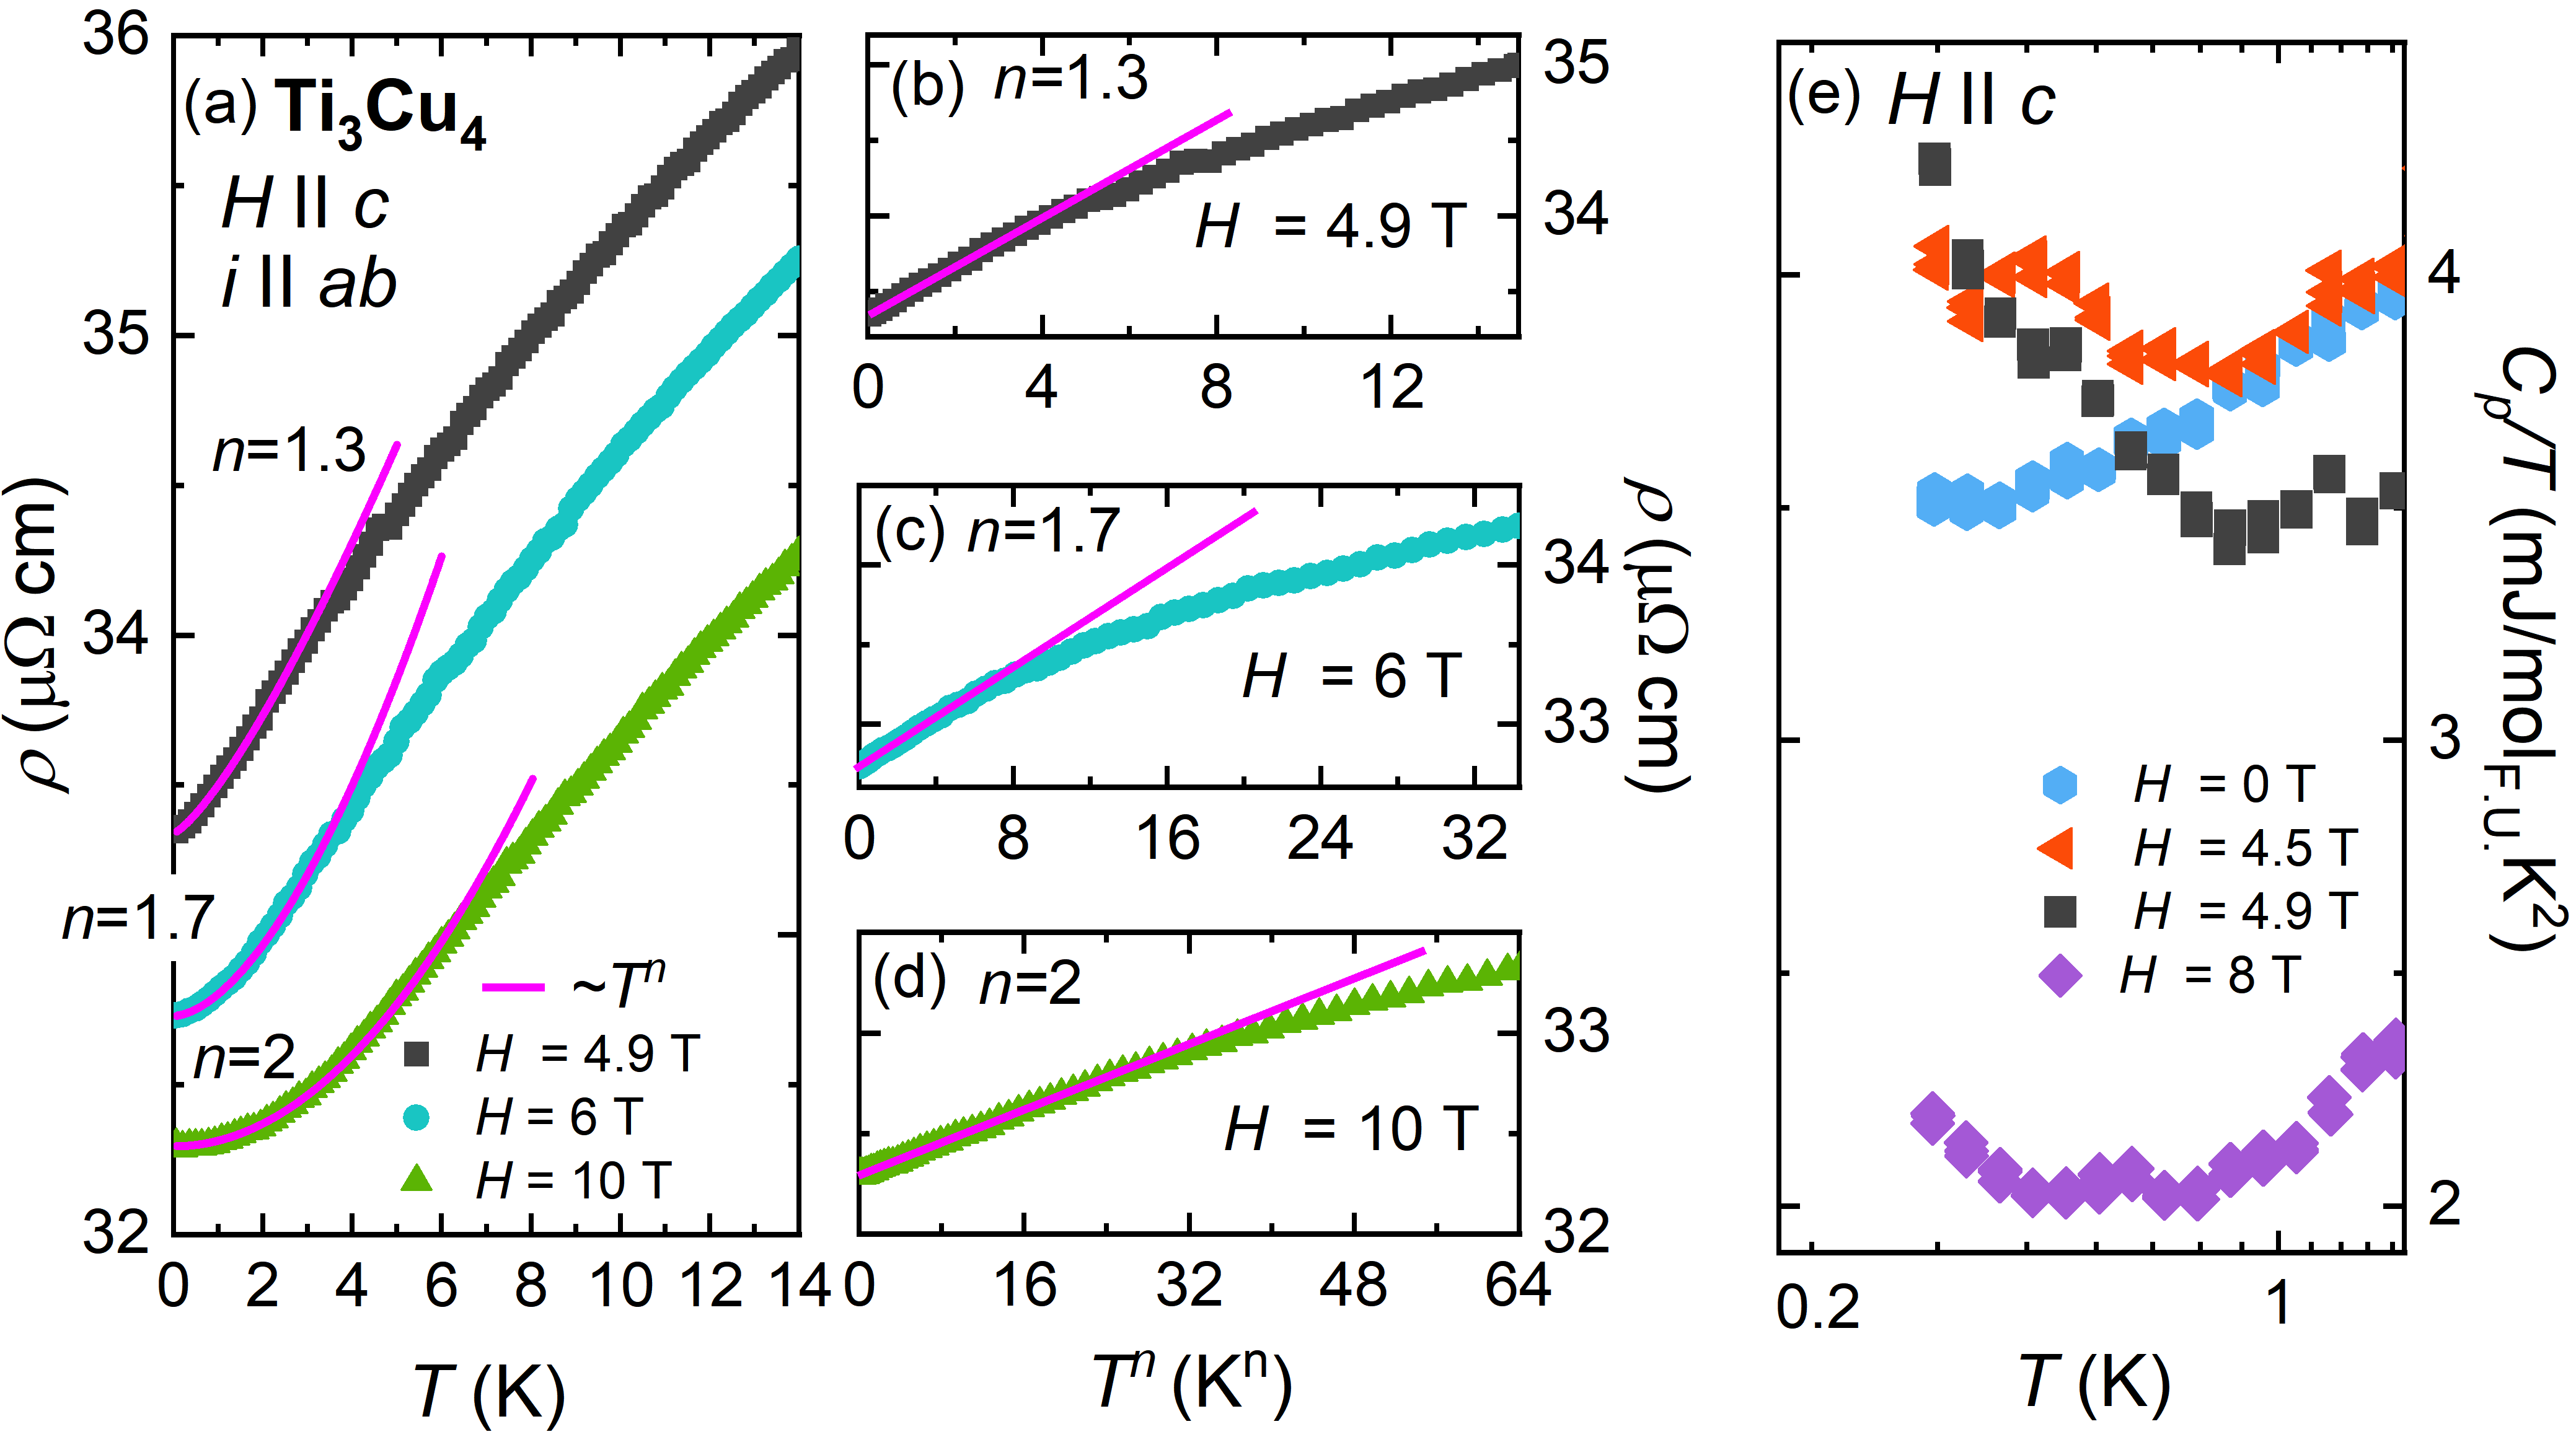
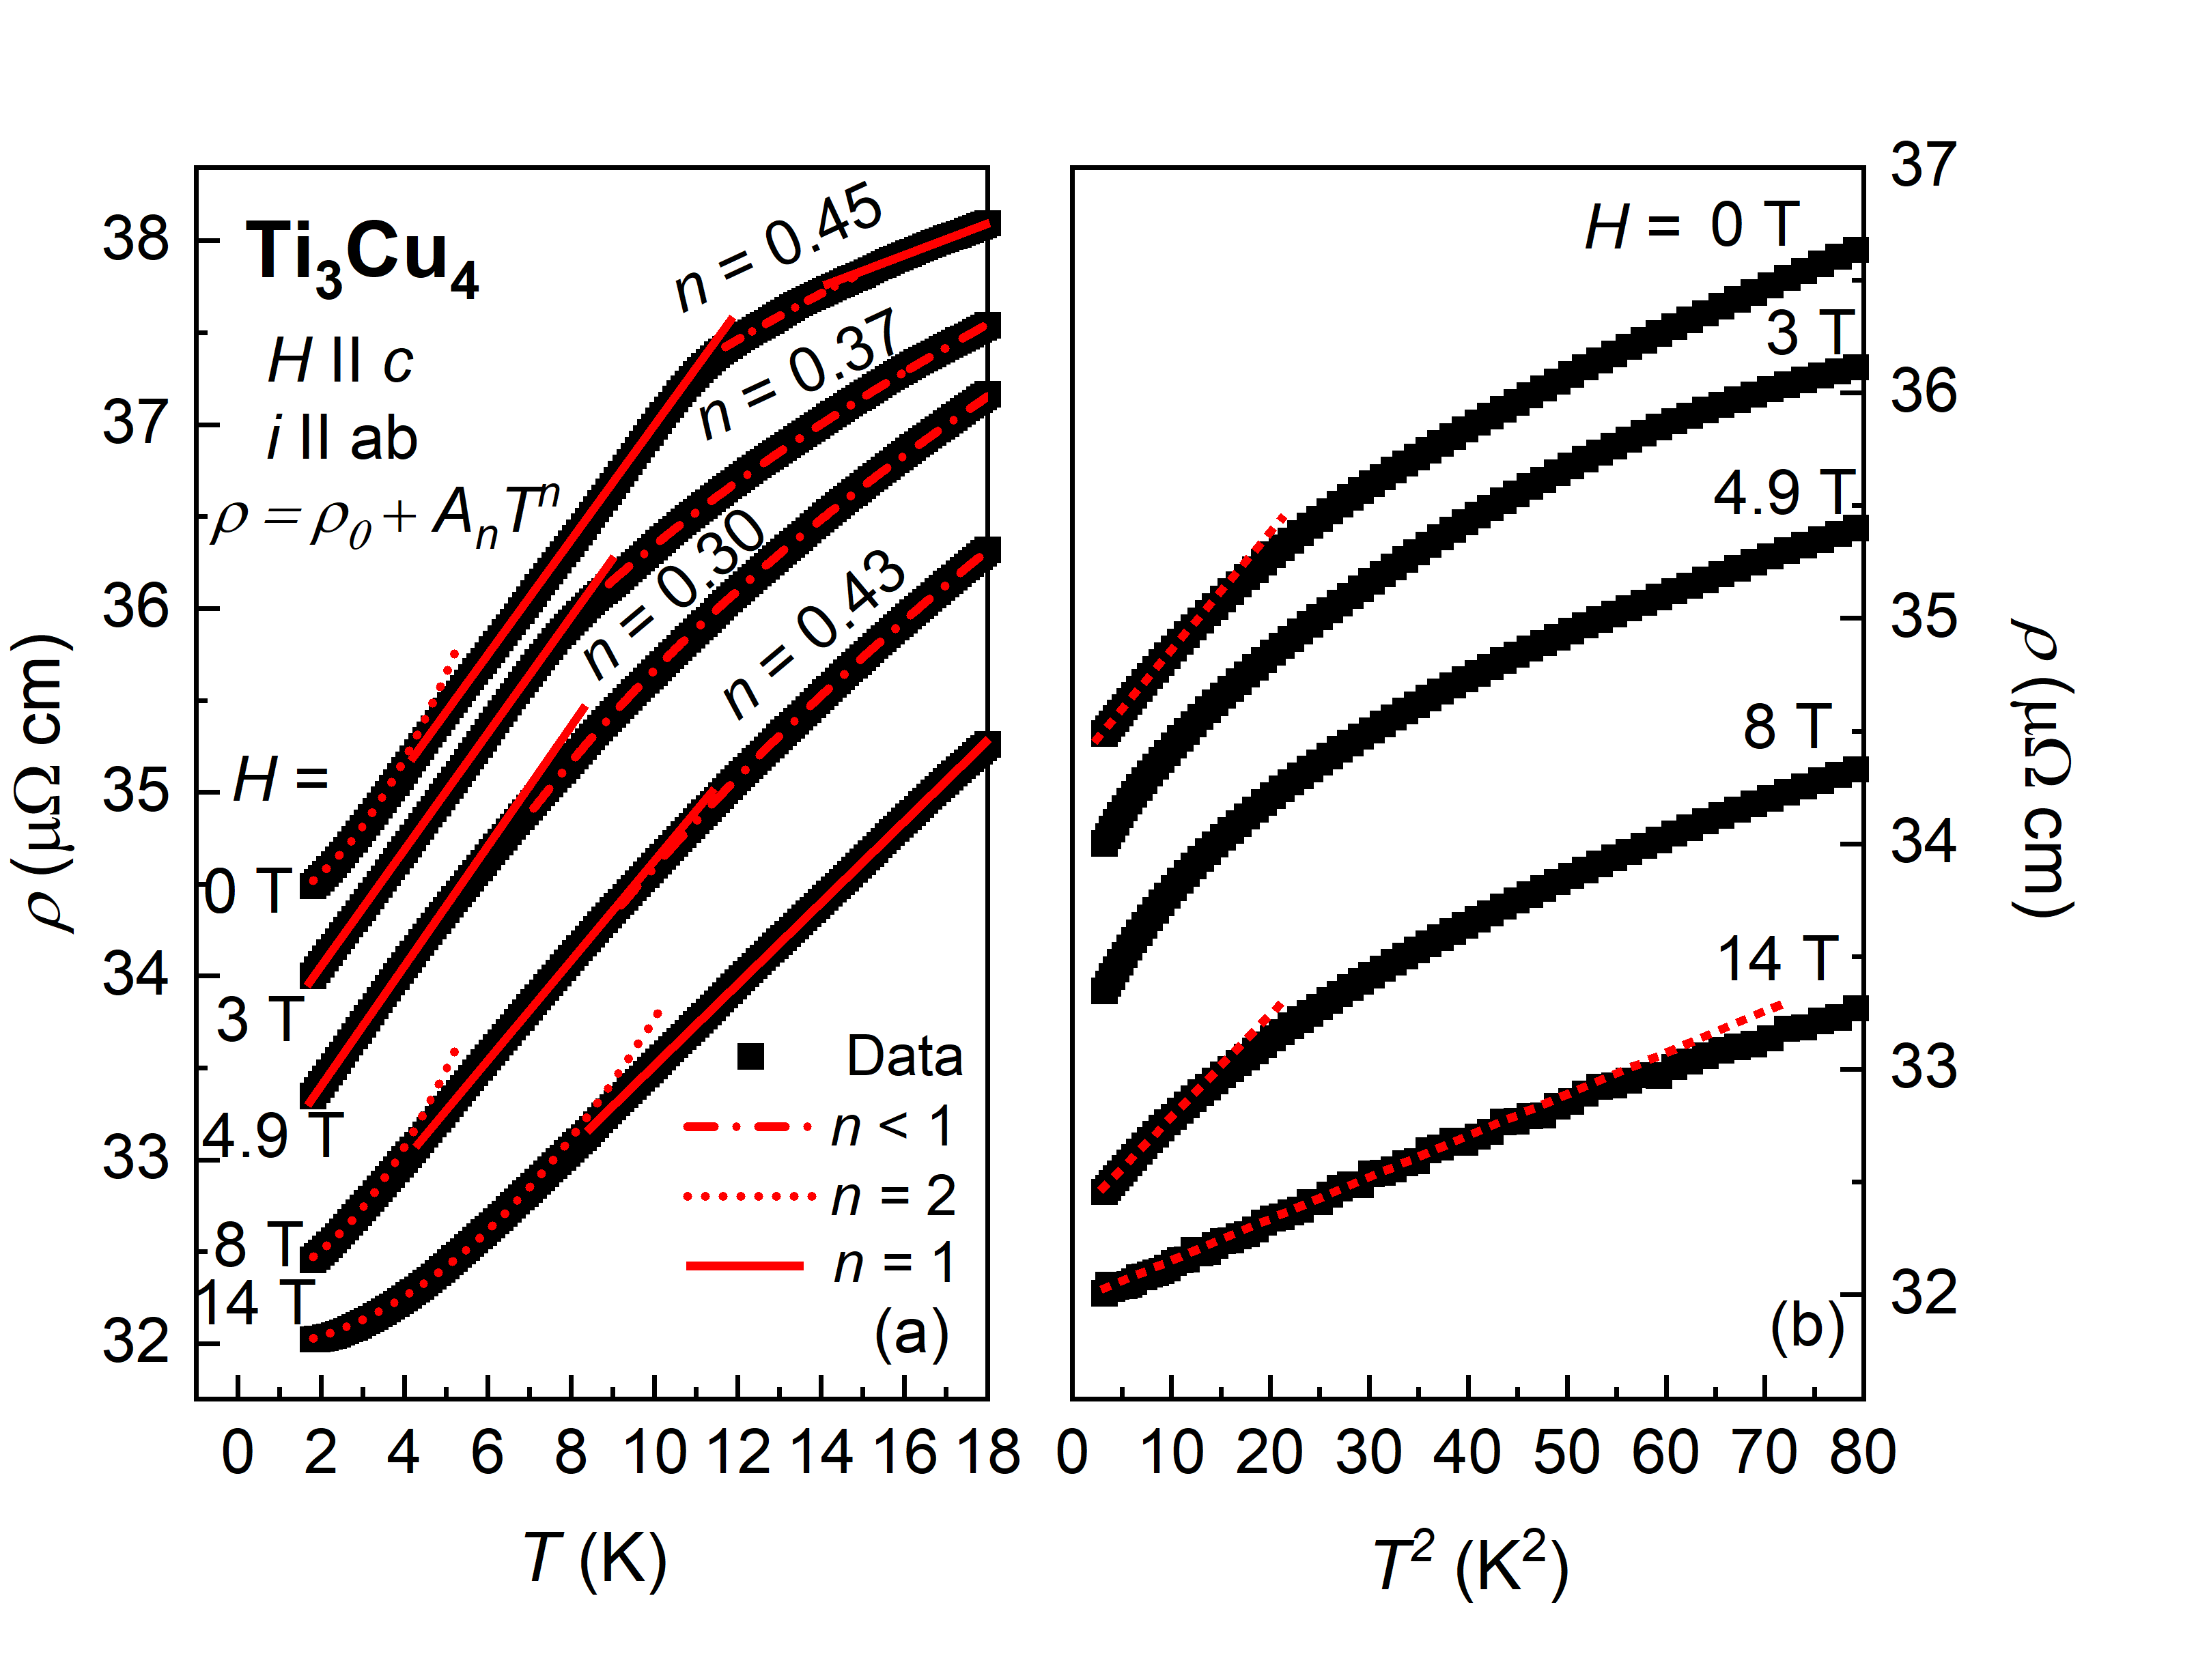
Now turning to the electrical transport, we note that QCPs are often (albeit not always) accompanied by non-Fermi liquid (NFL) behavior, with a NFL-FL cross-over convergent at the QCP. Signatures of the NFL behavior are revealed by the resistivity analysis , where the dependence of the exponent is represented by the contour plot in Fig. 6 for for K. A subset of the data and fits to can be found in Supplementary Materials Fig. S7. At high temperatures in the paramagnetic state, varies sub-linearly with temperature, i.e., . In other itinerant systems, similar behavior has been attributed to the conduction electrons being scattered by spin fluctuations of the -band electrons Ueda (1977); Cao et al. (2004). Just below , 1 and 2 at the lowest measured , for 0. Above the QCP () as the temperature is lowered (Fig. 6 and S7), crosses over to 1 at intermediate temperatures, and to 2 on further cooling, signaling a FL regime at the lowest temperatures. Resitivity measured down to mK for , shown in Fig. 8a as and in Fig. 8b-d as vs. , demonstrate unambiguously a crossover from NFL (n 2) to FL behavior (n = 2) as moves away from . Closest to (Fig. 8b), the exponent is registered over nearly two decades in from 50 mK to 3 K. Similarly, NFL (n = 1.7, Fig. 8c) or FL (n = 2, Fig. 8d) behavior occurs over two decades in temperature as the field increases up to 10 T.
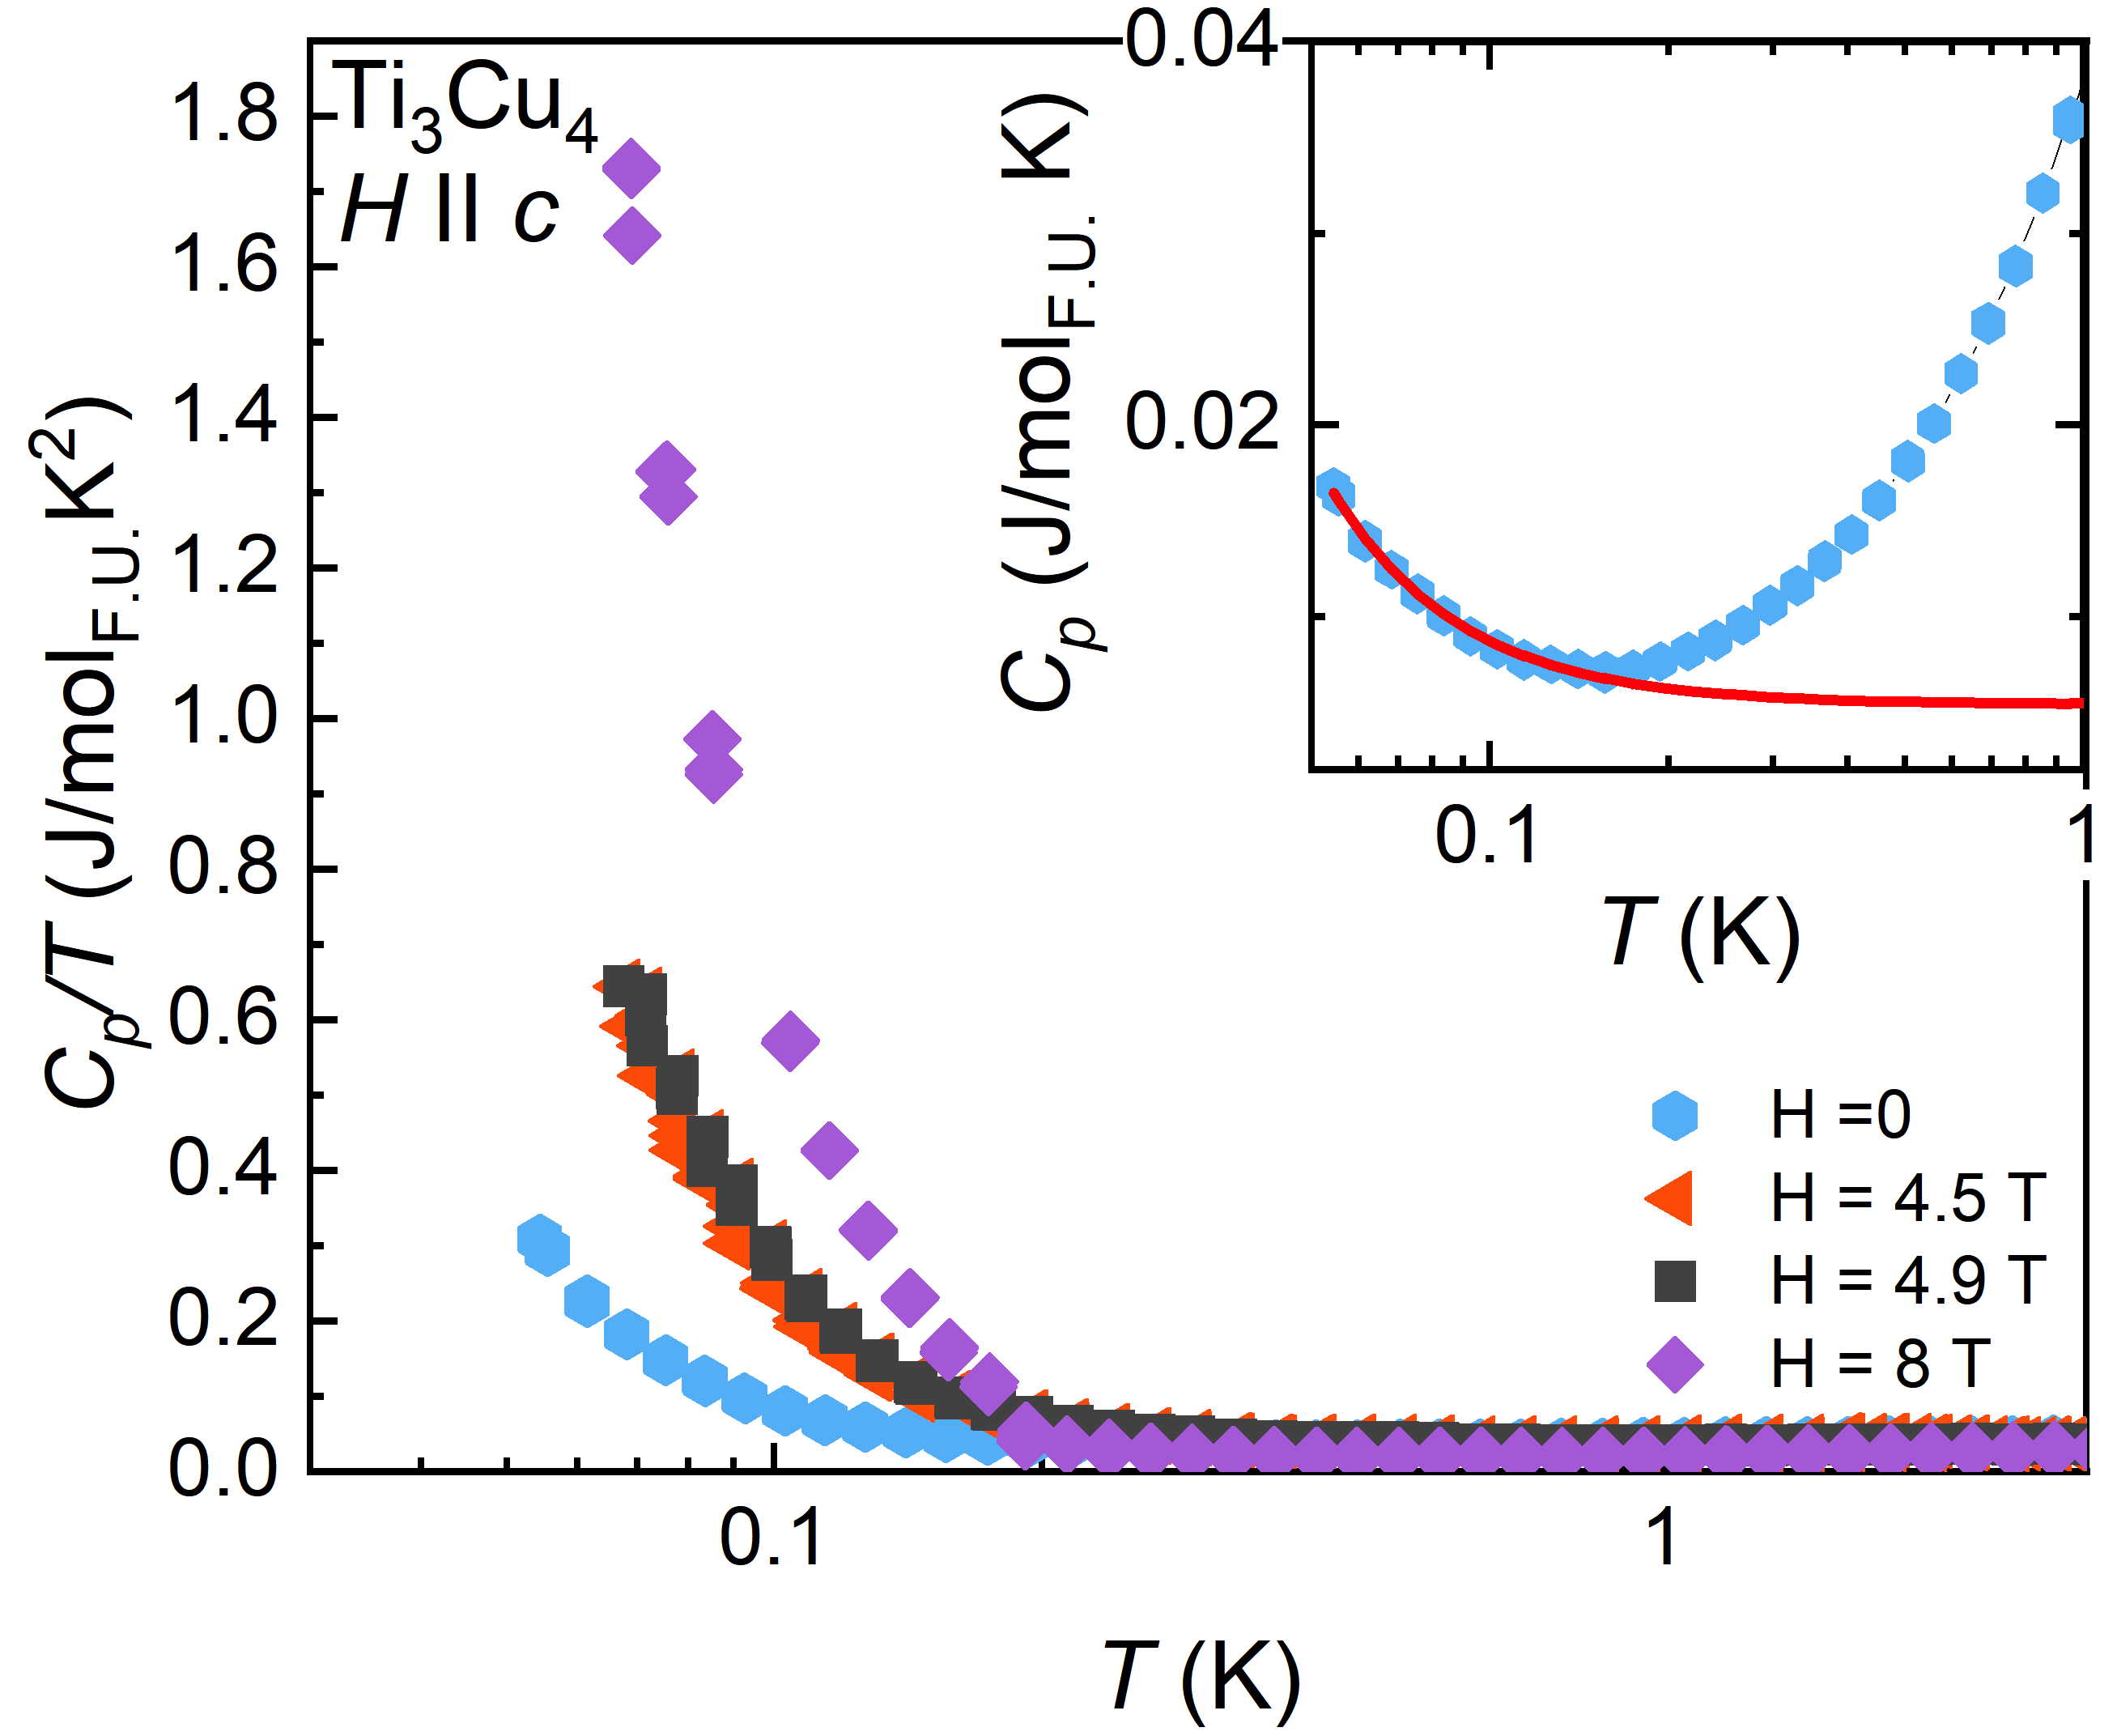
Beyond transport, thermodynamic measurements reinforce the NFL behavior with the divergence of the low specific heat (Fig. 8e). For metals, at low , the electronic contribution to the specific heat is expected to dominate and the temperature dependence varies as , where 1 for a FL, and is often associated with NFL behavior due to quantum fluctuations Stewart (2001); Löhneysen et al. (2007). Fig. 8e shows plotted on a semi-log scale for 0.3 K 1.5 K at various fields 0 8 T. For , the data plateau towards the lowest temperature 0.3 K, as expected for a FL. A power-law divergence () develops at 4.5 T and persists beyond Hc up to 8 T, with the steepest divergence close to (black squares). Fig. S8 in the Supplementary Materials shows evidence for a Schottky anomaly at the lowest temperatures, as increases on cooling starting at higher as is increased. However, for temperatures beyond those where the Schottky contribution is largest (T 0.3 K, Fig. 8e), the specific heat does not follow the trend expected from Schottky anomaly (no increase in T as H increases). The divergence in C is therefore ascribed to NFL behavior, consistent with the transport measurements.
II Discussion
Ti3Cu4 is an itinerant antiferromagnet for which the ordering temperature can be suppressed towards 0 with a modest field resulting in a field induced QCP. This is therefore not only a new itinerant magnet with no magnetic elements, one of very few known to date, but also the first known such compound with a field-induced QCP. Typically, itinerant antiferromagnetism is associated with a strongly nested Fermi surface, where the nesting wavevector dictates the magnetic wavevector. Such mechanism applies to the prototypical itinerant antiferromagnet or SDW system, elemental Cr Fawcett (1988). While the calculated Fermi surface for Ti3Cu4 appears nested in the plane (Fig. 5a-c), the experimental propagation wavevector points in the out-of-plane direction (Fig. 3). An added conundrum is that the Fermi level lies on a sharp van-Hove singularity in the density of states (Fig. 5e), which is often associated with itinerant ferromagnetism. A similar scenario was found in TiAu Svanidze et al. (2015b), and it was later established that a new mechanism of mirrored van-Hove singularities in the Fermi surface separated by the experimentally determined magnetic wavevector lie at the origin of the itinerant antiferromagnetism Goh and Pickett (2016, 2017). Further efforts are required to elucidate the novel origin of the magnetism in Ti3Cu4.
From a quantum criticality perspective, Ti3Cu4 represents as a system without 4f electrons and is therefore free of the complication of f-d electron hybridization in the quantum critical regime. Since Fermi surface instabilities lie at the heart of itinerant magnetism, it is intuitive to understand how the effects of pressure or chemical doping may alter the Fermi surface, and in turn, the resulting magnetism or quantum criticality. However, it is less clear what the role of magnetic field is in tuning magnetism towards a QCP. Compared to f-electron systems, d-electron systems, have much larger energy scales associated with the magnetism which is reflected in their ordering temperatures (): 0.1 to 5 K in the former, and 10-100’s of K in the latter. Ti3Cu4 (= 11.3 K) is unique in that the energy scale is seemingly small (a magnetic field of = 4.87 T can completely suppress the magnetism) compared to TiAu (= 26 K) Svanidze et al. (2015b) or Cr (= 311 K) Fawcett (1988) where magnetic fields have little effect on the magnetic ordering temperature. Ti3Cu4 therefore provides a model platform to study the of role magnetic fields as a tuning parameter for itinerant magnetic quantum criticality. It will be specifically informative to compare and contrast future studies when either chemical doping or pressure are used as the non-thermal control parameter. For example, doping Cr with V suppresses the magnetic order ending in a QCP Lee et al. (2004); Jaramillo et al. (2009), while Re and Ru Nishihara et al. (1986); Chatani and Endoh (2003); Matthias et al. (1962); Nishihara et al. (1985) suppress the magnetism resulting in a superconducting state which may be unconventional Ramazanoglu et al. (2018).
III Conclusion
In conclusion, Ti3Cu4 is a new itinerant AFM with no magnetic elements with K and The magnetic state is remarkably fragile for a transition metal magnetic system, and can be suppressed to with a small applied field = 4.87 T, resulting in a field-induced QCP. Measurements of the magnetic Grüneisen ratio provide strong evidence for the quantum criticality, reinforced by the accompanied NFL-FL crossover revealed by the resistivity and heat capacity measurements. Ti3Cu4 can serve as as a platform for comparison and potentially generalization of the quantum critical behavior over the entire spectrum of magnetic moments from local to itinerant. In future studies, it will be important to understand the effects of pressure, chemical substitution, and disorder in Ti3Cu4, all of which are currently underway.
IV Methods
Ti3Cu4 was grown using a self flux method with a starting composition of Ti0.33Cu0.67. The constituent elements were arc melted and placed in a Ta crucible and sealed under partial argon pressure in a quartz ampoule. After the initial heating to 950∘C over 6 hours, a first step of fast cooling to 935∘C was followed by slow cooling to 895∘C over 62 hours, where the crystals were separated from the excess flux by spinning in a centrifuge.
Single-crystal X-ray diffraction data on a Ti3Cu4 crystal were collected at 100(2) K with the use of a Bruker APEX2 Bruker (2009) kappa diffractometer equipped with graphite-monochromized MoKα radiation ( = 0.71073 Å). The data collection strategy was optimized with the use of the algorithm COSMO in the APEX2 package as a series of and scans. Scans of 0.5º at 6 s/frame were used. The detector to crystal distance was 40 mm. The collection of intensity data as well as cell refinement and data reduction were carried out with the use of the program APEX2. The structure of Ti3Cu4was initially solved and refined with the use of the SHELX-14 algorithms of the SHELXTL program package Sheldrick (2008). Face indexed absorption, incident beam, and decay corrections of the substructure were performed with the use of the program SADABS SADABS (2008). The program STRUCTURE TIDY Gelato and Parthé (1987) in PLATON Spek (2014) was used to standardize the atomic positions of the substructure. Furthermore, powder diffraction was done using a Bruker x- ray diffractometer with Cu radiation. Powder and single crystal x-ray diffraction confirm the reported crystal structure for Ti3Cu4 Schubert et al. (1964), apart from signs of mechanical stresses and possible minute ( 5) Ta inclusions (non-magnetic). However, these do not affect the results of the current study on the magnetic properties of Ti3Cu4. The crystallographic file in CIF format for the refined structure has been deposited with the Cambridge Crystallographic Data Centre as CCDC 1968322. These data may be obtained free of charge by contacting CCDC at (https://www.ccdc.cam.ac.uk/).
DC magnetization measurements were performed in a Quantum Design (QD) magnetic property measurement system from T = 1.8 K - 300 K. The same system was used with a helium 3 insert for measurements from T = 0.5 K - 1.8 K. Magnetization measurements up to =30 T were carried out with an extraction magnetometer in a capacitor-powered pulsed magnet at the NHMFL pulsed field facility. The ac electrical resistivity measurements were made in a QD physical properties measurement system (PPMS) with a standard four-point probe technique for temperatures 2–300 K and magnetic field from 0-14 T. Measurements downt to 50 mK were made in the same instrument equipped with a dilution refridgerator.
Quasi-adiabatic magnetocaloric effect (MCE) measurements between KK were carried out in a QD PPMS equiped with a dilution refrigerator using the heat capacity option to ensure a quasi-adiabatic environment. The thermometer of a heat capacity puck with no sample mounted was calibrated as a function of field and temperature at several fields ranging from T. From this procedure, a calibration map was extablished for the thermometer resistance , temperature , and magnetic field . The sample was then mounted and cooled using the heat capacity option to ensure that the sample temperature was at equilibrium with the bath temperature. was then swept at a rate of 105 Oe/s between 3.5 and 5.5 T and of the heat capacity thermometer was measured. Using the calibration map, the measured was converted to temperature, from which the MCE values were derived.
Muon spin relaxation (SR) measurements were performed on a mosaic of single crystals at the M20 surface muon channel at TRIUMF. The crystals were mounted on a low background sample holder with aluminum backed Mylar tape with their crystallographic -axis parallel to the incident muon beam. Measurements were performed in the LAMPF spectrometer between 2 and 20 K in both longitudinal field geometry and in a weak ( G) transverse field. In this experiment, the total initial asymmetry, , was determined by fitting the asymmetry spectra at high temperatures, in the weakly relaxing paramagnetic regime, giving . Here we present the normalized muon polarization, . Measurements were collected with the muon spins parallel to their momentum, such that the muons are implanted with their spins pointing along the -axis, and also in spin-rotated mode, such that the muons are implanted with their spins lying within the crystals’ -plane. No significant anisotropy was detected. The muon decay asymmetry spectra were fitted with a least squares minimization protocol using the muSRfit software package.
Single crystal elastic neutron scattering measurements were performed on the meV fixed-incident energy triple axis spectrometer HB-1A at the High Flux Isotope Reactor, Oak Ridge National Laboratory. This experiment was performed with standard collimation settings (40’-40’-40’-80’), and the energy resolution at the elastic line was 1 meV (full-width half-maximum). Adhesive was used to attach a 70 mg single crystal of Ti3Cu4 onto an aluminum plate. Measurements were performed in both the and the scattering planes. The crystal was oriented prior to the experiment at the CG-1B neutron alignment station. Measurements were performed at temperatures between 5 K and 20 K using a closed-cycle refrigerator. The magnetic symmetry analysis was performed with SARAh Wills (2000) and Rietveld refinements were carried out using FullProf Rodríguez-Carvajal (1993).
We performed Density Functional Theory (DFT) based calculations using the full-potential WIEN2K Blaha et al. (2001) and pseudo-potential ABINIT Gonze et al. (2002) packages, with the generalized gradient approximation (GGA) used to account for the exchange-correlation interactions Perdew et al. (1996). The band structure, density of states and Fermi surfaces were computed with the full-potential WIEN2K code, whereas ABINIT was used to perform large supercell calculations to accommodate various spin-density wave (SDW) orders. We ensured that both the codes produced similar results at the level of the primitive unit cell. The polyhedron integration method was used to calculate the electronic density of states (DOS).
V Data Availability
The data that support the findings of this study are available from the corresponding authors upon reasonable request.
Acknowledgements.
VI Acknowledgements
We are grateful to Bassam Hitti and Gerald Morris for their assistance with the muon spin relaxation measurements at TRIUMF. We are also grateful to Anand B. Puthirath for help with some characterization, as well as Warren Pickett and Jeff Lynn for useful conversations. We thank Ian Fisher and Pierre Massat for fruitful discussions on MCE measurements. JMM was supported by the National Science Foundation Graduate Research Fellowship under Grant DGE 1842494. CLH, SL and EM acknowledge support from NSF DMR 1903741. CLH is also supported by the Ministry of Science and Technology (MOST) in Taiwan under grant no. MOST 109-2112-M-006-026-MY3 and 110-2124-M-006-009. AMH, JB, YC, and GML were supported by the Natural Sciences and Engineering Research Council of Canada. VL and AHN were supported by the Robert A. Welch Foundation grant C-1818. AHN was also supported by the National Science Foundation grant no. DMR-1917511 and would like to thank for the hospitality of the Kavli Institute for Theoretical Physics, supported in part by the National Science Foundation under Grant No. NSF PHY-1748958. A portion of this work was performed at the National High Magnetic Field Laboratory, which is supported by the National Science Foundation Cooperative Agreement No. DMR-1644779, the State of Florida and the United States Department of Energy. Use was made of the Integrated Molecular Structure Education and Research Center X-ray Facility at Northwestern University, which has received support from the Soft and Hybrid Nanotechnology Experimental Resource (NSF Grant ECCS-1542205), the State of Illinois, and the International Institute for Nanotechnology. At Argonne, this work was supported by the US Department of Energy, Office of science, Basic Energy Sciences, Materials Sciences and Engineering Division (structural analysis). A portion of this research used resources at the High Flux Isotope Reactor, a DOE Office of Science User Facility operated by the Oak Ridge National Laboratory.
VII Author contributions
E.M. designed the study. J.M.M. and K.B. grew the crystals. J.M.M. performed magnetization, transport, heat capacity, and magneto-caloric effect measurements. E.M., J.M.M., A.M.H., C.L.H. and S.L. performed the analysis and wrote the manuscript with contributions from all authors. V.L. and A.H.V. performed DFT calculations and analysis. A.M.H., J.B., Y. C. and G.M.L. performed muon spin relaxation measurements and data analysis. A.A.A, L.L.K., and A.M.H. performed elastic neutron scattering measurements and analysis. C.D.M and M.G.K were responsible for the structural characterization. F.W. measured the high field magnetization data.
VIII Competing financial interests
The authors declare no competing financial interests.
References
- Johnston (2010) David C Johnston, “The puzzle of high temperature superconductivity in layered iron pnictides and chalcogenides,” Advances in Physics 59, 803–1061 (2010).
- Keimer et al. (2015) Bernhard Keimer, Steven A Kivelson, Michael R Norman, Shinichi Uchida, and J Zaanen, “From quantum matter to high-temperature superconductivity in copper oxides,” Nature 518, 179 (2015).
- Dai et al. (2012) Pengcheng Dai, Jiangping Hu, and Elbio Dagotto, “Magnetism and its microscopic origin in iron-based high-temperature superconductors,” Nature Physics 8, 709 (2012).
- Dai (2015) Pengcheng Dai, “Antiferromagnetic order and spin dynamics in iron-based superconductors,” Reviews of Modern Physics 87, 855 (2015).
- Julian et al. (1998) SR Julian, FV Carter, FM Grosche, RKW Haselwimmer, SJ Lister, ND Mathur, GJ McMullan, C Pfleiderer, SS Saxena, IR Walker, et al., “Non-fermi-liquid behaviour in magnetic d-and f-electron systems,” Journal of Magnetism and Magnetic Materials 177, 265–270 (1998).
- Stewart (2001) GR Stewart, “Non-fermi-liquid behavior in d-and f-electron metals,” Reviews of Modern Physics 73, 797 (2001).
- Löhneysen et al. (2007) Hilbert v Löhneysen, Achim Rosch, Matthias Vojta, and Peter Wölfle, “Fermi-liquid instabilities at magnetic quantum phase transitions,” Reviews of Modern Physics 79, 1015 (2007).
- Coleman et al. (2001) P Coleman, C Pépin, Qimiao Si, and Revaz Ramazashvili, “How do fermi liquids get heavy and die?” Journal of Physics: Condensed Matter 13, R723 (2001).
- Schröder et al. (2000) A Schröder, G Aeppli, R Coldea, M Adams, O Stockert, Hv Löhneysen, E Bucher, R Ramazashvili, and Piers Coleman, “Onset of antiferromagnetism in heavy-fermion metals,” Nature 407, 351–355 (2000).
- Custers et al. (2003) J Custers, P Gegenwart, H Wilhelm, K Neumaier, Y Tokiwa, O Trovarelli, C Geibel, F Steglich, C Pépin, and Piers Coleman, “The break-up of heavy electrons at a quantum critical point,” Nature 424, 524–527 (2003).
- Gegenwart et al. (2008a) Philipp Gegenwart, Qimiao Si, and Frank Steglich, “Quantum criticality in heavy-fermion metals,” Nature Physics 4, 186 (2008a).
- Heuser et al. (1998) Karsten Heuser, E-W Scheidt, Thomas Schreiner, and Gregory R Stewart, “Inducement of non-fermi-liquid behavior with a magnetic field,” Physical Review B 57, R4198 (1998).
- Gegenwart et al. (2002) Philipp Gegenwart, J Custers, C Geibel, K Neumaier, T Tayama, K Tenya, O Trovarelli, and F Steglich, “Magnetic-field induced quantum critical point in YbRh2Si2,” Physical Review Letters 89, 056402 (2002).
- Gegenwart et al. (2006) Philipp Gegenwart, Y Tokiwa, T Westerkamp, F Weickert, Jeroen Custers, J Ferstl, C Krellner, C Geibel, P Kerschl, KH Müller, et al., “High-field phase diagram of the heavy-fermion metal YbRh2Si2,” New Journal of Physics 8, 171 (2006).
- Gegenwart et al. (2008b) Philipp Gegenwart, T Westerkamp, C Krellner, M Brando, Y Tokiwa, C Geibel, and F Steglich, “Unconventional quantum criticality in YbRh2Si2,” Physica B: Condensed Matter 403, 1184–1188 (2008b).
- Tokiwa et al. (2013) Y Tokiwa, M Garst, P Gegenwart, Sergey L Bud’ko, and Paul C Canfield, “Quantum bicriticality in the heavy-fermion metamagnet YbAgGe,” Physical Review Letters 111, 116401 (2013).
- Zhao et al. (2019) Hengcan Zhao, Jiahao Zhang, Meng Lyu, Sebastian Bachus, Yoshifumi Tokiwa, Philipp Gegenwart, Shuai Zhang, Jinguang Cheng, Yi-feng Yang, Genfu Chen, et al., “Quantum-critical phase from frustrated magnetism in a strongly correlated metal,” Nature Physics 15, 1261–1266 (2019).
- Paglione et al. (2003) Johnpierre Paglione, MA Tanatar, DG Hawthorn, Etienne Boaknin, RW Hill, F Ronning, M Sutherland, Louis Taillefer, C Petrovic, and PC Canfield, “Field-induced quantum critical point in ,” Physical Review Letters 91, 246405 (2003).
- Balicas et al. (2005) Luis Balicas, Satoru Nakatsuji, Hannoh Lee, Pedro Schlottmann, Timothy P Murphy, and Zachary Fisk, “Magnetic field-tuned quantum critical point in CeAuSb2,” Physical Review B 72, 064422 (2005).
- Morosan et al. (2006) E Morosan, SL Bud’ko, YA Mozharivskyj, and PC Canfield, “Magnetic-field-induced quantum critical point in YbPtIn and in single crystals,” Physical Review B 73, 174432 (2006).
- Das et al. (2019) Debarchan Das, Daniel Gnida, Piotr Wiśniewski, and Dariusz Kaczorowski, “Magnetic field-driven quantum criticality in antiferromagnetic CePtIn4,” Proceedings of the National Academy of Sciences 116, 20333–20338 (2019).
- Zapf et al. (2014) Vivien Zapf, Marcelo Jaime, and CD Batista, “Bose-einstein condensation in quantum magnets,” Reviews of Modern Physics 86, 563 (2014).
- Daou et al. (2006) R Daou, C Bergemann, and SR Julian, “Continuous evolution of the fermi surface of CeRu2Si2 across the metamagnetic transition,” Physical Review Letters 96, 026401 (2006).
- Aoki et al. (2011) Dai Aoki, Tristan Combier, Valentin Taufour, Tatsuma D. Matsuda, Georg Knebel, Hisashi Kotegawa, and Jacques Flouquet, “Ferromagnetic quantum critical endpoint in UCoAl,” Journal of the Physical Society of Japan 80, 094711 (2011).
- Tokiwa et al. (2016) Y Tokiwa, M Mchalwat, RS Perry, and Philipp Gegenwart, “Multiple metamagnetic quantum criticality in Sr3Ru2O7,” Physical Review Letters 116, 226402 (2016).
- Grigera et al. (2003) SA Grigera, RA Borzi, AP Mackenzie, SR Julian, RS Perry, and Y Maeno, “Angular dependence of the magnetic susceptibility in the itinerant metamagnet Sr3Ru2O7,” Physical Review B 67, 214427 (2003).
- Rost et al. (2009) AW Rost, RS Perry, J-F Mercure, AP Mackenzie, and SA Grigera, “Entropy landscape of phase formation associated with quantum criticality in Sr3Ru2O7,” Science 325, 1360–1363 (2009).
- A. et al. (2001) Grigera S. A., Perry R. S., Schofield A. J., Chiao M., Julian S. R., Longzarich G. G., Ikeda S. I., Maeno Y., Millis A. J., and Mackenzie A. P., “Magnetic field-tuned quantum criticality in the metallic ruthenate Sr3Ru2O7,” Science 294, 329 (2001).
- Hertz (1976) John A Hertz, “Quantum critical phenomena,” Physical Review B 14, 1165 (1976).
- Millis (1993) AJ Millis, “Effect of a nonzero temperature on quantum critical points in itinerant fermion systems,” Physical Review B 48, 7183 (1993).
- Millis et al. (2002) AJ Millis, AJ Schofield, GG Lonzarich, and SA Grigera, “Metamagnetic quantum criticality in metals,” Physical review letters 88, 217204 (2002).
- Belitz and Kirkpatrick (2017) D Belitz and TR Kirkpatrick, “Quantum triple point and quantum critical end points in metallic magnets,” Physical review letters 119, 267202 (2017).
- Matthias and Bozorth (1958) BT Matthias and RM Bozorth, “Ferromagnetism of a zirconium-zinc compound,” Physical Review 109, 604 (1958).
- Sokolov et al. (2006) DA Sokolov, MC Aronson, W Gannon, and Z Fisk, “Critical phenomena and the quantum critical point of ferromagnetic ,” Physical Review Letters 96, 116404 (2006).
- Matthias et al. (1961) BT Matthias, AM Clogston, HJ Williams, E Corenzwit, and RC Sherwood, “Ferromagnetism in solid solutions of scandium and indium,” Physical Review Letters 7, 7 (1961).
- Svanidze et al. (2015a) E Svanidze, L Liu, B Frandsen, BD White, T Besara, T Goko, T Medina, TJS Munsie, GM Luke, D Zheng, et al., “Non-fermi liquid behavior close to a quantum critical point in a ferromagnetic state without local moments,” Physical Review X 5, 011026 (2015a).
- Svanidze et al. (2015b) E Svanidze, Jiakui K Wang, Tiglet Besara, L Liu, Qingzhen Huang, T Siegrist, Benjamin Frandsen, Jeffrey W Lynn, Andriy H Nevidomskyy, Monika B Gamża, et al., “An itinerant antiferromagnetic metal without magnetic constituents,” Nature Communications 6, 7701 (2015b).
- Svanidze et al. (2017) E. Svanidze, T. Besara, J. K. Wang, D. Geiger, L. Prochaska, J. M. Santiago, J. W. Lynn, S. Paschen, T. Siegrist, and E. Morosan, “Quantum critical point in the Sc-doped itinerant antiferromagnet TiAu,” Physical Review B 95, 220405 (2017).
- Yeh et al. (2002) A Yeh, Yeong-Ah Soh, J Brooke, G Aeppli, TF Rosenbaum, and SM Hayden, “Quantum phase transition in a common metal,” Nature 419, 459–462 (2002).
- Jaramillo et al. (2009) R Jaramillo, Yejun Feng, JC Lang, Z Islam, G Srajer, PB Littlewood, DB McWhan, and TF Rosenbaum, “Breakdown of the bardeen–cooper–schrieffer ground state at a quantum phase transition,” Nature 459, 405–409 (2009).
- Jaramillo et al. (2010) R Jaramillo, Yejun Feng, J Wang, and TF Rosenbaum, “Signatures of quantum criticality in pure cr at high pressure,” Proceedings of the National Academy of Sciences 107, 13631–13635 (2010).
- Fawcett (1988) Eric Fawcett, “Spin-density-wave antiferromagnetism in chromium,” Reviews of Modern Physics 60, 209 (1988).
- Schubert et al. (1964) K Schubert, HG Meissner, and W Rossteutscher, “Einige strukturdaten metallischer phasen (11),” Naturwissenschaften 51, 507–507 (1964).
- Fisher (1962) Michael E Fisher, “Relation between the specific heat and susceptibility of an antiferromagnet,” Philosophical Magazine 7, 1731–1743 (1962).
- Fisher and Langer (1968) Michael E Fisher and JS Langer, “Resistive anomalies at magnetic critical points,” Physical Review Letters 20, 665 (1968).
- Hayano et al. (1979) RS Hayano, YJ Uemura, J Imazato, N Nishida, T Yamazaki, and R Kubo, “Zero-and low-field spin relaxation studied by positive muons,” Physical Review B 20, 850 (1979).
- Moriya and Kawabata (1973) Tôru Moriya and Arisato Kawabata, “Effect of spin fluctuations on itinerant electron ferromagnetism,” Journal of the Physical Society of Japan 34, 639–651 (1973).
- Hasegawa and Moriya (1974) Hideo Hasegawa and Tôru Moriya, “Effect of spin fluctuations on itinerant electron antiferromagnetism,” Journal of the Physical Society of Japan 36, 1542–1553 (1974).
- Takahashi and Moriya (1985) Yoshinori Takahashi and Tôru Moriya, “Quantitative aspects of the theory of weak itinerant ferromagnetism,” Journal of the Physical Society of Japan 54, 1592–1598 (1985).
- Nakayama and Moriya (1987) Kazuya Nakayama and Tôru Moriya, “Quantitative aspects of the theory of weak itinerant antiferromagnetism,” Journal of the Physical Society of Japan 56, 2918–2926 (1987).
- Konno and Moriya (1987) Rikio Konno and Tôru Moriya, “Quantitative aspects of the theory of nearly ferromagnetic metals,” Journal of the Physical Society of Japan 56, 3270–3278 (1987).
- Moriya (1981) Tôru Moriya, “Spin fluctuations in ferromagnetic metals–temperature variation of local moment and short range order,” Journal of the Physical Society of Japan 51, 420–434 (1981).
- Rhodes and Wohlfarth (1963) P Rhodes and Eo P Wohlfarth, “The effective curie-weiss constant of ferromagnetic metals and alloys,” Proceedings of the Royal Society of London. Series A. Mathematical and Physical Sciences 273, 247–258 (1963).
- Comin and Damascelli (2016) Riccardo Comin and Andrea Damascelli, “Resonant x-ray scattering studies of charge order in cuprates,” Annual Review of Condensed Matter Physics 7, 369–405 (2016).
- Giamarchi and Tsvelik (1999) T Giamarchi and AM Tsvelik, “Coupled ladders in a magnetic field,” Physical Review B 59, 11398 (1999).
- (56) “Bose-Einstein condensation of dilute magnons in TlCuCl3,” .
- Nohadani et al. (2004) Omid Nohadani, Stefan Wessel, Bruce Normand, and Stephan Haas, “Universal scaling at field-induced magnetic phase transitions,” Physical Review B 69, 220402 (2004).
- Gen et al. (2019) M Gen, T Nomura, DI Gorbunov, S Yasin, PT Cong, C Dong, Y Kohama, EL Green, JM Law, MS Henriques, et al., “Magnetocaloric effect and spin-strain coupling in the spin-nematic state of LiCuVO4,” Physical Review Research 1, 033065 (2019).
- Tokiwa et al. (2009) Yoshi Tokiwa, Teodora Radu, Christoph Geibel, Frank Steglich, and Philipp Gegenwart, “Divergence of the magnetic grüneisen ratio at the field-induced quantum critical point in YbRh2Si2,” Physical review letters 102, 066401 (2009).
- Zhu et al. (2003) Lijun Zhu, Markus Garst, Achim Rosch, and Qimiao Si, “Universally diverging grüneisen parameter and the magnetocaloric effect close to quantum critical points,” Physical Review Letters 91, 066404 (2003).
- Garst and Rosch (2005) Markus Garst and Achim Rosch, “Sign change of the grüneisen parameter and magnetocaloric effect near quantum critical points,” Physical Review B 72, 205129 (2005).
- Gegenwart (2016) Philipp Gegenwart, “Grüneisen parameter studies on heavy fermion quantum criticality,” Reports on Progress in Physics 79, 114502 (2016).
- Ueda (1977) Kazuo Ueda, “Electrical resistivity of antiferromagnetic metals,” Journal of the Physical Society of Japan 43, 1497–1508 (1977).
- Cao et al. (2004) G Cao, WH Song, YP Sun, and XN Lin, “Violation of the Mott–Ioffe–Regel limit: high-temperature resistivity of itinerant magnets Srn+1RunO (n= 2, 3,) and CaRuO3,” Solid State Communications 131, 331–336 (2004).
- Goh and Pickett (2016) Wen Fong Goh and Warren E Pickett, “A mechanism for weak itinerant antiferromagnetism: Mirrored van hove singularities,” EPL (Europhysics Letters) 116, 27004 (2016).
- Goh and Pickett (2017) Wen Fong Goh and Warren E Pickett, “Competing magnetic instabilities in the weak itinerant antiferromagnetic TiAu,” Physical Review B 95, 205124 (2017).
- Lee et al. (2004) M Lee, A Husmann, TF Rosenbaum, and G Aeppli, “High resolution study of magnetic ordering at absolute zero,” Physical review letters 92, 187201 (2004).
- Nishihara et al. (1986) Y Nishihara, Y Yamaguchi, M Tokumoto, K Takeda, and K Fukamichi, “Superconductivity and magnetism of bcc cr-ru alloys,” Physical Review B 34, 3446 (1986).
- Chatani and Endoh (2003) K Chatani and Y Endoh, “Competition of antiferromagnetism and superconductivity in cr–ru alloys,” Journal of the Physical Society of Japan 72, 17–20 (2003).
- Matthias et al. (1962) BT Matthias, TH Geballe, VB Compton, E Corenzwit, and GW Hull Jr, “Superconductivity of chromium alloys,” Physical Review 128, 588 (1962).
- Nishihara et al. (1985) Y Nishihara, Y Yamaguchi, T Kohara, and M Tokumoto, “Itinerant-electron antiferromagnetism and superconductivity in bcc cr-re alloys,” Physical Review B 31, 5775 (1985).
- Ramazanoglu et al. (2018) M Ramazanoglu, Benjamin G Ueland, DK Pratt, LW Harriger, Jeffrey W Lynn, G Ehlers, GE Granroth, Sergey L Bud’ko, Paul C Canfield, Deborah L Schlagel, et al., “Suppression of antiferromagnetic spin fluctuations in superconducting cr 0.8 ru 0.2,” Physical Review B 98, 134512 (2018).
- Bruker (2009) APEX2 Version Bruker, “1 and saint version 7.34 a data collection and processing software, bruker analytical x-ray instruments,” Inc., Madison, WI, USA (2009).
- Sheldrick (2008) George M Sheldrick, “A short history of shelx,” Acta Crystallographica Section A: Foundations of Crystallography 64, 112–122 (2008).
- SADABS (2008) GM Sheldrick SADABS, “Department of structural chemistry,” University of Göttingen, Göttingen, Germany (2008).
- Gelato and Parthé (1987) LM Gelato and E Parthé, “Structure tidy–a computer program to standardize crystal structure data,” Journal of Applied Crystallography 20, 139–143 (1987).
- Spek (2014) AL Spek, “Platon, a multipurpose crystallographic tool,” Utrecht University, Utrecht, The Netherlands (2014).
- Wills (2000) AS Wills, “A new protocol for the determination of magnetic structures using simulated annealing and representational analysis (sarah),” Physica B: Condensed Matter 276, 680–681 (2000).
- Rodríguez-Carvajal (1993) Juan Rodríguez-Carvajal, “Recent advances in magnetic structure determination by neutron powder diffraction,” Physica B 192, 55–69 (1993).
- Blaha et al. (2001) Peter Blaha, Karlheinz Schwarz, Georg Madsen, D Kvasnicka, and J Luitz, “Wien2k: An augmented plane wave plus local orbitals program for calculating crystal properties,” Technische Universität Wien, Wien 28 (2001).
- Gonze et al. (2002) X. Gonze, J.-M. Beuken, R. Caracas, F. Detraux, M. Fuchs, G.-M. Rignanese, L. Sindic, M. Verstraete, G. Zerah, F. Jollet, M. Torrent, A. Roy, M. Mikami, Ph. Ghosez, J.-Y. Raty, and D.C. Allan, “First-principles computation of material properties: The ABINIT software project,” Computational Materials Science 25, 478–492 (2002).
- Perdew et al. (1996) John P. Perdew, Kieron Burke, and Matthias Ernzerhof, “Generalized gradient approximation made simple,” Physical Review Letters 77, 3865–3868 (1996).
- (83) “We thank reviewer 1 for pointing this detail out,” .
Supplementary Materials
In order to investigate the magnetic anisotropy in Ti3Cu4 the zero field limit of the magnetic susceptibility is measured as . isotherms were measured from -0.01 T to 0.01 T at temperatures ranging from 1.8 K to 15.3 K. Two such isotherms are shown in Fig. S1a for T = 1.8 K, with (open triangles) and (full triangles). is extracted from the slope of each isotherm and plotted vs. temperature in Fig. S1b where the open circles correspond to the field parallel to the axis, and full circles for field parallel to the plane.
The AFM ordering temperature is extracted from the peak in Fig. S2 (left axis, blue diamonds), and the peaks in (right axis, open circles), and (right axis, open squares). The phase diagram Fig. 6 is constructed using the , , and manifolds shown in Fig. S3, while example curves of the data are displayed in Fig. S7. It should be noted that for , extracted from the magnetic susceptibility is determined by the derivative , from temperature sweeps of magnetization measured at constant field . Interestingly, while the data (Fig. 4 and S2) are consistent with a spin polarized state, a broad shoulder appears in the in at low most clearly seen in the 8 T data in Fig. 4b. It is possible that the field-polarized state may have its own internal degrees of freedom causing the broad hump Rev .
The DOS at the Fermi level is dominated by orbitals of Ti, whereas the Cu states lie well below the Fermi level, as shown in Fig. S5. In order to further determine the orbital composition of the DOS near the Fermi level, we have performed DOS calculations projected onto various orbitals (see Fig. 5e,f in the main text), with the conclusion that the largest contribution to the DOS at the chemical potential originated from Ti2 orbitals. These are the orbitals that play the decisive role in the magnetic ordering in this material.
In order to determine the nature of magnetism in this material, we have performed a series of spin-density wave (SDW) calculations with different commensurate ordering wave-vectors parallel to and direction. The trial SDW states were implemented using the non-collinear ABINIT code, within an enlarged supercell consistent with the pitch of a target SDW spiral state. The largest unit cell had dimension , corresponding to the wavevector . The comparison of the total energies of various competing SDW states is shown in Fig. S6, from which it follows that the lowest energy state is realized for the wavevector , corresponding to the wavelength of the magnetic spiral order. Interestingly, the experimentally determined ordered state with the wavevector lies only marginally higher in energy, about 1 meV/f.u. (red dashed line in Fig. S6). This energy difference is however within the error bars of the DFT calculations and is not conclusive. What is evident from this analysis is that several candidate SDW states, including the experimentally observed one, are predicted to lie very close in energy. The approximations inherent in the DFT treatment of exchange and correlations do not allow us to predictably deduce which of these competing states is realized, and we instead rely on the neutron diffraction study (see main text) to deduce the ordered state with wavevector .