White dwarfs with planetary remnants in the era of Gaia I:
six emission line systems
Abstract
White dwarfs with emission lines from gaseous debris discs are among the rarest examples of planetary remnant hosts, but at the same time they are key objects for studying the final evolutionary stage of planetary systems. Making use of the large number of white dwarfs identified in Gaia DR2, we are conducting a survey of planetary remnants and here we present the first results of our search: six white dwarfs with gaseous debris discs. This first publication focuses on the main observational properties of these objects and highlights their most unique features. Three systems in particular stand out: WD J084602.47+570328.64 displays an exceptionally strong infrared excess which defies the standard model of a geometrically-thin, optically-thick dusty debris disc; WD J213350.72+242805.93 is the hottest gaseous debris disc host known with K; and WD J052914.32–340108.11, in which we identify a record number of 51 emission lines from five elements. These discoveries shed light on the underlying diversity in gaseous debris disc systems and bring the total number of these objects to 21. With these numbers we can now start looking at the properties of these systems as a class of objects rather than on a case-by-case basis.
keywords:
white dwarfs – Circumstellar matter – planetary systems – line: profiles – stars: individual:WD J023415.51–040609.28 – stars: individual: WD J052914.32–340108.11 – stars: individual:WD J084602.47+570328.64 – stars: individual: WD J193037.65–502816.91 – stars: individual:WD J213350.72+242805.93 – stars: individual: WD J221202.88–135240.131 Introduction
Over 95 per cent of all stars in the Galaxy, including our Sun and virtually all known planet hosts, will end their lives as white dwarfs. It is now well established that planets can survive the late evolution of their host star (Villaver & Livio, 2007; Mustill & Villaver, 2012; Rao et al., 2018; Martin et al., 2020; Vanderburg et al., 2020), and evidence of such planetary remnants is seen in the photospheric metal contamination of a large number white dwarfs (Zuckerman et al., 2010; Koester et al., 2014; Hollands et al., 2017; Barstow et al., 2014; Schreiber et al., 2019). Heavy element pollution in the atmosphere of white dwarfs is largely the result of the accretion of rocky planetesimals which have been scattered into the tidal disruption radius of the white dwarf, where they are torn apart into dusty debris that subsequently spreads out to form a circumstellar disc (Veras et al., 2014, 2015; Redfield et al., 2017; Malamud & Perets, 2020a, b). These debris discs can be detected via reprocessed infrared (IR) flux in excess to what is expected from a single isolated white dwarf. About 1–3 per cent of all white dwarfs display this IR signature (Barber et al., 2012; Rocchetto et al., 2015; Wilson et al., 2019; Rebassa-Mansergas et al., 2019). In addition to the thermal IR emission from the dust, a small subset of these already rare systems (Manser et al., 2020) also display line emission typically strongest at the Ca ii 8600 Å triplet due to the presence of a gaseous component of the disc (Gänsicke et al., 2006) . These Doppler-broadened, emission features are largely consistent with models for gas in Keplerian orbits in a flat disc (Horne & Marsh, 1986), though evidence indicates that these orbits can reach high eccentricities. (Gänsicke et al., 2008; Cauley et al., 2018; Manser et al., 2019). In a large fraction of these systems the Ca emission features show some level of asymmetry, suggesting a non-axisymmetric intensity distribution in the disc. Long term monitoring of the prototype SDSS J1228+1040 has revealed a smooth evolution of the line profile morphology interpreted as the precession of a persisting asymmetric intensity pattern with a period of yr (Manser et al., 2016a). A similar morphological evolution of emission lines has also been observed in the gaseous debris disc around HE 1349–2305 (Dennihy et al., 2018), albeit on a much shorter period of 1.4 yr. Where information on the spatial distribution of the gas is available, it appears to be co-located with the dust and thus not confined within the sublimation radius of the dust (Melis et al., 2010; Manser et al., 2016a). These findings imply that some mechanism keeps generating the gas which would otherwise re-condense on time scales of months (Metzger et al., 2012). The exact process underlying the generation of the circumstellar gas remains intensely debated and different scenarios have been proposed, including dust sublimation at the inner edge of the debris disc followed by subsequent radial spreading (Rafikov, 2011; Metzger et al., 2012), and collisional cascades grinding the debris into gas (Kenyon & Bromley, 2017a, b).
Recently, a follow-up study of SDSS J1228+1040 revealed additional variability in the strength and shape of the gas emission features with a period of 123.4 min. The authors interpreted this periodic signal as the orbital signature of a dense planetesimal, with sufficient internal strength to survive tidal disruption, embedded in the dust disc (Manser et al., 2019). Manser et al. (2019, 2020) also speculated that the presence of such solid planetary bodies may be at the origin of the gaseous discs in all such systems, particularly since dynamical mechanisms exist to embed and circularize planetesimals within the discs (Grishin & Veras, 2019; O’Connor & Lai, 2020).
Recently, Gänsicke et al. (2019) announced the discovery of the white dwarf WD J091405.30+191412.25 (hereafter WD J0914+1914), which hosts a different kind of gaseous disc of planetary origin. This disc presents no observable dusty component, and both the material in the disc and that accreted onto the white dwarf have compositions rich in volatile elements (H, O, and S), consistent with a giant planet atmosphere. We consider this star a member of a separate class, and for the rest of this paper "gaseous debris disc" and similar expressions will only refer to systems with debris originating from rocky bodies and which display Ca ii emission lines.
Though our understanding of these gaseous discs is still incomplete, all evidence indicates that they are the signposts of dynamical instabilities and recent disruption events (Xu & Jura, 2014; Xu et al., 2018; Swan et al., 2020), making these systems ideal laboratories to study the formation and evolution of planetary debris discs (Rafikov, 2011; Metzger et al., 2012), and possibly even the incidence of closely orbiting planetesimals at white dwarfs (Manser et al., 2019). According to recent estimates only 4 per cent of white dwarfs with dusty debris discs, or 0.067 per cent of all white dwarfs display emission features from a gaseous component (Manser et al., 2020). The sheer rarity of these objects represents the first and largest obstacle to overcome, but by combining the white dwarfs found by Gaia (Gentile Fusillo et al., 2019), with additional infrared data from large area surveys, we now have the opportunity to find virtually all visible debris disc hosts (Rebassa-Mansergas et al., 2019; Dennihy et al., 2020b; Dennihy et al., 2020a; Xu et al., 2020).
Here, we present the first results from our ongoing search for new white dwarfs with remnants of planetary systems: the identification of six emission line gas disc systems. The work presented here focuses on the discovery of these systems and reports their unique observational properties. The detailed abundance analysis and modelling of the gaseous discs goes beyond the scope of this paper, and will be presented elsewhere.
2 A search for IR excess to new white dwarfs
In our search for remnants of planetary systems we cross-matched all high-confidence white dwarf candidates () brighter than Gaia from Gentile Fusillo et al. (2019) with the large area IR surveys: the two micron All Sky Survey (2MASS, Skrutskie et al. 2006), UKIRT Infrared Deep Sky Survey (UKIDSS, Lawrence et al. 2007), UKIRT Hemisphere Survey (UHS, Dye et al. 2018, Vista Hemisphere Survey (VHS, McMahon et al. 2013), and the Wide-field Infrared Survey Explorer (WISE, Wright et al. 2010).
In order to account for the different epochs of observations across the different surveys, we carried out the cross-match with each survey in separate steps. Firstly, for all Gaia white dwarf candidates we retrieved every matching source within a radius of 30 arcsec in each IR survey. We then computed the difference in epoch of observations for all the matching pairs and “forward projected” the coordinates of all matching sources using Gaia proper motions. Finally we repeated the cross-match using a 2 arcsec matching radius and considered the closest pairs as true matches (see Gentile Fusillo et al. 2017 for details). We found that per cent of the white dwarfs have reliable WISE detections and per cent of them band observation from a near-IR survey. We then constructed spectral energy distributions (SEDs) for all white dwarf candidates with matching IR photometry. Gaia optical photometry was fitted with H-atmosphere white dwarf models and the resulting IR flux of the white dwarf was compared with the IR survey photometry. Targets with at least a 3 excess in the WISE bands were selected as initial debris disc host candidates (Fig. 1).
The IR coverage provided by WISE ( Å and Å) is essential to detect debris disc candidates, but the large beam of the telescope can easily lead to source confusion and thus to false positives (e.g Dennihy et al. 2020b). In order to reduce contamination from spurious sources and optimize our spectroscopic follow-up, we prioritize targets which display at least a 2 IR-excess already at the near-IR band. The higher spatial resolution of band images facilitates the vetting of potential contamination from background sources, though it cannot fully eliminate this problem (Dennihy et al., 2020b). Systems for which the IR flux is in excess only in the WISE and bands were considered lower priority and were observed mostly as backup targets. We identified high-confidence debris disc hosts and over 70 additional lower-priority ones. We began an extensive spectroscopic follow-up campaign to confirm the nature of these systems. To date we have obtained spectra for 27 systems and, among them, have identified four gaseous debris disc hosts: WD J023415.51–040609.28 (WD J0234–0406), WD J052914.32–340108.11 (WD J0529–3401), WD J193037.65–502816.91 (WD J1930–5028), WD J213350.72+242805.93 (WD J2133+2428; Fig. 1). WD J2133+2428 was observed as a low-priority target (no band observations available) while the other three stars were considered high-confidence targets. All four systems were not known as white dwarfs prior to Gaia DR2, highlighting the major impact that of the significantly increased sample of white dwarfs that is available now (Gentile Fusillo et al., 2019).
Additionally, we report here on two further systems which were already known before Gaia DR2 and which we identified as debris disc hosts during an earlier spectroscopic follow-up pilot campaign. WD J084602.47+570328.64 (WD J0846+5703) was first recognised as a H-atmosphere white dwarf (SBSS 0842+572) by Stepanian et al. (1999). It was recently confirmed to host an IR excess via Spitzer observations (Swan et al., 2020) and it was independently recognised as a gaseous debris disc host by Melis et al. (2020). WD J221202.88–135239.96 (WD J2212–1352) was first identified as a candidate white dwarf in the ATLAS survey as ATLAS J221202.83–135240.13 (Gentile Fusillo et al., 2017). The IR excess about this star was also confirmed by Spitzer observations (Dennihy et al., 2020b).
For consistency we refer to all six systems using the Gaia-based naming convention WD JHHMMSS.SSDDMMSS.SS (J2000 coordinates) established in Gentile Fusillo et al. (2019), or abbreviation of these names.
3 Spectroscopic observations of the six gaseous debris hosts
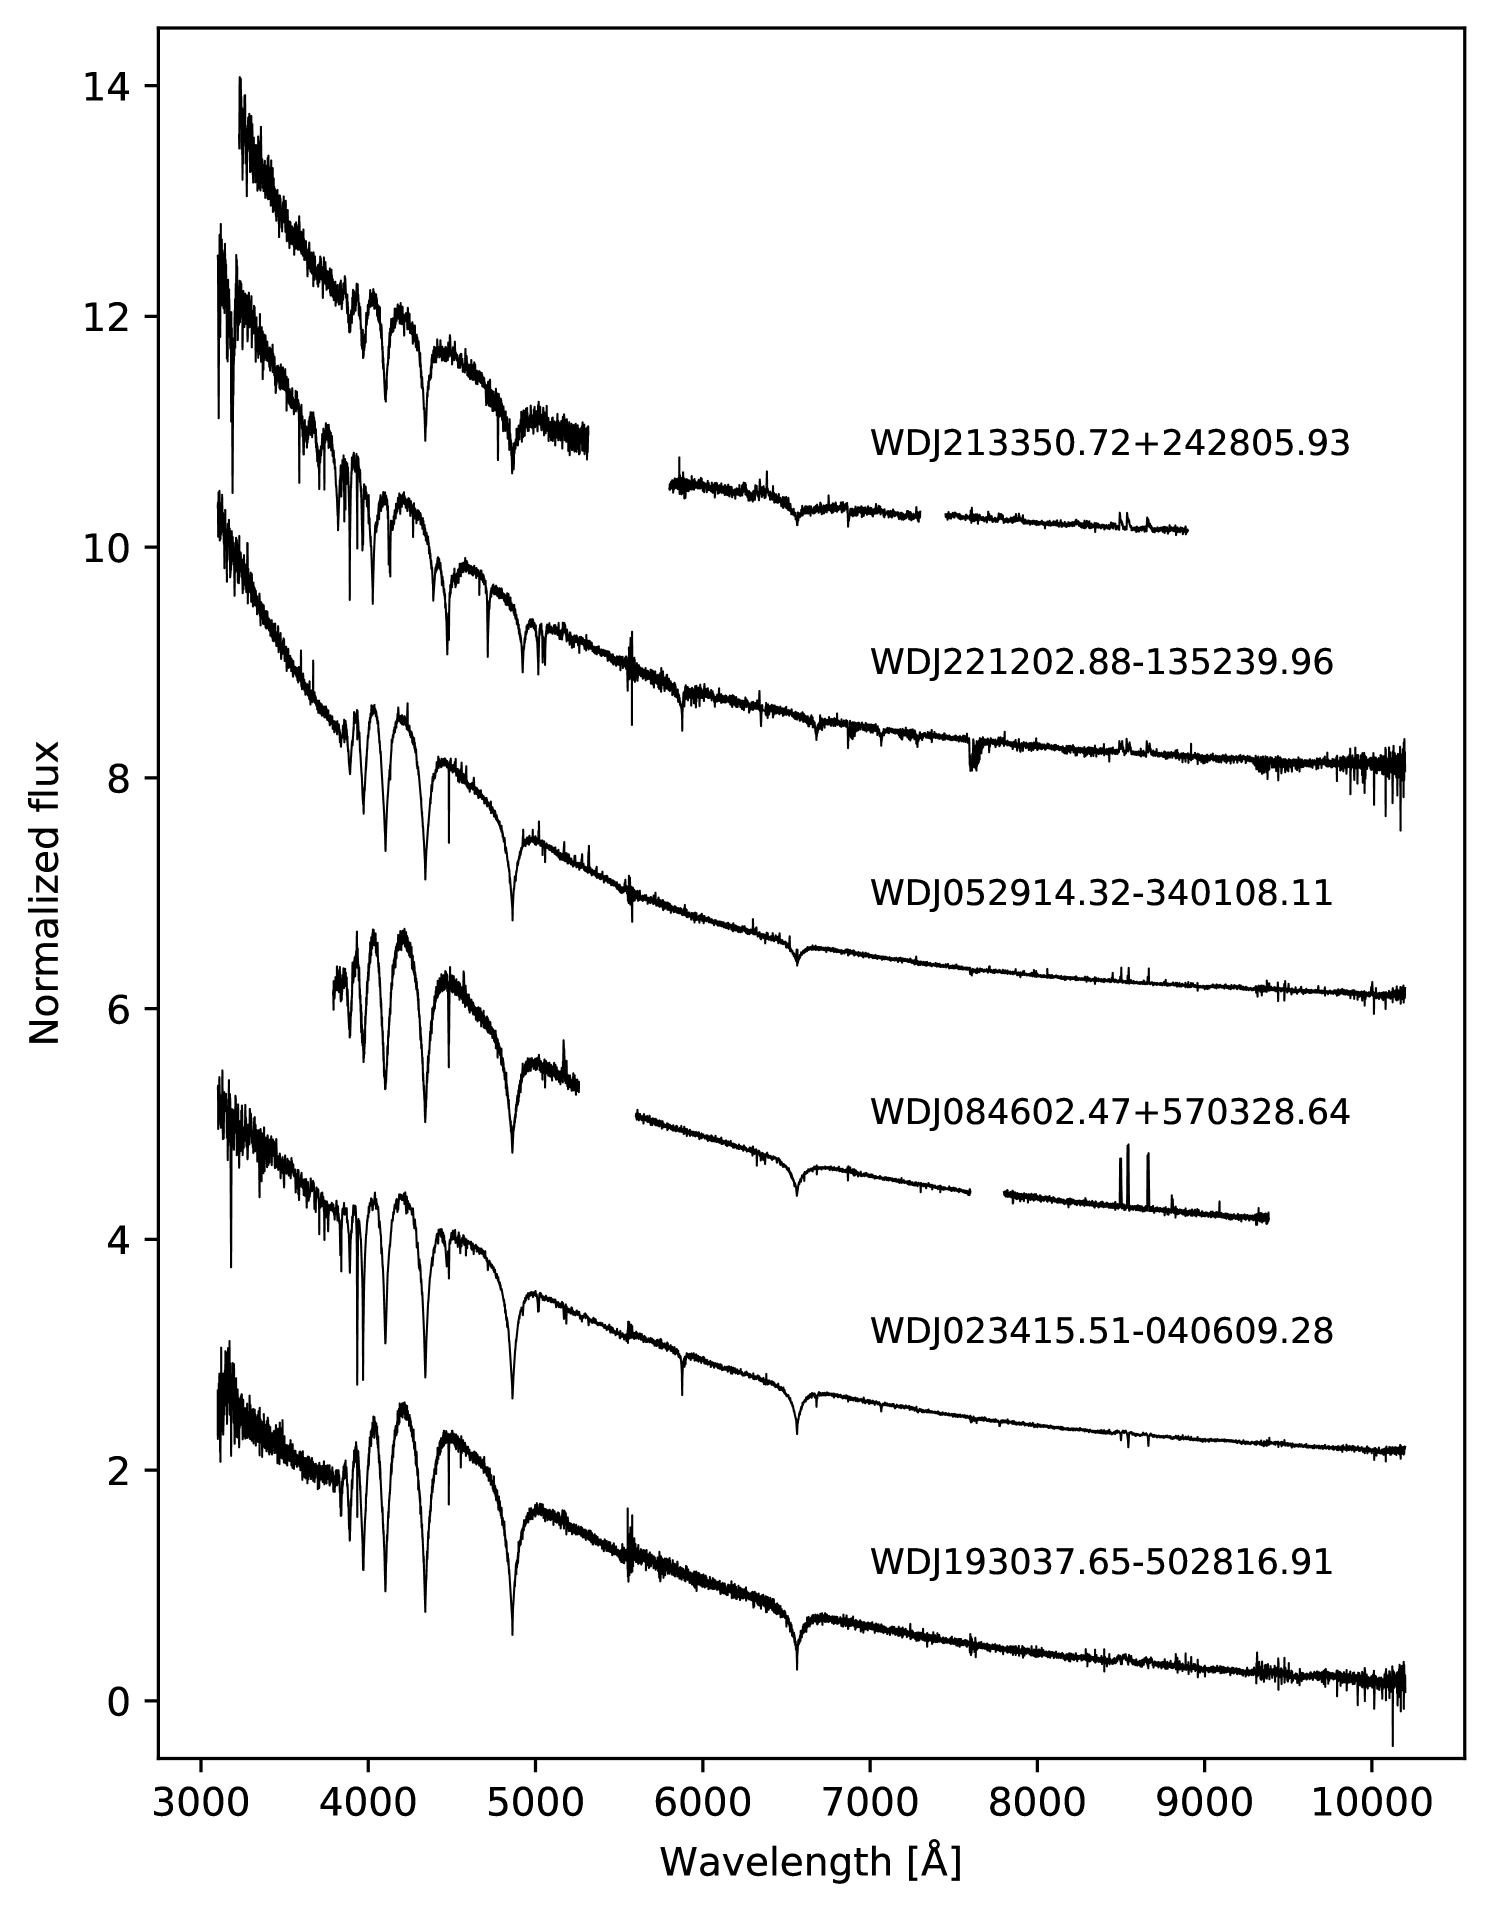
Spectroscopic observations of the six targets were obtained between 2016 and 2020 using a variety of instruments: X-shooter on the Very Large Telescope (VLT, Vernet et al. 2011) observatory at Cerro Paranal, Chile; the Intermediate Resolution Spectrograph 111http://www.ing.iac.es/Astronomy/instruments/isis/ (ISIS) on the William Herschel Telescope (WHT) at Roque de los Muchachos Observatory (ORM) in La Palma, Spain; the Optical System for Imaging and low-Intermediate-Resolution Integrated Spectroscopy (OSIRIS, Sánchez et al. 2012) on the Gran Telescopio Canarias (GTC) at the ORM; the High Resolution Echelle Spectrometer (HIRES, Vogt et al., 1994) on the 10-m Keck I telescope at Mauna Kea Observatory, Hawaii; the Magellan Echellette Spectrograph (MagE) on the 6.5 m Baade Magellan telescope at Las Campanas Observatory, Chile; and the FAST spectrograph on the 1.5 m Fred Lawrence Whipple Observatory telescope on mount Hopkins, Arizona (Fabricant et al., 1998). The observation log is reported in Table 1, and sample spectra are displayed in Fig 12 and 13.
X-shooter observations were carried out using a 1 arcsec slit aperture for the UVB arm and 0.9 arcsec for the VIS arm. In all cases flux in the NIR arm was insufficient for any meaningful analysis. On average the resolving power of our X-shooter spectra is in the UVB arm and in the VIS arm. All data were reduced using the standard procedures within the reflex222http://www.eso.org/sci/software/reflex/ reduction tool developed by ESO. Telluric lines removal was performed on the reduced spectra using molecfit (Smette et al., 2015; Kausch et al., 2015).
ISIS observations were obtained using the R600B and R600R gratings, in the ISIS blue and red arms respectively; two central wavelength settings were used for each arm, nominally 3930 Å and 4540 Å in the blue and 6562 Å and 8200 Å in the red, which were chosen to cover important atmospheric lines, such as the Balmer series and Ca H and K, as well as the Ca ii emission triplet in addition to other potential emission features (e.g. Fe ii/Mg i 5175 Å). The slit width varied between 1 arcsec and 1.5 arcsec depending on the observing conditions and we employed a binning of , resulting in an average resolution of Å. ISIS spectra were de-biased and flat-fielded using the standard starlink333The starlink Software Group homepage website is http://starlink.jach.hawaii.edu/starlink. packages kappa, figaro and convert. We carried out optimal spectral extraction using the package pamela. Wavelength and flux calibration were performed using the routines within the software molly 444pamela and molly were written by T. R. Marsh and can be found in the starlink distribution Hawaiki and later releases. (Marsh, 1989).
The OSIRIS spectroscopy of WD J0846+5703 was obtained using the R2500I grism with a 0.6 arcsec slit, and binning the detector . This setup provides wavelength coverage over Å at a resolution of . The data were bias and flat-field corrected using the standard tools within iraf555iraf is distributed by the National Optical Astronomy Observatories.. We performed sky background subtraction and optimal spectral extraction (Horne, 1986) using the pamela data reduction software (Marsh, 1989). Finally, we used molly4 to wavelength-calibrate the spectra by fitting the arc lamp spectra with low-order polynomials to obtain the pixel-to-wavelength solution.
Additional high-resolution spectroscopy of WD J0846+5703 was obtained with HIRES on 2017 May 22. We used the HIRESb configuration with the C5 decker ( arcsec slit), covering the spectral range Å and providing a nominal spectral resolving power of . We retrieved the pipeline-reduced spectra for each individual echelle order from the Keck Observatory Archive, and subsequently combined the data of all three exposures for a few selected emission lines.
FAST and MagE observations were originally conducted for identification of white dwarf candidates, and therefore did not cover the Ca ii triplet. MagE spectra were acquired using a slit width of 1 arcsec and achieved a resolving power . The data were reduced using the python pipeline based on CarPy (Kelson et al., 2000; Kelson, 2003) and flux calibration was then performed using standard IRAF routines. FAST spectroscopy was obtained using the 600 l/mm grating and the 2 arcsec slit, which provides Å wavelength coverage at 2.2 Å spectral resolution. The spectrum was then processed with standard IRAF routines (Mink et al. 2020 AJ submitted).
| Name | Instrument | Telescope | Date | Exposure time [s] | program ID |
|---|---|---|---|---|---|
| WD J023415.51–040609.28 | X-shooter | VLT | 2019-01-11 | UVB 2650, VIS 2600 | 0102.C-0351 |
| WD J052914.32–340108.11 | X-shooter | VLT | 2019-01-11 | UVB 41250, VIS 41200 | 0102.C-0351 |
| X-shooter | VLT | 2020-01-04 | UVB 21250, VIS 21200 | 1103.D-0763 | |
| X-shooter | VLT | 2020-03-02 | UVB 21250, VIS 21200 | 1103.D-0763 | |
| WD J084602.47+570328.64 | FLWO | FAST | 2016-01-23 | 1200 | 166 |
| ISIS | WHT | 2016-04-12 | 31200, 31800, 21000 | W/2016A/26 | |
| OSIRIS | GTC | 2016-05-18 | R2500I, | GTC05-16ADDT | |
| OSIRIS | GTC | 2016-09-19 | R2500I, | GTC1-16ITP | |
| HIRES | Keck | 2017-05-22 | HIRESb, | N188 | |
| ISIS | WHT | 2017-09-25 | 31800 | SW2017b01 | |
| ISIS | WHT | 2019-04-14 | 21000 | ITP2018/19 | |
| WD J193037.65–502816.91 | X-shooter | VLT | 2019-05-25 | UVB 2581, VIS 2531 | 0102.C-0351 |
| WD J213350.72+242805.93 | ISIS | WHT | 2019-07-05 | 2900 | 082-MULTIPLE-2/19A |
| WD J221202.88–135239.96 | MagE | Baade | 2016-08-24 | 3600 | CN2016B-76 |
| X-shooter | VLT | 2016-09-28 | UVB 21221, VIS 21255 | 097.D-1029 | |
| ISIS | WHT | 2017-09-24 | 41800 | SW2017b01 | |
| X-shooter | VLT | 2018-05-18 | UVB 21475, VIS 21420 | 5100.C-0407 | |
| X-shooter | VLT | 2019-07-06 | UVB 21475, VIS 21420 | 5100.C-0407 | |
| ISIS | WHT | 2019-08-03 | 31200 | W/2019A/09 |
4 Stellar parameters
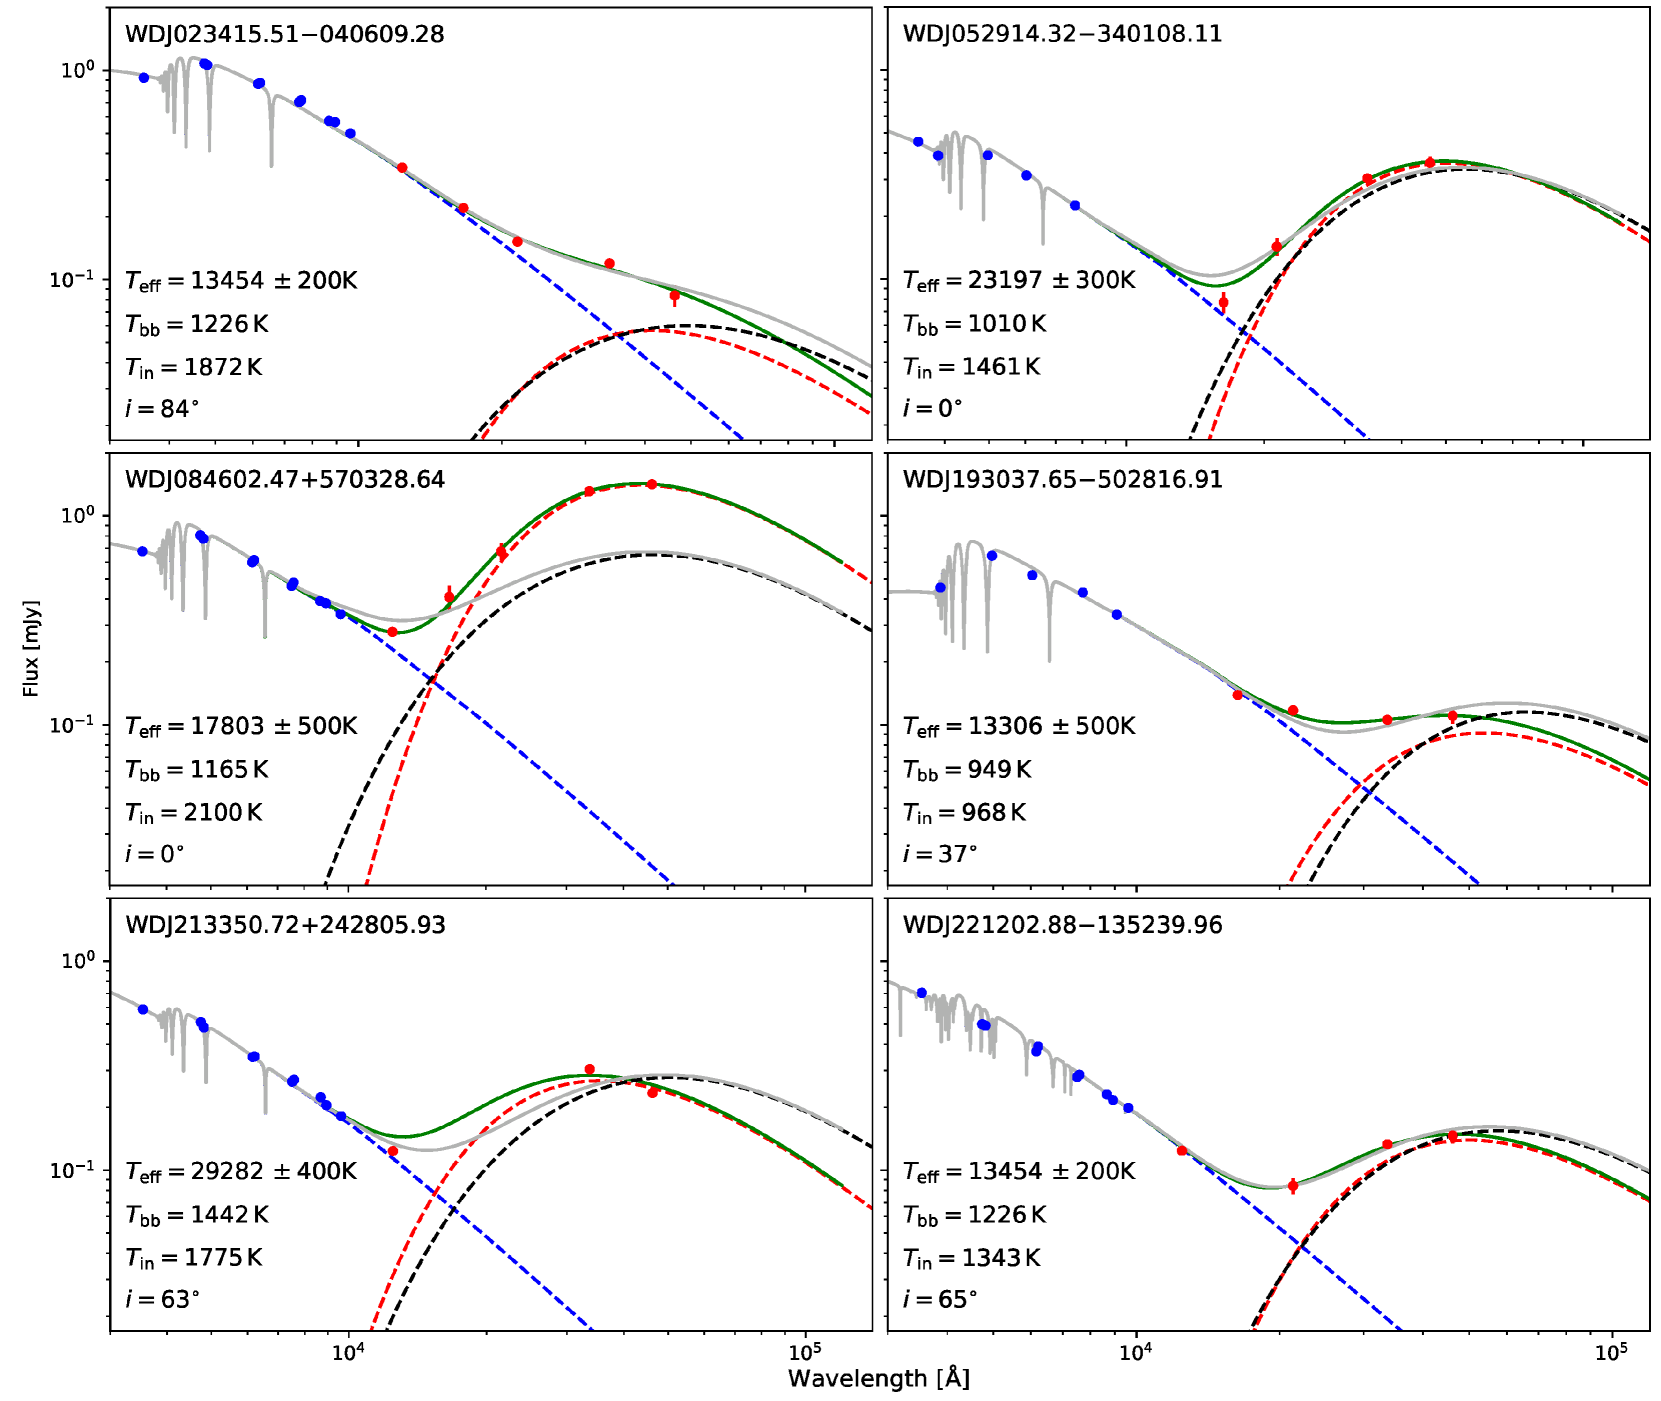
The initial SEDs used to identify our targets as IR-excess candidates relied on limited optical photometry and on simplified white dwarf models which assumed a H-atmosphere in all cases. In order to correctly characterize the white dwarfs in these systems and thus quantify the strength of the thermal emission, we used model comparison to fit for the white dwarfs surface gravity, log , effective temperature, , and H-abundance, [H/He] (for He-atmosphere white dwarfs). The newly determined stellar parameters were then used to construct more reliable SEDs for all objects in our sample (displayed in Fig. 1).
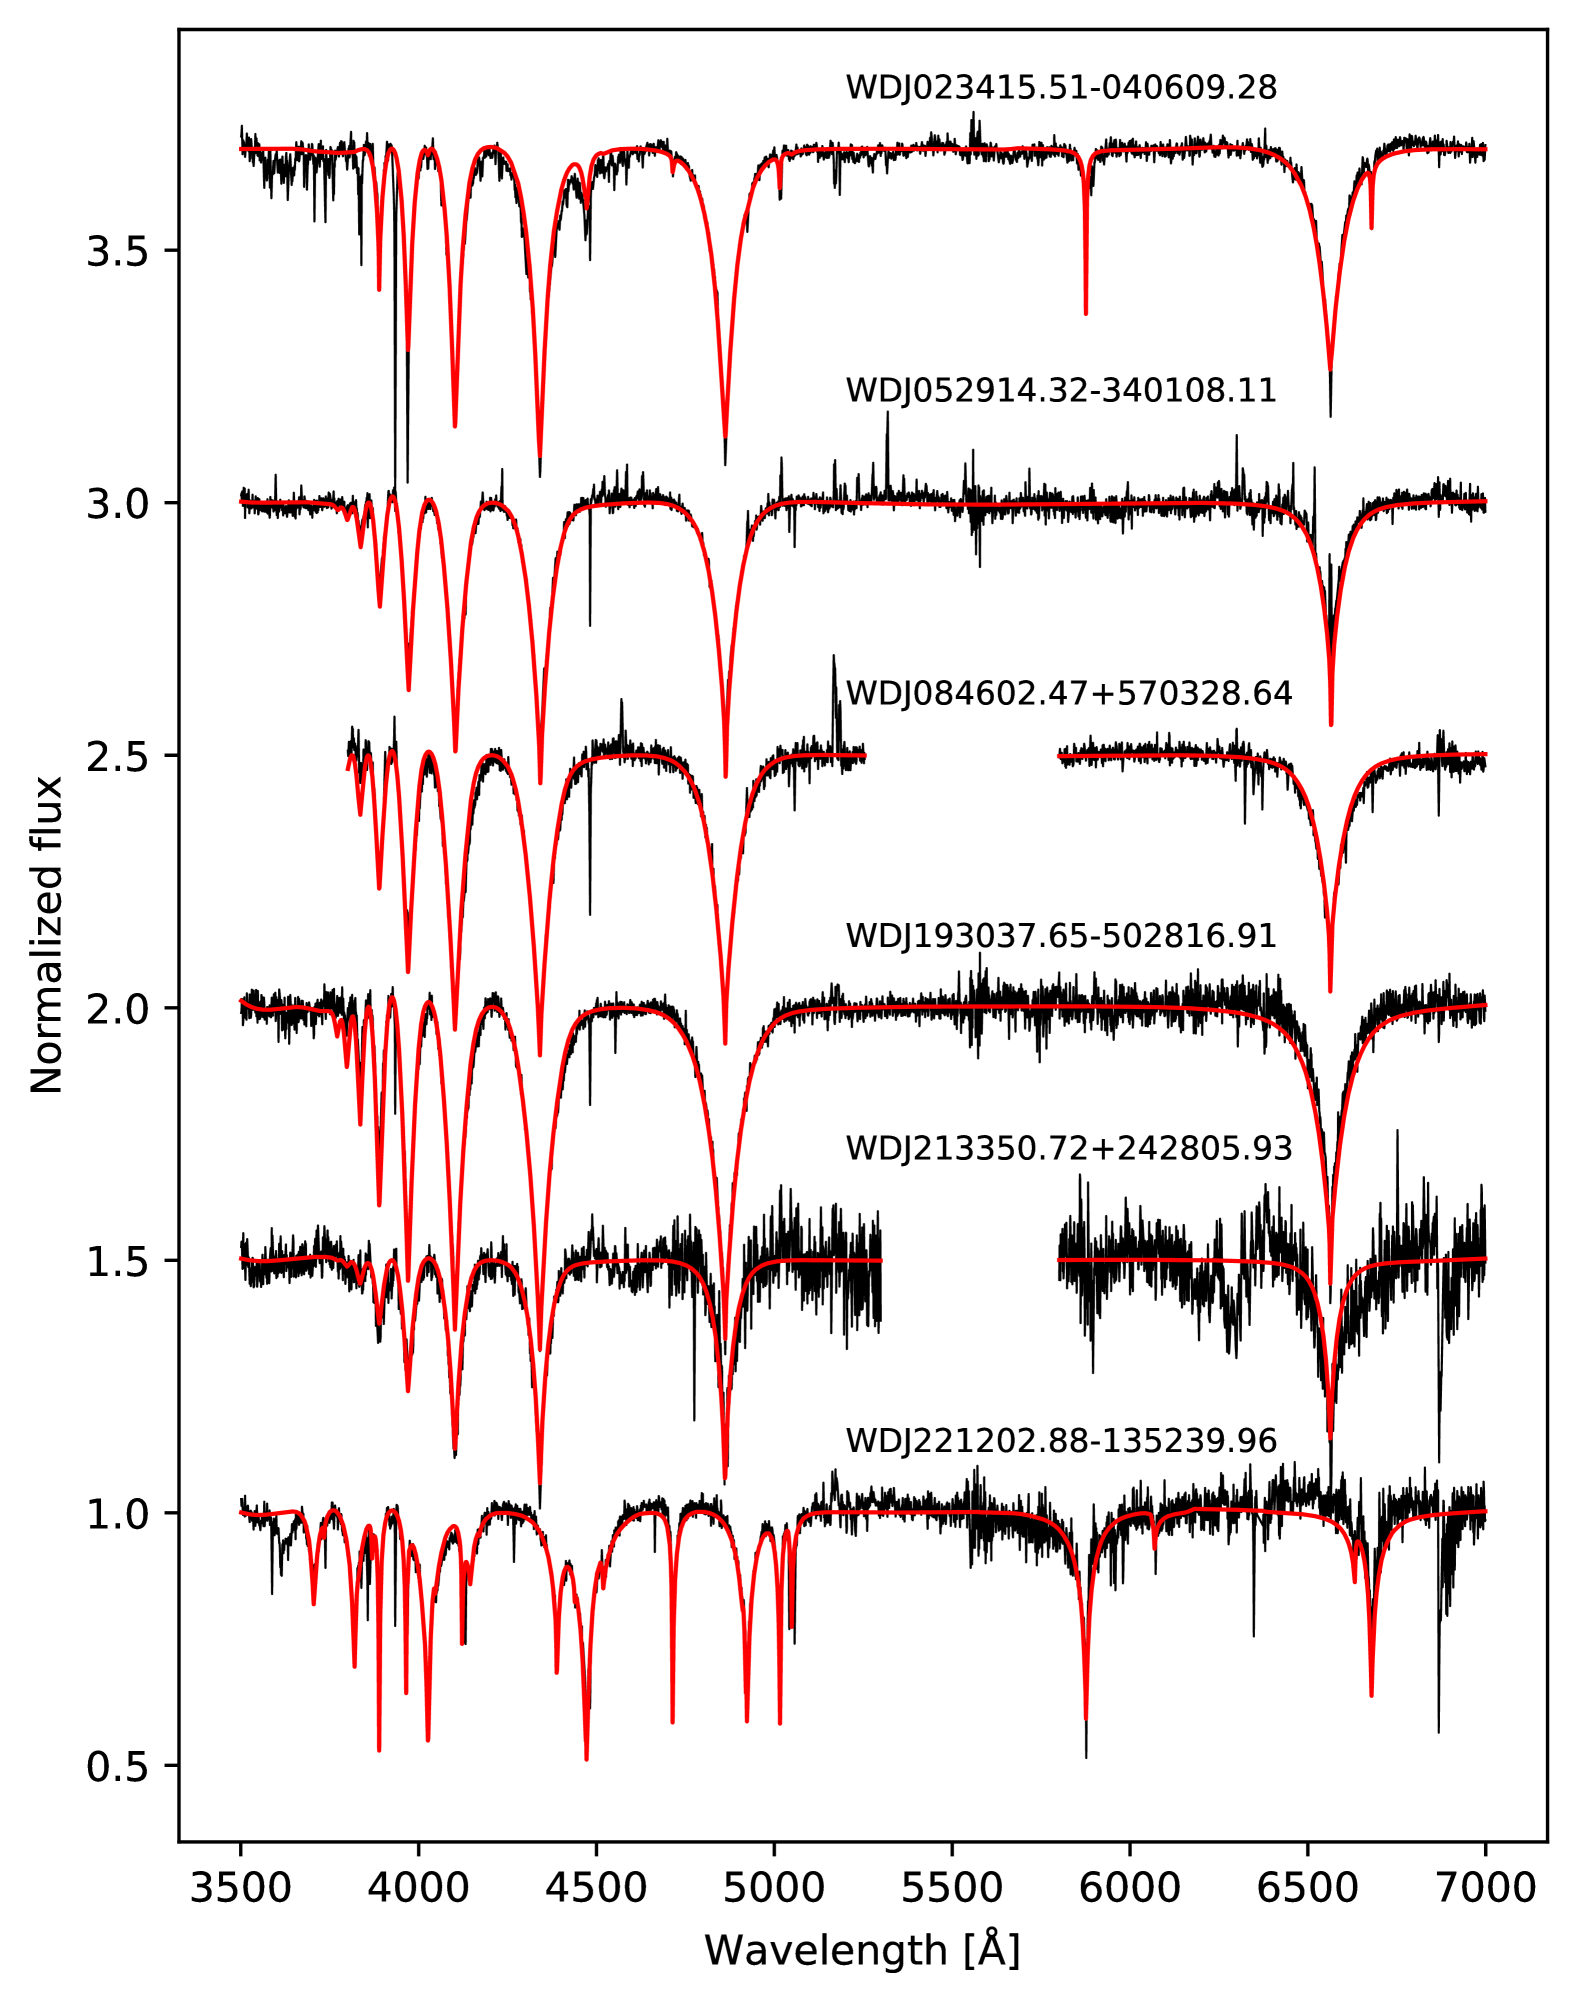
For each star we simultaneously fitted Gaia parallaxes, continuum-normalised spectroscopy (Fig. 2) and optical photometry from various sources (see Table LABEL:mega_table) using models that match the main atmospheric composition of these white dwarfs.
We correct our models for reddening using values from the 3D STructuring by Inversion the Local Interstellar Medium (STILISM) reddening map (Lallement et al., 2018), however the colour correction terms are relatively small ( mag) and have only a marginal impact on the result of the fit. We used the model atmosphere code from Koester (2010) to compute a grid of synthetic white dwarf models. We created two separate grids, one with pure H-atmospheres white dwarfs and another that considers mixed H/He-atmosphere white dwarfs. Both grids cover K and dex in steps of 200 K and 0.2 dex respectively, in addition to the mixed atmosphere grid spans [H/He] dex in steps of 0.2 dex. We set the mixing length parameter to 0.8 for H-dominated atmospheres, and to 1.0 for He-dominated atmospheres (Cukanovaite et al., 2019). In each iteration of our fitting procedure a reference model (obtained by interpolating between grid points) is scaled to the Gaia parallax (allowing for the exact value to vary within the parallax uncertainty) and is compared to both the optical photometry and to the continuum-normalised spectrum of the white dwarf. The photometric and spectroscopic data are assigned equal weight and an overall chi-squared is calculated. Subsequent reference models for the comparison are then created following the chi-squared gradient until a minimum is found. In fitting He-atmosphere white dwarfs, [H/He] is mostly determined by the strength of the hydrogen lines in the spectroscopic data. However, this abundance value is significantly correlated to the g and so the values obtained in our fitting procedure cannot be considered independent of the astrometric and photometric data. The stellar parameters obtained from our fits are summarised in Table LABEL:mega_table. The reported uncertainties (Table LABEL:mega_table) are of statistical nature only, and in the case of high signal-to-noise ratio data are likely underestimated. A detailed analysis of the underlying systematic uncertainties would require a larger sample of stars and data (see e.g. Fuchs et al. 2017), and is beyond the scope of this paper.
One caveat regarding the atmospheric parameters determined here is that we do not include metals in the computation of the atmospheric structures, and line blanketing in the ultraviolet (UV) has the potential to affect the thermal structure of the atmospheres.
The effect of blanketing in atmospheres where hydrogen dominates the opacity has been explored by Gänsicke et al. (2012), and found to be negligible. To out knowledge, a similar systematic study of line blanketing in DBZ has so far not been carried out, though brief exploratory discussions are found in Dufour et al. 2012Coutu et al. 2019). Based on the available studies, we expect the effect of line blanketing in WD J0234-006, WDJ 0529-3401, WD J1930-5028 and WD J2133+2428 to be negligible, and we may over-estimate the effective temperatures of WD J0846+5703, WD J22121352 by up to per cent. A full evaluation of the line blanketing in the two latter stars will have to await far-UV spectroscopy, which is necessary to establish detailed abundances for all elements that affect the opacities of their atmospheres.
5 IR excess modelling
With the IR flux of the white dwarf set by the best-fit models derived in the previous section, we proceeded to characterise the IR excess due to the thermal emission of the circumstellar dust. We decided to adopt two different procedures to fit the IR excess, using both an optically-thick, geometrically- thin disc, and a single blackbody.
The common approach in modelling the SEDs of white dwarfs with dusty debris discs is to adopt the passive, geometrically-thin, optically-thick disc model from Jura (2003), see e.g. von Hippel et al. (2007); Kilic et al. (2012); Rocchetto et al. (2015). Free parameters in this model are the: temperatures at the inner and outer edges of the disc, , and , and the disc inclination, i. Notably, a significant degeneracy exists between and , see Girven et al. (2012), in particular fig. 5 in that paper. A caveat to bear in mind in modelling the SEDs of debris disc systems with this approach is that even if an acceptable fit of the available data is achieved, this does not imply that the model of a thin, optically-thick disc is physically correct. Hints that reality may be more complex were the observations of GD362, which Jura et al. (2007a) modelled by adding a warp to the standard disc model. In the case of G29-38, Reach et al. (2009) argued that the data could be fitted with the combination of a thin, optically-thick disc plus an optically thin cloud. The subsequent detection of wide-spread variability of the emission from the dust further highlighted that the standard model is likely not a fully adequate description of the real distribution of the debris (Xu et al., 2014, 2018; Swan et al., 2019; Swan et al., 2020; Rogers et al., 2020).
The cool dust at the outer edge of a debris disc displays significant emission only at wavelengths longer than those covered by the WISE and bands. Consequently is unconstrained in our fits to the available data. In order to obtain a statistically significant solution, we decided to fix to the typical value of 600 K (Jura et al., 2007b). We find that the SEDs of the newly discovered systems can be modelled adequately with a the sum of the white dwarf plus the standard disc model within a range of physically reasonable parameters (Fig. 1), with one exception: WDJ 0846+5703 provides the first example where an optically-thick, geometrically-thin disc completely fails to reproduce the detected IR excess. This system has the highest fractional IR brightness ( per cent) of any known debris disc white dwarf, exceeding the maximum value expected for a face on disc by 40 per cent (see fig. 4 in Rocchetto et al. 2015).
Given that there is at least one system where the standard model fails, and that it is now clear that combining infrared data obtained at different epochs is subject to systematic uncertainties because of the intrinsic variability, we decided to also fit the observed SEDs with the sum of a white dwarf and a single blackbody, both located at the distance of the source measured by Gaia. The free parameters in this case are the temperature of the blackbody, , and its area, . This prescription has the advantage that it is independent of any underlying physical assumption, enables a quantitative comparison with other studies of debris disc systems, and also provides a simple metric to exclude the possibility that the detected IR excess is caused by a brown dwarf companion. With the possible exception of WD J02340406, all values exceed that of a typical brown dwarf by one order of magnitude (Sorahana et al., 2013). We use the ratio of the integrated blackbody and white dwarf fluxes to compute the fractional IR brightness, , of the debris disc (Table LABEL:mega_table). With the aforementioned exception of WD J0846+5703, we find the and values to be broadly consistent with those of previously known white dwarfs with dusty debris disc systems (Rocchetto et al., 2015; Dennihy et al., 2017; Dennihy et al., 2020a).
6 Notes on individual systems
Here we present an overview of the most distinctive observational properties of the individual debris disc systems in our sample. It is important to consider that the disc , composition and geometry (which are unknown), as well as the white dwarf and mass, all affect the overall appearance of the gas emission features. Furthermore, degeneracy between these parameters is hard to break without additional information. In the following sections we attempt to provide the most comprehensive physical description of our systems, given the data currently available.
6.1 WD J023415.51–040609.28
Despite its spectral appearance visually dominated by broad Balmer absorption lines (Fig. 2), the atmosphere of WD J0234–0406 is actually He-dominated, making this star the first white dwarf of spectral type DABZ found to host a gaseous debris disc. With , WD J0234–0406 stands out as extremely H-rich among He-dominated white dwarfs with similar effective temperatures (see fig. 5 of Rolland et al. 2018). The input physics and methods for the envelope calculations for helium/carbon diffusion equilibrium in Koester et al. (2020) can also be applied to hydrogen/helium equilibrium, and so be used to calculate the mass of H in the convection zone of WD J0234–0406. Following this prescription, without accounting for convective overshoot (Cunningham et al., 2019), the photospheric abundance translates to a total of g of H in the convection zone 666With the inclusion of overshoot in the calculation the H mass estimate can be as high as g. However, since the effect of overshoot is not included in the majority of other publications a direct comparison of this value with other systems studied is not possible at the moment. Such large amounts of H have so far only been detected in a handful of debris-accreting white dwarfs (fig. 5 of Gentile Fusillo et al. 2017).
WD J0234–0406 is also the white dwarf with the strongest metal absorption features in our sample and we were able to identify pollution from Mg, O, Ca, Al, Ti, and Fe. The presence of large amounts of H in a growing number of cool, metal-polluted He-atmosphere white dwarfs has been linked with accretion of water-bearing debris (e.g. GD 362, GD 61, SDSS J1242+5226, GD 16, GD 17, WD J204713.76–125908.9 Jura & Xu 2010; Farihi et al. 2011; Raddi et al. 2015; Koester et al. 2005b; Gentile Fusillo et al. 2017; Hoskin et al. 2020), a theory which can be corroborated if an O-excess is determined from the abundance of the accreted metals (e.g. Klein et al. 2010; Farihi et al. 2013). The amount of H in the convection zone of WD J0234–0406 is too high to be explained solely by a primordial origin (Rolland et al., 2018) leading to the tempting speculation that this white dwarf, too, is accreting water (or may have accreted it in the past since H never diffuses out of a white dwarf photosphere).
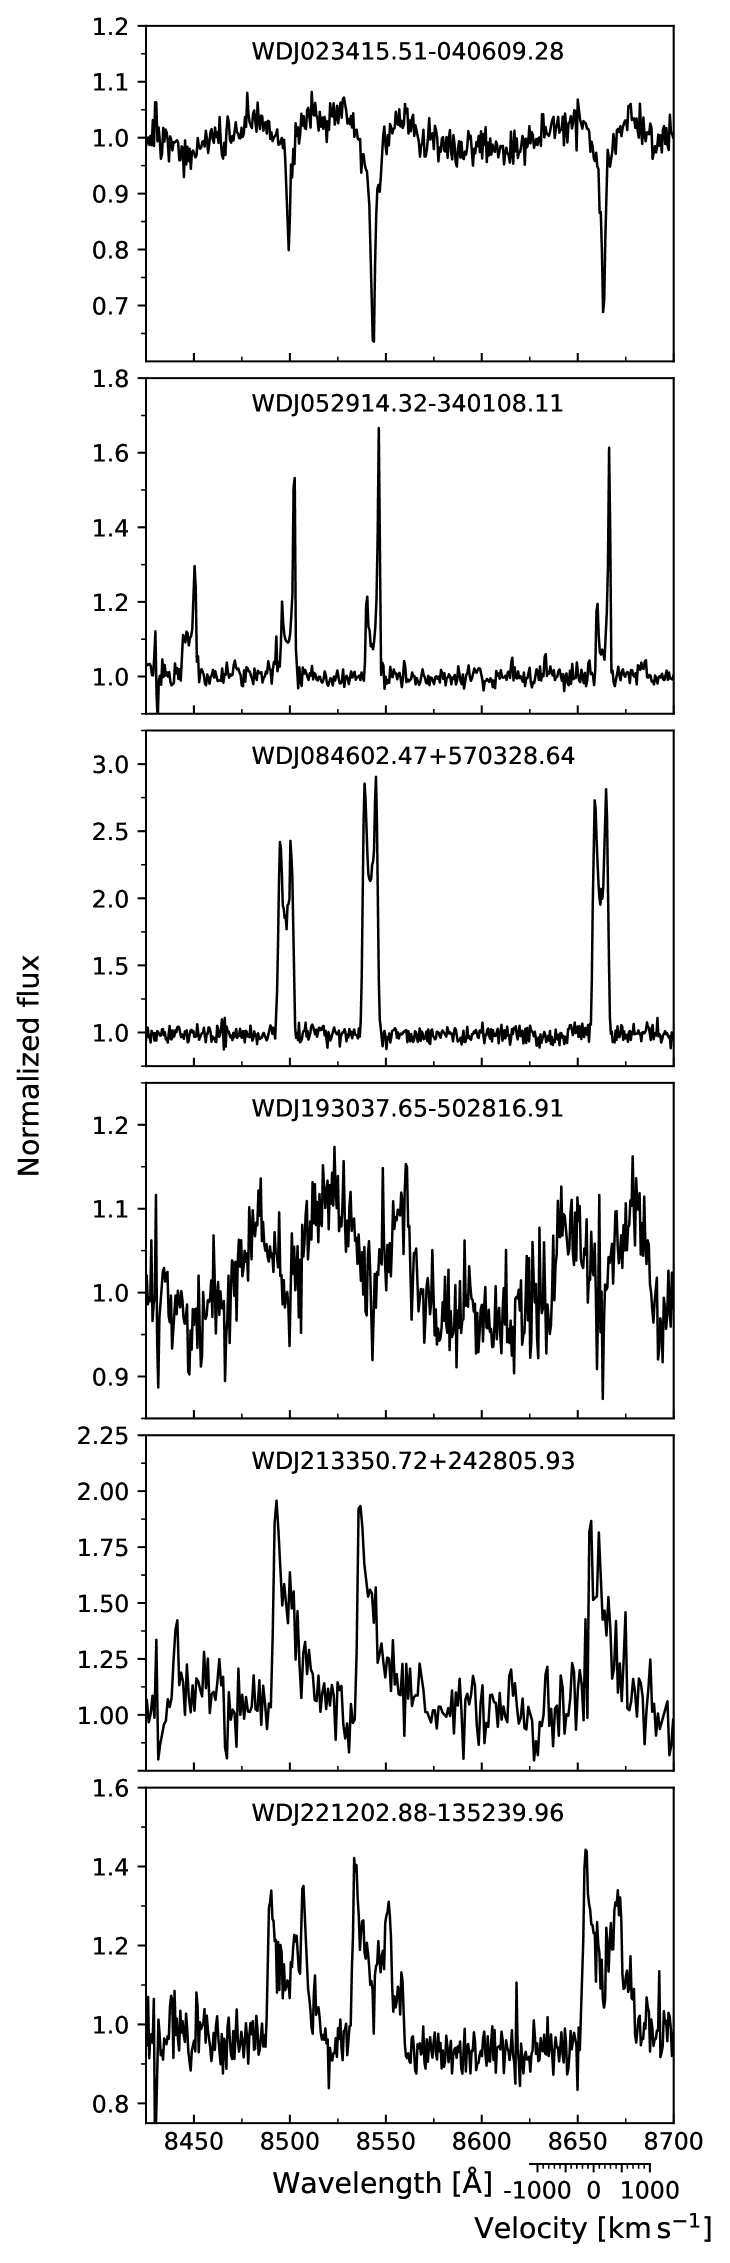
The only emission features from the gas disc around WD J0234–0406 are the Ca ii triplet (Fig. 3) and the indistinguishable blend of Fe ii/Mg i lines at Å. Due to the very large width of the Ca ii emission lines, we quote a combined equivalent width (EW) for the severely blended 8498 Å and 8542 Å lines. Additionally, the deep and broad Ca ii photospheric absorption lines in WD J0234–0406 inevitably affect our EW estimates which should, therefore, be considered as lower limits.
The full widths at zero intensity (FWZIs) of the Ca ii triplet profiles are the largest of any known gaseous debris disc at 2300 100 km s-1. The emission profiles appear relatively symmetric which could suggest a circular disc, which combined with the mass of the white dwarf of = 0.59 , would imply an inner edge of the disc of 0.085 . Even for an edge-on configuration with = 90 , this is significantly closer to the white dwarf than any other gaseous planetary material observed in emission, and may only be possible due to the relatively cooler of the host star. A lower means that the photo-ionised gas responsible for the visible emission could be closer to the white dwarf compared to other systems. Close-in gas would orbit at higher velocity, leading to larger Doppler broadening of the lines for a given value of . While we cannot constrain the inclination from the profile shapes due to the photospheric contamination of the emission profiles, we expect this system to be in a close to edge-on configuration.
6.2 WD J052914.32–340108.11
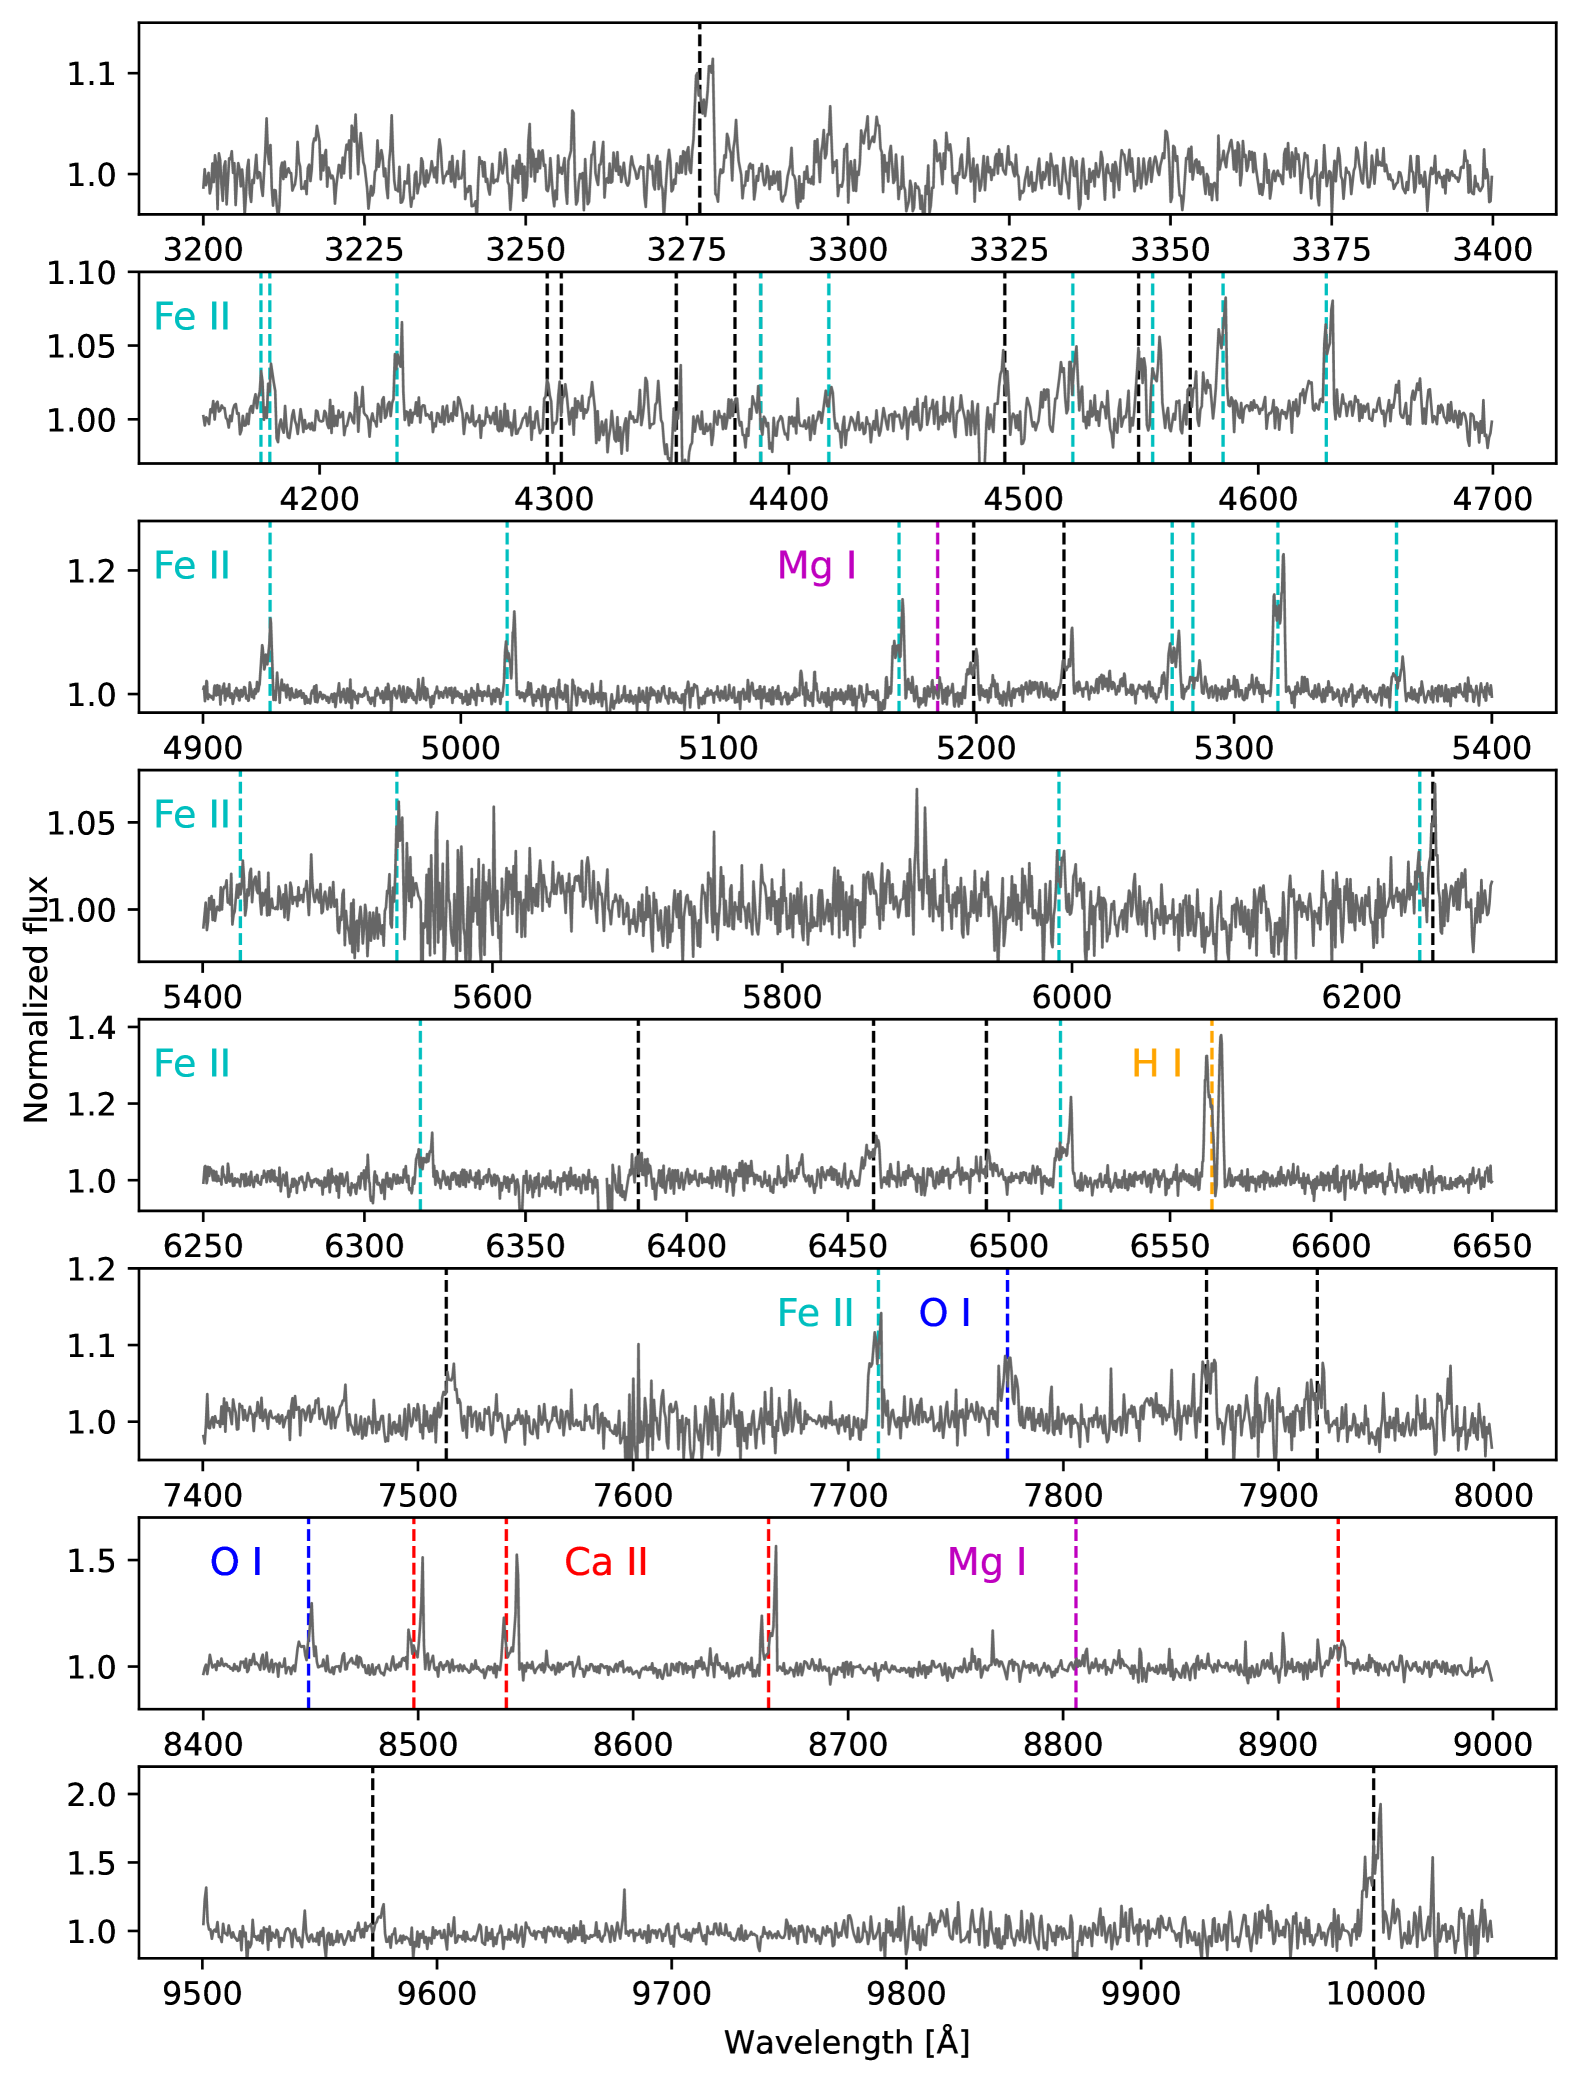
WD J0529–3401 has the second brightest debris disc of our sample in terms of , but what truly makes this system stand out is its array of emission features, not matched in number and diversity by any other known planetary debris host. We identified emission lines of H, Mg, Ca, Fe and O; though there are also a number of yet unidentified features (Fig. 4). The unique spectral appearance of this system is most likely due to a combination of factors. The high of the white dwarf may be partially responsible; indeed the recently discovered WD J210034.65+212256.89 (Dennihy et al., 2020a; Melis et al., 2020) has K and also displays several emission lines from elements other than Ca. However, other similarly hot and even hotter debris disc systems (e.g. WD J2133+2428 and WD J2212–1352) do not share the same variety of emission features (see Table LABEL:full_sample). Other factors like a peculiar debris composition (possibly richer in Fe compared to those about other emission line systems e.g Hollands et al. 2018) and/or the disc geometry and distance from the star should also play a significant role in determining which emission lines are visible.
A particularly noteworthy emission feature in WD J0529–3401 is that of H, which is not observed in any other white dwarf with a gaseous debris disc. The only related system is WD J091405.30+191412.25, a white dwarf hosting a gaseous disc that exhibits emission lines of only H, O, and S in the optical wavelength range (Gänsicke et al., 2019). No rock-forming elements (Mg, Ca, Fe) are detected in emission from that disc, or in absorption in the white dwarf photosphere, leading to the interpretation that this white dwarf is evaporating a giant planet, and accreting the purely volatile atmospheric material. In contrast, WD J0529–3401 displays circumstellar dust in the form of a strong IR excess, as well as rock-forming elements in its photosphere, clearly indicating that this white dwarf is accreting rocky debris. However, the H emission unequivocally proves that H is also present in the debris together with O and other rock forming elements, strongly suggesting the presence of water in the planetesimal currently being accreted. As mentioned above, a number of white dwarfs exhibit an O-excess in the abundances of the accreted debris, and are suspected to have disrupted water-rich planetesimals. The detection of an O-excess in WD J0529–3401 would corroborate that interpretation, but will require a detailed abundance analysis.
Whereas the majority of the over 50 distinct emission lines visible in the X-shooter spectrum of WD J0529–3401 are associated with Fe ii, there remain a number of features which we were unable to identify (Fig. 4, Table 2). In particular the emission line at Å, is the strongest one in the entire spectrum exceeding even the Ca ii lines in EW (Table 2). Active Galactic Nuclei (AGN) (Landt et al., 2008), luminous blue variables (Ritchie et al., 2009), and classical novae (Andrillat & Houziaux, 1994) often display an Fe ii line near that wavelength, which is a Ly-pumped fluorescence line (Sigut & Pradhan, 2003). The emission line detected near 3277 Å may have the same origin. Given that we detect H emission in WD J05293401, it is feasible that also Ly is in emission. There are also numerous additional potential emission features near the noise level that will require higher-quality data for an unambiguous detection.
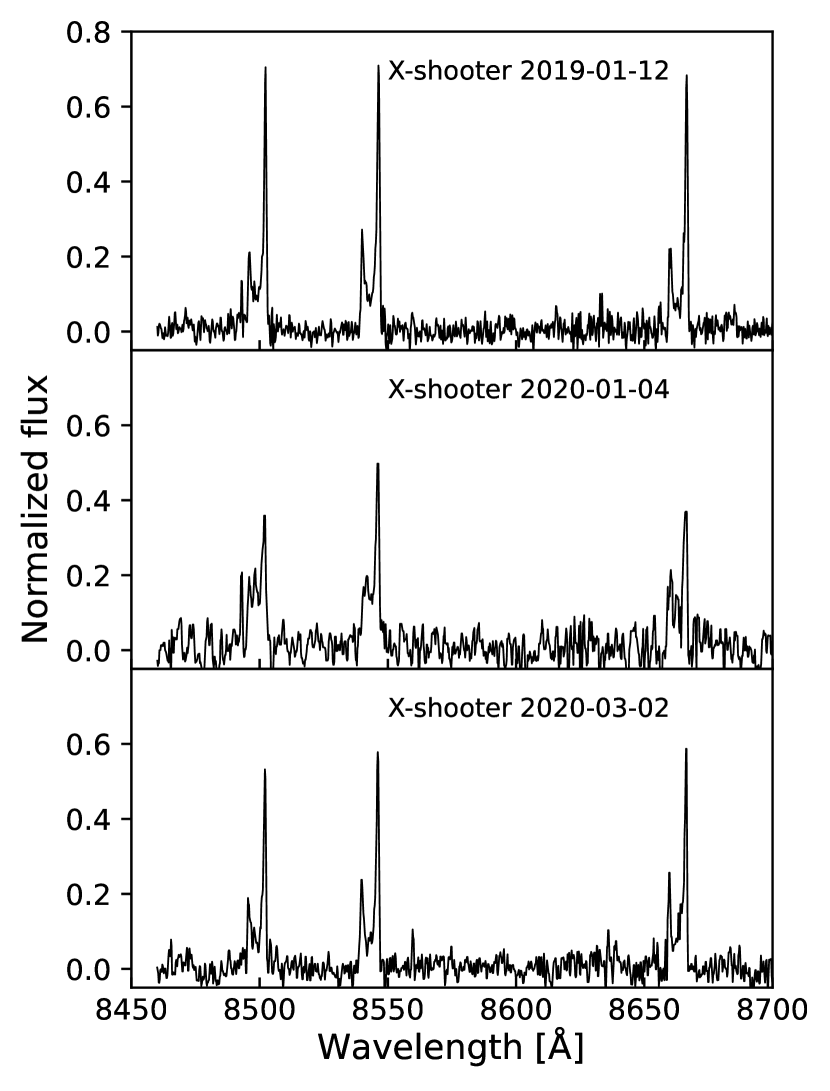
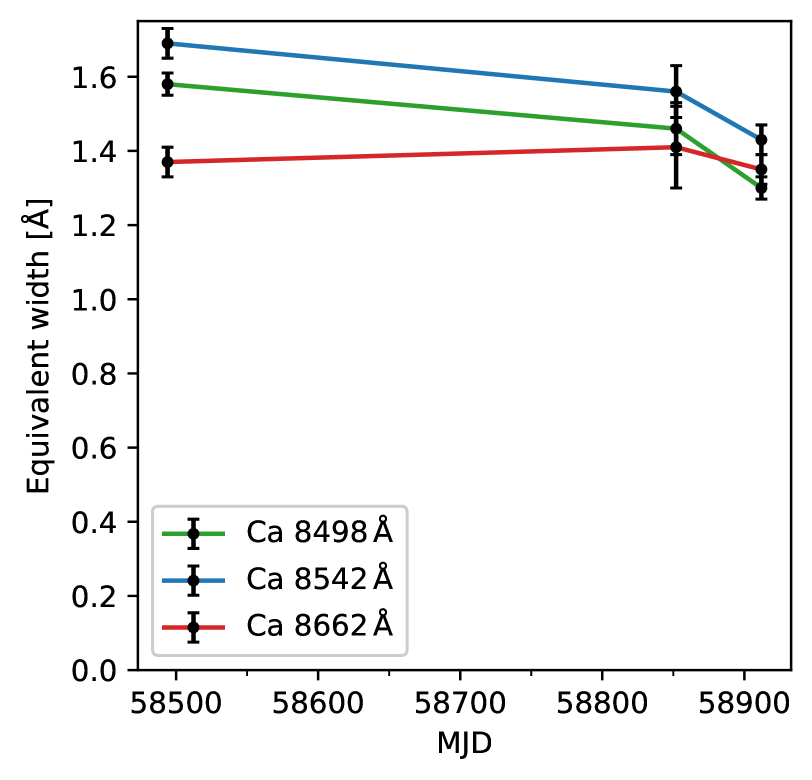
To date we have acquired three epochs of spectroscopic data for WD J0529–3401 (Fig 5). While these spectra only span 1.14 yr, they reveal a potential decrease in the overall strength of the emission lines (Fig. 5), along with a possible change in the morphology of the profiles, with the two more recent spectra showing substantially reduced blue- and red-shifted emission peaks compared to the observation. Further monitoring of this system will be required to confirm morphological variability, which might occur on a similarly short time-scale to that of the gaseous debris disc around HE 1349–2305 (Dennihy et al., 2018).
6.3 WD J084602.47+570328.64
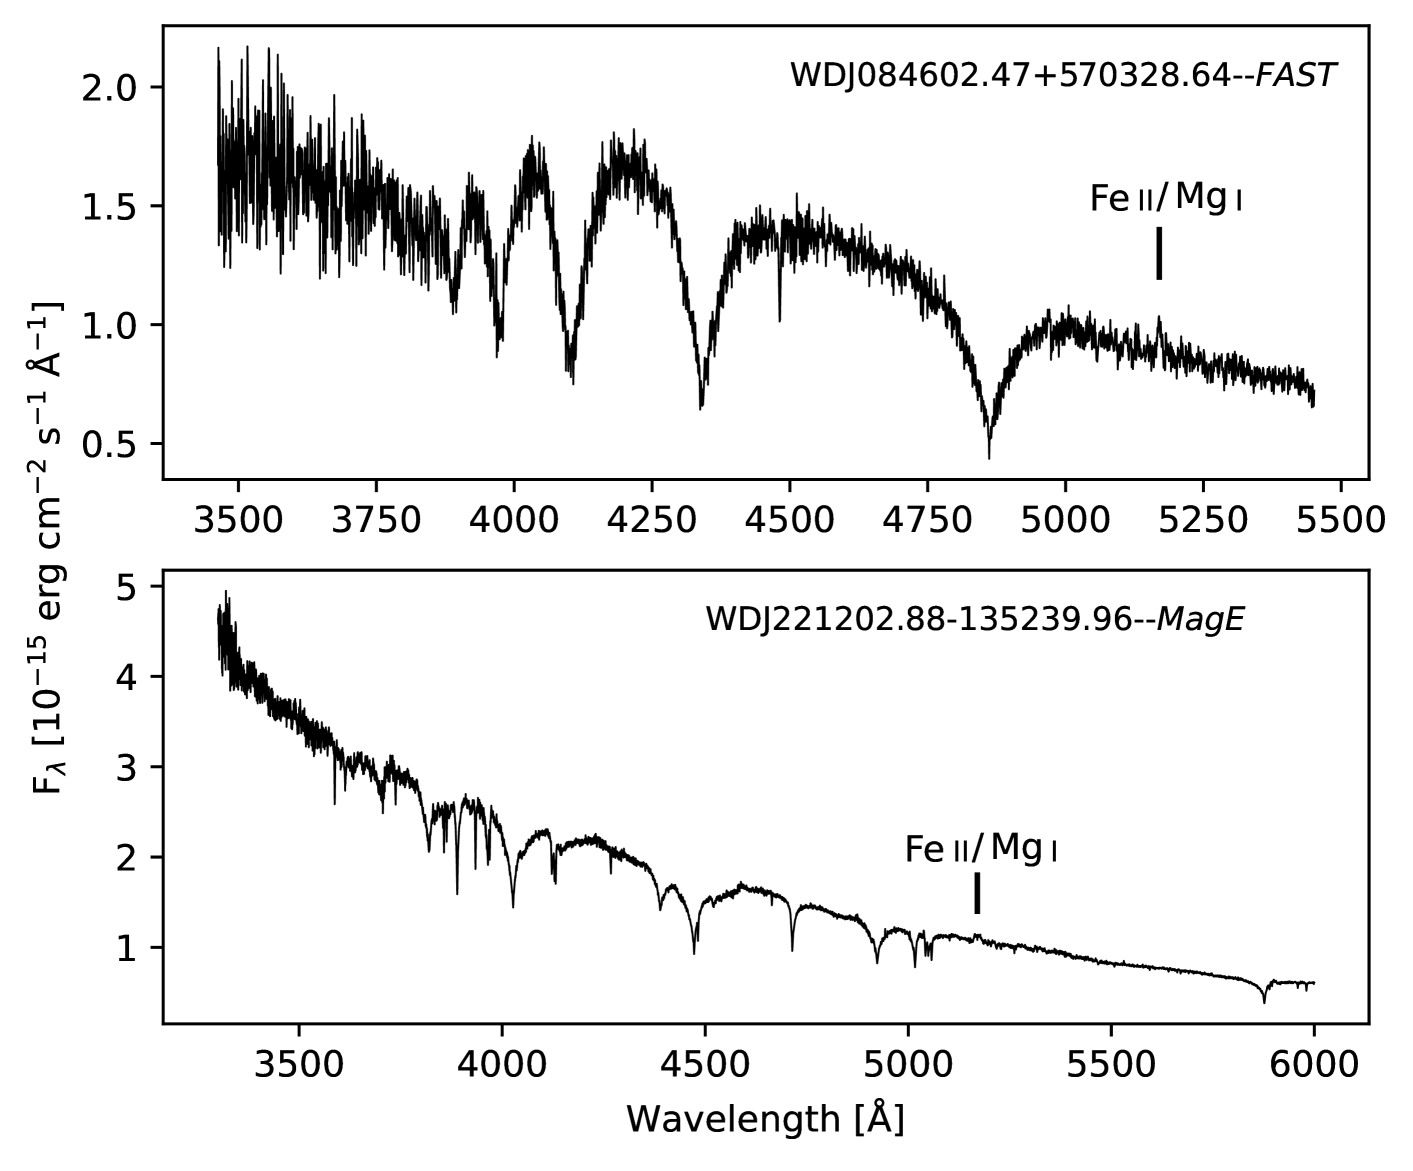
While this system was identified by Melis et al. (2020) as a gaseous debris disc host, we independently determined the presence of a gas disc a this system and present our results and discussion below. The initial FAST spectrum of WD J0846+5703 did not cover the Ca ii triplet, but the presence of a gas disc was revealed by the blended Mg i/Fe ii emission feature at 5175 Å. WD J0846+5703 stands out as the brightest debris disc about a white dwarf (in terms of fractional IR luminosity, per cent), exceeding the brightness of the disc around both GD 362 (Becklin et al., 2005) and the recently discovered WD J061131.70693102.15 (Dennihy et al., 2020a). A fit adopting the standard optically-thick, geometrically-thin disc model (Jura, 2003) fails to reproduce the observed SED. Given both the distance to, and the stellar parameters of, the white dwarf, even the brightest possible disc configuration () underestimates the fractional IR luminosity by 40 per cent. A simplistic single-temperature blackbody model provides a statistically acceptable fit to the IR flux of WD J0846+5703 (Fig. 1), however, the physical interpretation of the derived parameters remains uncertain.
A physically meaningful model of the IR emission of WD J0846+5703, may need to invoke multiple dusty components (as proposed for GD 362 Jura et al. 2007a), or a configuration different from a geometrically-thin, optically-thick disc. In fact, recent Spitzer observations suggest that a variable, optically-thin component is most likely present at most debris discs, with gaseous disc hosts being the most variable (Swan et al., 2020).
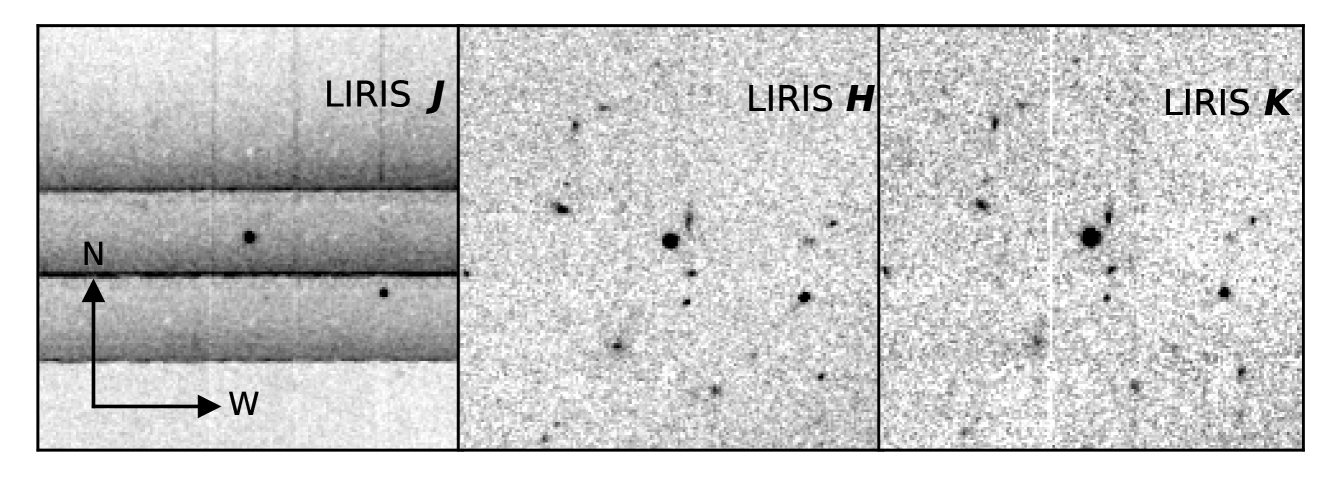
Whereas our estimate for the total IR flux of WD J0846+5703 relies on WISE photometry and contamination from background sources could impact both the overall SED shape and the value of our (Dennihy et al., 2020b), near-IR imaging obtained with the Long-slit Intermediate Resolution Infrared Spectrograph on the WHT (Fig. 14) and mid-IR Spitzer observations (Swan et al., 2020) confirm that the extremely large IR fluxes detected by WISE are associated with WD J0846+5703.
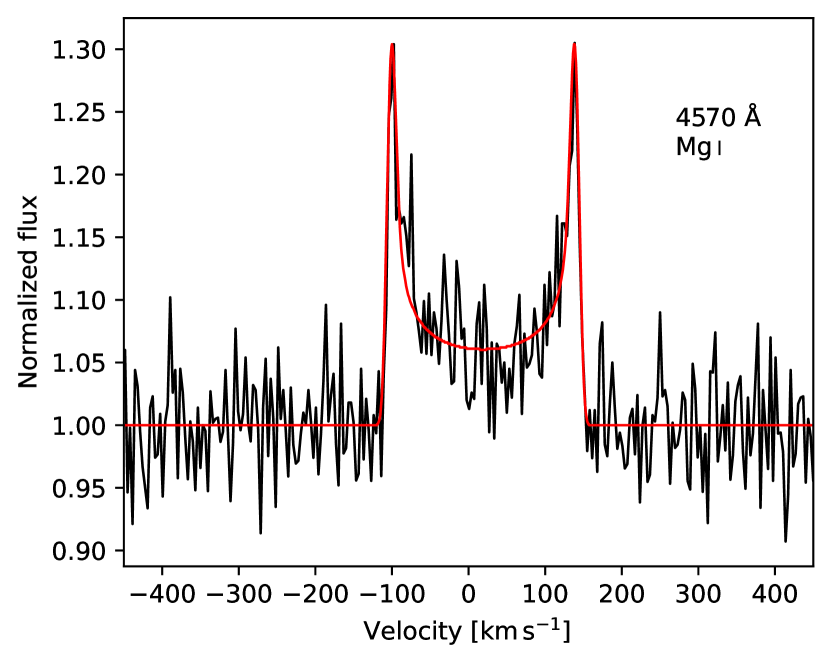
The profile of the Ca ii emission lines of WD J0846+5703 is particularly narrow (Fig. 3), with . The higher resolution of the HIRES spectrum reveals additional emission lines which display extremely narrow blue and red-shifted peaks (Fig. 6), suggesting that the emission arises over a limited range in radii within the disc. We chose to model the Mg i 4571 Å line, which is in a region of the spectrum where the S/N of the HIRES data peaks, and which is not blended with any other emission or absorption line. We used the analytical expressions for the Abel transform of Smak (1981) to compute the intensity of the gaseous disc, where we adopted a power-law index of zero for the radial intensity distribution, and varied the inner and outer radius of the emitting region to match the morphology of the Mg i profile. We found that the observed profile shape is best reproduced by a very narrow ring, where the outer and inner radii are . The value of is degenerate with the inclination, i.e. . The symmetric shape of the observed Mg i line is consistent with a circular distribution of the emitting gas. However, we cannot rule out the possibility that we are viewing an eccentric disc along the semi-major axis, which would also present a symmetric distribution.
Interestingly WD J0846+5703 displays no emission of O i 7774/8446 Å, which is detected in gaseous debris discs at white dwarfs of similar , implying that the absence of this feature may not relate to the of the star. One might speculate about a particular O-poor composition of the planetary debris (Harrison et al., 2018; Doyle et al., 2020). Yet, the detection of both Mg and Ca emission lines implies the presence of O within the gas, as both elements are bound to O when in solid mineral form. One possible explanation for the lack of O i lines may be related to the fact that these arise from high-excitation transitions – if the gas is located sufficiently far from the white dwarf, these transitions may not occur. This hypothesis is supported by the Doppler maps of SDSS J1228+1040, which show that the emission of the (low-excitation) Ca ii 8600 Å triplet originates mainly at distances , whereas the O i 7774 Å arises from closer to the white dwarf, (fig. 7.1 in Manser 2018). Exploring this scenario, we fixed , which then implies an inclination of . Modelling higher S/N observations of the different emission lines both in terms of their strength and morphology has the potential to constrain both the location of the gas, and its physical conditions (Gänsicke et al., 2019).
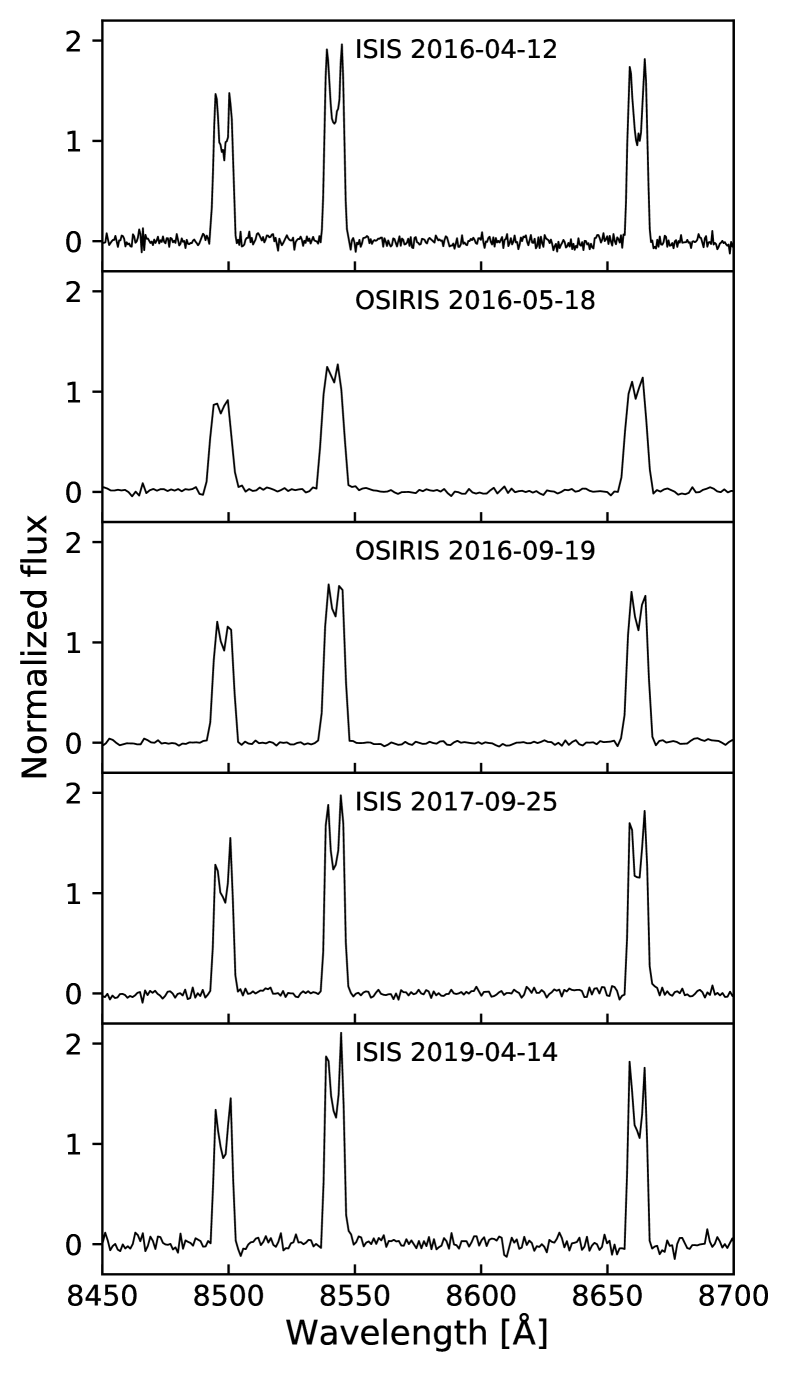
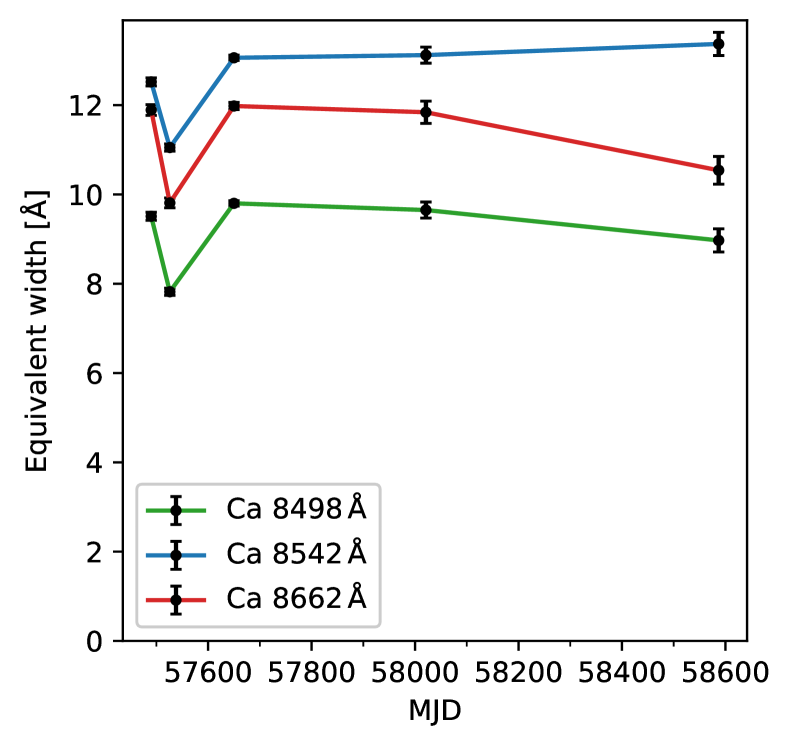
Since its discovery in 2016 we have obtained four additional epochs of spectroscopy for WD J0846+5703 covering the Ca ii triplet (Fig. 7). Over the space of three years the Ca ii emission lines in this system did not undergo any significant change in shape maintaining a mostly symmetric profile, while the overall strength fluctuated by per cent (Fig. 7), consistent with monthly to yearly changes in the EW reported for SDSS J1228+1040 (Manser et al., 2016a, 2019). This limited variability could indicate that the gas in this system follows a near-circular orbit, with a weak observational signature in the lines shape. While the low-resolution spectra of the narrow Ca ii triplet emission of WD J0846+5703 make it hard to constrain any morphological variability, Melis et al. (2020) identify the same Mg i 4571 Å feature we present in Fig. 6 in their 2019 December and 2020 June HIRES spectra. The profile is similarly symmetric, suggesting no significant variability has taken place over a 3 yr time-frame. This is also supportive of a circular ring of material, however we cannot currently rule out a slowly precessing eccentric ring viewed along the semi-major axis. Confirming a circular orbit would allow us to constrain the location of the gas without the need of long timeline repeated observations making WD J0846+5703 a particularly valuable target to study the structure of gaseous debris discs.
6.4 WD J193037.65–502816.91
Similar to WD J0234–0406, the line profiles of the Ca ii emission in WD J1930–5028 are very broad ( km s-1), to the point that the 8498 Å and 8542 Å lines are blended together making EW measurements of the individual profiles impossible. We therefore quote the EW of these two profiles as a single value in Table LABEL:mega_table. The combined EW is roughly a factor two larger than the 8662 Å component, consistent with a visual inspection of the profiles which appear approximately equal height outside of the blended region. Using we estimate the location of the inner edge of disc about WD J1930–5028 to be at . Similar to WDJ 0234–5028, this inner edge would suggest a configuration close to edge-on, again with the low of the system likely being a contributing factor. Furthermore, the zero-velocity center of the emission lines is relatively deep, particularly compared to WD J0529–3401 and WD J0846+5703, suggesting a significant level of self-absorption, which should be higher at lower inclinations (Horne & Marsh, 1986).
6.5 WD J213350.72+242805.93
With a K, WD J2133+2428 is, by a wide margin, the hottest known white dwarf with a debris disc (Xu et al., 2015, 2019), even hotter than WD J091405.30+191412.25, the white dwarf which was recently reported to be accreting gas from an evaporating giant planet ( K Gänsicke et al. 2019). This system pushes the boundaries of the known parameter space spanned by debris discs hosts, effectively enabling us to investigate how the properties of the observed emission lines vary with white dwarf between – K, and to extend dynamical theories about planetary remnants around such young white dwarfs (Veras & Fuller, 2020). As the hottest debris disc host known, WD J2133+2428 is also the youngest, with a cooling age of 10 Myr777http://www.astro.umontreal.ca/bergeron/CoolingModels (Bédard et al., 2020). We do not expect there to be many systems significantly hotter than WD J2133+2428, as above 32 000 K irradiation from the white dwarf would sublimate even micron-sized dust grains at a distance greater than the tidal disruption radius for a rocky body (von Hippel et al., 2007).
All previously known Ca ii emitters display evidence of accretion from rocky planetary debris, but WD J2133+2428 is still sufficiently hot to potentially drive significant evaporation from a surviving gas giants and so possibly accrete non-rocky, volatile material (Schreiber et al., 2019). White dwarfs at this transition point in their evolution may display evidence of accretion of both rocky and gaseous planets offering an unprecedented opportunity to study the evolution of diverse planetary systems.
However the quality of the data currently at our disposal severely limits our ability to analyse this system. Without and/or near-IR photometry the characterization of the thermal flux from the debris disc relies almost exclusively on photometry which could be contaminated by background sources. Furthermore, with an average resolution of Å, the initial ISIS spectroscopy of this star does not reveal any metal absorption lines which, at K, are expected to be very weak in the optical range. Nonetheless, the spectrum reveals emission features of O, Fe and Ca and clearly shows that the Ca ii emission lines are extremely asymmetrical with the red portion of the double-peaked profile being almost absent. This line morphology is closely reminiscent of that of HE 1349–2305 which shows rapid variability in the line profile indicating a precession period of yr (Dennihy et al., 2018). WD J2133+2428 is therefore a particularly promising target for spectral variability monitoring as the emission line profile could likely show marked changes on relatively short timescales.
6.6 WD J221202.88–135239.96
Similarly to WD J0846+5703, WD 2212–1352 was identified as a gaseous debris disc host via detection of the blended Mg i/Fe ii emission at Å in our initial MagE ID spectrum (Figure 13)
WD J2212–1352 is one of the only two He-dominated atmosphere white dwarfs in our sample, the other one being WD J0234–0406 described before. However, aside from the main atmospheric composition, the two systems have very little in common and stand as a testament to the diversity found among gas emission line systems. While WD J0234–0406 is one of the coolest white dwarfs in our sample ( K), WD J2212–1352 is among the hottest emission line white dwarfs known, surpassed only by the recently discovered SDSS J0006+2858 and WD J210034.65+212256.89 (Dennihy et al., 2020b; Melis et al., 2020), in addition to WD J2133+2428 discussed above.
The lower opacity of a He-dominated atmosphere compared to a H one (Camisassa et al., 2017) makes detection of metal pollutants easier, and WD J2212–1352 and WD J0234–0406 appear as the most polluted systems in our sample. However, the nature of this pollution is significantly different in the two objects. No H is detected in the atmosphere of WD J2212–1352, most likely as a result of the short accretion history of this system. With a cooling age Myr, WD J2212–1352 is much younger than WD J0234–0406 ( My) and simply would not have had the time to accrete any significant amount of hydrogen (Mustill et al., 2018; Hoskin et al., 2020).
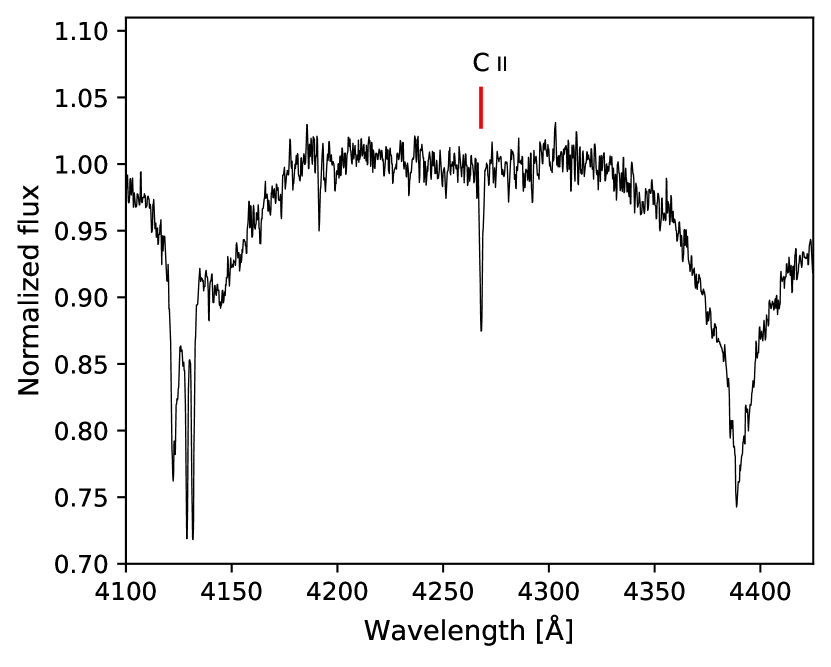
Additionally, WD J2212–1352 displays clear C absorption (Fig. 8), which is not seen in WD J0234–0406 (only very few white dwarfs accrete planetary debris that is sufficiently rich in C to be detected at optical wavelengths, e.g. Jura et al. 2015). Though reconstruction of the bulk chemical composition will require more accurate modelling, we can conclude that the debris about WD J2212–1352 likely originated from a body significantly different in composition from that of WD J0234–0406.
Though the IR excess about both stars is very similar, corresponding to blackbodies of roughly equal with close values (Table LABEL:mega_table), the emission line profiles are significantly different with WD J2212–1352 displaying much stronger emission and narrower double peaked profiles. Moreover, the spectrum of WD J2212–1352 shows additional emission lines of Fe and O, not detected in WD J0234–0406. This marked difference is most likely the result of both the different and debris composition of these two stars, making WD J2212–1352 and WD J0234–0406 perfect examples of the diversity which is starting to emerge among gas disc hosts.
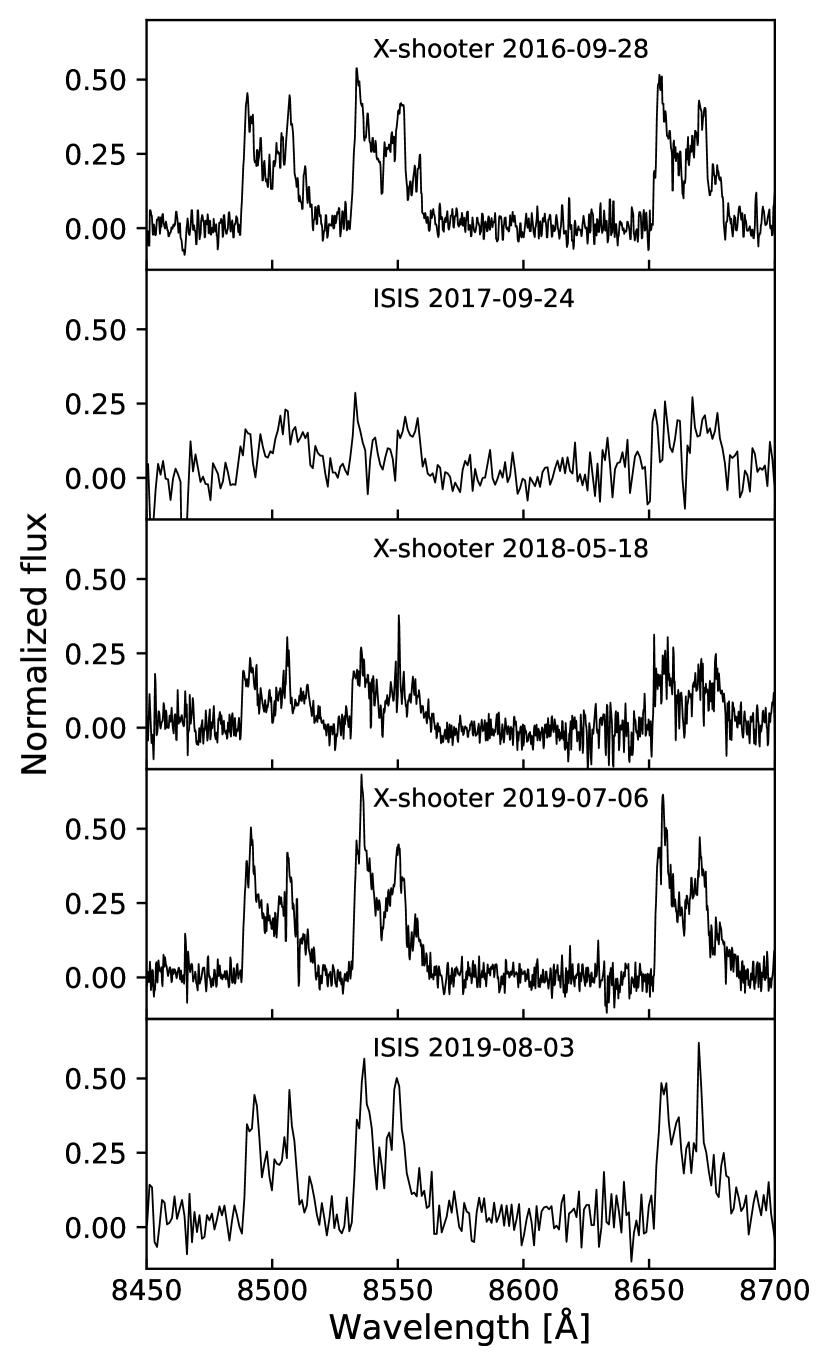
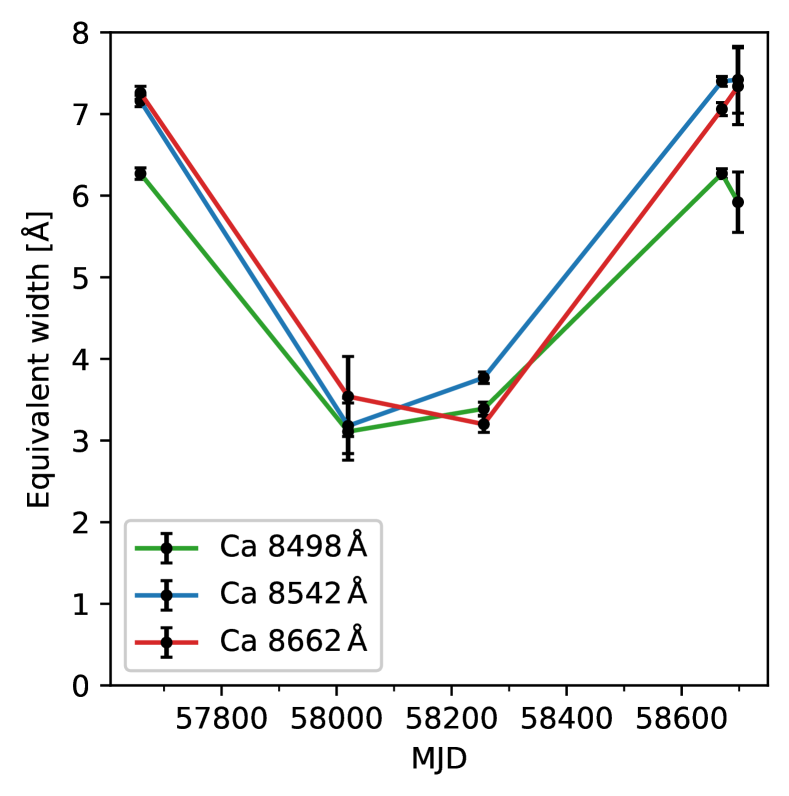
To date we have acquired five different epochs of spectroscopic observations of WD J2212–1352 covering the Ca ii emission triplet. As shown in Fig. 9 the Ca ii lines appear to have undergone significant changes during the course of three years. Between 2016 and 2017 the strength of the Ca ii emission triplet decreased by per cent. Similar behaviour has been documented for the white dwarfs WD J1617+1620 (Wilson et al., 2014), SDSSJ0845+2257 (Wilson et al., 2015), SDSS J1043+0855 (Manser et al., 2016b), WD J034736.69+162409.73 and WD J210034.65+212256.89 (Dennihy et al., 2020a), though with some noteworthy differences.
In the case of WD J1617+1620 the emission lines were initially undetectable, only appearing during a brightening event followed by a decline to the ground state over the course of a decade. The authors interpreted the appearance of the gaseous disc signature as a stochastic episode, potentially caused by a collision within the dust disc (Wilson et al., 2014).
WD J210034.65+212256.89, underwent a similar brightening event followed by a return to a state with undetectable emission lines, but over a course of only sixty days. This lead the authors to speculate that the appearance of the lines may be a recurring event though no observations showing a return to a bright state have been published so far (Dennihy et al., 2020a; Melis et al., 2020). The emission lines of WD J034736.69+162409.73 have also been observed to increase in brightness by 30 per cent over 300 days, but to the latest observation of this system there is no evidence of a subsequent dimming (Dennihy et al., 2020a).
In contrast, the Ca emission triplet in SDSSJ0845+2257 was initially observed in a bright state in 2004 and by 2008 the EW of the lines had dropped by per cent. In subsequent observations taken until 2014 the system remained in this “low” state with no significant change in the EW (Wilson et al., 2015). The gaseous emission from the disc around SDSS J1043+0855 also appears to vary from a bright state, dropping in brightness by 40–50 per cent between 2003 and 2010, but then re-brightening by 30 per cent from 2010 to 2012 (Manser et al., 2016b).
Similarly to SDSS J1043+0855, the Ca ii emission lines in WD J2212–1352 were observed to re-brighten after dropping between 2016 and 2017, returning to their initial strength in 2019. The variability in WD J2212–1352 represents the strongest re-brightening event of a gaseous debris disc observed to date, but at this stage the data is insufficient to speculate on the cause of this transitory change in flux or on whether this could happen again. Nonetheless it is evident that gaseous debris discs are intrinsically dynamical environments and these recurring changes in emission strength could potentially be the signpost of a stochastic disruption events and/or collisions within the debris disc.
In addition to the changes observed in the strength of the emission lines, comparing the 2016 spectrum of WD J2212–1352 with the one obtained in 2019 (Fig. 9), some evidence of morphological changes also emerge. The redshifted portions of the doublepeak profiles appear stronger in 2019 than in 2016 and the lines seem to be transitioning to a more symmetrical morphology. Such evolution could be a hint of precession of a fixed intensity pattern as observed in the archetypal system SDSS J1228+1040 (Manser et al., 2016a), but the data at hand are insufficient to speculate further.
7 Discussion
The nine new gaseous debris discs recently announced by Dennihy et al. (2020a) and Melis et al. (2020, including WD J0846+5703), together with the additional five presented here, tripled the number of these enigmatic evolved planetary systems, to a total of 21. This substantially larger sample of gaseous debris discs allows us to start assessing the properties of these systems as a class rather than on a case-by-case basis. We summarise the key characteristics of the full sample of known gaseous debris disc hosts in Table LABEL:full_sample.
The Ca ii triplet emission profiles presented in Figure 3 show a wide range of morphologies and strengths, with the emission from WD J0529–3401, WD J2133+2428, and WD J2212–1352 showing strong asymmetries. Every Ca ii triplet emitting system that has both multi-epoch observations and asymmetric emission profiles presents morphological variability (Gänsicke et al., 2008; Wilson et al., 2015; Manser et al., 2016a; Manser et al., 2016b; Dennihy et al., 2018, 2020b; Melis et al., 2020). Furthermore, two focused studies on SDSS J1228+1040 and HE1349–2305 have shown that the morphological evolution of the profiles are periodic in nature, and well described by the precession of a fixed intensity profile in the disc (Manser et al., 2016a; Dennihy et al., 2018). The period of this precession can span the range of years to decades from system to system, and this range is supported by theoretical studies that show the effects of general relativistic precession and pressure forces on the gaseous disc (Miranda & Rafikov, 2018).
While multiple potential mechanisms have been proposed to explain the production of these gaseous components to debris discs, the number of well-monitored and analysed systems to test these scenarios is low. WD J0529–3401, WD J2133+2428, and WD J2212–1352 represent ideal systems (amongst just the systems presented here) for us to follow-up given their asymmetric emission profiles, and the hints of morphological variability, revealed by the multi-epoch observations we have obtained so far.
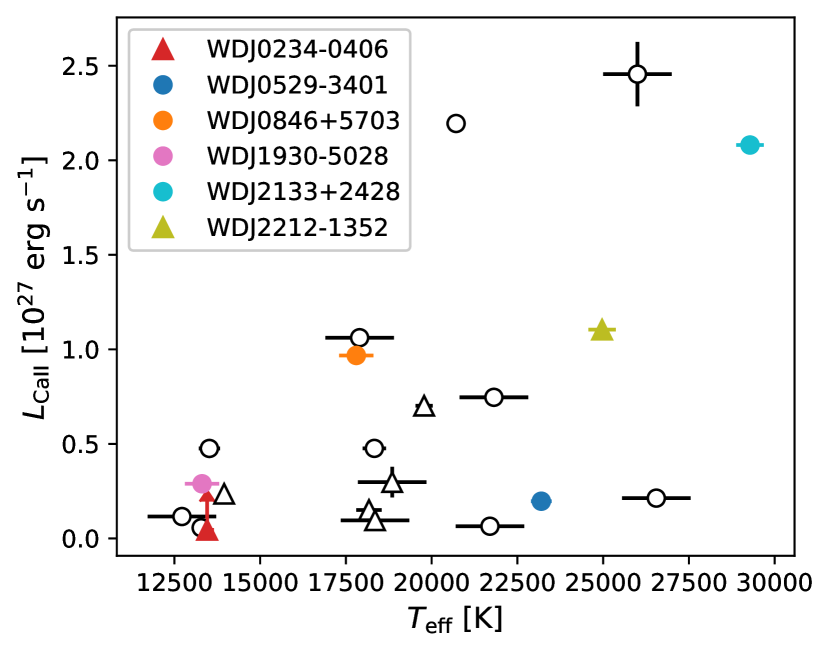
An interesting relationship to explore is that between the gaseous disc brightness and the of the white dwarf, as it may help to distinguish between different mechanisms responsible for the line emission. For example, emission due to photo–ionisation should be strongly dependent on the temperature of the white dwarf, whereas it should not be so if the temperature in the disc is mostly driven by viscous heating (Hartmann et al., 2011, 2016). However, EW measurements of the Ca ii triplet only represent line strength calculated above the continuum-flattened spectrum, so they do not preserve information on the absolute flux. Therefore, when attempting to compare disc brightness across the broad range spanned by this class of white dwarfs one cannot rely directly on EW values. The only information publicly available for all gaseous debris disc hosts published elsewhere is , and the EW of Ca ii triplet, so we opted to define a “Disc Luminosity Proxy” () as an indicator of Ca ii triplet luminosity according to the equation:
| (1) |
where is the white dwarf flux calculated by integrating a white dwarf model of the appropriate and g between 8450 and 8700 Å, and is the the distance to the white dwarf.
As illustrated in Fig. 10, the six stars presented in this work uniformly populate the range spanned by the known gaseous debris disc systems, with the discovery of WD J2133+2428 extending the upper limit of this distribution by K. The expanded temperature range populated as well by WD J0529–3401, WD J2212–1352, SDSS J0006+2858 WD J210034.65+212256.89 ( K from Dennihy et al. 2020a; Melis et al. 2020) allows us to study the effects of on the strengths of the emission lines, as well as their morphology and the species that are detected. WD J0529–3401 and WD J210034.65+212256.89 also stand out by having, by far, the largest number of detected emission lines. These two systems will be critical for developing quantitative models of the photo-ionised gas disc, using the diagnostic power provided by the multiple transitions of a range of elements. So far, such an approach has only been attempted for the purely gaseous disc detected around the white dwarf WD J091405.30+191412.25 (Gänsicke et al., 2019).
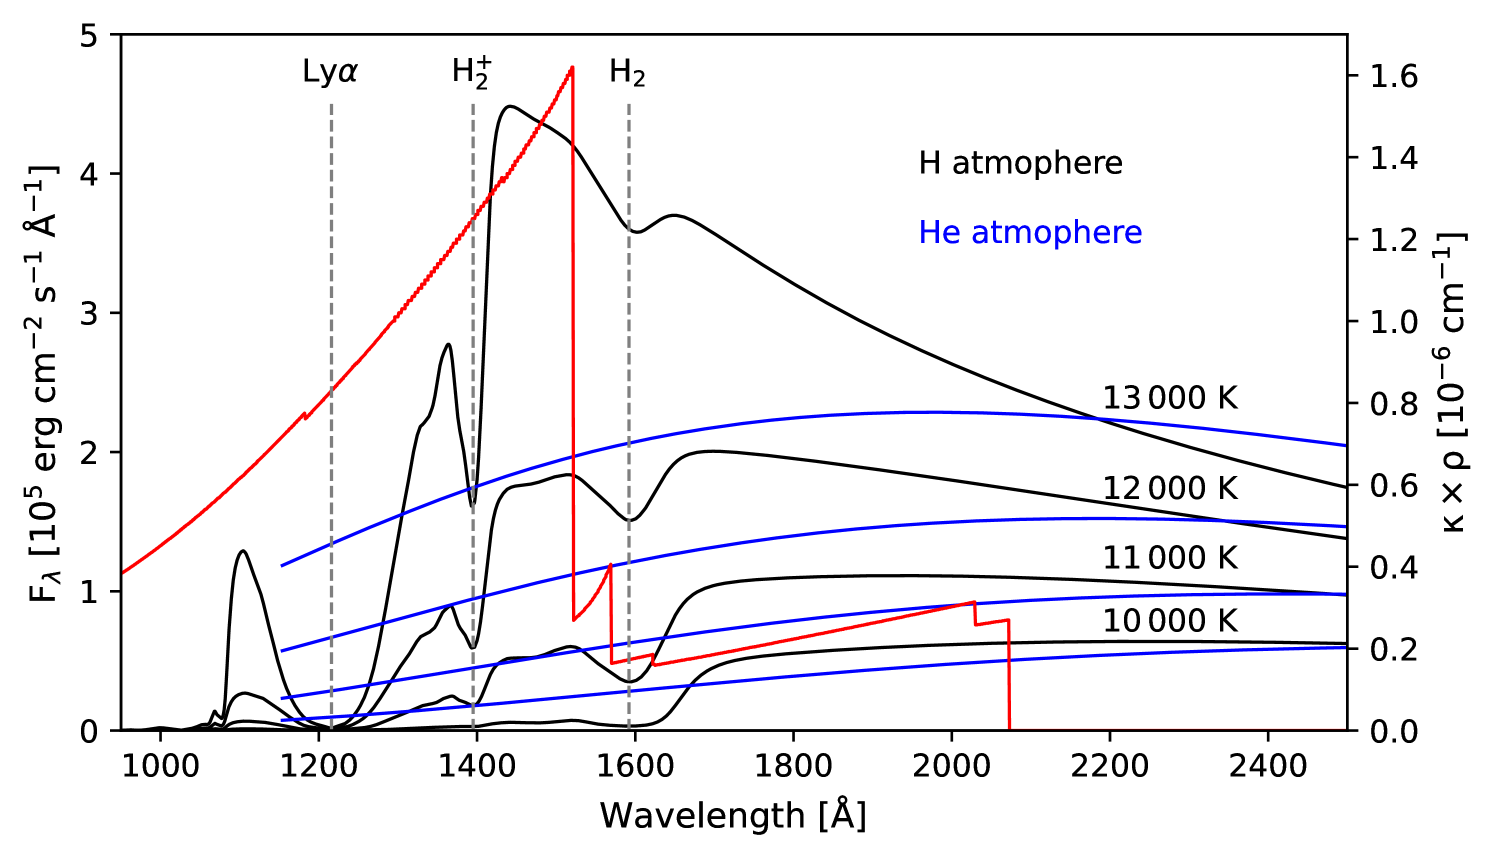
The distribution of known gaseous debris discs as a function of (Fig. 10) also displays an apparent cut-off at K, though several white dwarfs with dusty debris discs are cooler than that (Rocchetto et al., 2015). The gas in the debris discs is heated by the radiation from the white dwarf, and subsequently cools predominantly via emission lines at optical wavelengths (Melis et al., 2010). Modelling the conditions in both gaseous discs composed of rocky-dominated (Kinnear, 2011) and volatile-dominated (Gänsicke et al., 2019) planetary material suggests typical densities in the line-forming regions of . The opacity of this gas is dominated by bound-free cross-sections of metals in the UV (Fig. 11). As the white dwarf cools, its UV flux drops. In H-atmosphere white dwarfs, this is exacerbated by the strong absorption of Ly, and the quasi-molecular and features at 1400 Å and 1600 Å, respectively (Wegner, 1982; Koester et al., 1985). He-atmosphere white dwarfs have, compared to their H-analogues, lower UV fluxes because of the absence of line blanketing of the Lyman lines (Fig. 11). However even trace amounts of H (likely present in a large fraction of He atmosphere white dwarfs Koester & Kepler 2015) would cause significant UV flux absorption, and re-distribution at other wavelengths. For temperatures K, the white dwarf flux below Å quickly drops, resulting in a rapid drop in the heating of the circumstellar gas, and hence a reduction in the emission line fluxes – which is consistent with the cut-off of gaseous debris discs around 12 500 K.
All white dwarfs with gaseous debris discs also contain trace-metals in their photospheres, as they accrete from the circumstellar material. These metals will imprint narrow absorption lines into the UV spectra of these white dwarfs (see e.g. fig. 1 of Gänsicke et al. 2012 and fig. 1 of Wilson et al. 2015), which may result in some amount of line blanketing. Whereas this will somewhat (by at most a few per cent) modify the temperature at which the UV flux of a given white dwarf becomes inefficient at photoionising the circumstellar gas, it does not change the conclusion drawn here. In addition to the observed cut-off at low , there appears to be a trend of increasing gas disc brightness with increasing . This corroborates the idea that the emission line flux correlates with the white dwarf UV luminosity and, as the number of photo-ionising photons increases with higher , so does the strength of emission lines. However, there are also a number of outlying systems (WD J0529–3401 among them) which display significantly lower emission line flux compared to other white dwarfs of similar . This suggests that the of the white dwarf in not the only factor which determines the strength of the emission line and other properties of the disc must also play role. Given the discs are optically thick in the emission lines (Gänsicke et al., 2006; Melis et al., 2010), the gas surface density will have little impact on the total strength of the emission profiles. We therefore hypothesise that both the location of the inner and outer edges of the gaseous material, and the surface area covered by the gas, are important factors determining the strength of the Ca ii triplet. Alternatively, given the variability in emission line strength displayed by many of these white dwarfs, we cannot exclude that these “low emission” systems may have, so far, only been observed during a “low phase”.
The Ca ii triplet is often the strongest set of emission lines in the spectra of these stars and it has been used as the defining feature of this class of objects. However, all six systems presented in this article also display Fe ii and/or Mg i emission at 5175 Å (Table 2). Furthermore, WD J0846+5703 and WD J2212–1352 were both discovered to host a gaseous debris disc from the detection of these emission lines, and only dedicated follow-up observations revealed the Ca ii triplet. Among the other fifteen published systems, nine have an emission feature detected in this region (Gänsicke et al., 2006; Wilson et al., 2015; Manser et al., 2016b; Dennihy et al., 2020a; Melis et al., 2020). With over two-thirds of gaseous debris discs showing evidence of an Fe ii or Mg i 5175 Å emission feature, we consider this region to be a useful secondary identifier for the presence of a gaseous debris disc whenever the Ca ii triplet region is not covered spectroscopically.
8 conclusion
We have reported observations of of six white dwarfs which display emission lines from a circumstellar gaseous debris disc, of which five are new discoveries: WD J0234–0406, WD J0529–3401, WD J0846+5703, WD J1930–5028, WD J2133+2428, and WD J2212–1352. All objects were identified as candidate debris disc hosts from a marked IR excess in their SEDs, and follow-up spectroscopy revealed Doppler-broadened emission lines, a signature of the presence of a gaseous disc of planetary debris. These six systems display very different levels of metal pollution both in terms of number of polluting elements and their nature. Their IR excesses, , are comparable to those observed among other white dwarfs with dusty discs, with the exception of WD J0846+5703. The IR excess in this latter system is too large to be modelled by the standard optically-thick, geometrically-thin passive disc model, and confirms previous suggestions that the distribution of the circumstellar dust may be more complex than assumed so far.
Finally, we find that the emission lines of these six gaseous discs vastly differ in shape (strength, width and symmetry of the profile), in total number, range of elements (with WD J0529–3401 displaying over 50 emission lines from Fe, O, H, Mg and Ca), and in variability behaviour (with WD J0846+5703 showing limited change over a time scale of 3 yr, whereas WD J2212–1352 displays 50 per cent variations in EW over the same time interval).
Together with the recent discoveries of Dennihy et al. (2020a) and Melis et al. (2020), the sample of gaseous debris discs now includes 21 systems. The broad range of parameter space spanned by these stars points towards a vast underlying diversity in these systems. Most notably the white dwarf range from K to over 29 000 K (WD J2133+2428 the hottest white dwarf with a debris disc known to date).
Systems that display emission lines from multiple elements, like WD J0529–3401, also represent ideal targets for modelling the gaseous emission profiles akin to the study performed by Gänsicke et al. (2019) for WD J091405.30+191412.25. This will allow one to place better constraints the location the the gas, and also measure metal abundances in the disc itself and compare them to those measured from the white dwarf photosphere (Gänsicke et al., 2019).
These rich, dynamically active environments still hold a number of secrets, many of which are potentially only unlockable through mid-IR spectroscopy, a type of observation which has been unattainable for years. Debris discs around white dwarf are known to exhibit strong solid-state emission features in their mid-IR spectra (Reach et al., 2009; Jura et al., 2009), which can be directly compared with the elements detected in the photosphere (Xu et al., 2014). The advent of JWST will enable us to characterize these features and identify the specific chemical compounds which made-up the parent bodies, thus enabling detailed physical modelling of the chemical history of the accreted material.
Acknowledgements
We thank the anonymous referee for their constructive review. We thank P. G. Jonker and K. M. Lopez for providing the LIRIS observations. We thank Richard Booth for insightful discussion that improved this manuscript. O.T was supported by a Leverhulme Trust Research Project Grant. MRS thanks for support from Fondecyt (grant 1181404) and ANID, – Millennium Science Initiative Program – NCN19_171. PR-G acknowledges support from the State Research Agency (AEI) of the Spanish Ministry of Science, Innovation and Universities (MCIU) and the European Regional Development Fund (FEDER) under grant AYA2017–83383–P. Based on observations made with the Gran Telescopio Canarias (GTC), installed in the Spanish Observatorio del Roque de los Muchachos of the Instituto de Astrofísica de Canarias (IAC), in the island of La Palma. Based on observations made with the William Herschel Telescope operated on the island of La Palma by the Isaac Newton Group of Telescopes in the Spanish Observatorio del Roque de los Muchachos of the Instituto de Astrofísica de Canarias. Data for this paper have been obtained under the InternationalTime Programme of the CCI (International Scientific Committee of the Observatorios de Canarias of the IAC). This work is based on observations collected at the European Southern Observatory under ESO programmes 0102.C-0351 and 103.D-0763. Data for this paper have been obtained under the International Time Programme of the CCI (International Scientific Committee of the Observatorios de Canarias of the IAC). Magellan telescope time was granted by NSF’s NOIRLab, through the Telescope System Instrumentation Program (TSIP). TSIP was funded by NSF. Some of the data presented herein were obtained at the W.M. Keck Observatory from telescope time allocated to the National Aeronautics and Space Administration through the agency’s scientific partnership with the California Institute of Technology and the University of California. This work was supported by a NASA Keck PI Data Award, administered by the NASA Exoplanet Science Institute. The Observatory was made possible by the generous financial support of the W.M. Keck Foundation. The authors wish to recognize and acknowledge the very significant cultural role and reverence that the summit of Mauna Kea has always had within the indigenous Hawaiian community. We are most fortunate to have the opportunity to conduct observations from this mountain. BTG, CJM & TRM were supported by the STFC grant ST/T000406/1. BTG acknowledges support by a Leverhulme Research Fellowship. DV gratefully acknowledges the support of the STFC via an Ernest Rutherford Fellowship (grant ST/P003850/1). ED acknowledges support by the international Gemini Observatory, a program of NSF’s NOIRLab, which is managed by the Association of Universities for Research in Astronomy (AURA) under a cooperative agreement with the National Science Foundation, on behalf of the Gemini partnership of Argentina, Brazil, Canada, Chile, the Republic of Korea, and the United States of America.
9 Data availability
All data underlying this article is publicly available from the relevant observatory archive (see program ID in Table 1) or will be shared on reasonable request to the corresponding author.
References
- Andrillat & Houziaux (1994) Andrillat Y., Houziaux L., 1994, MNRAS, 271, 875
- Barber et al. (2012) Barber S. D., Patterson A. J., Kilic M., Leggett S. K., Dufour P., Bloom J. S., Starr D. L., 2012, ApJ, 760, 26
- Barstow et al. (2014) Barstow M. A., Barstow J. K., Casewell S. L., Holberg J. B., Hubeny I., 2014, MNRAS, 440, 1607
- Becklin et al. (2005) Becklin E. E., Farihi J., Jura M., Song I., Weinberger A. J., Zuckerman B., 2005, ApJ Lett., 632, L119
- Bédard et al. (2020) Bédard A., Bergeron P., Brassard P., Fontaine G., 2020, arXiv e-prints, p. arXiv:2008.07469
- Camisassa et al. (2017) Camisassa M. E., Althaus L. G., Rohrmann R. D., García-Berro E., Torres S., Córsico A. H., Wachlin F. C., 2017, ApJ, 839, 11
- Cauley et al. (2018) Cauley P. W., Farihi J., Redfield S., Bachman S., Parsons S. G., Gänsicke B. T., 2018, ApJ, 852, L22
- Coutu et al. (2019) Coutu S., Dufour P., Bergeron P., Blouin S., Loranger E., Allard N. F., Dunlap B. H., 2019, ApJ, 885, 74
- Cukanovaite et al. (2019) Cukanovaite E., Tremblay P. E., Freytag B., Ludwig H. G., Fontaine G., Brassard P., Toloza O., Koester D., 2019, MNRAS, 490, 1010
- Cunningham et al. (2019) Cunningham T., Tremblay P.-E., Freytag B., Ludwig H.-G., Koester D., 2019, MNRAS, 488, 2503
- Dennihy et al. (2017) Dennihy E., Clemens J. C., Debes J. H., Dunlap B. H., Kilkenny D., O’Brien P. C., Fuchs J. T., 2017, ApJ, 849, 77
- Dennihy et al. (2018) Dennihy E., Clemens J. C., Dunlap B. H., Fanale S. M., Fuchs J. T., Hermes J. J., 2018, ApJ, 854, 40
- Dennihy et al. (2020a) Dennihy E., et al., 2020a, arXiv e-prints, p. arXiv:2010.03693
- Dennihy et al. (2020b) Dennihy E., Farihi J., Fusillo N. P. G., Debes J. H., 2020b, ApJ, 891, 97
- Doyle et al. (2020) Doyle A. E., Klein B., Schlichting H. E., Young E. D., 2020, ApJ, 901, 10
- Dufour et al. (2012) Dufour P., Kilic M., Fontaine G., Bergeron P., Melis C., Bochanski J., 2012, ApJ, 749, 6
- Dye et al. (2018) Dye S., et al., 2018, MNRAS, 473, 5113
- Fabricant et al. (1998) Fabricant D., Cheimets P., Caldwell N., Geary J., 1998, PASP, 110, 79
- Farihi et al. (2011) Farihi J., Brinkworth C. S., Gänsicke B. T., Marsh T. R., Girven J., Hoard D. W., Klein B., Koester D., 2011, ApJ Lett., 728, L8
- Farihi et al. (2012) Farihi J., Gänsicke B. T., Steele P. R., Girven J., Burleigh M. R., Breedt E., Koester D., 2012, MNRAS, 421, 1635
- Farihi et al. (2013) Farihi J., Gänsicke B. T., Koester D., 2013, Science, 342, 218
- Fuchs et al. (2017) Fuchs J. T., Dunlap B. H., Clemens J. C., Meza J. A., Dennihy E., Koester D., 2017, in Tremblay P. E., Gaensicke B., Marsh T., eds, Astronomical Society of the Pacific Conference Series Vol. 509, 20th European White Dwarf Workshop. p. 263 (arXiv:1610.00738)
- Gänsicke et al. (2006) Gänsicke B. T., Marsh T. R., Southworth J., Rebassa-Mansergas A., 2006, Science, 314, 1908
- Gänsicke et al. (2007) Gänsicke B. T., Marsh T. R., Southworth J., 2007, MNRAS, 380, L35
- Gänsicke et al. (2008) Gänsicke B. T., Koester D., Marsh T. R., Rebassa-Mansergas A., Southworth J., 2008, MNRAS, 391, L103
- Gänsicke et al. (2012) Gänsicke B. T., Koester D., Farihi J., Girven J., Parsons S. G., Breedt E., 2012, MNRAS, 424, 333
- Gänsicke et al. (2019) Gänsicke B. T., Schreiber M. R., Toloza O., Fusillo N. P. G., Koester D., Manser C. J., 2019, Nature, 576, 61
- Gentile Fusillo et al. (2017) Gentile Fusillo N. P., et al., 2017, MNRAS, 469, 621
- Gentile Fusillo et al. (2019) Gentile Fusillo N. P., et al., 2019, MNRAS, 482, 4570
- Girven et al. (2012) Girven J., Brinkworth C. S., Farihi J., Gänsicke B. T., Hoard D. W., Marsh T. R., Koester D., 2012, ApJ, 749, 154
- Grishin & Veras (2019) Grishin E., Veras D., 2019, MNRAS, 489, 168
- Harrison et al. (2018) Harrison J. H. D., Bonsor A., Madhusudhan N., 2018, MNRAS, 479, 3814
- Hartmann et al. (2011) Hartmann S., Nagel T., Rauch T., Werner K., 2011, A&A, 530, A7
- Hartmann et al. (2016) Hartmann S., Nagel T., Rauch T., Werner K., 2016, A&A, 593, A67
- Hollands et al. (2017) Hollands M. A., Koester D., Alekseev V., Herbert E. L., Gänsicke B. T., 2017, MNRAS, 467, 4970
- Hollands et al. (2018) Hollands M. A., Gänsicke B. T., Koester D., 2018, MNRAS, 477, 93
- Horne (1986) Horne K., 1986, PASP, 98, 609
- Horne & Marsh (1986) Horne K., Marsh T. R., 1986, MNRAS, 218, 761
- Hoskin et al. (2020) Hoskin M. J., et al., 2020, MNRAS, 499, 171
- Jura (2003) Jura M., 2003, ApJ Lett., 584, L91
- Jura & Xu (2010) Jura M., Xu S., 2010, AJ, 140, 1129
- Jura et al. (2007a) Jura M., Farihi J., Zuckerman B., Becklin E. E., 2007a, AJ, 133, 1927
- Jura et al. (2007b) Jura M., Farihi J., Zuckerman B., 2007b, ApJ, 663, 1285
- Jura et al. (2009) Jura M., Farihi J., Zuckerman B., 2009, AJ, 137, 3191
- Jura et al. (2015) Jura M., Dufour P., Xu S., Zuckerman B., Klein B., Young E. D., Melis C., 2015, ApJ, 799, 109
- Kausch et al. (2015) Kausch W., et al., 2015, A&A, 576, A78
- Kelson (2003) Kelson D. D., 2003, PASP, 115, 688
- Kelson et al. (2000) Kelson D. D., Illingworth G. D., van Dokkum P. G., Franx M., 2000, ApJ, 531, 159
- Kenyon & Bromley (2017a) Kenyon S. J., Bromley B. C., 2017a, ApJ, 844, 116
- Kenyon & Bromley (2017b) Kenyon S. J., Bromley B. C., 2017b, ApJ, 850, 50
- Kilic et al. (2012) Kilic M., Patterson A. J., Barber S., Leggett S. K., Dufour P., 2012, MNRAS, 419, L59
- Kinnear (2011) Kinnear T., 2011, Master’s thesis, University of Warwick
- Klein et al. (2010) Klein B., Jura M., Koester D., Zuckerman B., Melis C., 2010, ApJ, 709, 950
- Koester (2010) Koester D., 2010, Memorie della Societa Astronomica Italiana,, 81, 921
- Koester & Kepler (2015) Koester D., Kepler S. O., 2015, A&A, 583, A86
- Koester et al. (1985) Koester D., Weidemann V., Zeidler-K.T. E. M., Vauclair G., 1985, A&A, 142, L5
- Koester et al. (2005a) Koester D., Rollenhagen K., Napiwotzki R., Voss B., Christlieb N., Homeier D., Reimers D., 2005a, A&A, 432, 1025
- Koester et al. (2005b) Koester D., Napiwotzki R., Voss B., Homeier D., Reimers D., 2005b, A&A, 439, 317
- Koester et al. (2014) Koester D., Gänsicke B. T., Farihi J., 2014, A&A, 566, A34
- Koester et al. (2020) Koester D., Kepler S. O., Irwin A. W., 2020, A&A, 635, A103
- Lallement et al. (2018) Lallement R., et al., 2018, A&A, 616, A132
- Landt et al. (2008) Landt H., Bentz M. C., Ward M. J., Elvis M., Peterson B. M., Korista K. T., Karovska M., 2008, ApJS, 174, 282
- Lawrence et al. (2007) Lawrence A., et al., 2007, MNRAS, 379, 1599
- Malamud & Perets (2020a) Malamud U., Perets H. B., 2020a, MNRAS, 492, 5561
- Malamud & Perets (2020b) Malamud U., Perets H. B., 2020b, MNRAS, 493, 698
- Manser (2018) Manser C. J., 2018, PhD thesis, University of Warwick
- Manser et al. (2016a) Manser C. J., et al., 2016a, MNRAS, 455, 4467
- Manser et al. (2016b) Manser C. J., Gänsicke B. T., Koester D., Marsh T. R., Southworth J., 2016b, MNRAS, 462, 1461
- Manser et al. (2019) Manser C. J., et al., 2019, Science, 364, 66
- Manser et al. (2020) Manser C. J., Gänsicke B. T., Gentile Fusillo N. P., Ashley R., Breedt E., Hollands M., Izquierdo P., Pelisoli I., 2020, MNRAS, 493, 2127
- Marsh (1989) Marsh T. R., 1989, PASP, 101, 1032
- Martin et al. (2020) Martin R. G., Livio M., Smallwood J. L., Chen C., 2020, MNRAS, 494, L17
- McMahon et al. (2013) McMahon R. G., Banerji M., Gonzalez E., Koposov S. E., Bejar V. J., Lodieu N., Rebolo R., VHS Collaboration 2013, The Messenger, 154, 35
- Melis & Dufour (2017) Melis C., Dufour P., 2017, ApJ, 834, 1
- Melis et al. (2010) Melis C., Jura M., Albert L., Klein B., Zuckerman B., 2010, ApJ, 722, 1078
- Melis et al. (2012) Melis C., et al., 2012, ApJ Lett., 751, L4
- Melis et al. (2020) Melis C., Klein B., Doyle A. E., Weinberger A. J., Zuckerman B., Dufour P., 2020, arXiv e-prints, p. arXiv:2010.03695
- Metzger et al. (2012) Metzger B. D., Rafikov R. R., Bochkarev K. V., 2012, MNRAS, 423, 505
- Miranda & Rafikov (2018) Miranda R., Rafikov R. R., 2018, ApJ, 857, 135
- Mustill & Villaver (2012) Mustill A. J., Villaver E., 2012, ApJ, 761, 121
- Mustill et al. (2018) Mustill A. J., Villaver E., Veras D., Gänsicke B. T., Bonsor A., 2018, MNRAS, 476, 3939
- O’Connor & Lai (2020) O’Connor C. E., Lai D., 2020, MNRAS, 498, 4005
- Raddi et al. (2015) Raddi R., Gänsicke B. T., Koester D., Farihi J., Hermes J. J., Scaringi S., Breedt E., Girven J., 2015, MNRAS, 450, 2083
- Rafikov (2011) Rafikov R. R., 2011, MNRAS, 416, L55
- Rao et al. (2018) Rao S., Meynet G., Eggenberger P., Haemmerlé L., Privitera G., Georgy C., Ekström S., Mordasini C., 2018, A&A, 618, A18
- Reach et al. (2009) Reach W. T., Lisse C., von Hippel T., Mullally F., 2009, ApJ, 693, 697
- Rebassa-Mansergas et al. (2019) Rebassa-Mansergas A., Solano E., Xu S., Rodrigo C., Jiménez-Esteban F. M., Torres S., 2019, MNRAS, 489, 3990
- Redfield et al. (2017) Redfield S., Farihi J., Cauley P. W., Parsons S. G., Gänsicke B. T., Duvvuri G. M., 2017, ApJ, 839, 42
- Ritchie et al. (2009) Ritchie B. W., Clark J. S., Negueruela I., Najarro F., 2009, A&A, 507, 1597
- Rocchetto et al. (2015) Rocchetto M., Farihi J., Gänsicke B. T., Bergfors C., 2015, MNRAS, 449, 574
- Rogers et al. (2020) Rogers L. K., Xu S., Bonsor A., Hodgkin S., Su K. Y. L., von Hippel T., Jura M., 2020, MNRAS, 494, 2861
- Rolland et al. (2018) Rolland B., Bergeron P., Fontaine G., 2018, ApJ, 857, 56
- Sánchez et al. (2012) Sánchez B., et al., 2012, in Ground-based and Airborne Instrumentation for Astronomy IV. p. 84464T, doi:10.1117/12.926676
- Schreiber et al. (2019) Schreiber M. R., Gänsicke B. T., Toloza O., Hernandez M.-S., Lagos F., 2019, ApJ, 887, L4
- Sigut & Pradhan (2003) Sigut T. A. A., Pradhan A. K., 2003, ApJS, 145, 15
- Skrutskie et al. (2006) Skrutskie M. F., et al., 2006, AJ, 131, 1163
- Smak (1981) Smak J., 1981, Acta Astronomica, 31, 395
- Smette et al. (2015) Smette A., et al., 2015, A&A, 576, A77
- Sorahana et al. (2013) Sorahana S., Yamamura I., Murakami H., 2013, ApJ, 767, 77
- Stepanian et al. (1999) Stepanian J. A., Chavushyan V. H., Carrasco L., Tovmassian H. M., Erastova L. K., 1999, PASP, 111, 1099
- Swan et al. (2019) Swan A., Farihi J., Wilson T. G., 2019, MNRAS, 484, L109
- Swan et al. (2020) Swan A., Farihi J., Wilson T. G., Parsons S. G., 2020, arXiv e-prints, p. arXiv:2006.05999
- Vanderburg et al. (2020) Vanderburg A., et al., 2020, arXiv e-prints, p. arXiv:2009.07282
- Veras & Fuller (2020) Veras D., Fuller J., 2020, MNRAS, 492, 6059
- Veras et al. (2014) Veras D., Shannon A., Gänsicke B. T., 2014, MNRAS, 445, 4175
- Veras et al. (2015) Veras D., Eggl S., Gänsicke B. T., 2015, MNRAS, 451, 2814
- Vernet et al. (2011) Vernet J., et al., 2011, A&A, 536, A105
- Villaver & Livio (2007) Villaver E., Livio M., 2007, ApJ, 661, 1192
- Vogt et al. (1994) Vogt S. S., et al., 1994, in Crawford D. L., Craine E. R., eds, Society of Photo-Optical Instrumentation Engineers (SPIE) Conference Series Vol. 2198, Instrumentation in Astronomy VIII. p. 362, doi:10.1117/12.176725
- Voss et al. (2007) Voss B., Koester D., Napiwotzki R., Christlieb N., Reimers D., 2007, A&A, 470, 1079
- Wegner (1982) Wegner G., 1982, ApJ Lett., 261, L87
- Wilson et al. (2014) Wilson D. J., Gänsicke B. T., Koester D., Raddi R., Breedt E., Southworth J., Parsons S. G., 2014, MNRAS, 445, 1878
- Wilson et al. (2015) Wilson D. J., Gänsicke B. T., Koester D., Toloza O., Pala A. F., Breedt E., Parsons S. G., 2015, MNRAS, 451, 3237
- Wilson et al. (2019) Wilson T. G., Farihi J., Gänsicke B. T., Swan A., 2019, MNRAS, 487, 133
- Wright et al. (2010) Wright E. L., et al., 2010, AJ, 140, 1868
- Xu & Jura (2014) Xu S., Jura M., 2014, ApJ Lett., 792, L39
- Xu et al. (2014) Xu S., Jura M., Koester D., Klein B., Zuckerman B., 2014, ApJ, 783, 79
- Xu et al. (2015) Xu S., Jura M., Pantoja B., Klein B., Zuckerman B., Su K. Y. L., Meng H. Y. A., 2015, ApJ, 806, L5
- Xu et al. (2018) Xu S., et al., 2018, ApJ, 866, 108
- Xu et al. (2019) Xu S., Dufour P., Klein B., Melis C., Monson N. N., Zuckerman B., Young E. D., Jura M. A., 2019, AJ, 158, 242
- Xu et al. (2020) Xu S., Lai S., Dennihy E., 2020, arXiv e-prints, p. arXiv:2009.00193
- Zuckerman et al. (2007) Zuckerman B., Koester D., Melis C., Hansen B. M., Jura M., 2007, ApJ, 671, 872
- Zuckerman et al. (2010) Zuckerman B., Melis C., Klein B., Koester D., Jura M., 2010, ApJ, 722, 725
- von Hippel et al. (2007) von Hippel T., Kuchner M. J., Kilic M., Mullally F., Reach W. T., 2007, ApJ, 662, 544
Appendix A Additional observations
Appendix B Emission lines list
| Element | wavelength [Å] | EW [Å] | |||||
|---|---|---|---|---|---|---|---|
| WD J0234 | WD J0529 | WD J0846 | WD J1930 | WD J2133 | WD J2212 | ||
| Fe ii: | 3277 | 0.210.02 | |||||
| Fe II | 4175 | 0.100.02 | |||||
| Fe ii | 4178 | 0.170.02 | 0.980.23 | ||||
| Fe ii | 4234 | 0.170.02 | 0.640.16 | ||||
| : | 4297 | 0.070.02 | |||||
| : | 4303 | 0.080.02 | |||||
| Mg i | 4352 | 0.190.02 | |||||
| : | 4377 | 0.070.02 | |||||
| Fe ii | 4388 | 0.090.02 | |||||
| Fe ii : | 4417 | 0.070.02 | |||||
| : | 4492 | 0.140.02 | 1.070.16 | ||||
| Fe ii | 4520 | 0.280.02 | |||||
| Fe ii | 4549 | 0.130.02 | |||||
| : | 4556 | 0.140.02 | 0.790.18 | ||||
| Mg i | 4571 | 0.050.02 | 0.370.03 | ||||
| Fe ii | 4584 | 0.250.02 | |||||
| Fe ii | 4630 | 0.240.02 | |||||
| Fe ii | 4924 | 0.310.02 | |||||
| Fe ii | 5021 | 0.350.02 | |||||
| Fe ii/Mg I blend1 | 51752 | 0.280.043 | 0.490.02 | 1.810.04 | 0.700.07 | 2.050.32 | 1.050.04 |
| Mg i4: | 5184 | 0.070.02 | 0.590.03 | ||||
| Fe ii: | 5198 | 0.220.02 | |||||
| : | 5234 | 0.190.02 | |||||
| Fe ii | 5276 | 0.300.02 | 0.440.03 | ||||
| Fe ii | 5285 | 0.080.02 | |||||
| Fe ii | 5316 | 0.770.02 | 0.460.03 | ||||
| Fe ii | 5363 | 0.160.02 | |||||
| Fe ii | 5426 | 0.110.02 | |||||
| Fe ii | 5534 | 0.210.09 | |||||
| Fe ii : | 5991 | 0.160.03 | |||||
| Fe ii | 6240 | 0.100.03 | |||||
| : | 6249 | 0.270.03 | |||||
| Fe ii : | 6318 | 0.370.03 | |||||
| : | 6385 | 0.190.04 | |||||
| : | 6457 | 0.400.03 | |||||
| : | 6493 | 0.160.03 | |||||
| Fe ii | 6516 | 0.560.02 | |||||
| H i | 6561 | 2.130.03 | |||||
| : | 7514 | 0.400.03 | |||||
| Fe ii | 7713 | 0.690.04 | 1.290.21 | ||||
| O i | 77742 | 0.430.03 | 3.810.29 | ||||
| : | 7865 | 0.460.03 | |||||
| : | 7918 | 0.200.03 | |||||
| O i | 8446 | 1.020.04 | 2.940.51 | ||||
| Ca ii | 8498 | 1.450.102,3 | 1.580.03 | 9.530.08 | 8.400.162 | 9.260.45 | 6.710.08 |
| Ca ii | 8542 | 1.450.102,3 | 1.690.04 | 12.500.08 | 8.400.162 | 8.420.93 | 7.630.07 |
| Ca ii | 8662 | 0.940.093 | 1.370.05 | 11.640.08 | 4.080.14 | 8.820.51 | 7.200.08 |
| Mg i : | 8806 | 0.350.03 | 2.950.07 | 1.590.17 | 1.120.10 | ||
| Ca ii | 8929 | 0.580.04 | |||||
| : | 9572 | 1.240.07 | |||||
| Fe ii: | 9999 | 4.530.15 | |||||
| 1 Fe ii 5169 Å and/or Mg i 5167/5173/5184 Å contribute to this feature. | |||||||
| 4 Feature is clearly seperated from the Fe ii/Mg i blend for WD J0529-3401 and WD J0846+5703. | |||||||
| 2 Blended emission features measured as single feature. | |||||||
| 3 Strongly contaminated by photospheric absorption feature(s). EW quoted is a lower limit. | |||||||