Dyslexia detection from EEG signals using SSA component correlation and Convolutional Neural Networks
Abstract
Objective dyslexia diagnosis is not a straighforward task since it is traditionally performed by means of the intepretation of different behavioural tests. Moreover, these tests are only applicable to readers. This way, early diagnosis requires the use of specific tasks not only related to reading. Thus, the use of Electroencephalography (EEG) constitutes an alternative for an objective and early diagnosis that can be used with pre-readers. In this way, the extraction of relevant features in EEG signals results crucial for classification. However, the identification of the most relevant features is not straighforward, and predefined statistics in the time or frequency domain are not always discriminant enough. On the other hand, classical processing of EEG signals based on extracting EEG bands frequency descriptors, usually make some assumptions on the raw signals that could cause indormation loosing. In this work we propose an alternative for analysis in the frequency domain based on Singluar Spectrum Analysis (SSA) to split the raw signal into components representing different oscillatory modes. Moreover, correlation matrices obtained for each component among EEG channels are classfied using a Convolutional Neural network.
Keywords:
Singular Spectrum Analysis Dyslexia diagnosis Convolutional Neural Network1 Introduction
Developmental dyslexia (DD) is a difficulty in the acquisition of reading skills, whose prevalence is estimated between 5% and 12% of the population [13]. It has an important social impact, since it may determine school failure and has harmful effects in the self-esteem of affected children. Prevention programs and individualized intervention tasks may help to mitigate behavioural aspects in dyslexic children, when they are applied in the early stages. Nevertheless, early diagnosis is currently a challenging task since most behavioural tests developed to this end include reading or writing tasks.
Alternatively, the use of biomedical signals directed to measure brain activity, constitutes a powerful tool to develop differential and objective diagnosis methods. These signals can be acquired under a specific experimental setup that may not neccesary require any action from the subject. In this work we use Electroencephalography (EEG) acquired during a non-interactive task consisting of the application of auditory stimuli that resemble the sampling processes performed in the brain for language processing. This segmentation proccess aims to extract features for recognising patterns related to different phonemes, sylabes or words. Thus, in this work we propose a method for the extraction of EEG features to be used in differential diagnosis. Moreover, these features may help to identify biomarkers to figure out unknown aspects of the DD related to its neural basis. This can offer valuable information for a better understanding of the differences between dyslexic and non-dyslexic subjects, with special application to the design of individualized intervention tasks [15].
Usually, frequency features are used in EEG processing, specifically those related to the power distribution in different frequency bands (Delta, Theta, Alpha, Beta and Gamma). Frequency-based descriptors have been used in BCI and EVP experiments [11, 8, 2], by means of Fourier or Wavelet Analysis to estimate the average power in each band. These descriptors allowed to differentiate brain states or responses to diverse stimuli. As a matter of fact, different studies conducted in the search for DD-related patterns in EEG signals [14, 4] have shown differences in readers due to cognitive impairment of the phonological representation of word forms. Speech encoding which is related to speech prosody and sensorimotor synchronization problems can be revealed by finding patterns at different sub-bands. In this work, we used EEG signals recorded by a 32 active electrodes BrainVision (Brain Products GmhH) equipment during 5 minute sessions, while presenting an auditive stimulus to the subject. These signals are then pre-processed and analyzed in the frequency domain by means of Singular Spectrum Analysis (SSA), which allows to decompose the raw signal into additive components representing different oscillatory modes.
The rest of the paper is organized as follows. Section 2 presents details of the database and signal preprocessing. Then, section 3 describes the auditory stimulus and the post-processing using SSA to extract features, as well as the classification method. Section 4 presents and discusses the classification results, and finally, Section 5 draws the main conclusions.
2 Materials and methods
2.1 Database
The present experiment was carried out with the understanding and written consent of each child’s legal guardian and in the presence thereof. Forty-eight participants took part in the present study, including 32 skilled readers (17 males) and 16 dyslexic readers (7 males) matched in age (, age range: 88-100 months). The mean age of the control group was months, and months for the dyslexic group. All participants were right‐handed Spanish native speakers with no hearing impairments and normal or corrected-‐to-‐normal vision. Dyslexic children in this study had all received a formal diagnosis of dyslexia in the school. None of the skilled readers reported reading or spelling difficulties or had received a previous formal diagnosis of dyslexia. Each subject was measured twice for each stimulus.
3 Methods
DD is a reading disorder characterized by reduced awareness of speech units [10]. Recent models of neuronal speech coding suggest that dyslexia originates from the atypical dominant neuronal entrainment in the right hemisphere to the slow-rhythmic prosodic (Delta band, 0.5-4 Hz), syllabic (Theta band, 4-8 Hz) or the phoneme (Gamma band, 12-40 Hz), speech modulations, which are defined by the onset time (i.e., the envelope) generated by the speech rhythm [5, 1].
According to [5, 1], different brain rhythms involved in language processing are associated to neural oscillations that control the sampling processes developed to split auditory stimulus into its constituent parts, neccesary to recognise patterns at phoneme, syllabe and word. These neurophysiological responses should explain the manifestations of the temporal processing deficits described in dyslexia. In this work, EEG signals were obtained for auditory stimulus consisting in amplitude modulated (AM) white-noise at the rate of 8Hz. EEG signals were acquired at a sampling rate of 500 Hz, using a 32 active electrodes (BrainProducts actiCAP) while presenting the auditory stimulus.
3.1 Signal preprocessing
EEG signals were pre-processed in order to remove artefacts related to eye blinking and impedance variations due to movements. Since eye blinking signal is recorded along with EEG signals, these artefact are removed by blind source separation using Independent Component Analysis (ICA) [9]. Then, EEG signal of each channel is normalized independently to zero mean and unit variance to unify the scale in the subsequently processing carried out (for instance, Power Spectral Density calculation). In addition, a number of samples at the beginning and at the end of the signals were removed in order to obtain the same number of samples for each subject. Specifically, 136 seconds of EEG recording per subject and for each experiment were stored. It is worth noting that these 136 seconds signals were split into 40 seconds segments to speed up the post processing (such as SSA computation). Moreover, 40 seconds is enough time to capture the lowest EEG frequency considered (corresponding to Delta band ([0.5-4] Hz)) with a reasonable frequency resolution. Finally, all segments are band-pass filtered to keep only the frequencies of interest ([0.5, 40] Hz). Each segment is processed and used independently to generate samples for training the classifier.
3.2 Singular Spectrum Analysis
Singular Spectrum Analysis (SSA) is a non-parametric spectral estimation method that decomposes the original time series into a sum of series. Formally, a time series is embedded into a vector space of dimension , composed of the eigenvectors of the covariance matrix computed for the L-lagged vectors. Lagged vectors are defined as:
| (1) |
where . Thus, the covariance matrix :
| (2) |
The eigenvectors of the lag-covariance matrix are called temporal empirical orthogonal functions (EOFs). Moreover, the eigenvalues corresponding to each eigenvector account for the contribution of the direction to total variance. This way, the projection of the original time series on the k-component can be computed as:
| (3) |
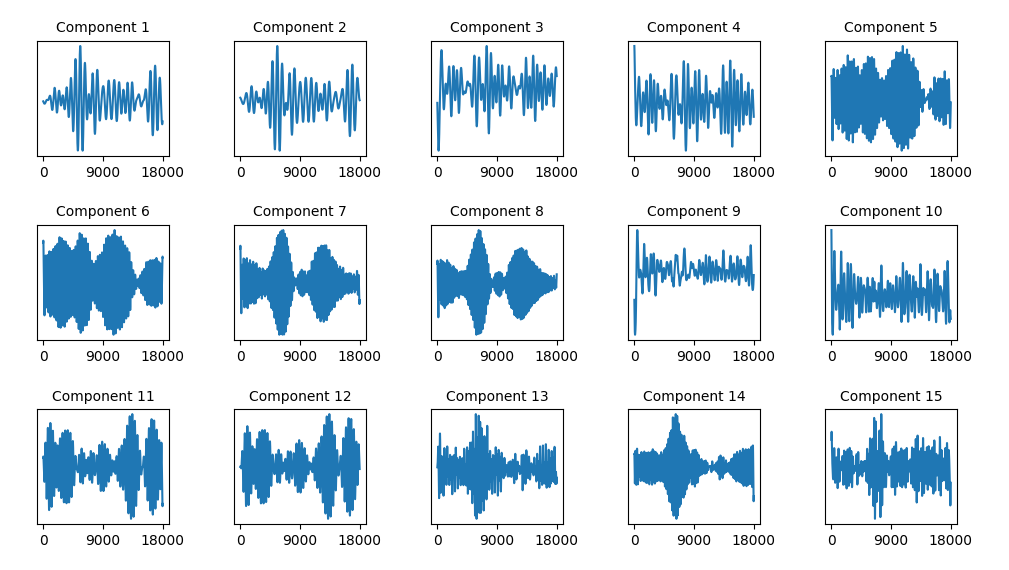
Each component extracted from SSA accounts for a part of the variance of the original signal. As these components are sorted according to the associated eigenvalues (in descending order), the first components will account for more variance than later components. Later, in Section 4, we show the variance explained by the computed components.
On the other hand, as can be seen in Figure 1, some of the extracted components are highly correlated. These correlated components can be grouped without losing interpretability. In this work, correlated EOFs were grouped to finally compose 5 components.
3.3 Feature extraction by Component Correlation
The feature extraction stage in this work consists in the computation of the Pearson’s correlation between channels for the PSD of each SSA component. This way, the PSD of each component is estimated using a modification of the Welch’s method [16], a robust estimator that improves the standard periodogram by reducing the noise, but at the cost of reducing the spectral resolution. To perform the original method, the signal is divided into different segments overlapping semgents. Then, a modified periodogram is computed for each windowed segment, and the resulting periodograms are averaged. In our case, since a number of EEG segments are available per subject and electrode, we compute the modified periodogram over every segment. Here, the Hanning window is used, and then the average periodogram is used to compute the correlation matrices.
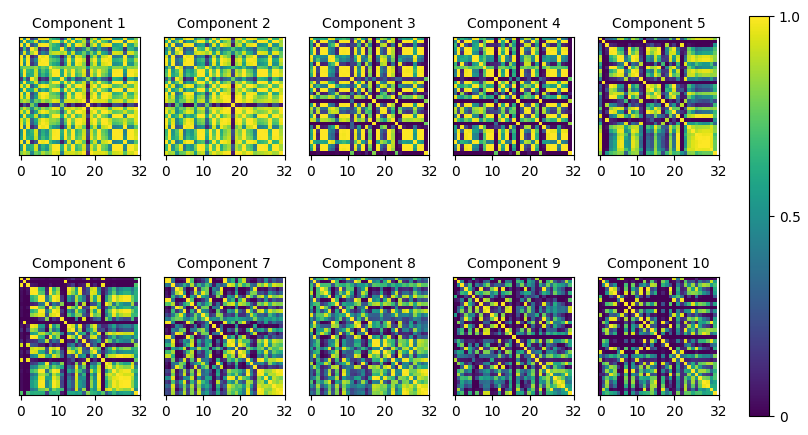
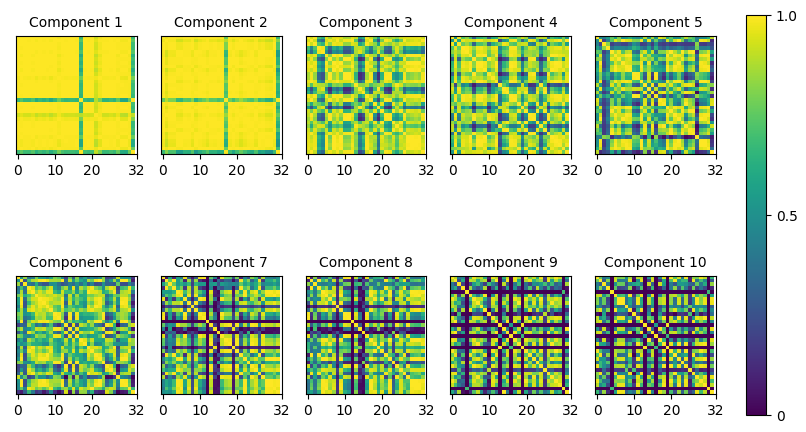
As shown in Figure 2, there appear SSA components presenting very similar channel correlation matrices. This is the result of the computation of PSDs of highly correlated SSA components, as their PSD profile is very similar. These components can be grouped together since it indicates poorly separated components. On the contrary, well separated components generally exhibit low correlation. In fact, it is usual to group highly correlated components (in the time domain) by means of the so called weighted correlation matrix (w-correlation), which allows identifying correlated components.
This way, highly correlated SSA components are grouped together in the time domain and then, the PSD of the group is computed again. Since SSA produces additive components, they can be grouped by simply adding them. The resulting correlation matrices are then classified using a Convolutional Neural Network.
3.4 Classification using an ensemble of CNNs
Once the correlation matrices for the PSD of the grouped components are computed, they are classified using a convolutional neural network. Convolutional neural networks are widely used to clasify image data with one or more channels (i.e. RGB images or even hyperspectral images) with important applications in the Machine Learning community [7, 3, 12], especially within the artificial vision and image analysis fields. CNNs are bioinspired by the convolutional response of neurons, and combine feature extraction and classification in one single architecture. The combination of different convolutional layers is able to recognize different patterns, from low-level features to higher abstractions, depending on the net depth. The set of fully connected layers (dense), similar to a perceptron, placed after convolutional layers, the classification. On the other hand, all neurons in any convolutional layer share the same weights, saving memory and easing the computation of the convolutions. This considerably reduces the number of trainable parameters in the network in comparison to a perceptron-like network designed for the same classification task.
CNN architectures have evolved over time, including new layers and connections among layers that have outperformed previous image classification approaches. An example of improvement for CNN is the use of residual blocks [6], consisting in adding to the input of a convolutional layer the input of a previous convolutional layer. Other improvements include the use of batch normalization layers or the use of strides1 in convolutional layers instead of poolings.
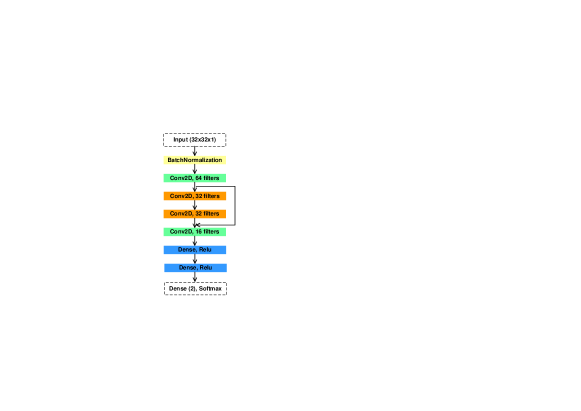
In this work, a CNNs are used to classify the subjects by means of their channel correlation matrices explained in Section 3.3. Since a matrix correlation is computed for each grouped component, we used a CNN with the architecture shown in Figure 3 for each one. Subsequently, the output of all CNN-based classifiers are combined by a majority voting strategy. The use of ensebles of CNNs have demonstrated their effectivity in image classification tasks, increasing the performance obtained by a single CNN while diminishing the overfitting effects [7].
4 Experimental Results
In this section, we show the results of the classification experiments carried out to demonstrate the discriminative capabilities of the features extracted from EEG signals. As explained in Section 3, the input to each of the CNNs consists of a channel correlation matrix for a specific grouped component. Moreover, since components showing a high correlation between them are guessed to belong to the same source, they can be added up. This way, 5 clusters in the w-correlation matrix have been computed by the hierarchical clustering of the pairwise distances among entries in the w-correlation matrix. Indeed, Figure 4a show the variance explained by 70 components and Figure 4b the variance explained by the 5 groups of components.
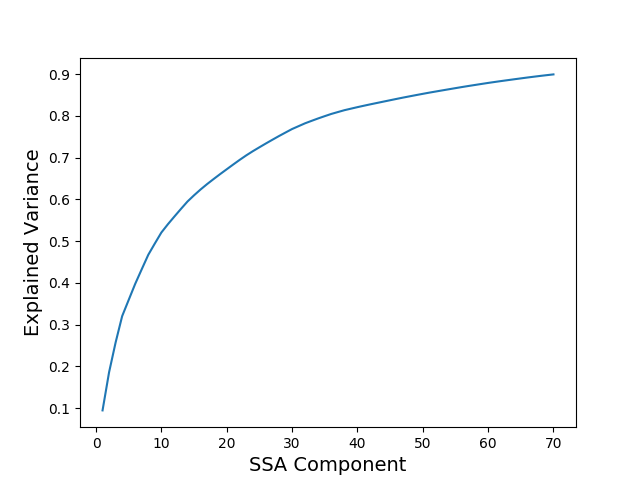
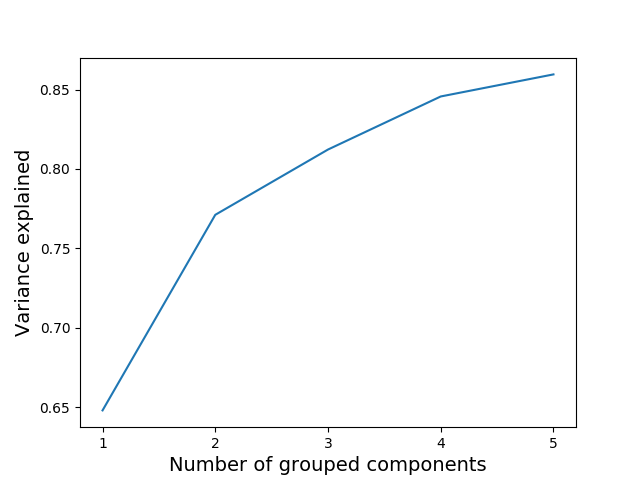
Grouping components has two main advantages. On the one hand, the classifier architecture is simpler. On the other hand, components with lower variance that could cause missclassifications (as they are not informative enough) are added together in a group explaining a larger part of the variance than those individual components.
Figure 5 show the classification performance obtained when a different number of grouped components are considered. As shown, the use of 4 grouped components provide the best performance. It is worth noting that 3 components (for instance) in Figure 5 indicates that an ensemble composed of 3 CNNs is used.
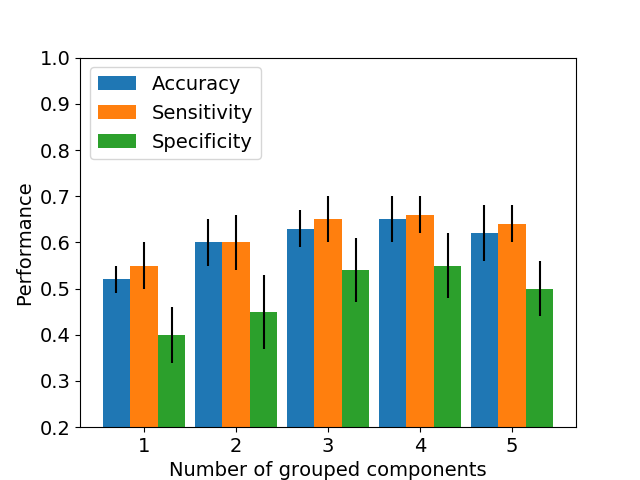
As shown in Figure 5 (a), since grouped components are sorted indescending order of the variance explained, first grouped components explain the most part of the variance, and therefore, provide the best classffication results. However, the last grouped component are most likely to contain noisy components, causing missclassifications.
5 Conclusions and future work
In this work we present a classification method for EEG signals based on SSA and CNN. The core idea in this work is the use of between channel correlation of the PSD of different oscillatory modes contained in the EEG signals. These oscillatory modes are represented by SSA components. An analysis of the components was performed and those showing higher correlations are grouped to compose a reduced set of components that accumulates a higher part of the variance. The use of grouped components reduces the number of CNN stages in the ensemble (since one CNN per component is used) and removes highly correlated components from the input of the classifier, improving the performance. The approach shown in this work shows its effectivity for extracting informative features for the differential diagnosis of DD. As a future work, we plan to continue exploring the SSA components searching for single oscillatory modes in EEG channels, represented by the fundamental frequency of a component or from harmonics, that could be synchronized among channels. This way, instead of using the correlation matrix, a matrix containing a synchronizaton index among channels could be used. This also have important and interpretable biological implications regarding the identificaton of cooperative brain areas - and the analysis of differences in the cooperation between controls and DD subjects - in language processing task.
Acknowledments
This work was partly supported by the MINECO/FEDER under PGC2018-098813-B-C32 project. We gratefully acknowledge the support of NVIDIA Corporation with the donation of one of the GPUs used for this research. Work by F.J.M.M. was supported by the MICINN “Juan de la Cierva - Formación” Fellowship. We also thank the Leeduca research group and Junta de Andalucía for the data supplied and the support.
References
- [1] Atypical cortical entrainment to speech in the right hemisphere underpins phonemic deficits in dyslexia. NeuroImage 175(1), 70 – 79 (2018)
- [2] Bradley, A., Wilson, W.: On wavelet analysis of auditory evoked potentials. Clinical neurophysiology : official journal of the International Federation of Clinical Neurophysiology 115, 1114–28 (05 2004)
- [3] Cireşan, D.C., Meier, U., Masci, J., Gambardella, L.M., Schmidhuber, J.: Flexible, high performance convolutional neural networks for image classification. In: Proceedings of the Twenty-Second International Joint Conference on Artificial Intelligence - Volume Volume Two. pp. 1237–1242. IJCAI’11, AAAI Press (2011). https://doi.org/10.5591/978-1-57735-516-8/IJCAI11-210, http://dx.doi.org/10.5591/978-1-57735-516-8/IJCAI11-210
- [4] Cutini, S., Szũcs, D., Mead, N., Huss, M., Goswami, U.: Atypical right hemisphere response to slow temporal modulations in children with developmental dyslexia. NeuroImage 143 (08 2016)
- [5] Flanagan, S., Goswami, U.: The role of phase synchronisation between low frequency amplitude modulations in child phonology and morphology speech tasks. The Journal of the Acoustical Society of America 143, 1366–1375 (03 2018). https://doi.org/10.1121/1.5026239
- [6] He, K., Zhang, X., Ren, S., Sun, J.: Deep residual learning for image recognition. pp. 770–778 (06 2016)
- [7] Krizhevsky, A., Sutskever, I., Hinton, G.E.: ImageNet Classification with Deep Convolutional Neural Networks. In: Proceedings of the 25th International Conference on Neural Information Processing Systems - Volume 1. pp. 1097–1105. NIPS’12, Curran Associates Inc., USA (2012)
- [8] León, J., Ortega, J., Ortiz, A.: Convolutional neural networks and feature selection for bci with multiresolution analysis. In: Advances in Computational Intelligence. pp. 883–894 (2019)
- [9] Li, R., Principe, J.C.: Blinking artifact removal in cognitive eeg data using ica. 2006 International Conference of the IEEE Engineering in Medicine and Biology Society pp. 5273–5276 (2006)
- [10] Molinaro, N., Lizarazu, M., Lallier, M., Bourguignon, M., Carreiras, M.: Out-of-synchrony speech entrainment in developmental dyslexia. Human Brain Mapping 37, 2767–2783 (08 2016)
- [11] Ortega, J., Asensio-Cubero, J., Gan, J., Ortiz, A.: Classification of motor imagery tasks for bci with multiresolution analysis and multiobjective feature selection. BioMedical Engineering OnLine 15(73), 1–12 (07 2016)
- [12] Ortiz, A., Martínez-Murcia, F.J., García-Tarifa, M.J., Lozano, F., Górriz, J.M., Ramírez, J.: Automated diagnosis of parkinsonian syndromes by deep sparse filtering-based features. In: Innovation in Medicine and Healthcare 2016, pp. 249–258. Springer (2016)
- [13] Peterson, R., Pennington, B.: Developmental dyslexia. Lancet 379, 1997–2007 (2012)
- [14] Power, A.J., Colling, L.J., Mead, N., Barnes, L., Goswami, U.: Neural encoding of the speech envelope by children with developmental dyslexia. Brain and Language 160, 1 – 10 (2016). https://doi.org/https://doi.org/10.1016/j.bandl.2016.06.006, http://www.sciencedirect.com/science/article/pii/S0093934X15301681
- [15] Thompson, P.A., Hulme, C., Nash, H.M., Gooch, D., Hayiou-Thomas, E., Snowling, M.J.: Developmental dyslexia: predicting individual risk. Journal of Child Psychology and Psychiatry 56(9), 976–987 (2015)
- [16] Welch, P.: The use of fast fourier transform for the estimation of power spectra: A method based on time averaging over short, modified periodograms. IEEE Transactions on Audio and Electroacoustics 15(2), 70–73 (jun 1967). https://doi.org/10.1109/tau.1967.1161901