Probing the CGM of Low-redshift Dwarf Galaxies Using FIRE Simulations
Abstract
Observations of UV metal absorption lines have provided insight into the structure and composition of the circumgalactic medium (CGM) around galaxies. We compare these observations with the low-redshift () CGM around dwarf galaxies in high-resolution cosmological zoom-in runs in the FIRE-2 simulation suite. We select simulated galaxies that match the halo mass, stellar mass, and redshift of the observed samples. We produce absorption measurements using Trident for UV transitions of C iv, O vi, Mg ii and Si iii. The FIRE equivalent width (EW) distributions and covering fractions for the C iv ion are broadly consistent with observations inside , but are under-predicted for O vi, Mg ii, and Si iii. The absorption strengths of the ions in the CGM are moderately correlated with the masses and star formation activity of the galaxies. The correlation strengths increase with the ionization potential of the ions. The structure and composition of the gas from the simulations exhibit three zones around dwarf galaxies characterized by distinct ion column densities: the disky ISM, the inner CGM (the wind-dominated regime), and the outer CGM (the IGM accretion-dominated regime). We find that the outer CGM in the simulations is nearly but not quite supported by thermal pressure, so it is not in hydrostatic equilibrium (HSE), resulting in halo-scale bulk inflow and outflow motions. The net gas inflow rates are comparable to the SFR of the galaxy, but the bulk inflow and outflow rates are greater by an order of magnitude, with velocities comparable to the virial velocity of the halo. These roughly virial velocities () produce large EWs in the simulations. This supports a picture for dwarf galaxies in which the dynamics of the CGM at large scales are coupled to the small-scale star formation activity near the centre of their halos.
keywords:
galaxies: formation – intergalactic medium – quasars: absorption lines1 Introduction
The origin of the circumgalactic medium (CGM) is a product of two critical processes in galaxy evolution: gas inflow from the intergalactic medium (IGM) and gas outflow from the galaxy. Continuous gas inflow is required to sustain the star formation activity observed throughout cosmic time, while galactic outflows are necessary to explain the low observed star formation efficiency (Dekel et al., 2009; Silk & Mamon, 2012). However, the CGM is a complex and dynamic environment because of the interaction between accretion and outflows, and hydrodynamic instabilities that occur in the process. Consequently, the study of the CGM is both challenging and crucial for our understanding of galaxy formation.
The CGM is diffuse and dim, and as a result, it has only recently been detected in emission (e.g., Martin et al., 2014, 2015). An alternate probe is to use absorption spectra of bright background objects (e.g., quasars) to gain information on element abundances along sightlines. With recent observations probing the circumgalactic region (Tumlinson et al., 2011; Prochaska et al., 2011; Werk et al., 2014; Bordoloi et al., 2014; Liang & Chen, 2014; Johnson et al., 2015; Johnson et al., 2017), we are provided with new constraints to test and inform our theoretical and computational modeling of the process of galaxy formation and evolution. By comparing the structure of the CGM in simulations with that seen in observations, we can test our understanding of galaxy formation. At the same time, because of the limitations of the observational probes, the simulations can provide an interpretation of the observations.
Small scale simulations with sufficient resolution to resolve individual stars have identified non-linear interaction of the different feedback mechanisms as critical for the generation of outflows from stars. However, such extremely high resolution simulations are restricted to small scale systems such as single star clusters, molecular clouds (e.g., Harper-Clark & Murray, 2011) or the “first stars" (e.g., Wise et al., 2012). Current large-scale cosmological simulations (e.g., Vogelsberger et al., 2014a, b), still cannot resolve the details of the launching of stellar winds from stellar feedback and thus need to implement “sub-grid" prescriptions. The prescriptions are routinely tuned so that the simulations match the observational constraints, such as the stellar mass – halo mass function.
The FIRE (Feedback In Realistic Environments) project (Hopkins et al., 2014, 2018) includes a suite of high-resolution cosmological zoom-in simulations 111http://fire.northwestern.edu/. What distinguishes the simulations in the FIRE project from other cosmological simulations is the realistic feedback models used. The feedback mechanisms included in the simulation suite in this analysis are supernovae (Ia & II), continuous stellar mass-loss (OB/AGB-star winds), photo-ionization and photo-electric heating, radiation pressure, metal diffusion, and cosmic rays. The parameters in the feedback models are not tuned “by hand" to match the observational constraints. Instead, the stellar feedback inputs are based entirely on stellar population models. It has already been shown in a series of papers that the FIRE simulations can reproduce a number of galaxy properties in observations at different redshifts, including star-formation (e.g., Feldmann et al., 2016; Sparre et al., 2017; Orr et al., 2018), dynamical (e.g., Orr et al., 2019) and morphological properties (e.g., Ma et al., 2017; Wetzel et al., 2016; El-Badry et al., 2018). Results discussed later in this paper include comparison of FIRE-2 simulations with and without cosmic rays to observations of the CGM around low-redshift galaxies (Ji et al., 2019), particle tracking of inflows and outflows that build up galaxies (Anglés-Alcázar et al., 2017), and particle tracking of origins and fates of the CGM (Hafen et al., 2019a, b).
The FIRE feedback implementation makes clear predictions of the dynamics and thermal state of the CGM in the main halo of each simulation. The predictions of neutral hydrogen absorption in the CGM of the FIRE simulations have been presented in Faucher-Giguère et al. (2015, 2016) and Hafen et al. (2017), so here we concentrate on metal absorption lines.
In this work, our goal is to compare the structure of the CGM around low-redshift dwarf galaxies seen in the FIRE-2 simulations with the results of the available observations (Bordoloi et al., 2014; Liang & Chen, 2014; Johnson et al., 2017). Following Bordoloi et al. (2014), who include galaxies with stellar masses up to , we include galaxies up to (FIRE simulation ‘m11f’) to cover the observed range.
With shallower potential wells and higher gas fractions, dwarf galaxies are both predicted and observed (Martin, 1998; Martin et al., 2002; Strickland & Stevens, 2000; Summers et al., 2003, 2004; Hartwell et al., 2004; Ott et al., 2005) to have stronger outflows relative to their stellar mass or star formation rates. Because of the difference in the order of magnitude in mass, dwarf galaxies provide a critical testing ground for our theories of galaxy evolution and a great opportunity to understand the process of the cycling of baryons through galactic disks into the CGM and back over a broad range of halo masses. We leave comparison of high-z dwarf galaxies and predictions of the distributions of other ions for future work.
This paper is structured as follows. In Section 2, we describe the simulation suite and the observations used in this study. In Section 3, we describe the post-processing of the simulations for CGM analysis. In Section 4, we present the main results from the analysis of the simulation data, including the absorption EW distributions of four ions in the simulated sample and their comparison with observations (Section 4.1), examination of the relationship between the equivalent width (EW) distributions of the ions in the simulations (Section 4.2), connecting UV absorption to galactic properties (Section 4.3), physical distribution of the CGM gas (Section 4.4), and the dynamics of the CGM around dwarf galaxies (Section 4.5). In Section 5 we discuss the limitations in this work and compare to other studies of the CGM, and we conclude in Section 6.
2 Simulations and Observational Counterparts
2.1 The Simulations
We analyze the FIRE-2 simulations from the FIRE project (Hopkins et al., 2018), a set of cosmological “zoom-in” simulations run with the gizmo code (Hopkins, 2015) 222http://www.tapir.caltech.edu/~phopkins/Site/GIZMO.html from redshift 99 to 0. The simulations use a Meshless Finite Mass (MFM) hydrodynamic solver with explicitly modelled feedback processes. These processes include energy, momentum, mass, and metal fluxes arising from SNe types I&II, stellar mass-loss (O-star and AGB), radiation pressure (UV and IR), photo-ionization, and photo-electric heating. Sub-grid metal diffusion is included for four of the ten zoom-in simulations. The simulations explicitly follow chemical abundances of nine metal species (C, N, O, Ne, Mg, Si, S, Ca, and Fe), with enrichment following each source of mass return individually. O and Mg are primarily produced in SNII/Ib/Ic, while C is made in both SNII/Ib/Ic and AGBs, and finally Si is primarily produced in SNII/Ib/Ic and SNIa. The simulations include the cosmic UVB background model of Faucher-Giguère et al. (2009) together with local radiation sources. Self-shielding is treated with a local Sobolev/Jeans-length approximation. For more information about the simulations and feedback prescriptions, please refer to Hopkins et al. (2018).
We adopt a standard flat CDM cosmology with cosmological parameters , , , , and .
| Name | log | log | log | log | Reference | ||||
|---|---|---|---|---|---|---|---|---|---|
| () | () | () | () | (kpc) | () | () | |||
| 10.6 | 8.1 | 9.1 | 0.54 | 0.00 | 90.3 | 2100 | 4.0 | 1 | |
| 10.6 | 8.1 | 9.3 | 0.91 | 0.02 | 92.4 | 2100 | 4.0 | 1 | |
| 11.1 | 8.9 | 9.6 | 2.00 | 0.08 | 137.0 | 2100 | 3.0 | 1 | |
| 11.5 | 9.6 | 10.2 | 7.52 | 0.04 | 169.2 | 7070 | 4.5 | 2 | |
| 11.2 | 9.2 | 9.7 | 2.26 | 0.32 | 135.6 | 7070 | 4.5 | 2 | |
| 11.7 | 10.4 | 10.3 | 8.87 | 6.61 | 207.6 | 1.7e4 | 4.9 | 1 | |
| 11.4 | 9.6 | 9.8 | 2.80 | 0.45 | 146.4 | 7070 | 4.5 | 2 | |
| 10.9 | 9.0 | 9.1 | 0.63 | 0.09 | 106.0 | 7070 | 4.5 | 2 | |
| 11.1 | 8.7 | 9.7 | 2.24 | 0.03 | 138.8 | 880 | 3.6 | 3 | |
| 11.4 | 9.4 | 10.2 | 7.38 | 0.73 | 167.4 | 7070 | 4.5 | 3 |
-
•
parameter units are physical:
(1) Name: Simulation designation, the simulations which ends with ’md’ have metal diffusion included.
(2) : Approximate mass of the “main” halo (most massive halo in the high-resolution region).
(3) : Stellar mass of the central galaxy in the main halo at .
(4) : Gas mass of the central galaxy in the CGM at , the CGM region is the volume beyond the stellar mass radius and within of the main halo.
(5) : Dynamical time of the main halo at , the halo dynamical times of all simulations are between 2.1e9-2.2e9 yr.
(6) : Star formation rate of the galaxy at , averaged over the last ten snapshots.
(7) : Virial radius of the “main" halo, using the definition in Bryan & Norman (1998).
(8) : Initial gas particle mass
(9) : Dark matter particle mass
(10) Reference: Where the simulation is first presented. 1: Chan et al. (2018), 2: El-Badry et al. (2018), and 3: Hopkins et al. (2018).
2.2 Observational data
Since the CGM is diffuse and dim, most observations use absorption spectra of background quasars (QSOs) to gain information about the chemical component along specific sightlines, rather than through direct emission. Commonly observed absorption lines in the circumgalactic medium include hydrogen Ly , Si ii , Si iii , C ii , the C iv , doublet, the Mg ii , doublet, and the O vi , doublet. In this work, we compare our simulations to three observational samples that looked at dwarf galaxies: the COS-Dwarfs survey (Bordoloi et al., 2014), the dwarf galaxies in Liang & Chen (2014) and the observations in Johnson et al. (2017). We describe all three here.
In the COS-Dwarfs survey, 43 low-mass galaxies () over the redshift range were observed using background QSOs. The sources were selected based on galaxy properties, quasar brightnesses and their projected separations. The survey focused on the C iv 1548 1550 doublet transition in low redshift galaxies, constrained by the spectral coverage of the COS FUV gratings. This transition traces chemically enriched warm gas () or highly ionized gas around the host galaxy. They found that the C iv absorption strength decreases with radius as a power law () and that no absorption was detected beyond . The authors estimate the total carbon mass in the CGM of the galaxies to be comparable to the carbon mass in the interstellar medium of the host galaxy; this conclusion can be directly compared to the simulation data we analyze here. Further, they found a tentative correlation between C iv absorption strengths and host galaxy sSFR; we address this and similar correlations in section 4.3.
Liang & Chen (2014) studied absorption transitions of Ly , C ii, C iv, Si ii, Si iii, and Si iv in the vicinities of 197 galaxies. They identified their sample from a comparison of 300 spectroscopic galaxies in the public archives, with background QSOs having high-quality spectra from the Hubble Space Telescope (HST) data archive. The sample has a median redshift of , a median impact parameter of kpc and a median stellar mass of . From to , a differential covering fraction between low- and high-ionization gas is measured, suggesting that the CGM becomes progressively more ionized with increasing galactocentric radius; At no metals in either the low- or high-ionization states are detected from both the low-mass dwarfs and high-mass galaxies, though abundant hydrogen gas is observed to well beyond , with a mean covering fraction of per cent.
Johnson et al. (2017) analyzed the CGM of 18 star-forming field dwarf galaxies ( ) at , drawn from a Magellan telescope survey in the fields of quasars with high S/N COS absorption spectra. The authors searched for H i, Si ii, Si iii, Si iv and O vi absorption in the quasar spectra. They found that compared to massive star-forming galaxies, metal absorption is less common from the CGM of dwarf galaxies, and is weaker with the exception of O vi.
In this paper, we will compare the structure of the CGM around low-redshift dwarf galaxies inferred by the FIRE-2 simulations with the results of the available observations (Bordoloi et al., 2014; Liang & Chen, 2014; Johnson et al., 2017). For reference, the minimum detected EWs for C iv are 95 , 59 , and 130 respectively; for Si iii the minimum EWs are 54 , 70 for the later two references; for O vi the minimum detected EW is 80 (only Johnson et al. (2017) reports this ion); there are no measurements for Mg ii.
3 Generating absorption spectra from simulation data
To compare the results of the FIRE simulations and the observational data, we must select simulated galaxies that match the mass and redshift properties of the observational studies. Further, we must model a representative sample of spectra from sightlines using the simulated properties, including the density, temperature, and metallicity of the gaseous medium in the selected galaxies.
In this section we describe the selection criteria for galaxies simulated within FIRE. We also describe how absorption spectra have been generated from the simulation data, enabling direct comparison to observational results.
3.1 Selection of simulated galaxies
To compare against the available observations, we selected the main galaxy from 10 zoom-in simulations of the FIRE-2 project with stellar masses between , representing the stellar mass range of observed dwarf galaxies. The parameters of the selected simulations and their primary halos are listed in Table 1.
For each of the simulations, we selected time-based snapshots that are within the redshift range of the observations (). We find the center of the main galaxy in each snapshot using the Amiga Halo Finder (AHF; Gill et al., 2004; Knollmann & Knebe, 2009). We limit ourselves to snapshots that are separated, at a minimum, by the dynamical time of the galaxy’s disk; the typical dynamical time of the simulated galaxies is Myr. We do this to ensure each galaxy snapshot is dynamically independent, and consequently not biased towards artifacts from the simulation or specific configuration of the galaxies. The dynamical time of the halo is an order of magnitude larger than the dynamical time of the galaxy, but the disk dynamical time is more relevant to the small scale structures we seek to probe. We note that we do not place any constraint on the star formation properties or metallicity of the simulated galaxies.
Most of the runs we studied did not include any sub-grid metal diffusion. However, four of the simulations did include a sub-grid model for metal diffusion; these are marked with ‘_md’ in Table 1. The FIRE simulations use a finite mass method which by definition prevents transport of material from one particle to another. In reality, there will be transport of material from one region to another on the particle separation scale. The metal diffusion runs approximate this diffusion using the Smagorinsky (1963) model. We show in Section 4.1 that including the sub-grid model for metal diffusion reduced the spread in the EW distribution.
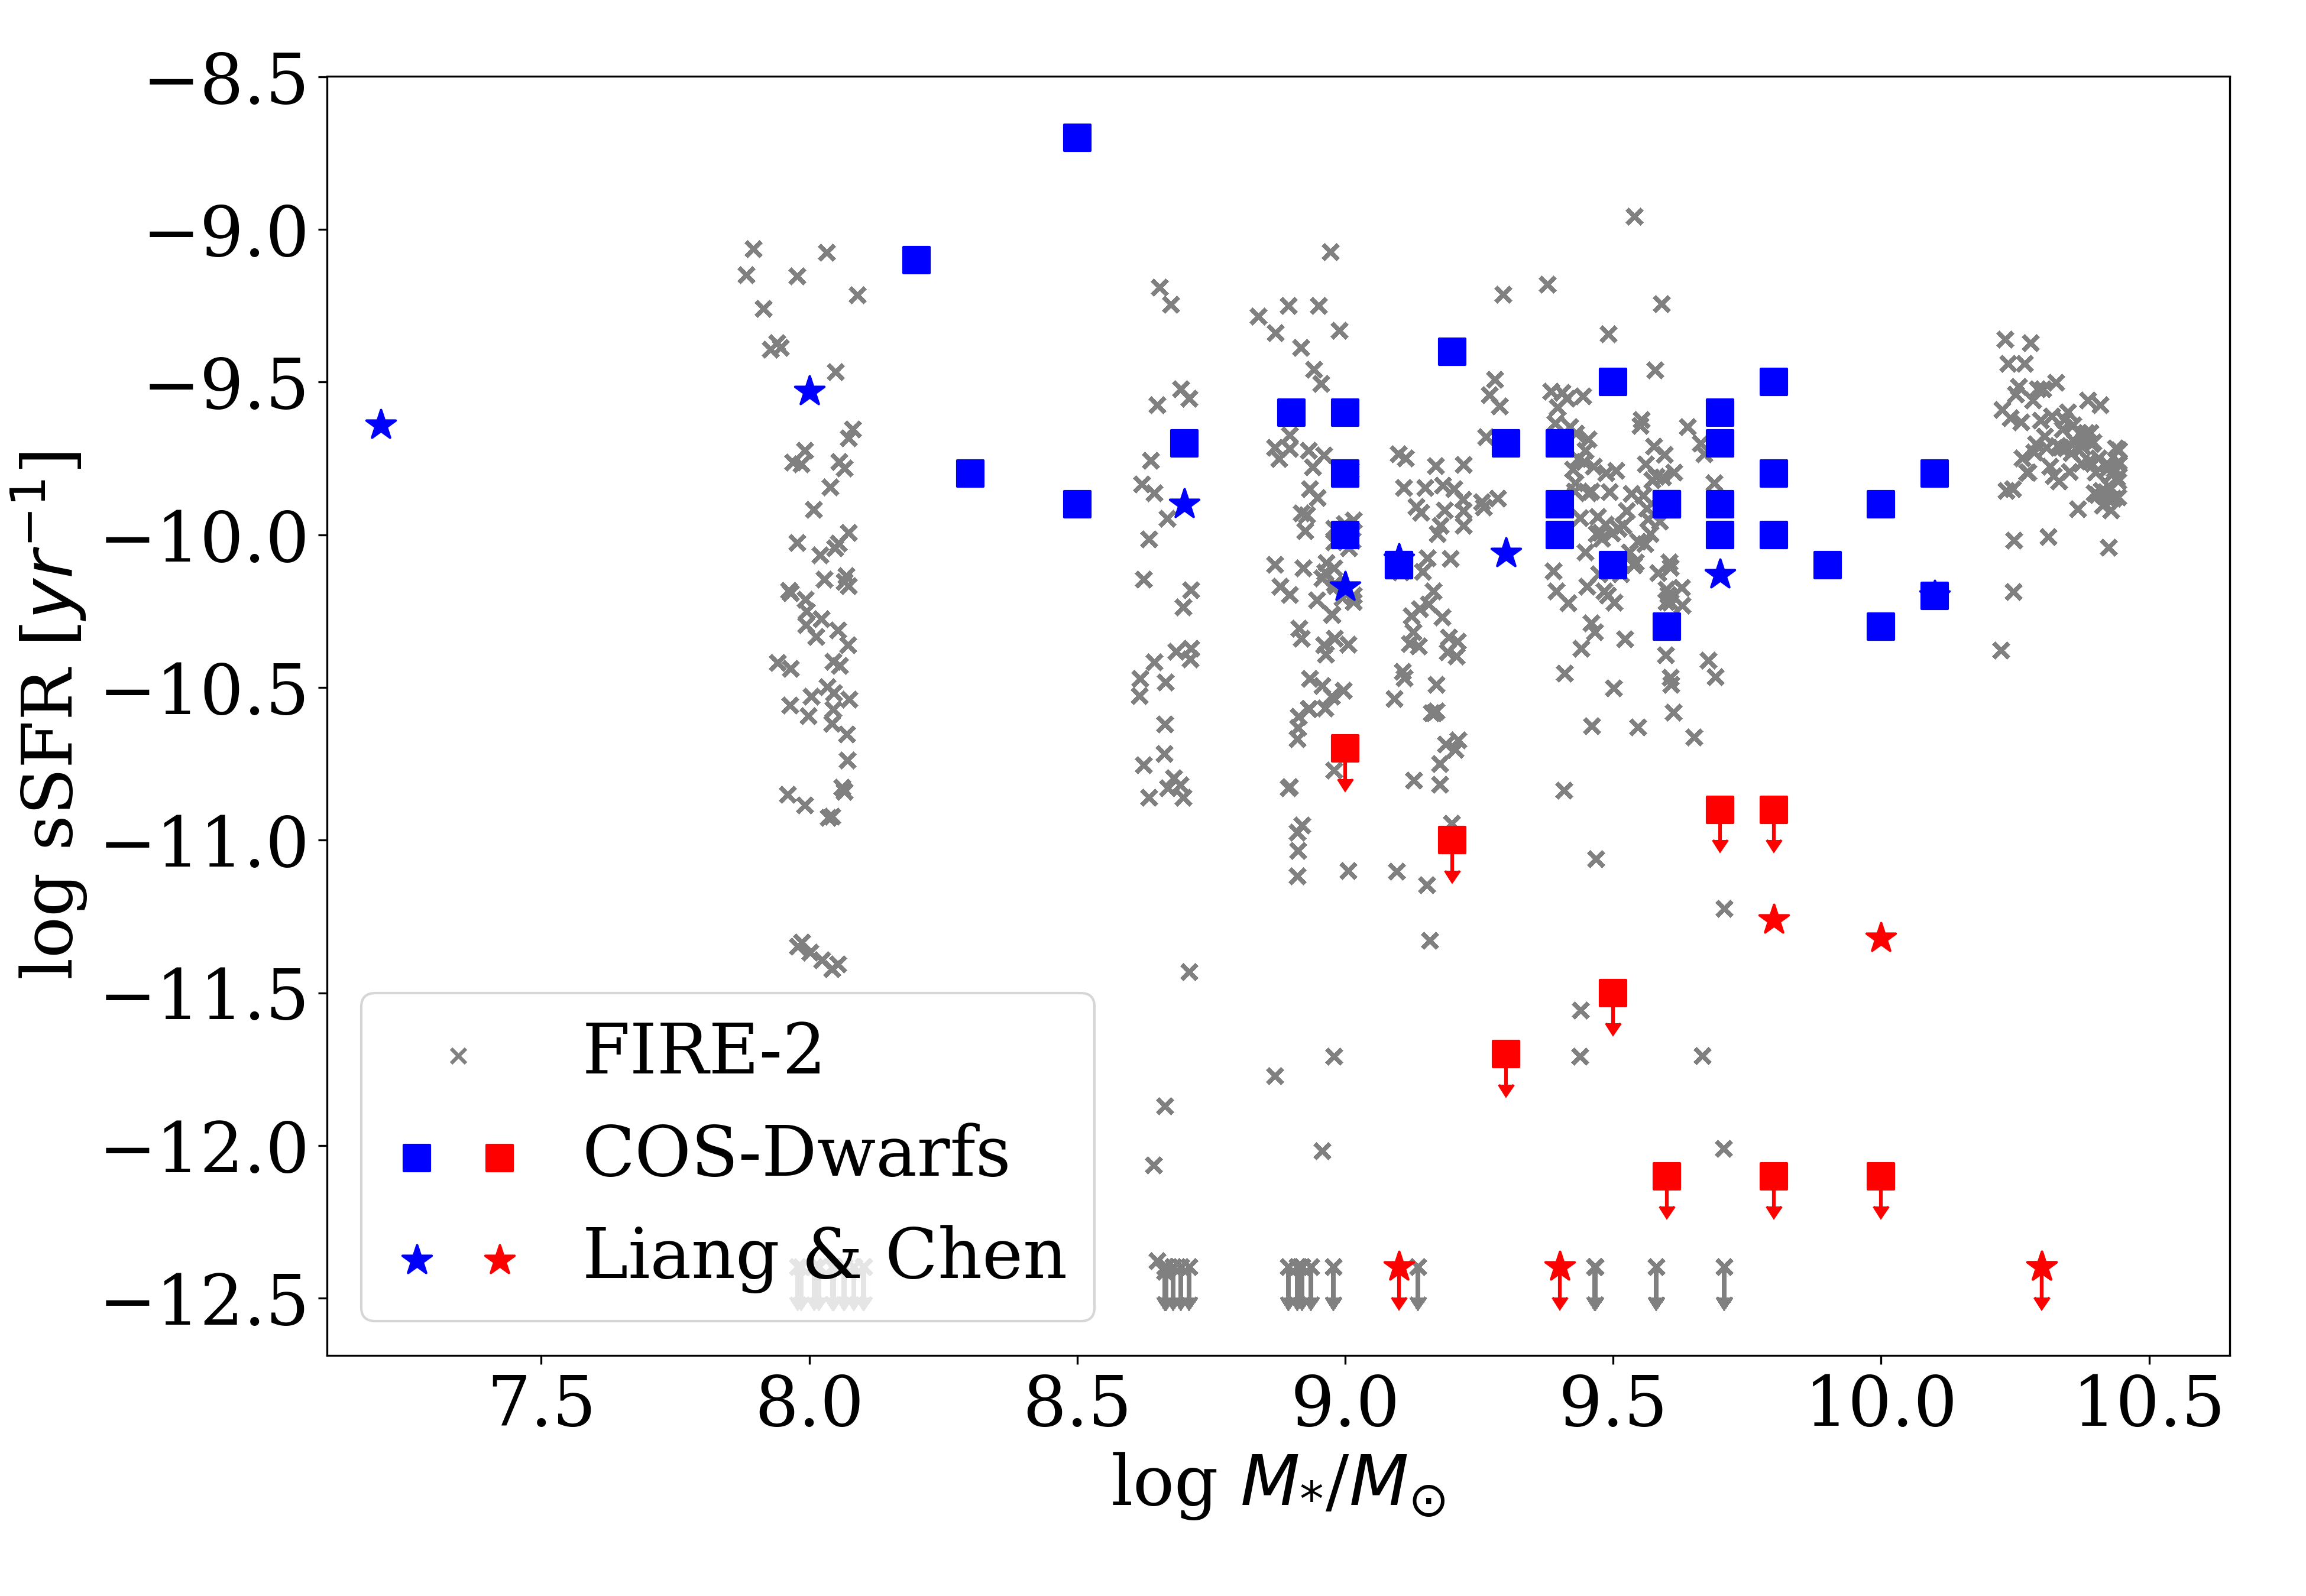
These selection criteria resulted in snapshots for each galaxy with redshift , leading to 442 samples in total. The mass and specific star formation rate (sSFR) of each sample galaxy are plotted in Figure 1, alongside the properties of observed galaxies from the COS-Dwarfs survey, and Liang & Chen (2014). In order to study the star formation rate dependence of the CGM properties, we subdivide the sample into star-forming galaxies and quiescent galaxies, using the sSFR criterion of , as done for COS-Dwarfs. The simulated sample galaxies match the stellar mass range from the observations. The distribution of sSFR for matches that of the observational sample. However, for , the simulations predict a large number of quiescent galaxies not found in the samples we compare to.
3.2 Generating Synthetic Spectra
For each sample galaxy, we choose random lines of sight (LOS), sampling the space uniformly (equal number per unit projected area). We limit ourselves to impact parameters between . We use the definition of in Bryan & Norman (1998), consistent with the observations.
The length of the LOS is , so that the result will not be strongly affected by the low-resolution IGM region of the simulation. At a distance of , the density in the simulations has dropped to (roughly where is the cosmic baryon fraction and , with the cosmic mean density), while the metallicity is (see section 4.4.2), comparable to the mean metallicity of the IGM Simcoe et al. (2004). The maximum path length is set by the velocity offset beyond which the absorber is no longer taken to be associated with the target galaxy. Following Bordoloi et al. (2014) we take , which corresponds to a path length . Taking the fraction of , we find . As we will show later, this is about of the lowest column we find for impact parameters . Our estimates are biased low by this amount compared to observations.
A direct comparison to the observational work requires the generation of spectral equivalent widths in each of the desired absorption lines. To do this, we need to estimate the density of the relevant ions. The FIRE simulation tracks 11 different atoms (H, He, C, N, O, Ne, Mg, Si, S, Ca and Fe). However, performing full radiative transfer to determine the ionic states would be computationally expensive to run at the desired resolution.
We use the open-source code Trident (Hummels et al., 2017) to post-process the FIRE simulations for analysis and comparison with the observational sample. We apply Trident to infer the abundance of four ions throughout the simulations: C iv, O vi, Mg ii, and Si iii accounting for photoionization and collisional ionization. Trident estimates these abundances using a detailed look-up table assembled from over Cloudy (Ferland et al., 2013) radiative transfer simulations, systematically varying density, temperature, and a redshift-dependent radiation field consistent with the Haardt-Madau UV/X-ray background (Haardt & Madau, 2012).
The effects of self-shielding are well known to play a role in regions of high gas density, where the abundance of some low-ionization-energy ions are partially shielded from ionizing radiation (Rahmati et al., 2013). We account for this effect using new updated Trident ion tables using a method first described in Emerick et al. (2019) for the Grackle cooling code (Smith et al., 2017). These tables are constructed as described above from Cloudy simulations, each initialized with a single density, temperature, and radiation field. Each Cloudy run is a one dimensional simulation with length equal to the Jeans length but capped at 100 pc for large Jeans lengths. The radiation field is applied to one end of the simulation volume, and the simulation executes until it reaches an equilibrium state. At the end of this period, the ionic abundances are measured at the other end of the simulation volume, self-consistently capturing the effects of self-shielding by how effectively radiation is able to penetrate the intervening gas on the maximum scale it would clump.
Using these post-processed ionic abundances added to our FIRE galaxies, we generate random sightlines through the each simulation volume at a variety of different impact parameters relative to the center of each galaxy. These sightlines are meant to mimic the observational datasets, each representing the path of light from a distant quasar through the intervening CGM of our foreground galaxies. The gas properties and ionic abundances for each sightline are passed to Trident (Hummels et al., 2017) to generate synthetic spectra, depositing absorption features in the spectra for each absorbing ion encountered along the line of sight. Finally, we numerically integrate the absorption features for each ionic transition to identify an equivalent width (EW) value appropriate for direct comparison with the observational samples. We have visually inspected the spectra of Mg ii, and almost all of the lines are optically thin (the double ratio is 2:1); only 1 LOS out of 6000 had a ratio that was clearly lower.
4 Results
4.1 Ion Equivalent Width vs Impact Parameter
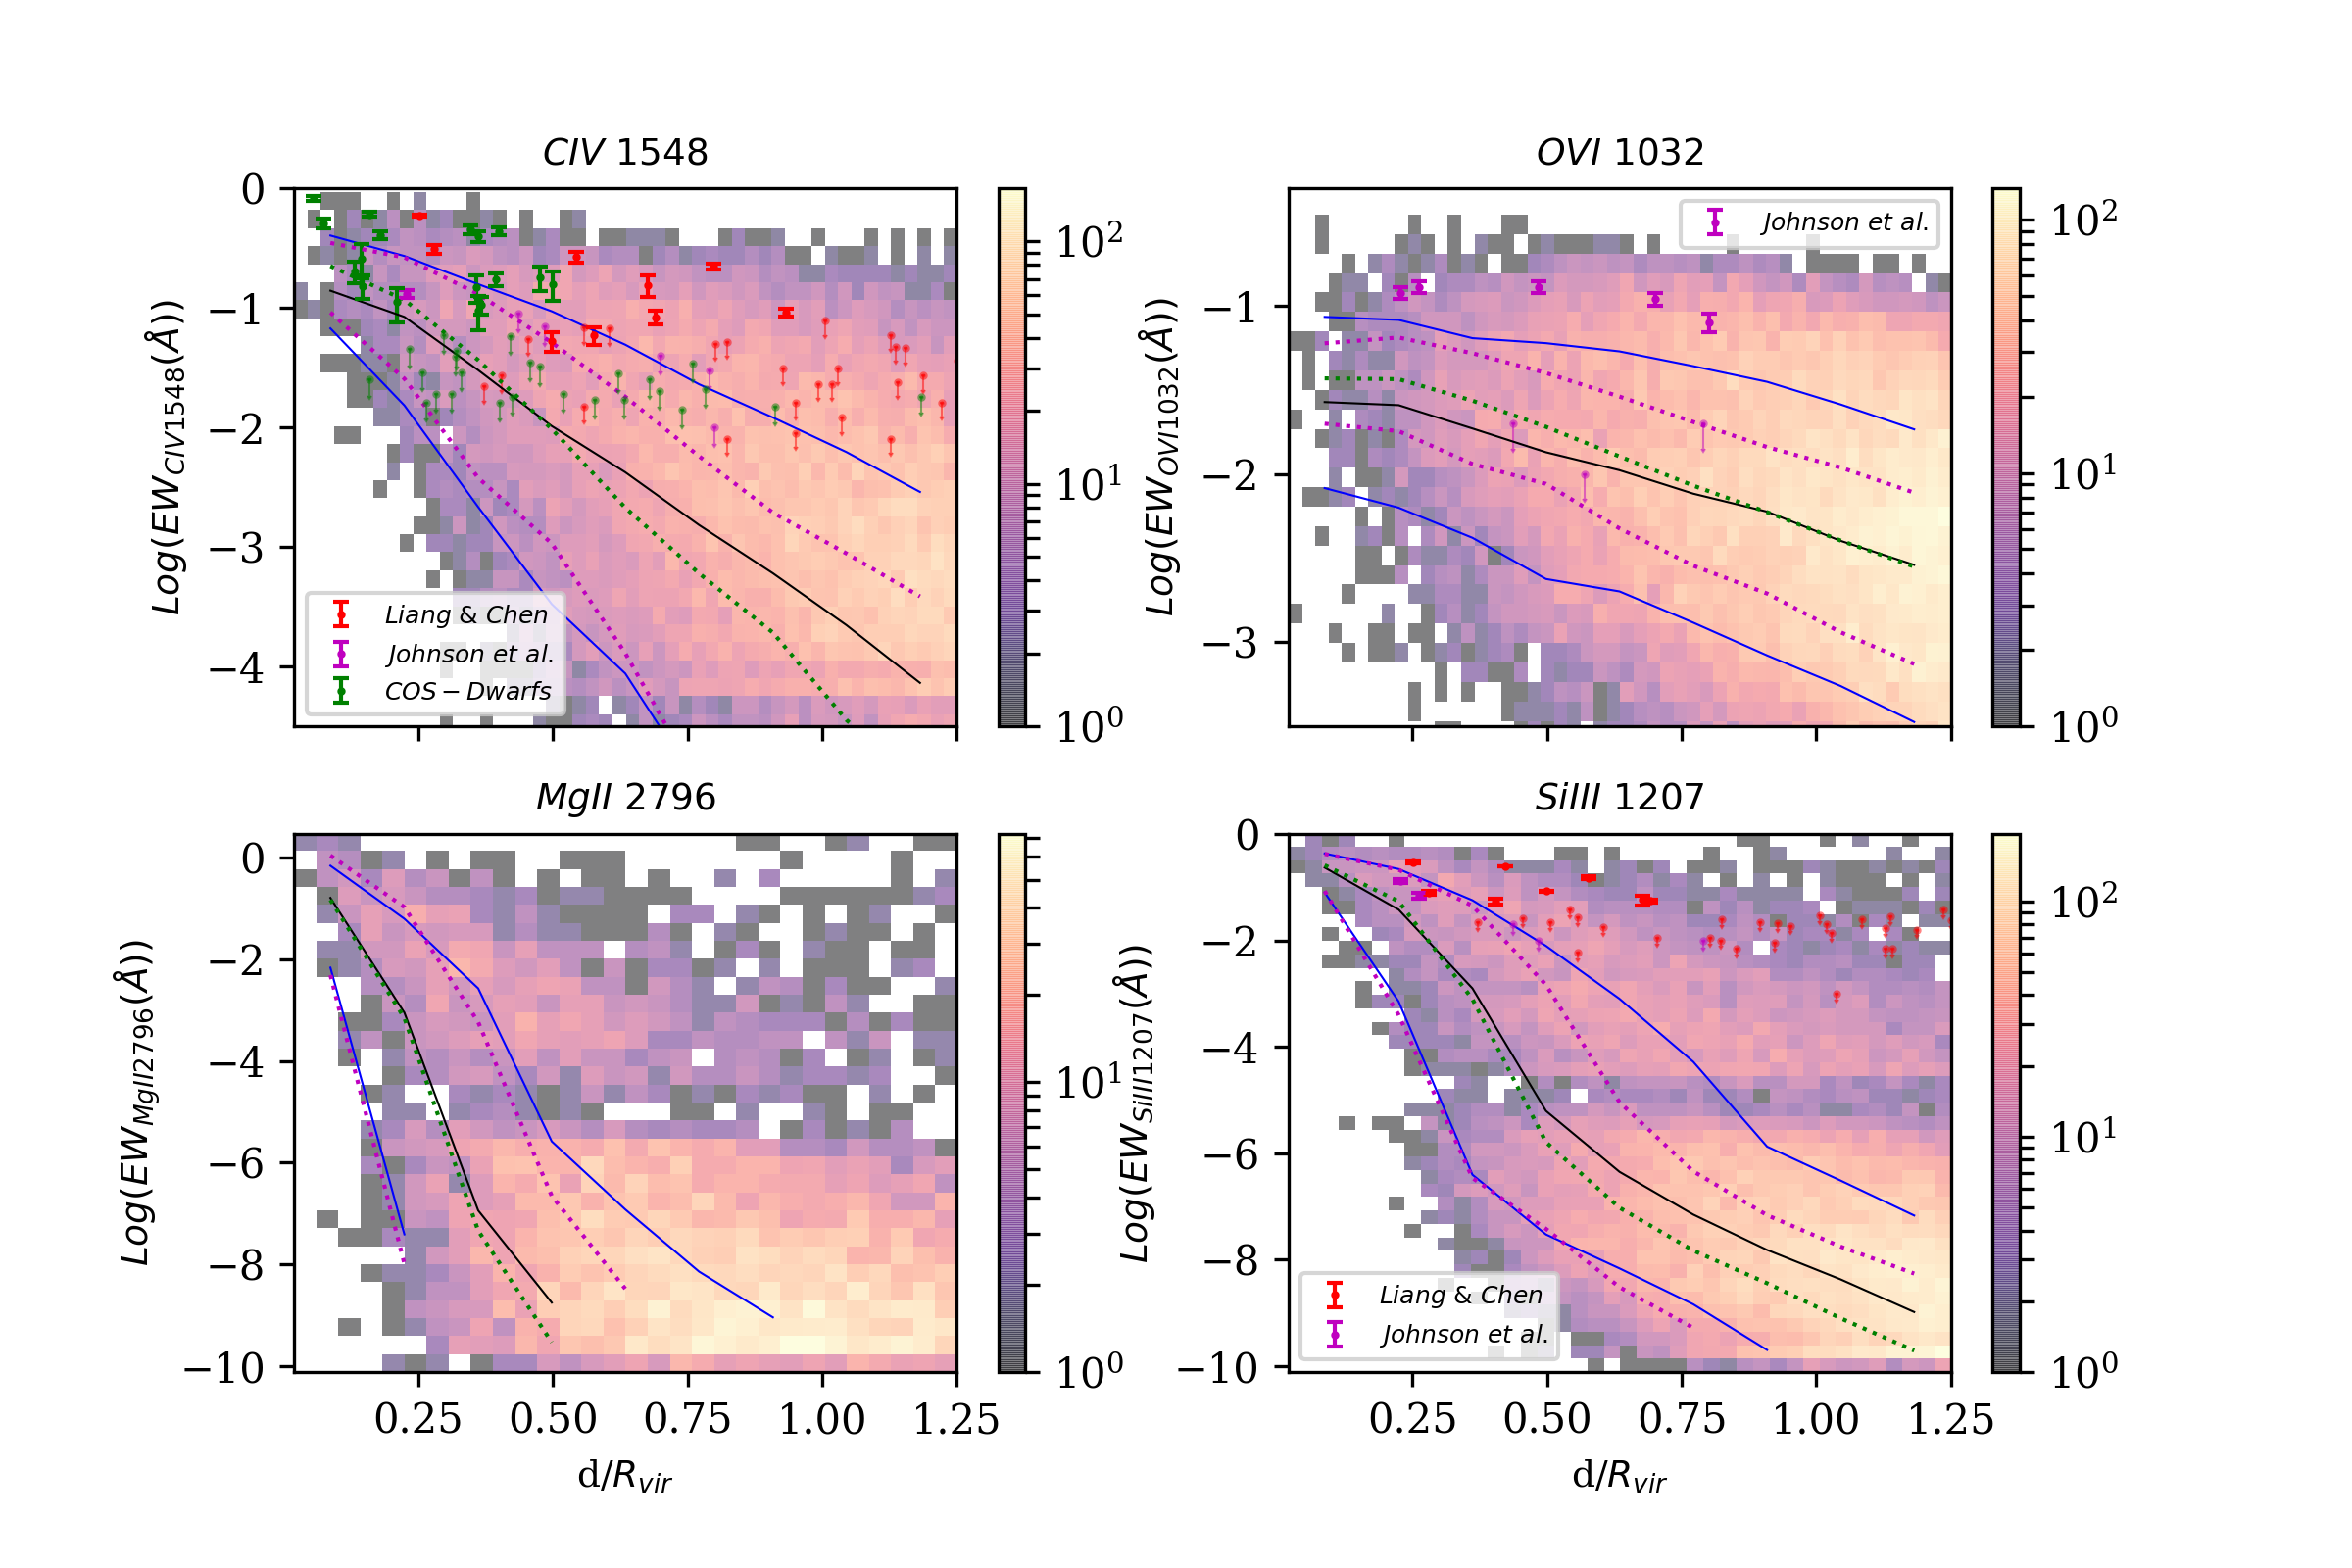
We compare the generated absorption spectra of the four ions in the CGM of the simulation sample to the observations using the measure of EW. In this subsection, we compare the distributions of absorption EW as a function of impact parameter, which is directly measured in observations.
We show the rest-frame equivalent widths of four ions (C iv, O vi, Mg ii and Si iii) as a function of normalized impact parameter in Figure 2, and compare to observational data from Bordoloi et al. (2014), Liang & Chen (2014), and Johnson et al. (2017). The EW from all mock LOS from all 384 dynamically-independent snapshots are shown as 2-D histograms in the background in Figure 2, with the black and blue lines showing the median and 16-84 per cent ( 1 ) values, and available observational data are included in the panels for each ion.
C iv has the highest number of observations among the four ions. Within , of the observations are above the detection limit, and of the simulated sightlines are above the detection limit (100 Å), so the simulated EW – impact parameter distribution for C iv is somewhat low compared to observations. At large radii, the simulation underpredicts the EW by a large factor.
For O vi, there are five detections and three upper limits available from observations. The simulated O vi EW distribution is about a factor of three lower than the observed distribution, since the detections are all above the 84th percentile in the simulations and the upper limits are around the simulated median. Although this could be due to the fact that the galaxies in Johnson et al. (2017) are all star-forming (without available estimates of SFR), and as discussed in Section 4.3, O vi EW increases with SFR.
For Si iii, there are 10 detections available, all at . The detections fall above the predicted median of the simulated EW distribution.
For Mg ii, there is no observational data available for dwarf galaxies to compare against; the prediction from the simulations is that it will be very difficult to detect this ion in absorption.
In general, the EWs of the four ions all decrease with normalized impact parameter () – with shallower fall-off rates for C iv and O vi, and steeper fall-off rates for Si iii and Mg ii, indicating that there is little Mg ii and Si iii in the outer CGM of dwarf galaxies (see Section 4.4.2). In the case of Si iii, it appears that the EW falls off more rapidly with impact parameter in the simulations than it does in the observations. And for all ions, there are wide ranges of possible EW values at high impact parameters. For the two low ionization potential ions, there are significant fractions of LOS with EW consistent with zero 0 Å in the simulations: 96.8% for Mg ii, and 76.0% for Si iii.
There are gaps in the EW distributions of C iv (around Å), Mg ii (around Å), and Si iii (around Å) in Figure 2, which are more clearly seen in Figure 3. The gaps are due to the fact that most CGM gas reside either on the low temperature or high temperature side of the peak in the cooling function, and not at the peak. This is discussed further in the next section.
4.2 CGM Phase Space
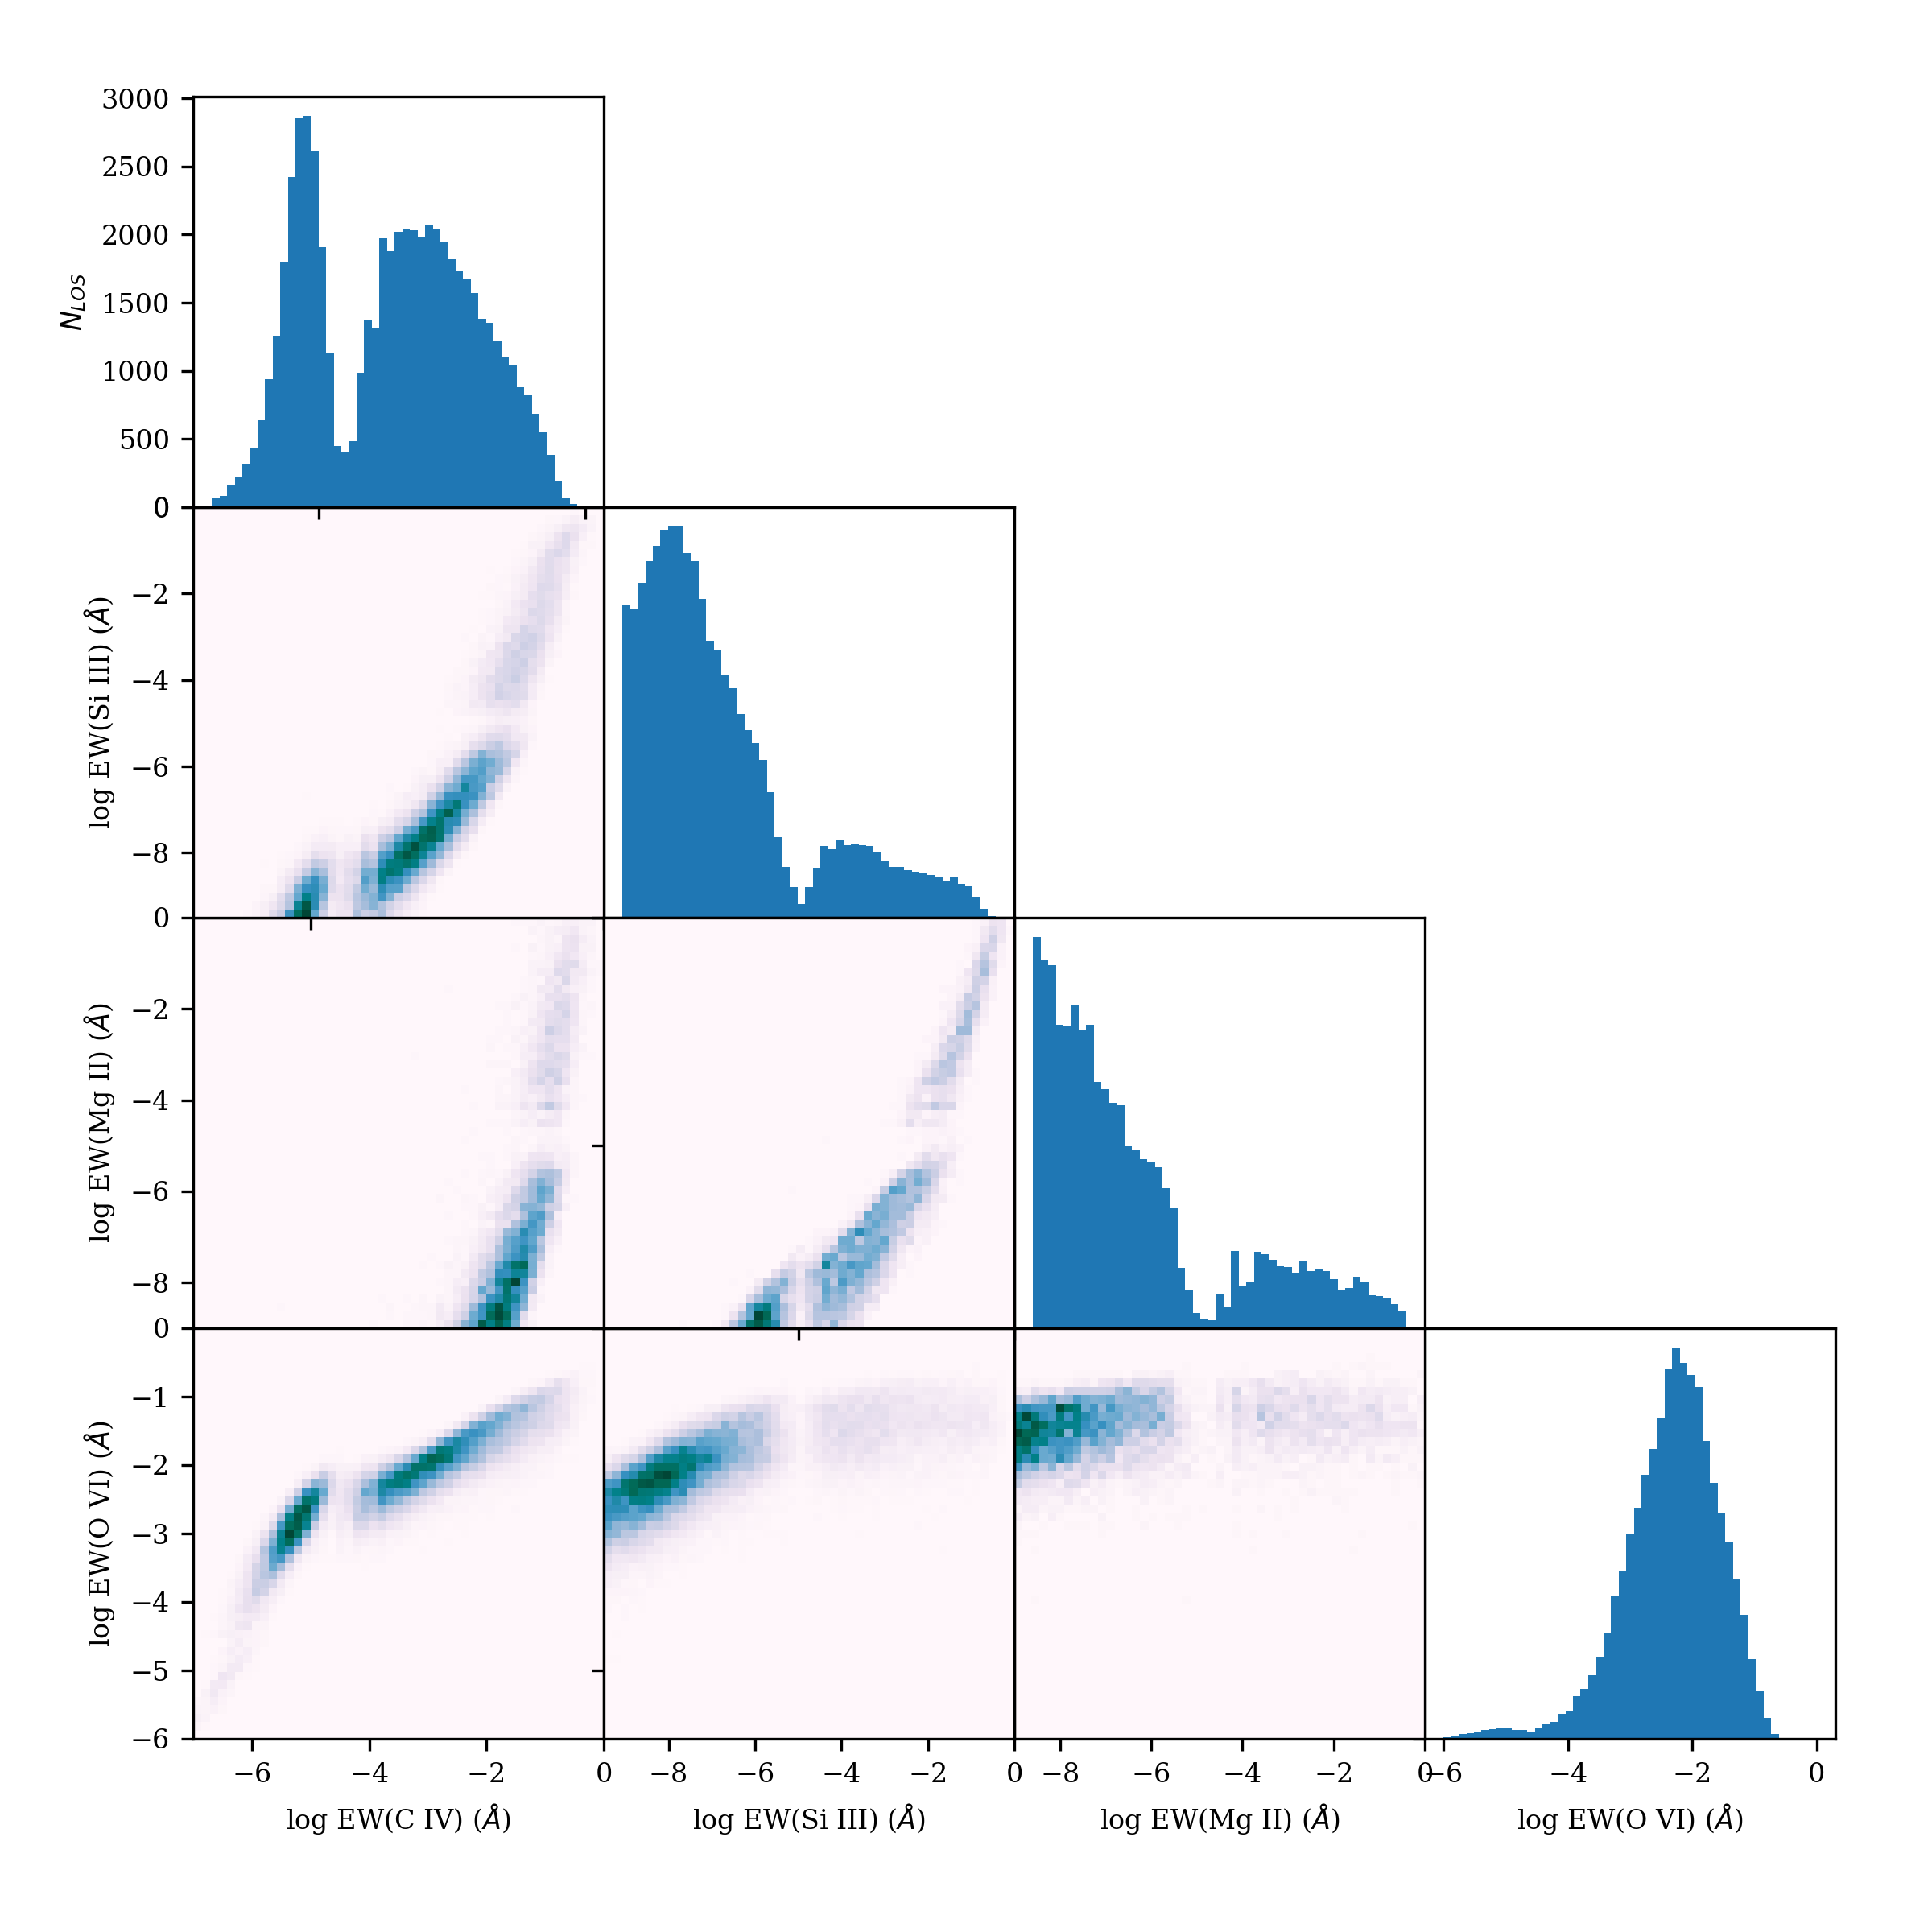
Having generated the absorption spectra of C iv, O vi, Mg ii, and Si iii along identical LOS, we can use them to examine the relationship between the EWs of the ions in the simulations. Figure 3 shows the EW distributions of the four ions from all sightlines produced, and their mutual relationships.
The EW histograms of C iv, Si iii, and Mg ii in Figure 3 display bimodality; in C iv the gap is at Å, in Si iii the gap is at Å, in Mg ii the gap is at Å. We do not see a gap in O vi. The existence of the gaps in the histograms is connected with the multi-modal distributions of the ion temperatures: most of the gas is around , which is likely shock heated and produces the larger EW peaks with higher EW values and higher column densities; The LOS in the lower EW peaks have lower column densities for the corresponding ion compared to the LOS in the higher EW peak, and is associated with gas, which is likely photoionized. This is the effect of the cooling curve which produces a multiphase medium that imprints itself as discrete temperatures and correspondingly discrete ionization fractions per particle. These create the observed multimodalities in the EW distributions. The reason we do not see multimodality in O vi is that the low temperature gas is insufficiently energetic to reach that ionization state.
The off-diagonal plots in Figure 3 show relationships between the EWs of the four ions. There are correlations between some pairs of ions, such as O vi and C iv, Si iii and C iv, and Mg ii and Si iii; and little correlation between O vi and Mg ii, or between Mg ii and C iv. The correlations indicate which pairs of ions probe the same phase of the CGM gas, and this is largely consistent with the difference between their respective ionization energies. For example, in the case of Mg ii (ionization energy of 15 eV) and O vi (ionization energy of 138 eV), any given LOS containing absorption from Mg ii will also have absorption from O vi. Since O vi is located at large galactocentric radii, and Mg ii is located at small galactocentric radii, there is little correlation between the two ions. Note that the O vi is high in EW for all LOS with Mg ii, because of the large path length through the halo at small impact parameters, the latter being the only LOS where the simulations predict significant amounts of Mg ii. We discuss this further in Section 4.4.2.
4.3 Connecting UV Absorption to Global Galactic Properties
| O vi | C iv | Si iii | Mg ii | |
|---|---|---|---|---|
| 0.58 | 0.39 | 0.28 | 0.25 | |
| 0.53 | 0.35 | 0.25 | 0.23 | |
| 0.57 | 0.37 | 0.25 | 0.23 | |
| 0.55 | 0.36 | 0.25 | 0.24 | |
| SFR | 0.51 | 0.36 | 0.26 | 0.23 |
| sSFR | 0.29 | 0.21 | 0.15 | 0.15 |
| 0.15 | -0.05 | -0.16 | -0.13 | |
| -0.31 | -0.41 | -0.46 | -0.37 | |
| 0.00 | -0.02 | -0.05 | 0.02 |
We investigate the relationship between UV absorption in the CGM and a series of global galactic properties. The global properties we examine are , , /, SFR, , and sSFR; the other properties we study are redshift, impact parameter d, and .
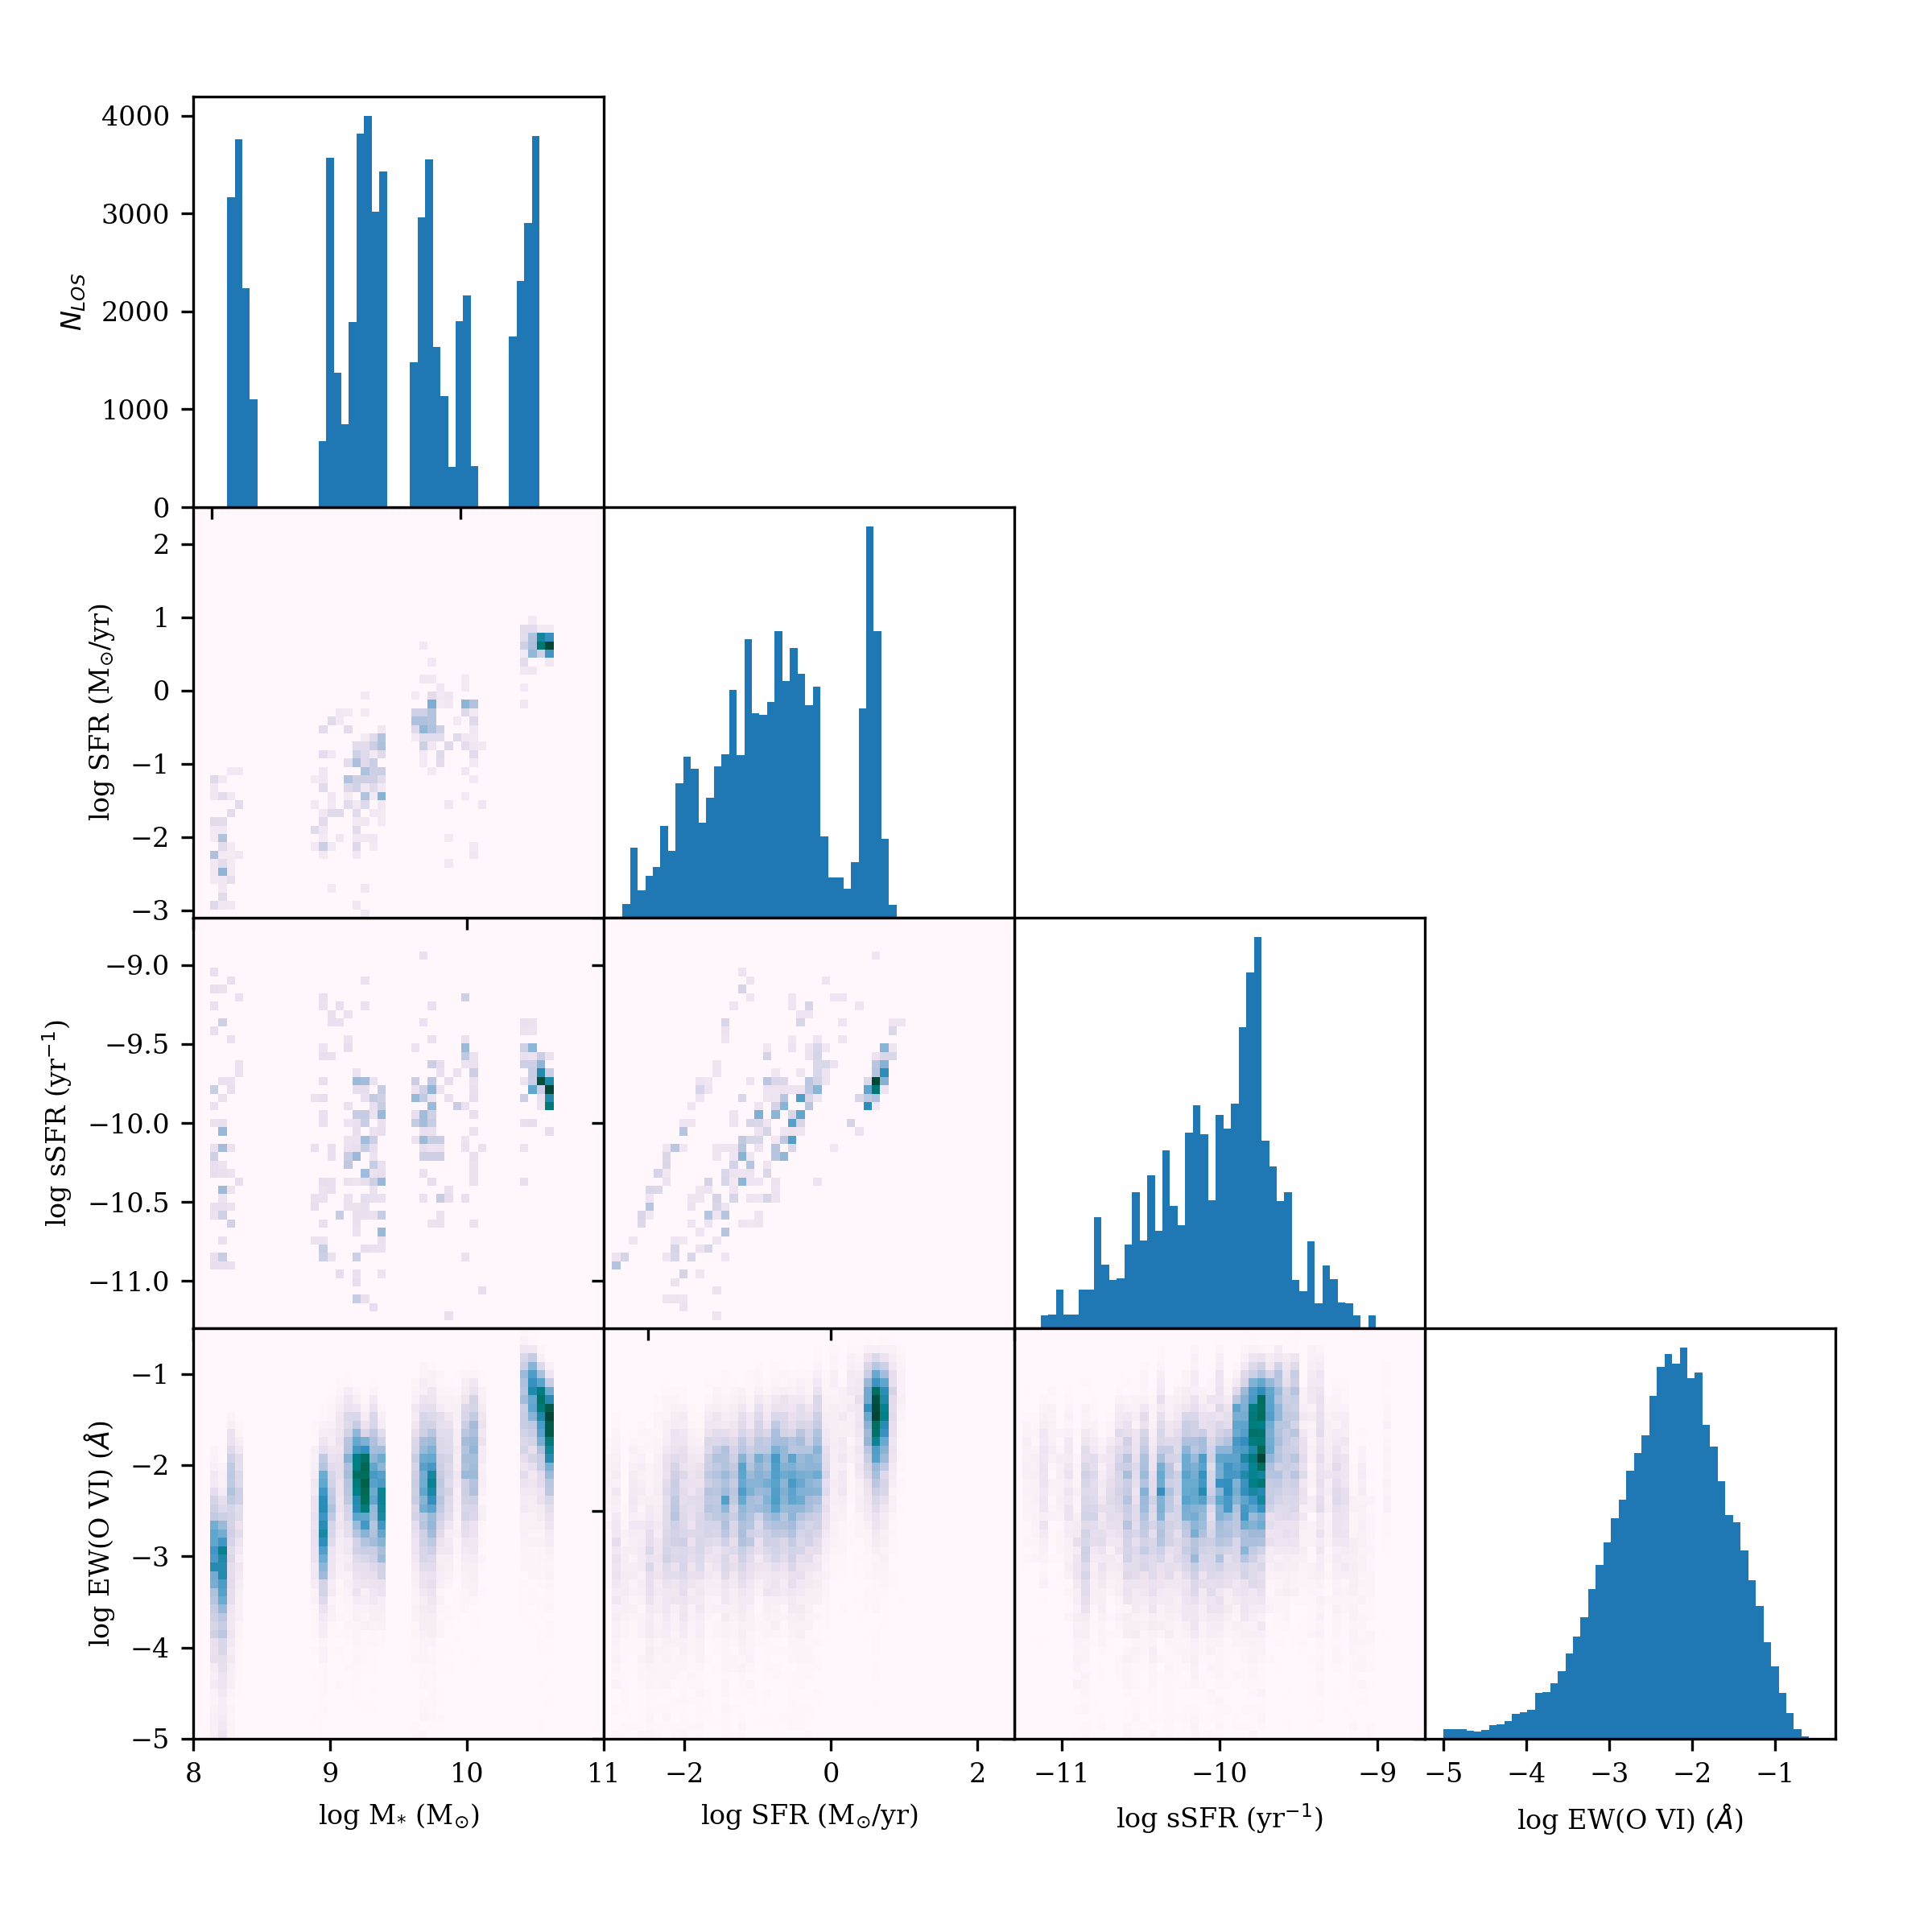
We find that all of the global properties correlate with one another, except for sSFR; and CGM absorption lines correlate with all of the global property correlations, again, except for sSFR. Figure 4 shows the distributions of O vi EW and three selected galactic properties. The bottom off-diagonal panels illustrate that there are strong correlations between O vi EW and two global galactic properties – and SFR; in contrast, there is not any significant trend of O vi EW with sSFR. This is also true for the other ions (C iv, Mg ii, and Si iii) analyzed in this work, although with weaker correlation strengths with decreasing ion ionization potential. In general, The absorption strengths of the ions increase with , , , SFR, and , and decrease with , with the correlation strengths increasing with ion ionization potential. The correlation coefficients between EW and various properties are listed in Table 2.
The CGM absorption has a weak dependence on redshift, sSFR and impact parameter in our analysis. The weak dependence on redshift is not surprising considering that the simulation data in our analysis is in the narrow redshift range of 0 - 0.3. However, it is reasonable to expect that the strength of absorption lines to increase with sSFR – when fixing the of a galaxy, the EW of ions could increase with SFR if the material in the halo is due to star formation related winds. So the lack of correlation of ion absorption with host galaxy sSFR is at first glance puzzling. We checked the variation of SFR over time, and it appears to occur in short bursts (Muratov et al., 2015; Anglés-Alcázar et al., 2017), so the material in the halo is not due to steady winds. It seems likely that the material in the halo was put in place by earlier star bursts. This is consistent with a particle tracking analysis (Hafen et al., 2019b, more on this in Section 5.1). Consequently, on closer examination, the lack of correlation between sSFR and material in the halo is not that surprising.

To further study the relationship between the global properties and the absorption strengths of the ions, we perform a principal component analysis on the data. Figure 5 shows the first four principle components which capture 98.2% of the variance of the data when projected into a 7-dimensional space. The first principle component (labeled ‘PC 0’ on the figure), which accounts for 62% of the variance, shows that the three global galaxy properties (halo mass, stellar mass, and star formation rate) and the ion absorption strengths are all correlated. This component may be interpreted as indicating that more massive halos (and hence more massive galaxies) contain more gas, which in turn produce stronger ionic absorption. The second principle component (‘PC 1’), which accounts for 23% of the variance, shows that the absorption strengths are anti-correlated with all three global galaxy properties, with lower ionization state ions being more strongly anti-correlated with the galaxy properties. We interpret this component as an indicator of the temperature of the CGM; higher mass halos have higher virial temperatures, hence fewer low ionization ions compared to lower mass (and temperature) halos. The third principle component (‘PC 2’) shows that while the absorption strength of three ions are anti-correlated with SFR, Mg ii is correlated with SFR. This component, which accounts for 7%, may be an indicator of the stronger winds from feedback associated with star formation.
4.4 Physical Distribution of the CGM gas
We investigate the geometry of the ionized gas probed by the absorption lines simulated, and the physics that underlies its distribution.
4.4.1 Spatial distribution of C iv absorption
We compare the 1-D radial distribution of C iv absorption EWs in our sample to the proposed profile in Bordoloi et al. (2014):
| (1) |
where and are two free parameters describing absorption and radial scaling. The best-fit values obtained by Bordoloi et al. (2014) from a maximum likelihood fit are and Å.
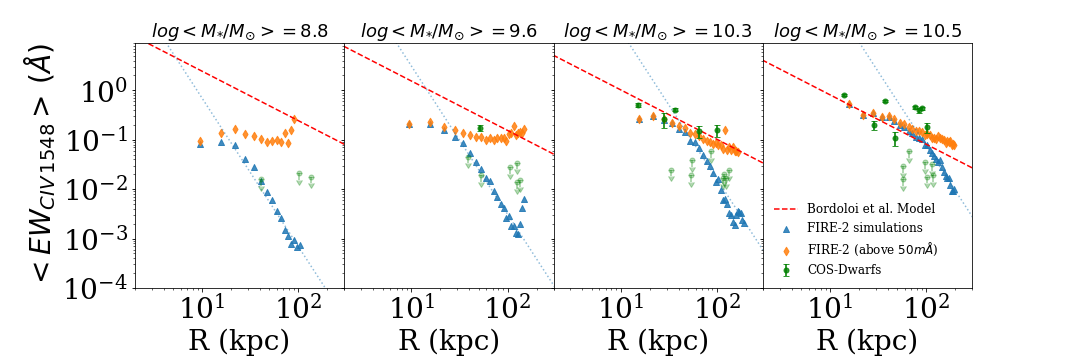
In Figure 6, we divide our sample into 4 bins, roughly equivalent to halo mass, which enables direct comparison with Bordoloi et al. (2014). We then bin our data radially, and calculate the average C iv absorption EW in each bin. To account for the effect of the detection limit in the COS-Dwarfs Survey, we repeat the calculation with a detection limit of 50 mÅ, the lowest detection limit in the COS-Dwarfs survey. The resulting radial profiles are plotted in Figure 6, along with the observational data and the proposed profile from Bordoloi et al. (2014).
The C iv absorption EW profiles derived from our simulations do not agree with the proposed profile in Bordoloi et al. (2014) in slope, parameterization, and trend with : the FIRE profiles fall off more steeply with radii (the simulated C iv EW profile follows a power law beyond the inner core regions), which means that the C iv ion is more concentrated towards the centre of the halo in the simulations; Equation 1 suggests that C iv absorption EW decreases with , while C iv absorption EW increases with in the simulated sample, and the correlation coefficient between C iv absorption EW and in the simulated sample is 0.36.
The conflict between the simulated profile of the C iv EW and the modelling in Bordoloi et al. (2014) is, we suggest, due to the detection limit bias. The proposed profile in Bordoloi et al. (2014) is based on a limited sample with 17 detections in total, with no detections beyond 100 kpc, and the two lower bins are not well constrained with only one detection. The fact that the C iv EW profile for sightlines above 50 mÅ in simulations agree well with both the COS-Dwarf observations and the best-fit model from Bordoloi et al. (2014) for the two largest bins suggests that this inferred profile is due to the detection limit bias in observations.
4.4.2 Physical Distribution of Ions and Metals in the CGM
We examine the physical distribution of the ions and metals in the CGM based on the covering fractions and column densities of the ions.
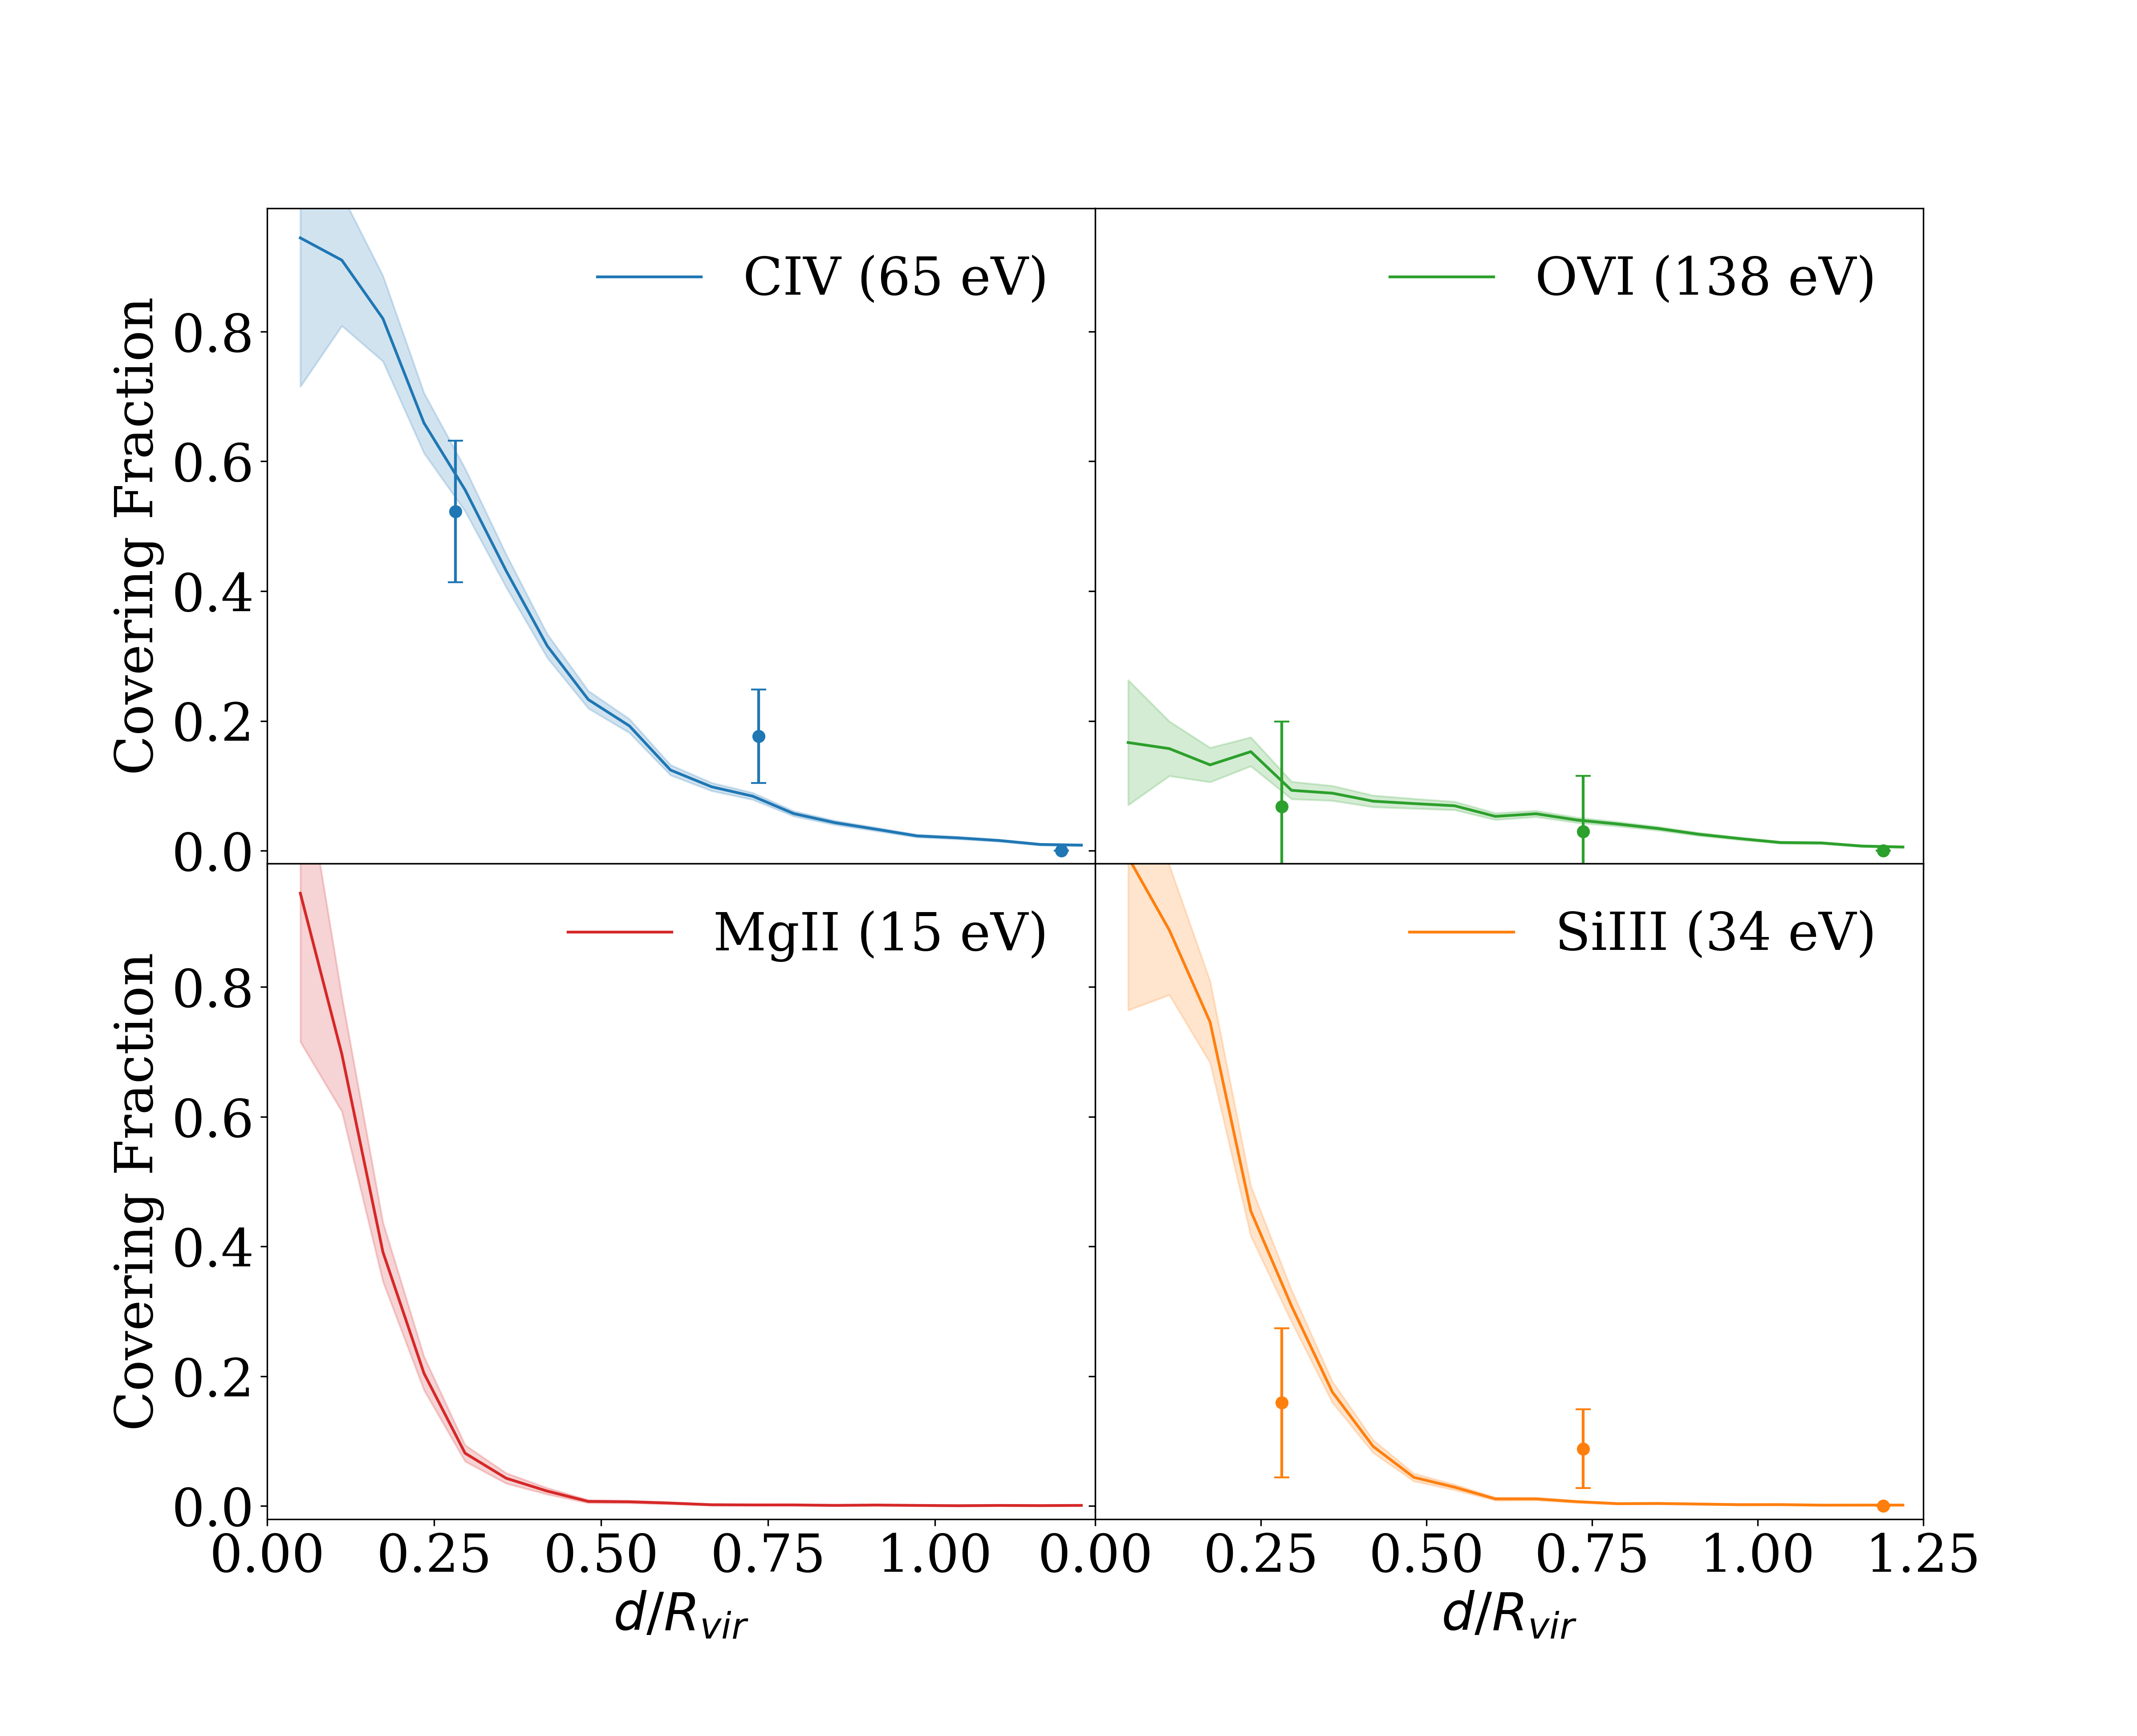
The covering fraction of each given ion was calculated using the following formula:
| (2) |
where is the number of LOS with absorbers with EW greater than the cutoff EW () within an impact parameter , while is the total number of LOS that we sample in the same region.
Figure 7 shows the covering fractions of C iv, Si iii and Mg ii above 50 mÅ , and of O vi above 80 mÅ , compared with the observations (Bordoloi et al., 2014; Liang & Chen, 2014; Johnson et al., 2017). The thresholds are chosen to match the lowest detection limits of the ions. The covering fractions from the simulated sample are in agreement with the results from observations.
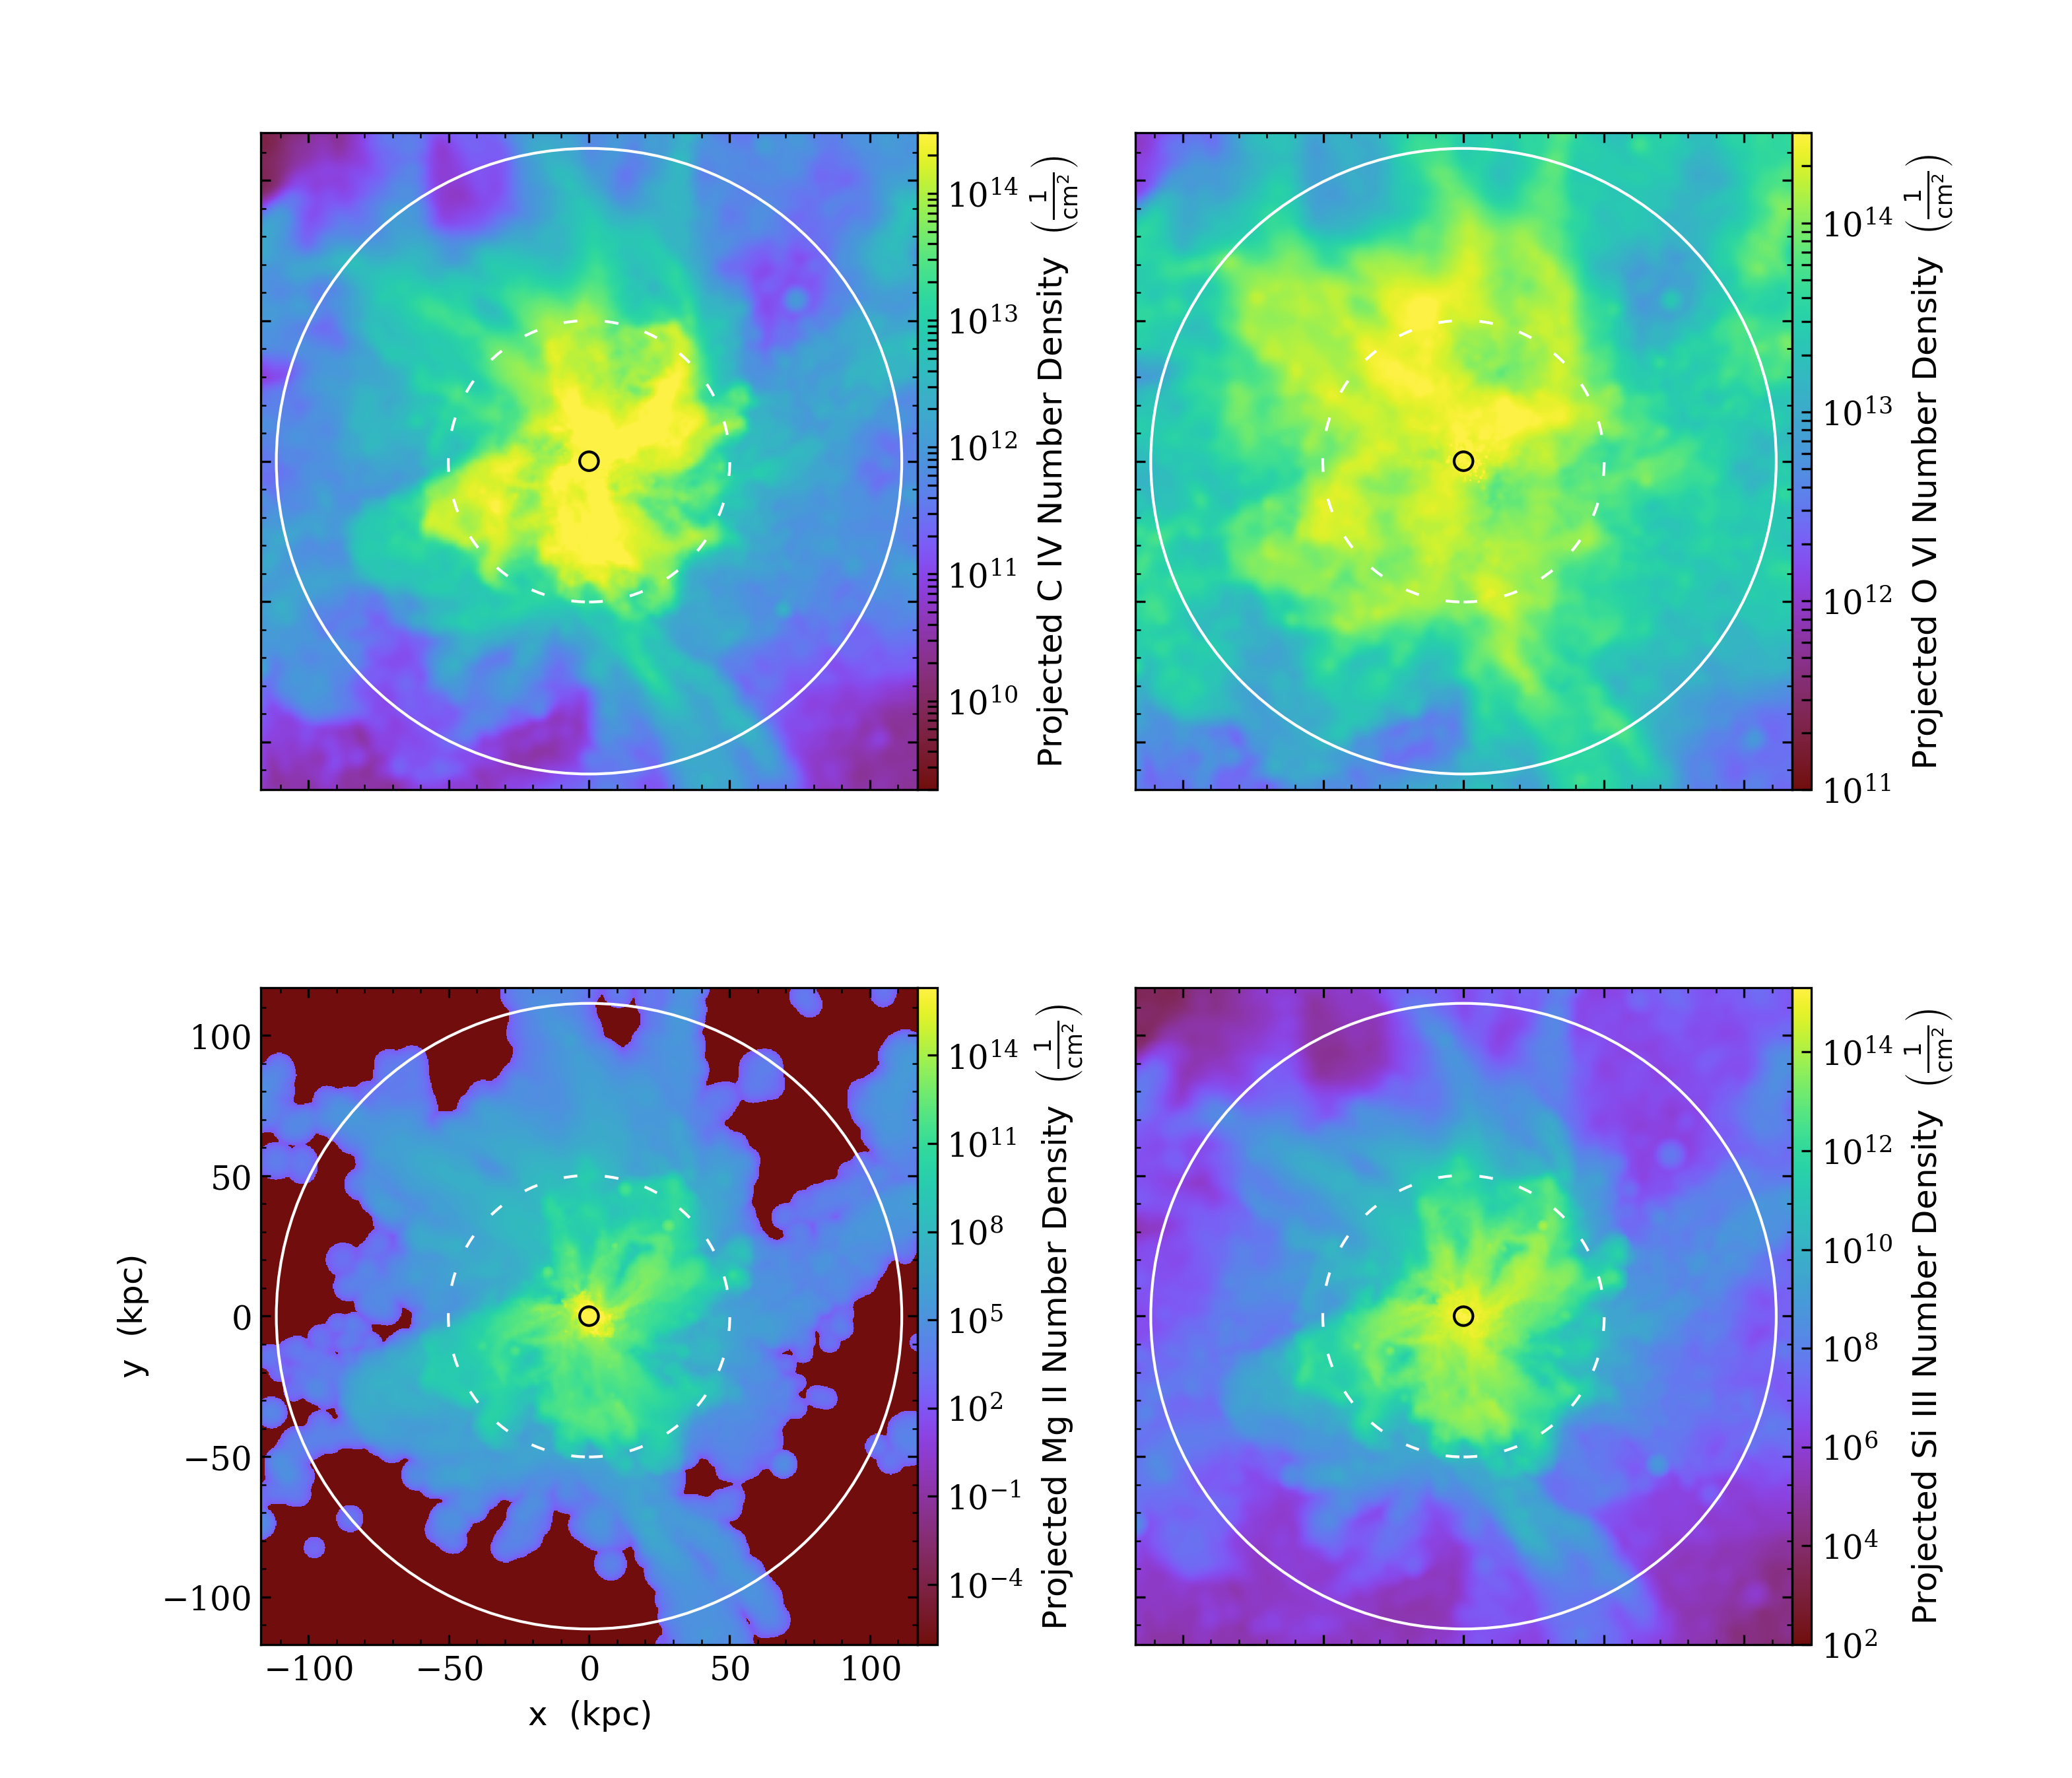
We can also analyze the column densities of the ions directly in the simulations. The column density maps of the ions are shown in Figure 8. The three circles shown in the maps are the stellar mass radius, the boundary between the inner and the outer parts of the CGM (0.45 which we identify as the edge of the wind-dominated regime), and the virial radius. We arrived at this definition for the inner most radius as follows: we plotted the cumulative stellar mass inside the virial radius of the main halo. In all the halos, we saw a sharp break in the cumulative mass function at around of the total stellar mass in the halo. We call this the stellar mass radius, and we use this as the boundary between the ISM and the CGM.
The column densities of the ions are different in the three regions: for C iv, the ISM has the highest column density, the inner part of the CGM shows a lower column density compared with the ISM, and the outer CGM has the lowest column density; Mg ii and Si iii show similar trend as C iv, except that the column densities of the low ions show more drastic decreases in the outer CGM; O vi has similar column densities in all three regions.
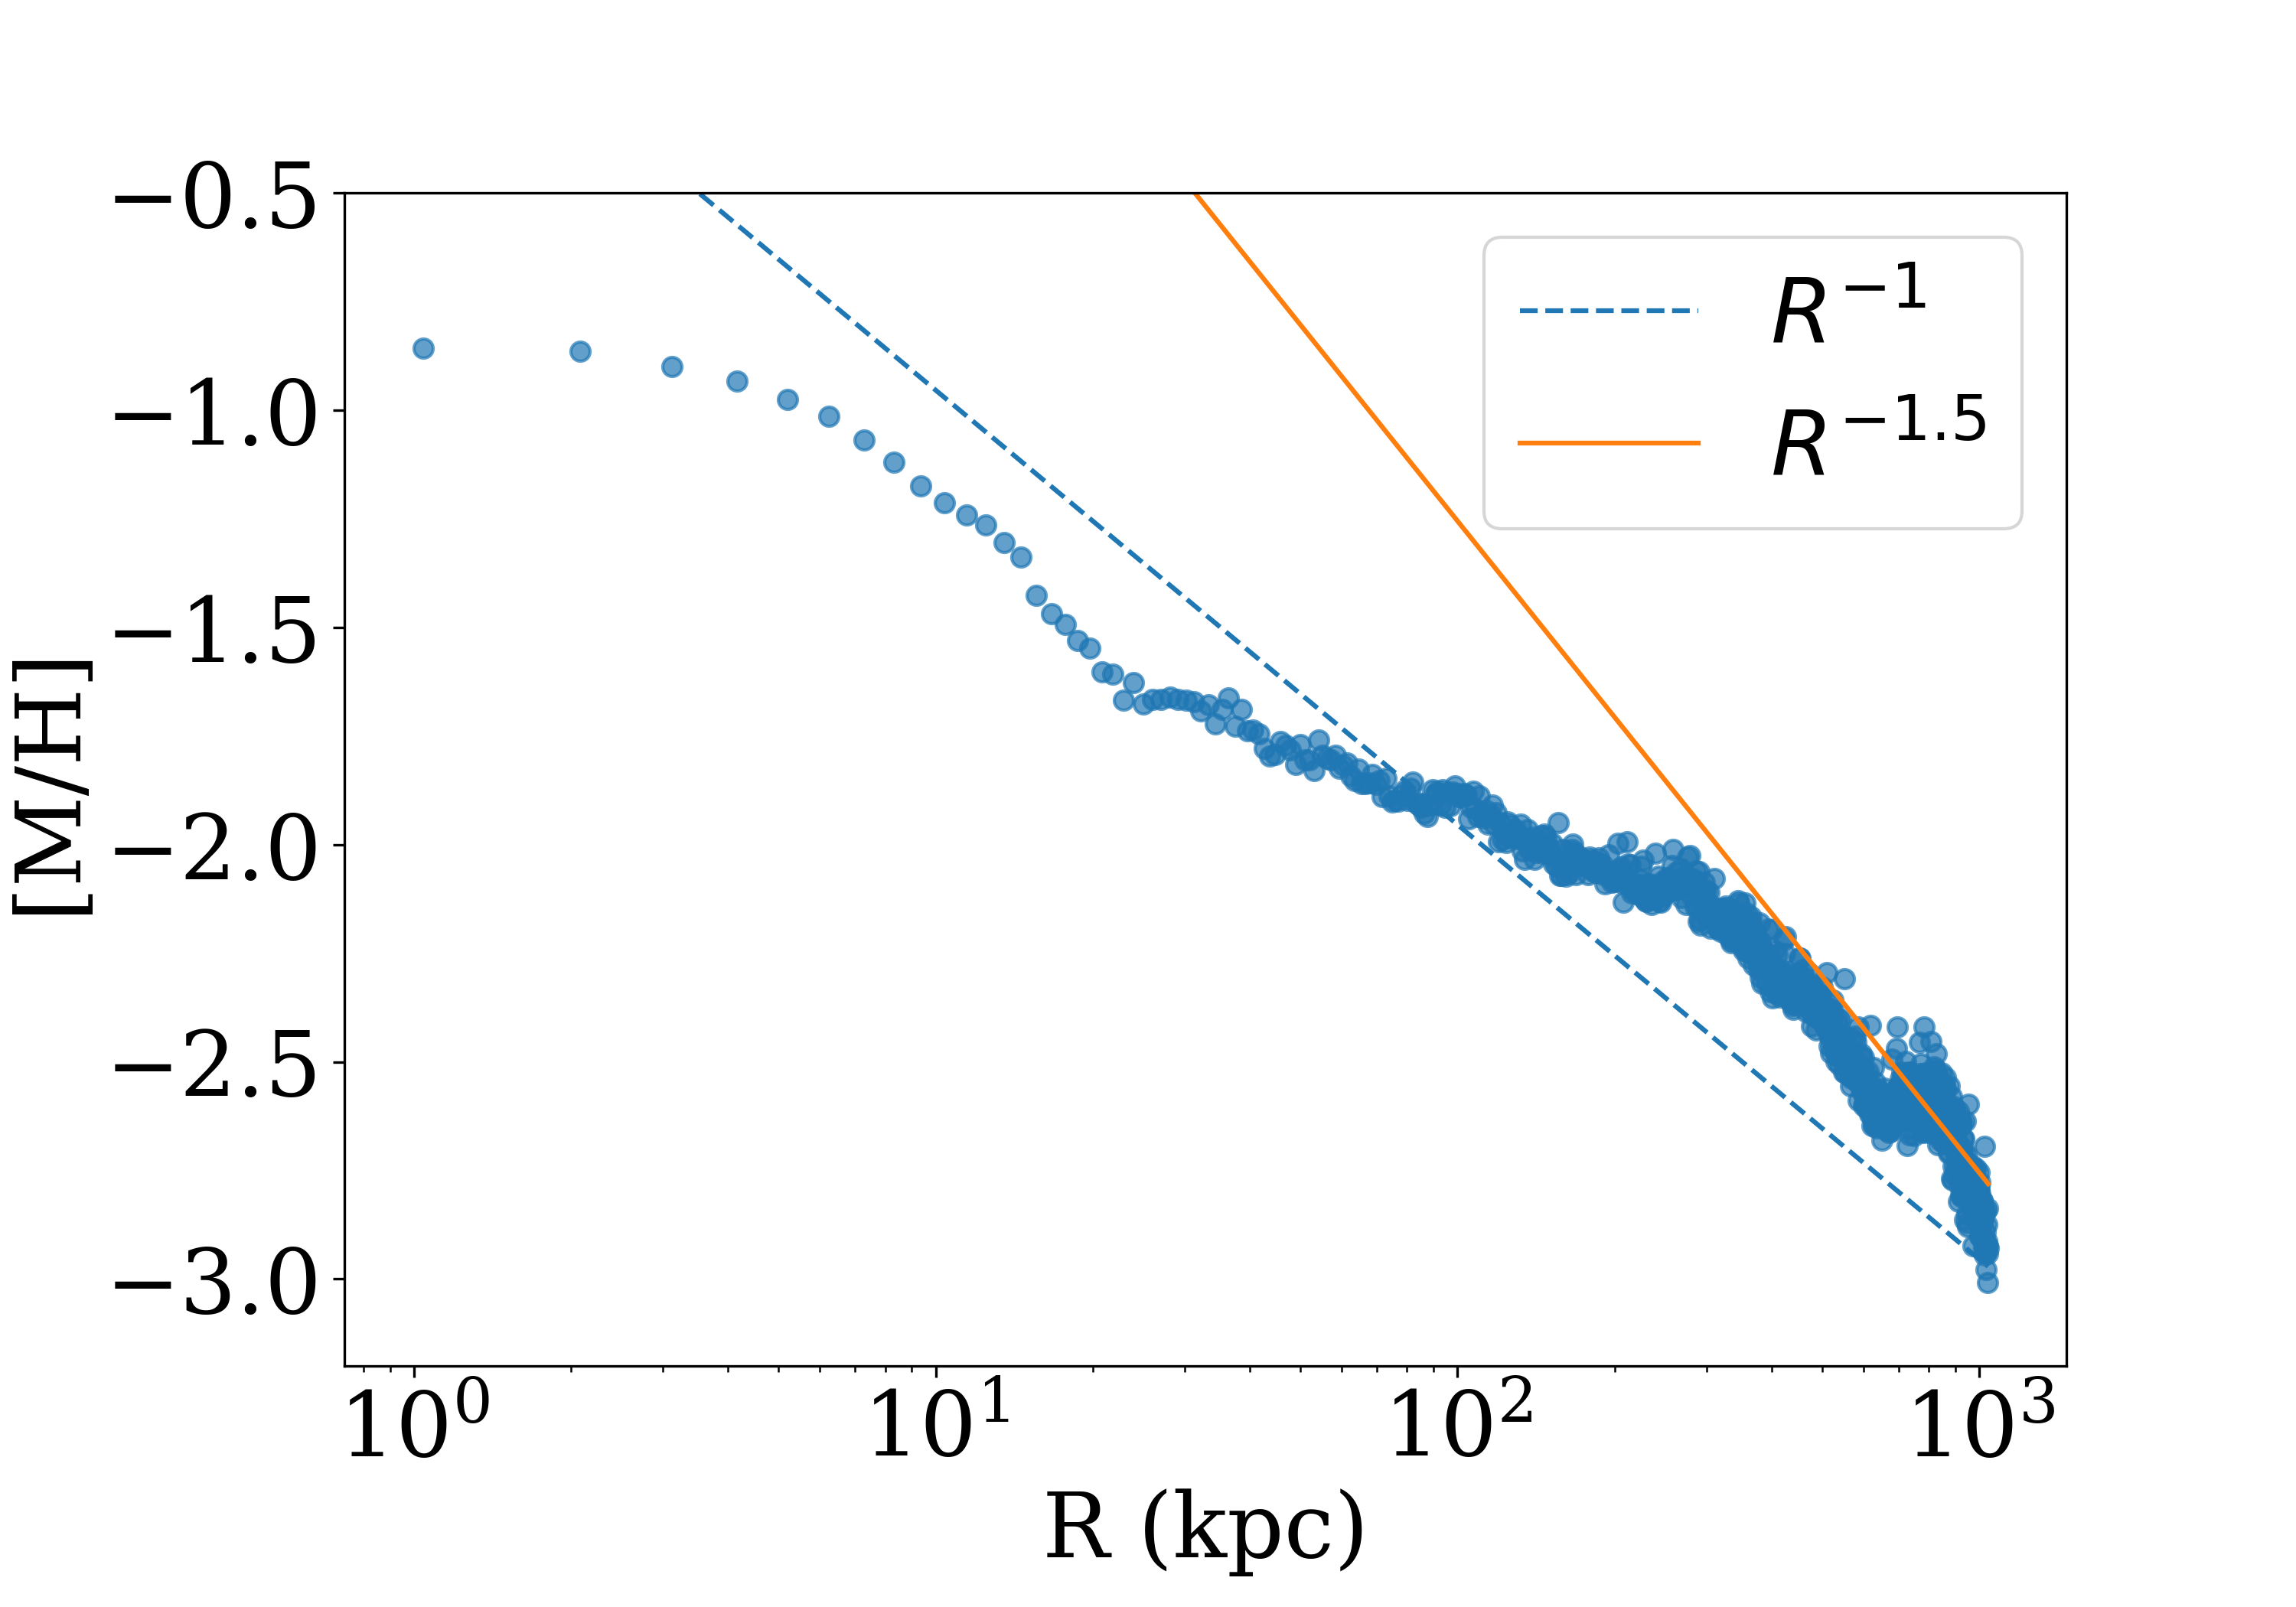
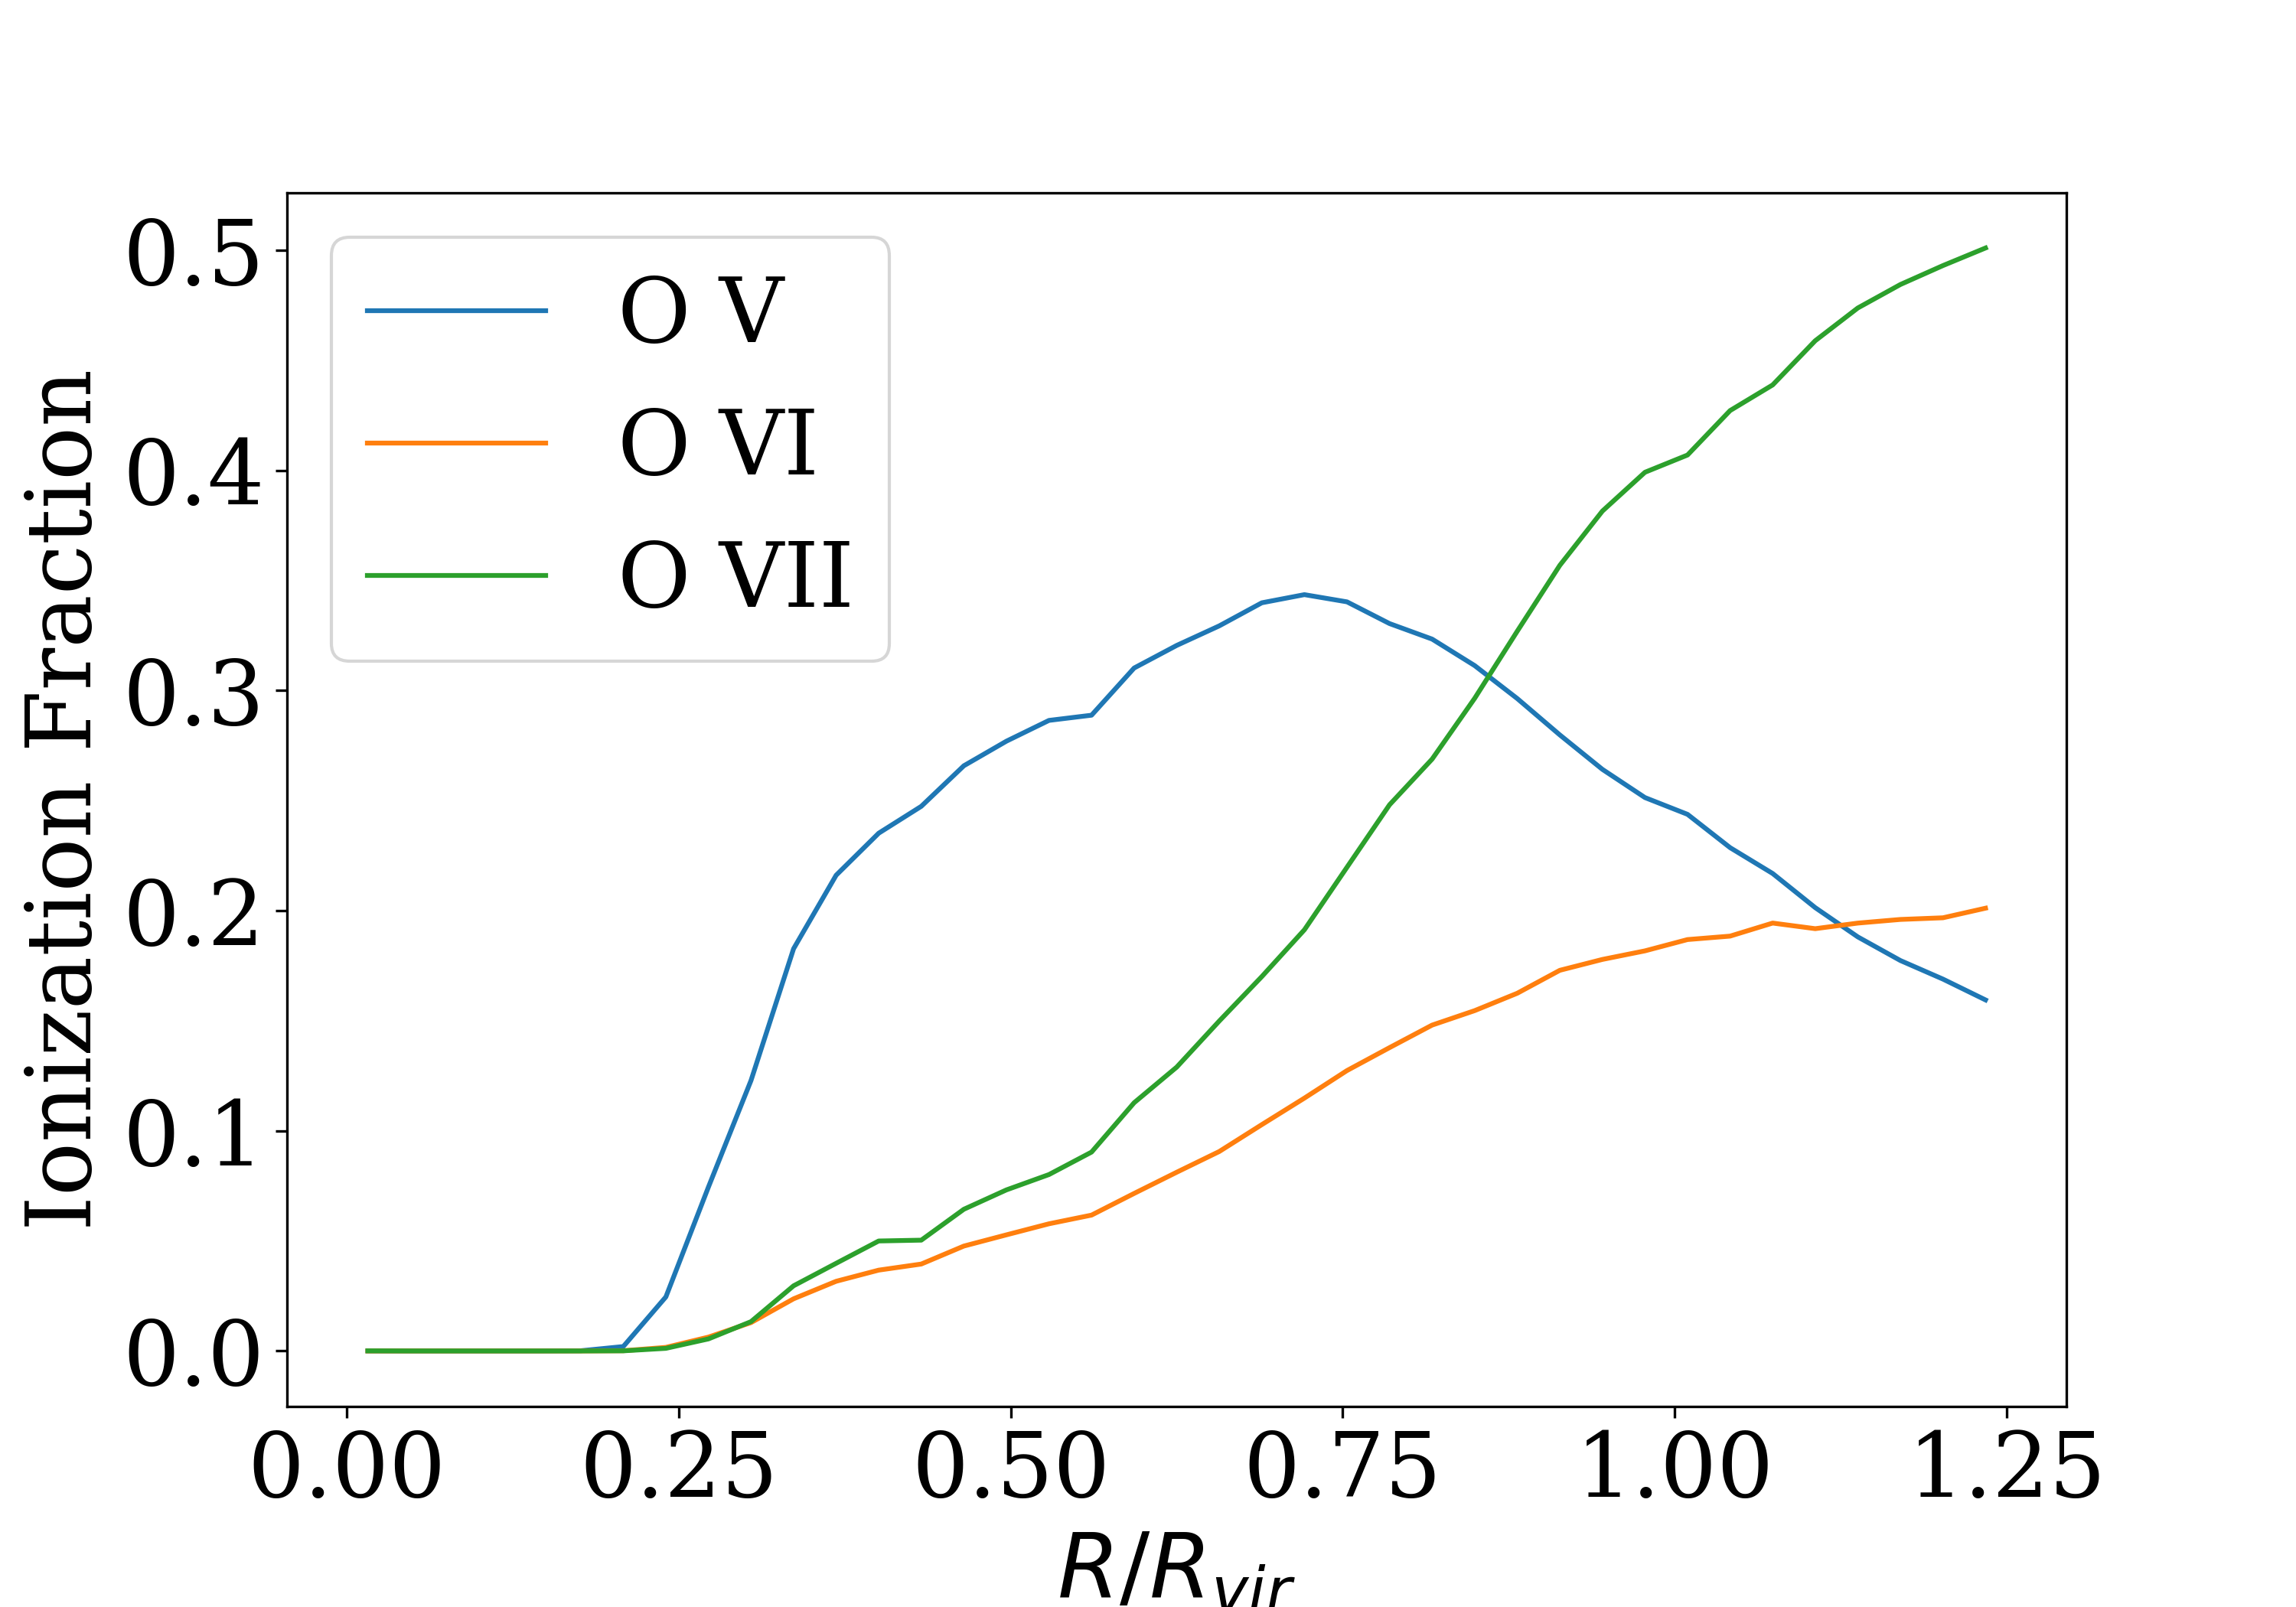
The roughly constant column density of O vi is consistent with the roughly constant cover factor that we see in Figure 7. Why does O vi behave so differently than the other ions that we study? Figure 9 shows the run of metallicity with radius; it decreases roughly as a power law with radius. Since both the density (not shown) and metallicity drop off with increasing radius, one might expect the O vi column density would drop off with radius as well. However, Figure 10 shows the three dominant ionization states of oxygen as a function of radius in a simulation snapshot (‘m11b’, z=0.061), demonstrating that the ionization fracgtion of O vi increases with radius. Recalling that the column density is the product of the ion O vi fraction times the density times the metallicity times the pathlength, the rapid increase in the O vi ionization fraction is largely responsible for the relatively flat run of column density at large impact parameter in the O vi panel in Figure 8.
As confirmation of this interpretation, we have examined the run of the C iv fraction (not shown) which, in contrast to the run of O vi, decreases with increasing radius.
We see a boundary in the column densities of the ions at 0.45 , which appears to separate an “inner” and “outer” region in the CGM. This is consistent with the location where the fraction of the total CGM mass contributed by wind and by IGM accretion is equal for halos in FIRE-2 simulations (Hafen et al., 2019b).
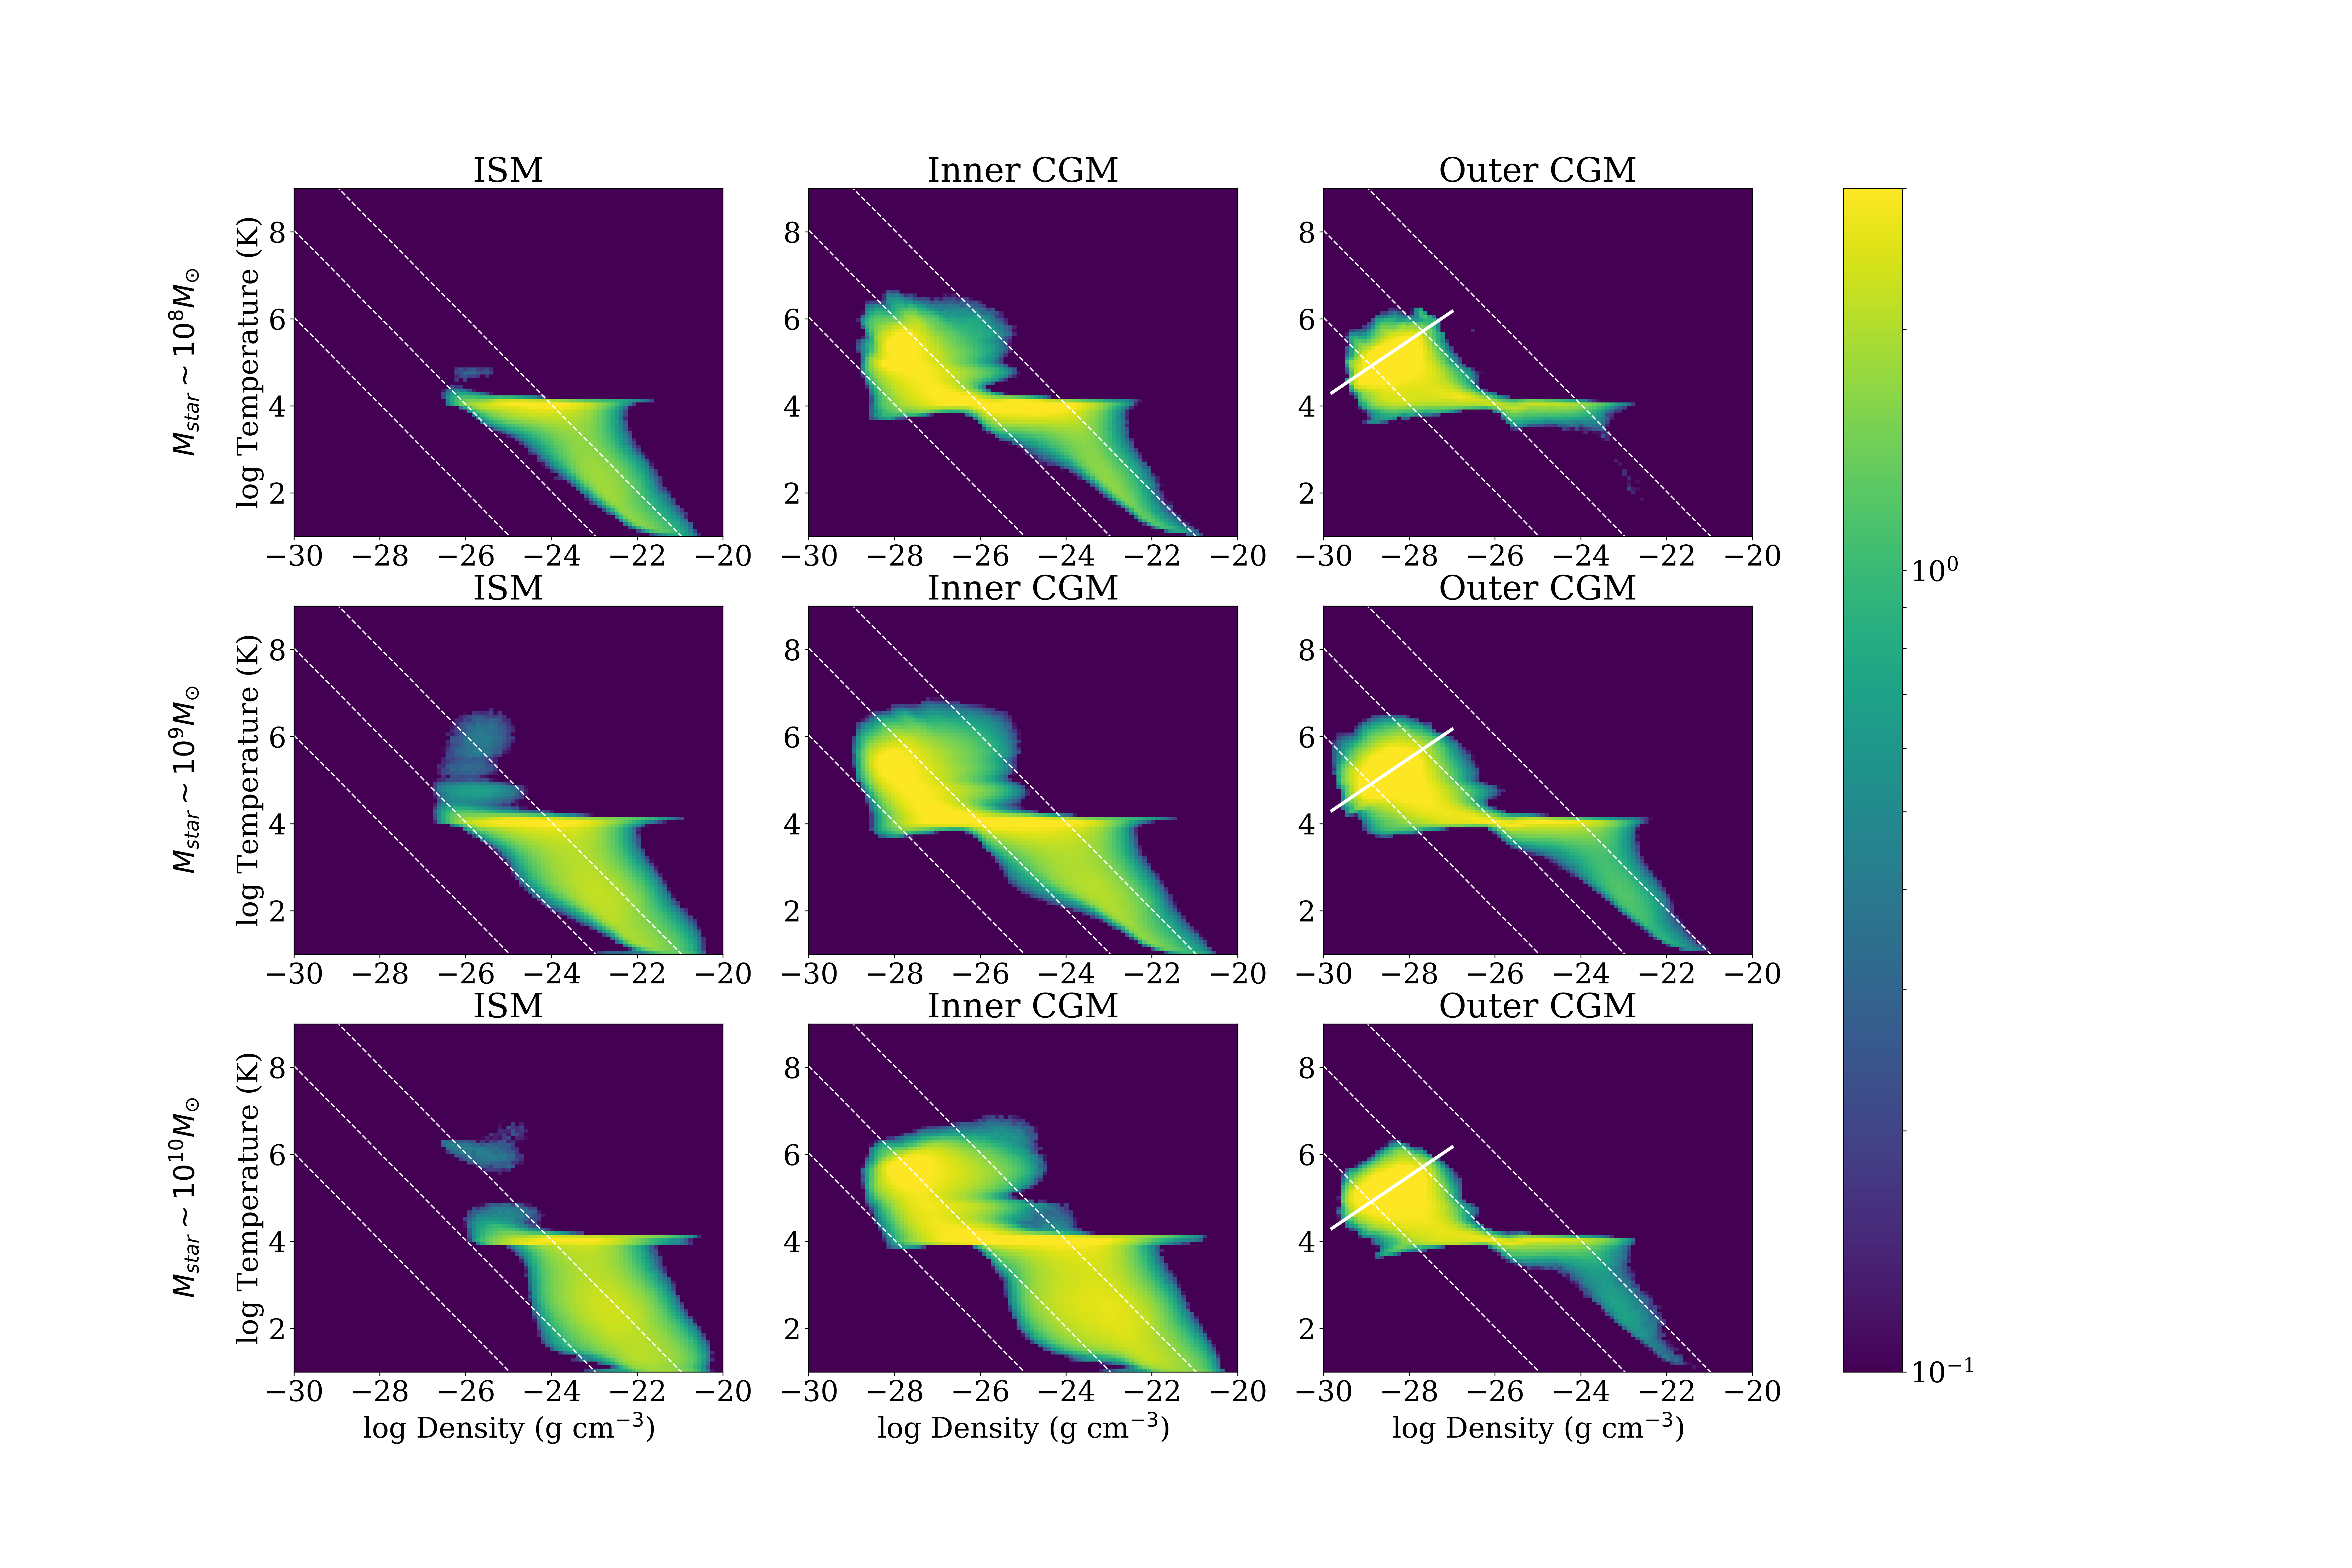
The density – temperature diagrams for gas in the three regions (disky ISM, inner CGM and outer CGM) are shown in Figure 11 in three stellar mass bins. The gas in these three regions resides in different places in the phase diagram: the ISM gas is cold and dense compared to gas in the inner and outer CGM. The outer CGM follows the adiabats () indicated by the white lines, while the inner CGM and ISM do not. This indicates different energetic states between the three regions, which may be the result of the different origins of the gas in these regions (Hafen et al., 2019b).
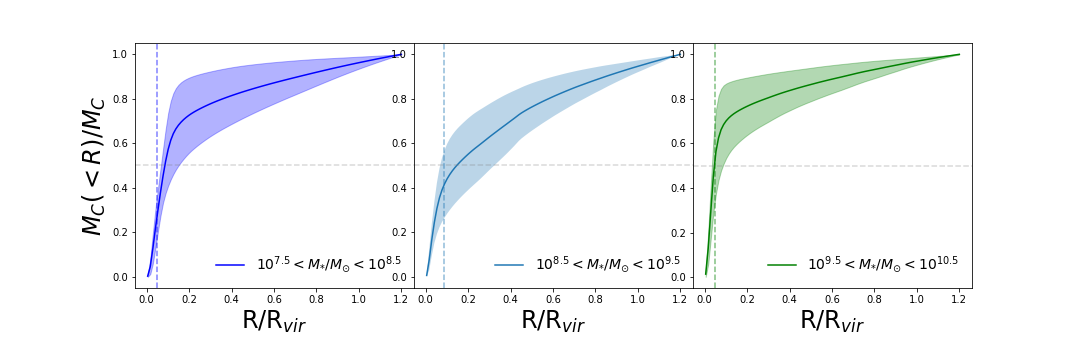
We can compare the simulated carbon mass fraction to those inferred from observations. The cumulative carbon mass distribution of the simulated sample is shown in Figure 12 in three mass bins. We use the 80% stellar mass radius as the boundary between the ISM and CGM, as discussed earlier. For all three stellar mass bins, the carbon mass in the CGM is larger than or comparable to the carbon mass in the ISM, which is in agreement with the estimates in Bordoloi et al. (2014). We also note that as the stellar mass of the galaxy decreases, a larger fraction of the carbon resides in the CGM of the simulated sample.
4.5 Dynamics of the CGM
Throughout this paper, we have mostly focused on accounting for the mass budget of the multiphase CGM. However, the structure and composition of the CGM are directly related to its dynamics, which is critical to understanding how the CGM fuels the star-forming regions of dwarf galaxies. In this subsection, we examine how the composition of the CGM relates to its dynamics. Specifically, recent analytic models (e.g., Mathews & Prochaska, 2017; McQuinn & Werk, 2018; Faerman et al., 2019) assume that the CGM of galaxies is in hydrostatic equilibrium (HSE) or near HSE with a net inflow (Stern et al., 2019). Here we test whether the CGM of the simulated dwarf galaxies deviates from HSE by comparing gas pressure gradients to gravitational force.
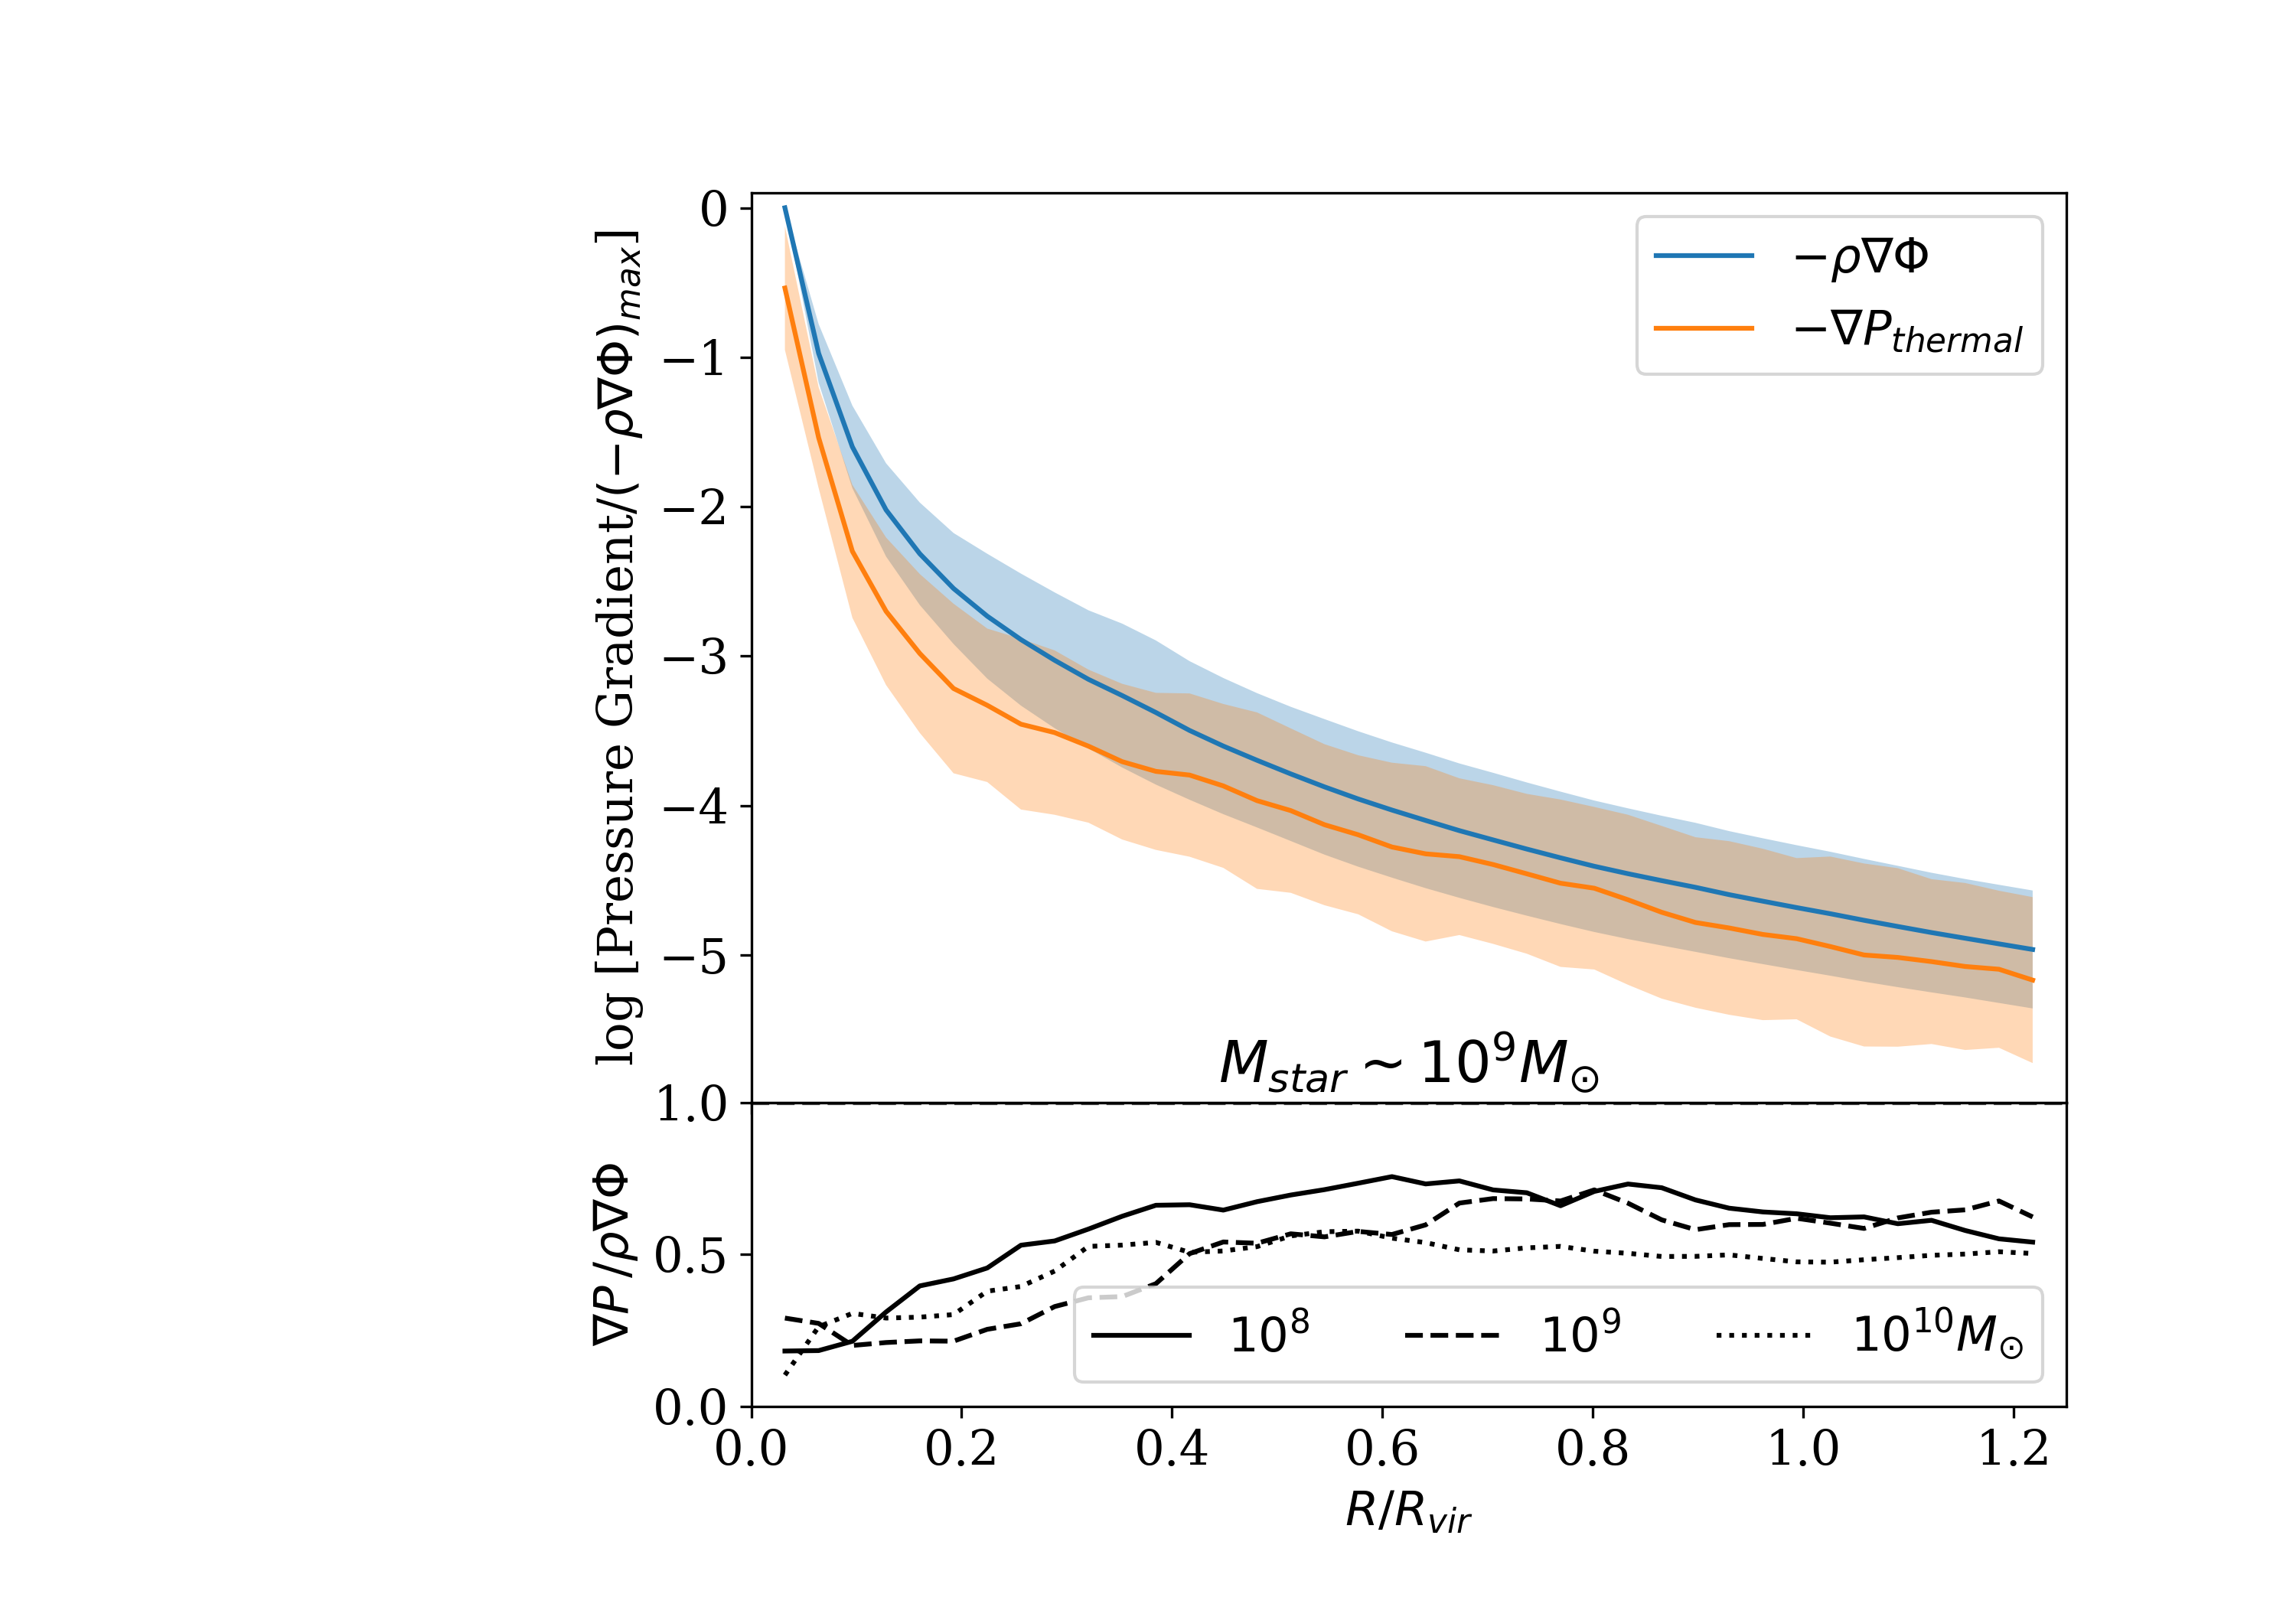
We show the gas thermal pressure gradient () and the gravitational force () as a function of galacto-centric radius in the top panel of Figure 13. The profiles are calculated by volume averaging the density and pressure over spherical shells centered at 40 values of . The thermal pressure gradient is calculated by dividing the pressure difference between adjacent shells by the distance between them. The bottom panel of Figure 13 shows the ratio of to . The ratio ranges from 0.5 (for ) to 0.7 (for ) for , so the gas is nearly but not quite in HSE. At smaller radii, the ratio is smaller. This is consistent with the findings in Stern (2020), who find that in halos with same mass as those we study, only gas at larger radii is in HSE supported by thermal gas pressure. In general, the outer CGM in our simulations is mostly supported by thermal pressure, and is near but not in HSE, which means that we expect to see significant motion in the medium (see Esmerian (2020), for similar results for Milky Way-mass galaxies simulated with the FIRE-2 physics).
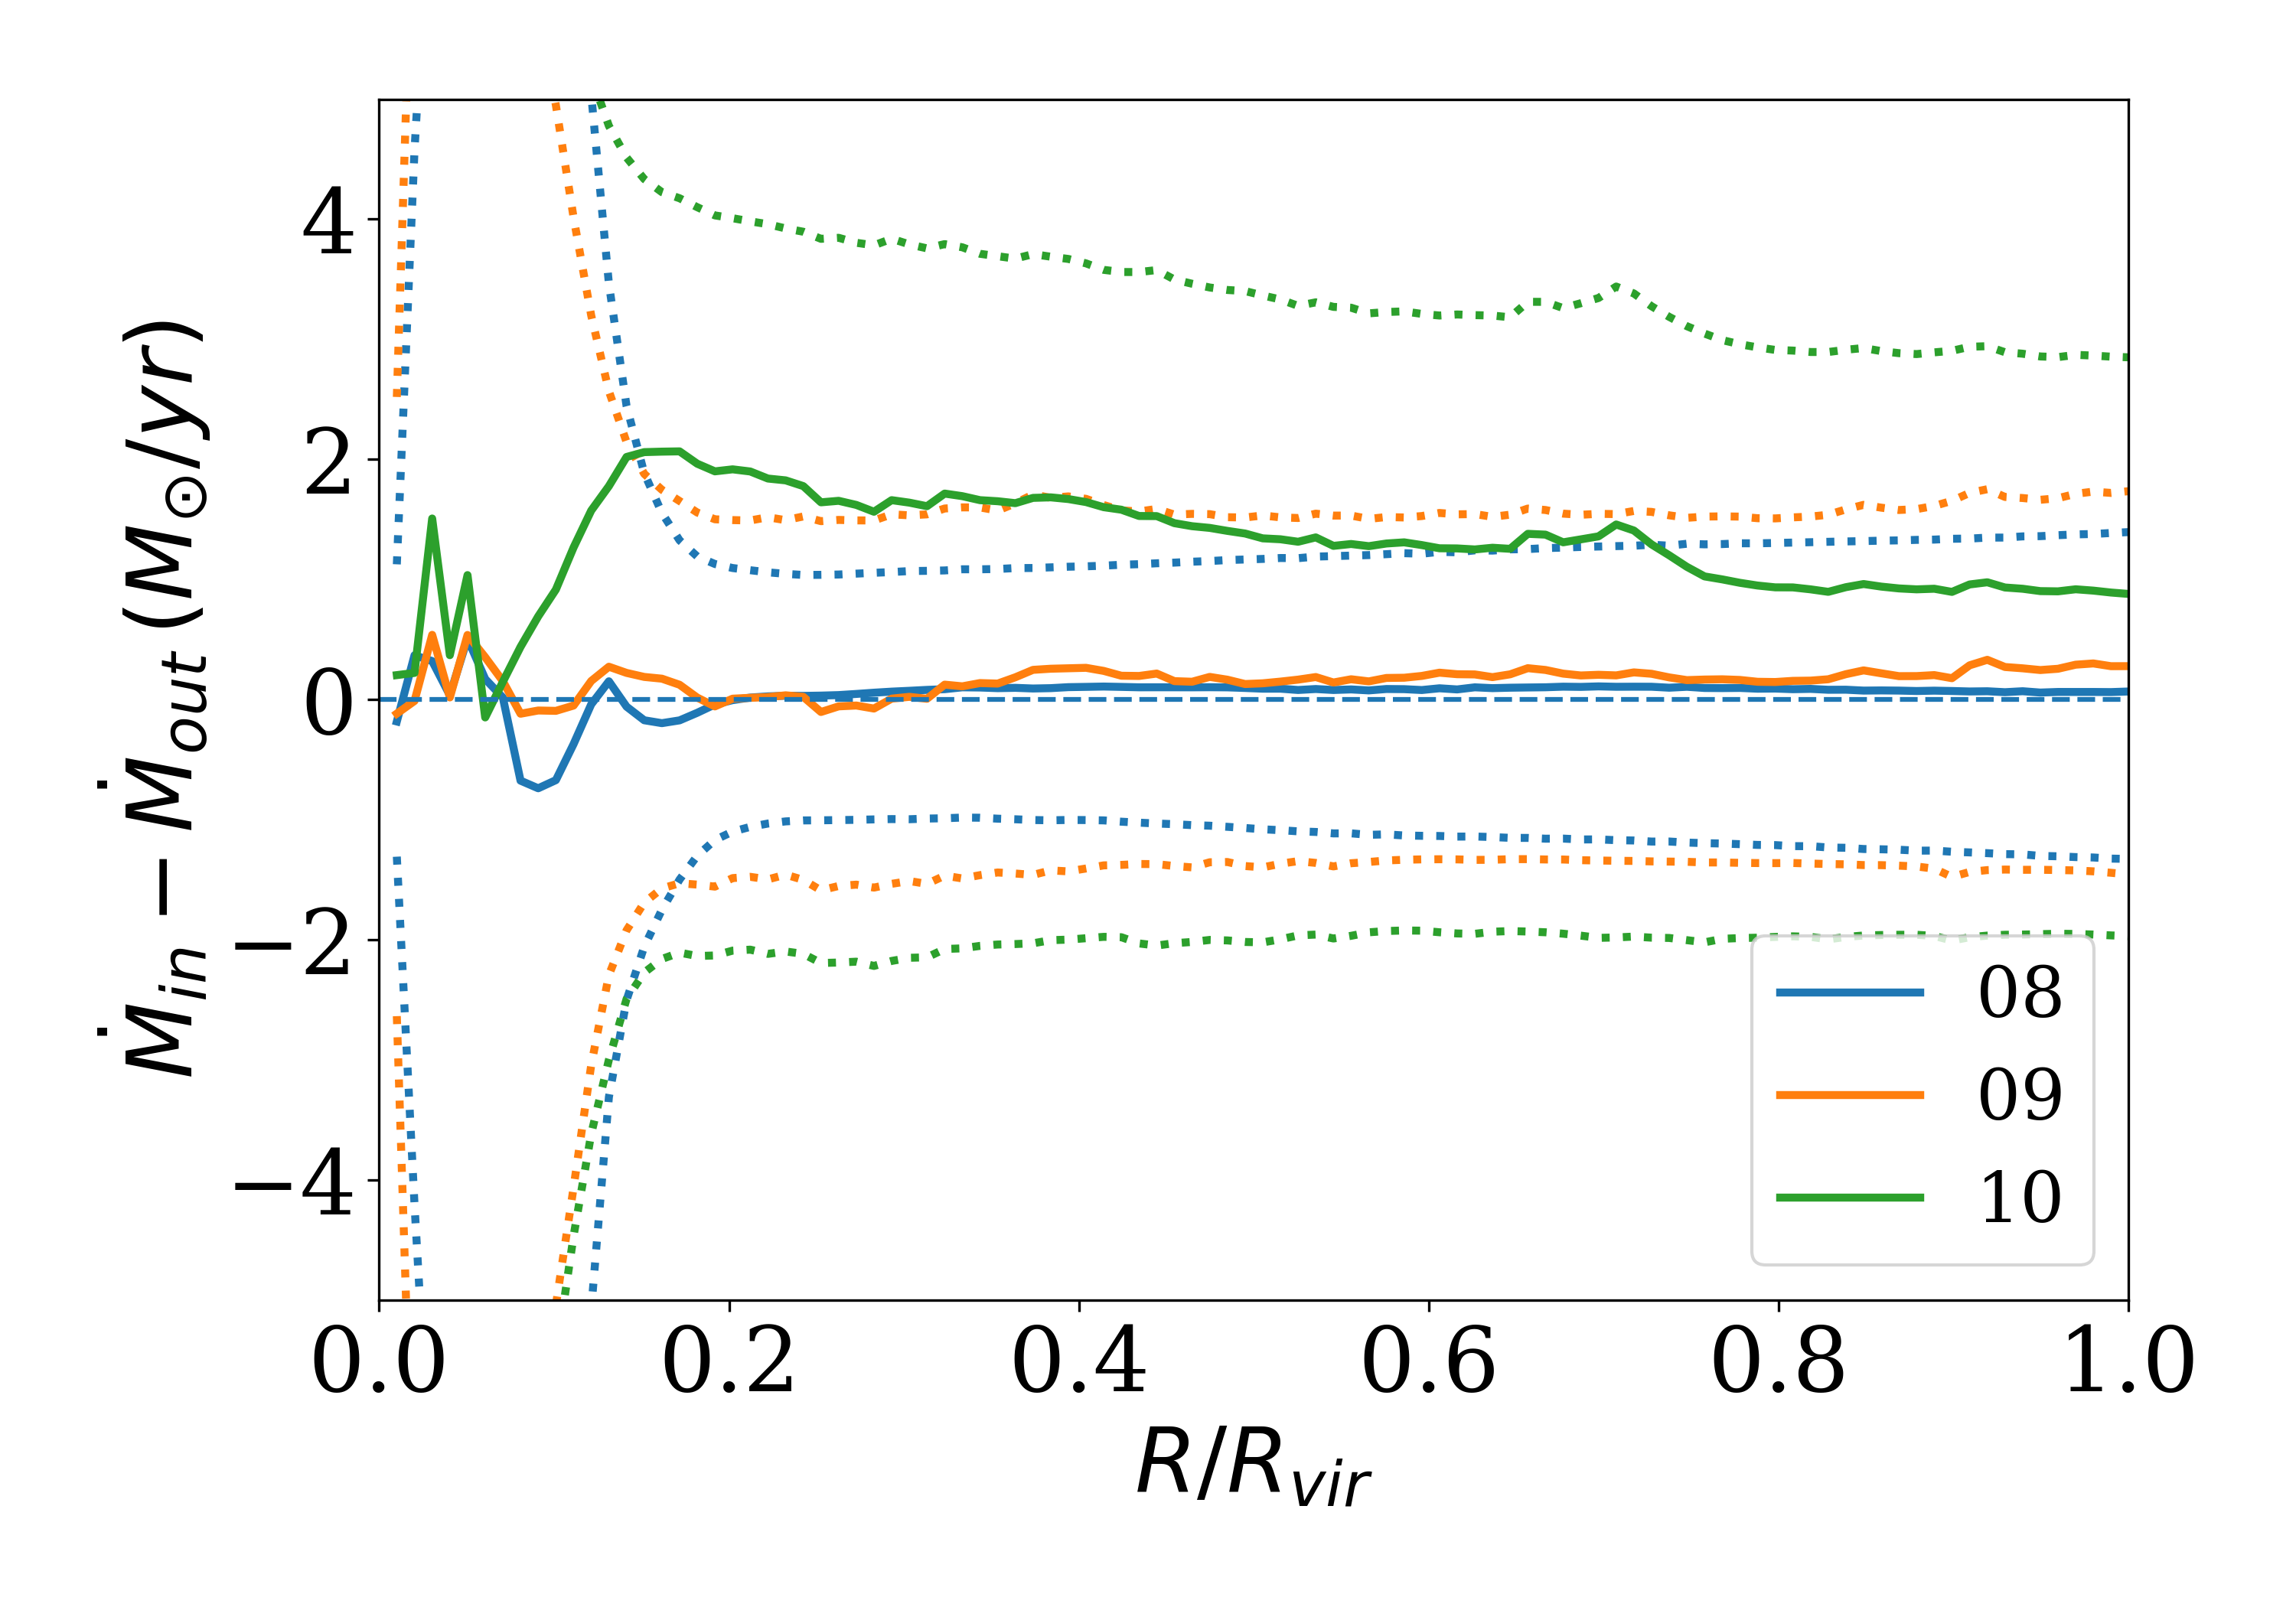
To investigate the CGM’s deviation from HSE, we calculate the inflow and outflow rates for the three stellar mass bins as a function of galacto-centric radius, which are shown in Figure 14. We then compare those rates to the net accretion rate (inflow - outflow). We see a net inflow through the CGM of order 0.2 for the median stellar mass bin. This inflow rate, which increases with stellar mass, is comparable to the SFR of the galaxy, also of order 0.2 for the median stellar mass bin. However, the gross inflow and outflow rates, while comparable to each other, are larger than the net inflow rate by an order of magnitude, i.e., .
We find that the mass-weighted velocities of the inflow and outflow ( 100 km/s) are similar to the virial velocity of the halo, also consistent with the ratio of the thermal and gravitational pressures we see. Beyond explaining the dynamics of the system, this picture has a number of consequences: first, it appears that the inflow and outflow rates are well coupled throughout the halo; secondly, this also implies that whatever mechanisms drive the outflows, they are effective throughout the galactic halo; and consequently, the dynamics of the halo are coupled to the star-formation activities in the central stellar region of galaxy.
5 Discussion
In this section we discuss the limitations in the simulations and our analysis, such as the resolution and physics in the simulations and the post-processing tool used, and how those affect the results presented in this paper.
The typical gas mass resolution achieved for dwarf galaxies in FIRE simulations is (Table 1). Depending on the clump size of the gas in the CGM, the current resolution may not be enough to resolve the dynamics in the dense CGM phases. There is observational evidence suggesting that some low-ion absorbers have sub-kiloparsec length scales (Lehner et al., 2013; Rudie et al., 2019). For a clump radius of 400 pc, Crighton et al. (2015) estimates the minimum required mass resolution is 4 , which is a substantially finer resolution than available in cosmological zoom simulations like FIRE. The low-ion content is likely to increase with improved mass resolution in the CGM, as suggested by recent work by other groups (Peeples et al., 2019; Suresh et al., 2019; van de Voort et al., 2019).
We used the metagalactic radiation field Haardt & Madau (2012) when calculating densities and ionization states of metals using Trident. However, we did not include local photoionizing sources like nearby stars in the galaxy. This affects the analysis in two ways: it is known that Haardt & Madau (2012) under-predicts observed H i photoionization coefficients by a factor (see, e.g., Faucher-Giguère, 2020), so this likely has an effect on the prediction of the low ionization-state ions in this work. Including the stellar radiation will change the ionization states of the ions in the CGM. However, because the stellar radiation decreases radially as a function of 1/, it is unlikely to change the distribution of ionization state much beyond the galactic disk.
The simulation suite described so far in this work does not include cosmic rays (CRs). Ji et al. (2019) studied the effects of CRs on galaxies in the FIRE simulations across a broad range of stellar and halo masses, and found that CR pressure appears to become important only when the galaxy halo mass approaches . CRs in the FIRE simulations do not appear to have a strong impact on the CGM of dwarf galaxies.
In a first step at quantifying the effects of CRs on dwarf galaxies in FIRE, we examined the CR version of the median stellar mass galaxy ‘m11e’ in our sample. We find no significant difference in the EW distributions of the ions between the two runs. The CR run has only of the stellar mass compared to the non-CR run at low redshift, so we also compare the CR run ‘m11e’ with a non-CR run ‘m11q’ with comparable stellar mass at , and again find no difference in the EW distributions in most ions, with the exception of O vi, which has slightly higher EWs in the CR run.
If the CGM distributions around dwarf galaxies in the real universe resemble the results presented in this work below the detection limit, and given the detection thresholds of current instruments, observers probing the absorption properties of the low ions when the background QSO is beyond of the galaxy, and beyond for C iv will likely only observe upper limits given the current detection limits.
5.1 Origins and Fates of Halo Metals
Using the same suite of FIRE-2 simulations as in this work, recent works trace the origins and fates of the material composing the CGM (Hafen et al., 2019b, a). These studies focus on halo masses and redshifts and , and show that across the whole halo mass range and redshift range studied, the main origin () is IGM accretion (including infalling halos), with wind from the central galaxy being the second most important contribution of the CGM, while wind from satellite galaxies contribute the least. The exception is for halos, where the contributions from winds of the central galaxy and satellite galaxies are about equal.
Hafen et al. (2019a) studies the fates of the CGM gas in the same halo and redshift ranges. For the CGM material at , immediately after leaving the CGM, most of the CGM gas enters the central galaxy; by , half of the mass remain in the ISM or stars in the central galaxy for the halos, but for lower mass halos most of the CGM mass are ejected into the IGM. For the CGM mass at z=0.25, most of the CGM mass remains in the CGM by across the halo mass range studied.
In general, the two studies find that there is substantial mixing of the CGM gas, as a result, there is little correlation between the origins and the fates of the CGM material, and a typical LOS can intersect CGM gas of multiple origins.
5.2 The Picture of CGM Composition and Dynamics Across Halo Mass and Redshift Ranges
In this subsection we discuss the difference between this work and previous studies in stellar/halo mass ranges, redshift, dynamics, resolution, feedback prescriptions, and observables.
In this study we selected the stellar mass and redshift ranges to be representative of current observations of the CGM of dwarf galaxies. Not many previous studies focus on the CGM of simulated galaxies in the same mass and redshift ranges, and the limited overlap occurs at the high stellar and halo mass ends of this study (e.g., Ford et al. (2013)). Ford et al. (2013) study the CGM around galaxies in cosmological hydrodynamic simulations, and find the low ions (Mg ii and Si iv) drop rapidly with impact parameter, while high ions (O vi and Ne viii) have relatively flat radial profiles; and absorption increases with halo mass. These findings are in agreement with the trends of the ion absorption profiles presented in this work.
We concluded in Section 4.5 that the CGM in this study is not in HSE. Most of the other studies find the same conclusion that CGM tends not to be in HSE in this halo mass range. Lochhaas et al. (2019) use spherically-symmetric, idealized, kpc-scale resolution simulations of the CGM, and found that the halo’s CGM is not in HSE, while the halo contains hot gas in HSE with cold gas falling onto the galaxy. Oppenheimer (2018) tested whether the halos in the EAGLE zoom simulation are in HSE, and found that the Milky Way halos deviates significantly from HSE, especially in the inner regions (see also Esmerian (2020), for FIRE-2 Milky Way-mass galaxies). In more massive halos ranging from to , Fielding et al. (2017) use idealized 3D hydrodynamics simulations to study the dynamics of the CGM, and find that below a critical halo mass , the CGM gas is not thermally supported, and above the CGM is supported by thermal pressure created in the virial shock (see also Stern et al. (2020) for a generalization of this result for halos which are depleted of baryons).
The resolution in the diffuse CGM is usually orders of magnitude coarser than in the galaxy in the FIRE simulations due to the density-dependent nature of Lagrangian schemes. Recent studies have increased the spatial resolution of the CGM in zoom simulations of Milky Way-like galaxies and have found substantial changes in the behavior and observables of the CGM relative to lower-resolutions. van de Voort et al. (2019) used the AREPO code to progressively increase the spatial resolution of the CGM, finding order-of-magnitude increases in the column density of neutral hydrogen present in the CGM of the target galaxy. Hummels et al. (2019) and Peeples et al. (2019) both used the Enzo code to study a Milky-Way analog galaxy in zoom simulations with spatial resolutions up to an unprecedented 500 comoving parsecs throughout the CGM. Like the AREPO study, these groups also found an increase in H i among other changes. Peeples et al. (2019) discovered significant differences in the kinematic structure of absorption line features in accompanying synthetic spectra for these galaxies. Hummels et al. (2019) explained the effect by identifying that increased resolution lends itself to preserving cool gas for longer in the simulation and and avoiding artificial mixing of hot and cold gas phases. In a related study, Schneider & Robertson (2018) present a set of 5-pc constant resolution simulations with isolated disk galaxies, and show that the simulations have not converged at 10 pc resolution, demonstrating the need for high resolution when studying the effects of winds on the CGM. Based on the results in these papers, improving the resolution in the halo of the simulations used in this work will likely increase the low-ion content, and would be critical if the goal is to resolve the internal kinematic structure of absorption.
Compared to the FIRE simulation suite, there are differences in the physics and feedback prescriptions used in other simulations studying the CGM. These differences can play a role in changing the predicted behavior and observables in the circumgalactic medium (Hummels et al., 2013). For example, Lochhaas et al. (2019) use a simple formulation for galactic scale winds in the idealized simulations of the CGM; and Ford et al. (2013) use momentum-driven winds as the stellar feedback prescription in their cosmological simulations. The observables and tracers used in some studies differ from those used in this paper. For example, Augustin et al. (2019) use RAMSES zoom simulations to compute expected emission from the CGM, and find the predictions agree well with current observations after adjusting the Ly escape fraction. The tracers can be studied using the FIRE simulation suite in future work.
6 Conclusions
In this work, we use the FIRE simulation suite with physically motivated models of the multi-phase ISM, star formation and stellar feedback to study the CGM of dwarf galaxies at low redshift (). In direct comparison with observations, our main conclusions are as follows:
(i) The EW and cover fraction of C iv predicted by the FIRE simulations are somewhat low compared to observational constraints inside of ( of the observations are above the detection limit, compared to only of the simulated sightlines above the detection limit). At larger radii, the simulation results lie factors of several to tens or even hundreds below the observations. The equivalent widths of the other ions inside are also underpredicted, by factors between three to ten or higher. Beyond , there are only non-detections from observations (Bordoloi et al., 2014; Liang & Chen, 2014; Johnson et al., 2017) (Figure 2).
(ii) The FIRE simulations can explain the C iv EW profile fits obtained from observations for dwarf galaxies in different bins, and can reproduce the EW profile fits when placing a similar detection limit on simulation data (Figure 6).
(iii) The covering fractions from the simulated sample are in agreement with the results from observations (Figure 7).
(iv) In the FIRE-2 simulations the majority of the carbon mass in gas in dwarf galaxies are in the CGM (Figure 12), which is in agreement with observations (Bordoloi et al., 2014).
As the simulated sample is in reasonable agreement with observations, we can make useful predictions with the simulation data to provide insight in the physics of the CGM around dwarf galaxies:
(v) All of the global properties (, , /, SFR, , and sSFR) correlate with one another, except for sSFR; and CGM absorption lines correlate with all of the global property correlations, again, except for sSFR (Figure 4). The correlation strength increases with the ionization potential of the ion. The EW of ions in our analysis do not show strong correlation with sSFR, impact parameter (), or redshift () (see Table 2).
(vi) We see a “three-zone" structure in the CGM of dwarf galaxies, associated with the disky ISM, the inner CGM, and the outer CGM. The break between the inner and outer CGM is around 0.45 , where the fraction of the total CGM mass contributed by wind and IGM accretion is found to be equal for halos in FIRE-2 simulations (Hafen et al., 2019b) (see Figure 8).
(vii) The flat radial profile of the O vi column density with radius is driven by an increase in the fraction of oxygen in the O vi state (Figure 10). The column density of other ions show a decrease with radius (Figure 8), driven by the combination of decreasing density and metallicity with increasing radius.
(viii) The outer CGM in the simulations is nearly but not quite supported by thermal pressure, thus not in HSE, as demonstrated by the existence of halo-scale bulk inflow and outflow motions. The net inflow rates are comparable to the SFR; in the lower mass halos, the actual inflow and outflow rates are greater than the net inflow rate by an order of magnitude, and are comparable to each other and the virial velocity of the halo. This indicates that the feedback that drives the dynamics of the halo is coupled with the star-formation activity towards the centre of the galaxy (Figure 13 and Figure 14).
Acknowledgements
We thank Lauren Corlies for her help in using Trident. F.L. thanks Gunjan Lakhlani for sharing the routines to calculate the dynamical time. We benefited from discussions with Bili Dong and Maan H. Hani. The analysis on the FIRE simulation data were run on XSEDE computational resources (allocations TG-AST120025 and TG-AST120023) and on the CITA compute cluster Sunnyvale. This research was enabled in part by support provided by SciNet (http://www.scinet.utoronto.ca) and Compute Canada (www.computecanada.ca). Computations were performed on the Niagara supercomputer (Ponce et al., 2019; Loken et al., 2010) at the SciNet HPC Consortium. SciNet is funded by: the Canada Foundation for Innovation; the Government of Ontario; Ontario Research Fund - Research Excellence; and the University of Toronto. The data used in this work were, in part, hosted on facilities supported by the Scientific Computing Core at the Flatiron Institute, a division of the Simons Foundation. This work was performed in part at the Aspen Center for Physics, which is supported by National Science Foundation grant PHY-1607611. CAFG was supported by NSF through grants AST-1517491, AST-1715216, and CAREER award AST-1652522, by NASA through grant 17-ATP17-0067, by STScI through grants HST-GO-14681.011, HST-GO-14268.022-A, and HST-AR-14293.001-A, and by a Cottrell Scholar Award from the Research Corporation for Science Advancement.
Software: SCIPY 333http://scipy.org, NUMPY 444http://numpy.org (van der Walt et al., 2011), MATPLOTLIB 555http://matplotlib.org (Hunter, 2007), MPI4PY 666http://pythonhosted.org/mpi4py/ (Dalcín et al., 2005), Trident 777http://trident-project.org/ (Hummels et al., 2017), and YT 888http://yt-project.org (Turk et al., 2011).
Data availability
The data supporting the plots within this article are available on reasonable request to the corresponding author. A public version of the GIZMO code is available at http://www.tapir.caltech.edu/ phopkins/Site/GIZMO.html. Additional data including simulation snapshots, initial conditions, and derived data products are available at https://fire.northwestern.edu/data/.
References
- Anglés-Alcázar et al. (2017) Anglés-Alcázar D., Faucher-Giguère C.-A., Kereš D., Hopkins P. F., Quataert E., Murray N., 2017, MNRAS, 470, 4698
- Augustin et al. (2019) Augustin R., et al., 2019, MNRAS, 489, 2417
- Bordoloi et al. (2014) Bordoloi R., et al., 2014, ApJ, 796, 136
- Bryan & Norman (1998) Bryan G. L., Norman M. L., 1998, ApJ, 495, 80
- Chan et al. (2018) Chan T. K., Kereš D., Wetzel A., Hopkins P. F., Faucher-Giguère C.-A., El-Badry K., Garrison-Kimmel S., Boylan-Kolchin M., 2018, MNRAS, 478, 906
- Crighton et al. (2015) Crighton N. H. M., Hennawi J. F., Simcoe R. A., Cooksey K. L., Murphy M. T., Fumagalli M., Prochaska J. X., Shanks T., 2015, MNRAS, 446, 18
- Dalcín et al. (2005) Dalcín L., Paz R., Storti M., 2005, Journal of Parallel and Distributed Computing, 65, 1108
- Dekel et al. (2009) Dekel A., et al., 2009, Nature, 457, 451
- El-Badry et al. (2018) El-Badry K., et al., 2018, MNRAS, 473, 1930
- Emerick et al. (2019) Emerick A., Bryan G. L., Mac Low M.-M., 2019, MNRAS, 482, 1304
- Esmerian (2020) Esmerian C e. a., 2020, In preparation
- Faerman et al. (2019) Faerman Y., Sternberg A., McKee C. F., 2019, arXiv e-prints, p. arXiv:1909.09169
- Faucher-Giguère (2020) Faucher-Giguère C.-A., 2020, MNRAS, 493, 1614
- Faucher-Giguère et al. (2009) Faucher-Giguère C.-A., Lidz A., Zaldarriaga M., Hernquist L., 2009, ApJ, 703, 1416
- Faucher-Giguère et al. (2015) Faucher-Giguère C.-A., Hopkins P. F., Kereš D., Muratov A. L., Quataert E., Murray N., 2015, MNRAS, 449, 987
- Faucher-Giguère et al. (2016) Faucher-Giguère C.-A., Feldmann R., Quataert E., Kereš D., Hopkins P. F., Murray N., 2016, MNRAS, 461, L32
- Feldmann et al. (2016) Feldmann R., Hopkins P. F., Quataert E., Faucher-Giguère C.-A., Kereš D., 2016, MNRAS, 458, L14
- Ferland et al. (2013) Ferland G. J., et al., 2013, Rev. Mex. Astron. Astrofis., 49, 137
- Fielding et al. (2017) Fielding D., Quataert E., McCourt M., Thompson T. A., 2017, MNRAS, 466, 3810
- Ford et al. (2013) Ford A. B., Oppenheimer B. D., Davé R., Katz N., Kollmeier J. A., Weinberg D. H., 2013, MNRAS, 432, 89
- Gill et al. (2004) Gill S. P. D., Knebe A., Gibson B. K., 2004, MNRAS, 351, 399
- Haardt & Madau (2012) Haardt F., Madau P., 2012, ApJ, 746, 125
- Hafen et al. (2017) Hafen Z., et al., 2017, MNRAS, 469, 2292
- Hafen et al. (2019a) Hafen Z., et al., 2019a, arXiv e-prints, p. arXiv:1910.01123
- Hafen et al. (2019b) Hafen Z., et al., 2019b, MNRAS, 488, 1248
- Harper-Clark & Murray (2011) Harper-Clark E., Murray N., 2011, in Alves J., Elmegreen B. G., Girart J. M., Trimble V., eds, IAU Symposium Vol. 270, Computational Star Formation. pp 235–238, doi:10.1017/S1743921311000445
- Hartwell et al. (2004) Hartwell J. M., Stevens I. R., Strickland D. K., Heckman T. M., Summers L. K., 2004, MNRAS, 348, 406
- Hopkins (2015) Hopkins P. F., 2015, MNRAS, 450, 53
- Hopkins et al. (2014) Hopkins P. F., Kereš D., Oñorbe J., Faucher-Giguère C.-A., Quataert E., Murray N., Bullock J. S., 2014, MNRAS, 445, 581
- Hopkins et al. (2018) Hopkins P. F., et al., 2018, MNRAS, 480, 800
- Hummels et al. (2013) Hummels C. B., Bryan G. L., Smith B. D., Turk M. J., 2013, MNRAS, 430, 1548
- Hummels et al. (2017) Hummels C. B., Smith B. D., Silvia D. W., 2017, ApJ, 847, 59
- Hummels et al. (2019) Hummels C. B., et al., 2019, ApJ, 882, 156
- Hunter (2007) Hunter J. D., 2007, Computing in Science and Engineering, 9, 90
- Ji et al. (2019) Ji S., et al., 2019, arXiv e-prints, p. arXiv:1909.00003
- Johnson et al. (2015) Johnson S. D., Chen H.-W., Mulchaey J. S., 2015, MNRAS, 449, 3263
- Johnson et al. (2017) Johnson S. D., Chen H.-W., Mulchaey J. S., Schaye J., Straka L. A., 2017, ApJ, 850, L10
- Knollmann & Knebe (2009) Knollmann S. R., Knebe A., 2009, ApJS, 182, 608
- Lehner et al. (2013) Lehner N., et al., 2013, ApJ, 770, 138
- Liang & Chen (2014) Liang C. J., Chen H.-W., 2014, MNRAS, 445, 2061
- Lochhaas et al. (2019) Lochhaas C., Bryan G. L., Li Y., Li M., Fielding D., 2019, arXiv e-prints, p. arXiv:1908.00021
- Loken et al. (2010) Loken C., et al., 2010, in Journal of Physics Conference Series. p. 012026, doi:10.1088/1742-6596/256/1/012026
- Ma et al. (2017) Ma X., Hopkins P. F., Wetzel A. R., Kirby E. N., Anglés-Alcázar D., Faucher-Giguère C.-A., Kereš D., Quataert E., 2017, MNRAS, 467, 2430
- Martin (1998) Martin C. L., 1998, ApJ, 506, 222
- Martin et al. (2002) Martin C. L., Kobulnicky H. A., Heckman T. M., 2002, ApJ, 574, 663
- Martin et al. (2014) Martin D. C., Chang D., Matuszewski M., Morrissey P., Rahman S., Moore A., Steidel C. C., 2014, ApJ, 786, 106
- Martin et al. (2015) Martin D. C., Matuszewski M., Morrissey P., Neill J. D., Moore A., Cantalupo S., Prochaska J. X., Chang D., 2015, Nature, 524, 192
- Mathews & Prochaska (2017) Mathews W. G., Prochaska J. X., 2017, ApJ, 846, L24
- McQuinn & Werk (2018) McQuinn M., Werk J. K., 2018, ApJ, 852, 33
- Muratov et al. (2015) Muratov A. L., Kereš D., Faucher-Giguère C.-A., Hopkins P. F., Quataert E., Murray N., 2015, MNRAS, 454, 2691
- Oppenheimer (2018) Oppenheimer B. D., 2018, MNRAS, 480, 2963
- Orr et al. (2018) Orr M. E., et al., 2018, MNRAS, 478, 3653
- Orr et al. (2019) Orr M. E., et al., 2019, arXiv e-prints, p. arXiv:1911.00020
- Ott et al. (2005) Ott J., Walter F., Brinks E., 2005, MNRAS, 358, 1453
- Peeples et al. (2019) Peeples M. S., et al., 2019, ApJ, 873, 129
- Ponce et al. (2019) Ponce M., et al., 2019, arXiv e-prints, p. arXiv:1907.13600
- Prochaska et al. (2011) Prochaska J. X., Weiner B., Chen H.-W., Mulchaey J., Cooksey K., 2011, ApJ, 740, 91
- Rahmati et al. (2013) Rahmati A., Pawlik A. H., Raičević M., Schaye J., 2013, MNRAS, 430, 2427
- Rudie et al. (2019) Rudie G. C., Steidel C. C., Pettini M., Trainor R. F., Strom A. L., Hummels C. B., Reddy N. A., Shapley A. E., 2019, The Column Density, Kinematics, and Thermal State of Metal-Bearing Gas within the Virial Radius of z 2 Star-Forming Galaxies in the Keck Baryonic Structure Survey (arXiv:1903.00004)
- Schneider & Robertson (2018) Schneider E. E., Robertson B. E., 2018, ApJ, 860, 135
- Silk & Mamon (2012) Silk J., Mamon G. A., 2012, Research in Astronomy and Astrophysics, 12, 917
- Simcoe et al. (2004) Simcoe R. A., Sargent W. L. W., Rauch M., 2004, ApJ, 606, 92
- Smagorinsky (1963) Smagorinsky J., 1963, Monthly Weather Review, 91, 99
- Smith et al. (2017) Smith B. D., et al., 2017, MNRAS, 466, 2217
- Sparre et al. (2017) Sparre M., Hayward C. C., Feldmann R., Faucher-Giguère C.-A., Muratov A. L., Kereš D., Hopkins P. F., 2017, MNRAS, 466, 88
- Stern (2020) Stern J e. a., 2020, In preparation
- Stern et al. (2019) Stern J., Fielding D., Faucher-Giguère C.-A., Quataert E., 2019, MNRAS, 488, 2549
- Stern et al. (2020) Stern J., Fielding D., Faucher-Giguère C.-A., Quataert E., 2020, MNRAS, 492, 6042
- Strickland & Stevens (2000) Strickland D. K., Stevens I. R., 2000, MNRAS, 314, 511
- Summers et al. (2003) Summers L. K., Stevens I. R., Strickland D. K., Heckman T. M., 2003, MNRAS, 342, 690
- Summers et al. (2004) Summers L. K., Stevens I. R., Strickland D. K., Heckman T. M., 2004, MNRAS, 351, 1
- Suresh et al. (2019) Suresh J., Nelson D., Genel S., Rubin K. H. R., Hernquist L., 2019, MNRAS, 483, 4040
- Tumlinson et al. (2011) Tumlinson J., et al., 2011, Science, 334, 948
- Turk et al. (2011) Turk M. J., Smith B. D., Oishi J. S., Skory S., Skillman S. W., Abel T., Norman M. L., 2011, ApJS, 192, 9
- Vogelsberger et al. (2014a) Vogelsberger M., et al., 2014a, MNRAS, 444, 1518
- Vogelsberger et al. (2014b) Vogelsberger M., et al., 2014b, Nature, 509, 177
- Werk et al. (2014) Werk J. K., et al., 2014, ApJ, 792, 8
- Wetzel et al. (2016) Wetzel A. R., Hopkins P. F., Kim J.-h., Faucher-Giguère C.-A., Kereš D., Quataert E., 2016, ApJ, 827, L23
- Wise et al. (2012) Wise J. H., Abel T., Turk M. J., Norman M. L., Smith B. D., 2012, MNRAS, 427, 311
- van de Voort et al. (2019) van de Voort F., Springel V., Mandelker N., van den Bosch F. C., Pakmor R., 2019, MNRAS, 482, L85
- van der Walt et al. (2011) van der Walt S., Colbert S. C., Varoquaux G., 2011, Computing in Science and Engineering, 13, 22