BCI learning induces core-periphery reorganization in M/EEG multiplex brain networks
Abstract
Objective: Brain-computer interfaces (BCIs) constitute a promising tool for communication and control. However, mastering non-invasive closed-loop systems remains a learned skill that is difficult to develop for a non-negligible proportion of users. The involved learning process induces neural changes associated with a brain network reorganization that remains poorly understood.
Approach: To address this inter-subject variability, we adopted a multilayer approach to integrate brain network properties from electroencephalographic (EEG) and magnetoencephalographic (MEG) data resulting from a four-session BCI training program followed by a group of healthy subjects. Our method gives access to the contribution of each layer to multilayer network that tends to be equal with time.
Main results: We show that regardless the chosen modality, a progressive increase in the integration of somatosensory areas in the band was paralleled by a decrease of the integration of visual processing and working memory areas in the band. Notably, only brain network properties in multilayer network correlated with future BCI scores in the band: positively in somatosensory and decision-making related areas and negatively in associative areas.
Significance: Our findings cast new light on neural processes underlying BCI training. Integrating multimodal brain network properties provides new information that correlates with behavioral performance and could be considered as a potential marker of BCI learning.
Introduction
Learning is a complex phenomenon that can be characterized by changes in regional associations and therefore in brain network organization [1]. Changes following learning have been revealed in language [2, 3] and in motor skill acquisition with resting-state fMRI recordings [4, 5]. In the case of motor learning, studies that focus on functional connectivity have demonstrated changes induced by skill acquisition [6, 7, 8, 9, 5]. From a network perspective, a large number of metrics characterizing network properties have been considered to capture the process of motor acquisition. In Ref. [10], the motor performance improvement was associated with an increase of clustering coefficients, a higher number of network connections, an increased connection strength and shorter communication distances. Another approach consists of using a single metric that measures subnetwork segregation: modularity [11], already used as a marker of brain plasticity [12] and motor learning [13]. Motor skill acquisition induced an autonomy of sensorimotor systems and individual differences in the amount of learning could be predicted by the release of cognitive control hubs in frontal and cingulate cortices [14].
Mastering non-invasive closed-loop systems is a learned skill that requires several training sessions to achieve control of the device. Recent studies suggest that the involved learning process is analogous to cognitive or motor skill acquisition in the case of BCI [15]. It may induce behavioral modifications and neural changes within trained brain circuits in neurofeedback that last for several months after training [16]. Changes at the neuronal level, during the learning process, have also been observed and simulated [17]. The recruitment of areas beyond those targeted by BCI has been observed during skill acquisition [18, 19], and a decrease in the global efficiency index in the higher-beta frequency range with the practice of MI [20] suggests the involvement of a distributed core of brain areas while learning. From a theoretical perspective, the existence of a core, a group of tightly connected nodes, surrounded by a poorly connected periphery is crucial for the integration of information between remote network components [21, 22]. Previous studies have demonstrated the utility of using multilayer models of networks [23, 24] to study the relationship between structure and function in the human brain. The identification of core-periphery structures in brain networks can be significantly enriched by adding multiple levels of connectivity [25, 26]. In particular, combining multifrequency or multimodal neuroimaging data from a network perspective can reveal higher-order topological properties that cannot be detected by simple single-layer network approaches [27, 28, 29, 25, 30, 31, 32]. Magnetoencephalography (MEG) and electroencephalography (EEG) are complementary in terms of sensitivity towards source depths and conductivity, but also in terms of dipole orientation detection [33, 34, 35, 36, 37, 38]. As a result, their combination could provide valuable information, and has proven to enhance subjects’ mental state discrimination in BCI [39].
On the above mentioned elements, we hypothesized that integrating information from EEG and MEG data, allow a better description of the core-periphery changes occurring during a motor imagery-based BCI training in a group of healthy subjects. Such an enriched description could reveal fresh insights into learning processes that are difficult to observe at the single layer level and eventually improve the prediction of future BCI performance.
Materials and Methods
Participants and experiment
We included twenty healthy, and BCI naive, subjects (aged 27.5 4.0 years, 12 men). All right-handed, they participated in a 4 session-based BCI training during two weeks. According to the declaration of Helsinki, a written informed consent was obtained from subjects after explanation of the study, which was approved by the ethical committee CPP-IDF-VI of Paris. The EEG-based BCI consisted of a two-target box task [40]. The subjects were instructed to control the vertical position of a moving cursor by modulating the neural activity in the [8-12 Hz] and/or [14-29 Hz] frequency bands. Each session was divided into two phases:
-
1.
The training phase consisted of five consecutive runs, of 32 trials each, without any feedback. For a given trial, the first second consisted of the inter-stimulus interval (ISI) followed by five seconds of target presentation. To elicit the (EEG electrodes; frequency bins) couples that best discriminate the subjects’ mental state over the left motor area and within the mu-beta frequency ranges, we computed contrast maps that relied on the R-square metric [41].
-
2.
The testing phase consisted of six runs, of 32 trials each, with a cursor feedback. Similarly to the training phase, for a given trial, we had one second of ISI, while the target was presented throughout the subsequent five seconds. The visual feedback, displayed from to , consists of a moving cursor. The features, i.e. power spectra estimated at the (EEG electrodes; frequency bins) couples selected during the training, were classified by using the Linear Discriminant Analysis method. All the results presented in the following sections relied on the analysis performed on the testing data.
To perform the experiments, we used a 74 EEG-channel system, with Ag/AgCl passive sensors (Easycap, Germany) placed according to the standard 10-10 montage. The reference was located at the mastoids and the ground electrode was placed at the left scapula. We kept the impedances lower than 20 kOhms. The MEG system consisted of 102 magnetometers and 204 gradiometers (Elekta Neuromag TRIUX MEG system). E/MEG registrations were performed simultaneously in a magnetic shielded room with a sampling frequency of 1 kHz and a bandwidth of 0.01-300 Hz. The subjects were seated with palms facing upward in front of a 90 cm-distant screen. To ensure that no forearm movements were performed, experts visually inspected electromyogram (EMG) signals recorded from the subject’s right arm during the experiment. During the sessions, BCI feedback relied on EEG signals transmitted to the BCI2000 toolbox [41] via the Fieldtrip buffer [42]. Individual T1 sequences have been obtained by using a 3T Siemens Magnetom PRISMA after the fourth session to ensure accurate head models [43]. These registrations consisted of a 15 minute-resting-state task. A preprocessing of the images was performed via the FreeSurfer toolbox [44] and directly imported (15002 vertices) to the Brainstorm toolbox. To provide co-registration with the anatomical MRI, we digitized the location of the EEG electrodes and three landmarks (nasion, left and righ pre-auricular points) with the FastTrak 3D digitizer (Polhemus, Inc., VT, USA). These locations were aligned with the MRI using the Brainstorm toolbox [45]. A more detailed description of the experiments is proposed in Ref. [46].
Data analysis
M/EEG processing
After a first preprocessing step that consisted of an application of the temporal extension of the Signal Space Separation (tSSS) to MEG signals to remove environmental noise [47], M/EEG data were downsampled to 250 Hz and processed via the Independent Component Analysis [48, 42] to remove ocular and cardiac artifacts. Then, data were segmented into 7s-epochs, corresponding to the trial length.
Source reconstruction was performed by applying the Boundary Element Method [49, 50] to obtain the individual head model, followed by the estimation of the sources with the weighted Minimum Norm Estimate [51, 52, 53, 45]. A more detailed description of the applied preprocessing steps is proposed in Ref. [46].
To compute the power spectra within the individual anatomical space, we used the Welch method. A time window of 1 s and a window overlap ratio of 50 % was applied during the feedback period (i.e. from t = 3 s to t = 6 s) to obtain the cross-spectral estimation for each trial, session, and subject. Then, for each region of interest (ROI) from the Destrieux atlas [54], we took into account the first principal component of the power spectra computed over the dipoles. For each layer (or modality here) and frequency band , we estimated the functional connectivity networks by computing the imaginary coherence between each pair of ROIs () [55], resulting in 148 x 148 adjacency matrices .
Network analysis and statistics
Similarly to Refs [26, 32], to obtain the multilayer or multiplex brain networks for a given frequency band from the adjacency matrices , we aligned the EEG and MEG connectivity networks as follows:
| (1) |
To study properties associated with a core-periphery organization, for a given layer (i.e. modality here), we filtered the associated adjacency matrix to keep the strongest weights by applying a broad range of thresholds corresponding to the average node degree to . For each threshold , to determine whether a node belongs to the core, we computed the multiplex core-periphery of the filtered network by calculating its richness defined as follows:
| (2) |
where corresponds to the number of layers (), corresponds to the strength of the node in the l-th layer (i.e. the sum of the i-th row of the matrix ), and corresponds to the l-th component of the vector that represents the contribution of each layer (ranging from 0 to 1). To take into account only the links of node i that are associated with nodes of higher richness, we decomposed the richness function as follows: . The richness of nodes linked to richer nodes can be defined as:
| (3) |
We finally computed the multiplex coreness [26] of each node , independently from any other consideration, by determining the number of times the node belongs to the core over all the tested thresholds, as follows:
| (4) |
where if node belongs to the core for the threshold , and otherwise. To obtain the coreness associated with a specific layer, one can simply modify the vector in equation 3 so that the component not related to the given modality is equal to zero. For each subject, session and frequency band, we optimized the choice of the components of the vector by using the Particles Swarm Optimization and Statistical Analysis (PSO) algorithm [32, 56]. In our case, the Fisher’s criterion , chosen to maximized the difference between the conditions, was defined as follows:
| (5) |
where is the averaged coreness computed over the nodes in the condition and
| (6) |
where corresponds to the coreness computed in node in the condition .
To study the variation of coreness between conditions, we defined the relative coreness (C) as C=. To compute the multiplex core-periphery properties, we used the Brain Connectivity Toolbox [57] and the Matlab code available at https://github.com/brain-network/bnt.
To take into account the subjects’ specificity, we used customized definitions of the and bands [58], that rely on the Individual Alpha Frequency (IAF) [59], obtained from a 3-minute resting state recording. The ranges from IAF - 2 Hz to IAF, from IAF to IAF + 2 Hz, from IAF + 2 Hz to IAF + 11 Hz and from IAF + 11 Hz to IAF + 20 Hz. Preliminary results did not show particularly significant efects in and low
bands. Therefore, only results obtained within the and frequency bands are presented here.
After plotting quantile-quantile plots and performing the Shapiro-Wilk test [60], it became clear that the coreness values were not normally distributed. Thus, to evaluate the session and the modality effect on the coreness and its associated properties, we fitted and tested an ANOVA using 5000 permutation-tests (lmPerm package in R).
Correlations between BCI scores and coreness were estimated via the use of repeated-measures correlations (rmcorr package in R [61]).
Results obtained from paired -tests between conditions (to assess the condition effect) and from repeated-measures correlations referred to a statistical threshold of corrected for multiple comparisons by adopting a false discovery rate (FDR) criterion [62], which is a method extensively used in biological studies [63, 64, 65].
Results
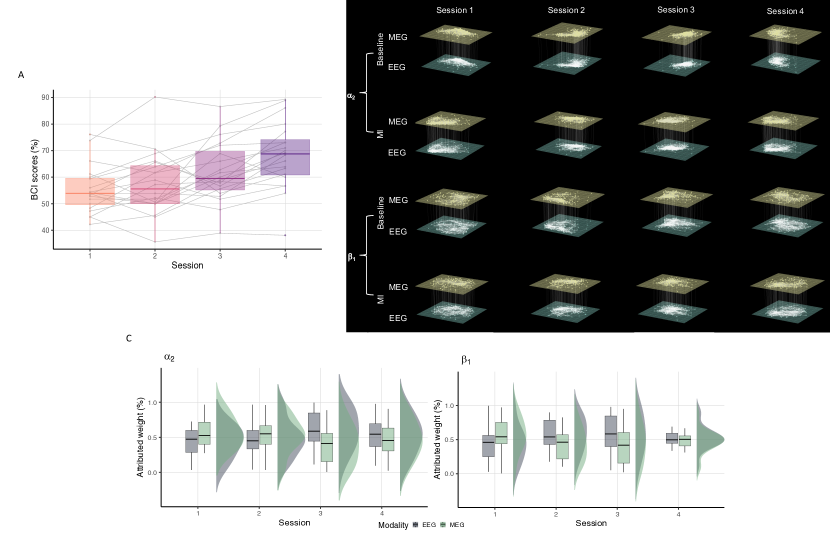
Before studying the evolution of network properties over sessions, we first determined whether a learning effect was actually present. We applied a one-way repeated non-parametric ANOVA on the BCI accuracy scores averaged across the runs of each session with the session number as the intra-subject factor (Figure 1A). Results confirmed that a learning effect was present at the group level (). In particular, sixteen subjects out of 20 achieved the ability to control the moving cursor by the end of the training, with accuracy scores above the chance level of [66].
As explained in the previous section, we started our analysis by using the adjacency matrices obtained from [46] to build single layer networks (Figure 1B, see Supplementary Materials Figures S1 & S2), and we investigated in which extent integrating the network properties obtained from EEG and MEG would be beneficial to the search of BCI training markers.
As a preliminary step, we studied the evolution of the attributed weights across sessions (Figure 1C, see Supplementary Materials Figure S3). We observed that the main session and modality effects occurred within the and the bands, with significant interaction effects in and bands (two-way ANOVA, respectively p=0.022 and p=0.027). In these bands, we observe similar trends. In session 1, is larger than ; then, the opposite effect occurred before the convergence to 0.5 at session 4. This final convergence to 0.5 indicates a progressive equal contribution of the two modality layers on the regional multiplex coreness.
Multiplex core-periphery provides additional information
We studied single and multiplex (mux) coreness trends over sessions in the MI condition (Figure 2A). Similar tendencies were observed in the different modalities both within the and frequency ranges (see Supplementary Materials Figure S4). In particular, we observed that the highest values of MI coreness were obtained in ROIs that belongs to the frontal lobe. In , we obtained a progressive increase of the median value within the frontal lobe, especially in mux (see Figure 2A). The second most important lobe was the lateral one, in particular for EEG and mux. We noticed an increase of the median value obtained within parietal lobe in MEG. In , these observations were even clearer with an increase of the values obtained within the lateral lobes in EEG and mux, whereas values within in the parietal lobe were stable and those obtained within the occipital lobe were negligible. These first observations showed that specific brain lobes presented clear variations of coreness values depending on the considered modality (for a more detailed presentation of the distribution of coreness values in the MI condition, see Supplementary Materials Figure S5, and for a presentation of multiplex coreness values, see and Supplementary Materials Figure S6).
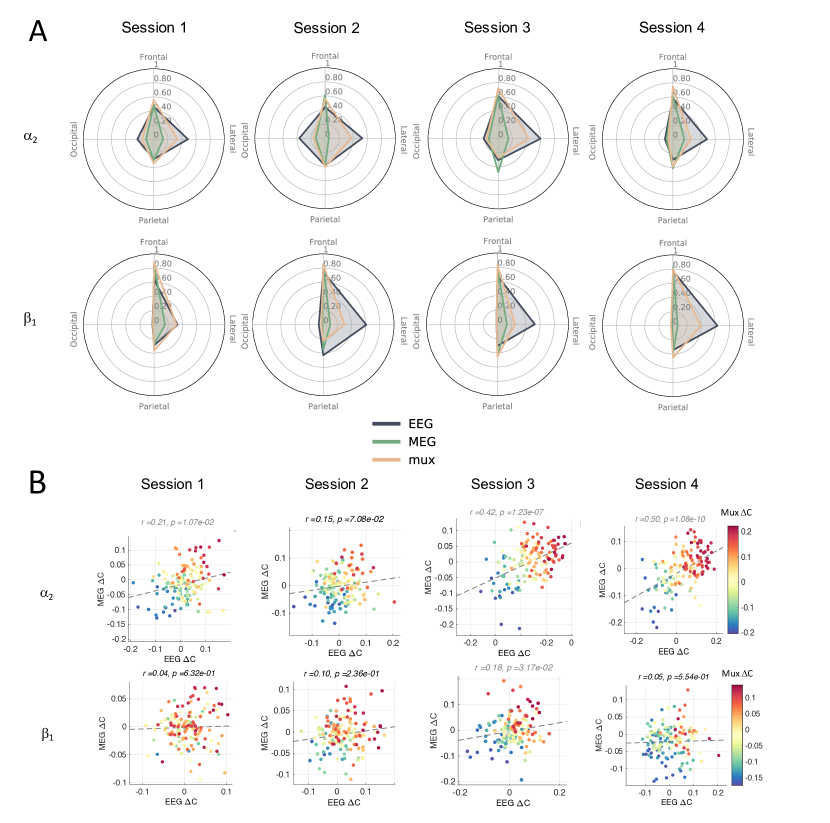
The scatter plots represented in (Figure 2B) are associated with the relative coreness () values obtained for each single layer (X and Y axis) and also for the multiplex. Within the band, we observed that the distribution of points progressively followed a linear relationship between EEG and MEG values, meaning a non-negligible part of the information is shared by these modalities at the end of the training. Within the band, we noticed an absence of a linear relationship between EEG and MEG, meaning that the two single layers shared less common information.
Furthermore, we assessed the modality effect associated with via a one-way ANOVA, with the modality taken as the intra-subject factor. In the ranges the parahippocampal gyrus significantly differed between modalities () associated with visual functions [67]. Within the frequency range, we observed a significant modality effect in the middle-anterior part of the cingulate gyrus () involved during decision making and memory consolidation [68]. In the band, the long insular gyrus, also associated with decision making [69] presented a significant difference in terms of modality (). The presented modality effects were driven by a significant difference between EEG and MEG relative coreness (Tukey multiple pairwise comparisons, -values adjusted via the Holm method ).
We also evaluated the information of interest provided by the multiplex with respect to single layers by statistically comparing the coreness of the MI versus the Rest conditions with a paired t-test (, see Supplementary Materials Tables S1-S3). We observed two opposite trends depending on the frequency range. In , at the single layer level, no consistent significant ROIs were obtained whereas we observed an increased involvement of the gyrus rectus with the multiplex with the training ( at session 4). This brain area is known to be associated with decision making involving a reward [70]. Within the ranges, we observed a lower number of ROIs showing a significant condition effect. In , at the single layer, no significant ROIs () were obtained during the first session whereas the multiplex presented three: short insular gyri (involved in motor plannning [69]), planum polare of the superior temporal gyrus (deductive reasoning [71]), and the gyrus rectus (see Supplementary Materials Table S3).
In the next sections, to directly account for the variations of coreness between conditions, we will focus our study on the relative coreness . Furthermore, in order to take into account the most informative ROIs, we pre-selected the areas that show a significant condition effect at least once during the training before performing the analysis presented in the subsequent sections.
Relative coreness changes during training
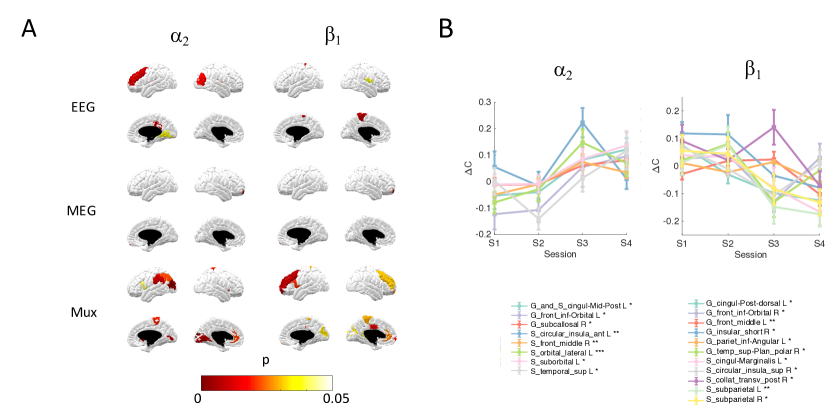
To provide a more detailed description of the evolution of the relative coreness over training, we performed a one-way ANOVA for each layer separately (see Supplementary Materials Figures S8).
We observed that presented a significant session effect involving different brain areas (Figure 3A, see Supplementary Materials Figure S7).
Within the range, a significant session effect was observed in EEG mostly within the long insular gyrus and the gyrus rectus; a significant session effect was observed in MEG in the supramarginal gyrus (working memory and motor planning [72]); and in the multiplex a significant session effect was observed in areas involved during motor planning and working memory (orbital part of the inferior frontal gyrus and subcallosal gyrus) [73, 74, 75] and in learning complex motor skills (middle-posterior part of the cingulate gyrus)[76].
In each case, we obtained an increase of with training (see Figure 3A and Supplementary Materials Figure S7).
Within the range, a significant session effect was observed in EEG within the inferior temporal gyrus (dual working memory task processing) and in the multiplex in areas associated with visual processing (superior temporal gyrus), working memory (middle frontal gyrus), and motor planning (short insular gyri). In the multiplex, most of the ROIs showing a significant session effect present a decrease of with training (see Figure 3B).
Multiplex relative coreness correlated with future BCI performance
For the sake of simplicity, we will present our results only with relative coreness within the band were the most significant observations were made. For a complete presentation of the results, see Supplementary Materials Figure S10-S11.
We observed that the relative coreness presents a significant correlation with the BCI scores, within a larger number of significant ROIs in the multiplex in comparison with EEG or MEG (see Supplementary Materials Figure S10). In EEG, negative correlations were obtained within the posterior-ventral part of the cingulate gyrus, the fronto-marginal gyrus () (respectively involved during learning a complex motor skill and working memory [76, 77, 78, 79]) and a positive correlation within the middle temporal gyrus (involved during the observation of motion [80]). In MEG, a positive correlation was observed within the triangular part of the inferior frontal gyrus (, involved during motor response inhibition and working memory [73, 74, 75]) and a negative correlation within the cuneus (involved during visual processing [81]). in the multiplex networks, positive correlations were obtained in regions involved respectively during motor tasks and motor imagery with working memory tasks (subcentral gyrus, superior parietal lobule, and subcallosal gyrus) [82, 79, 83, 7]. A negative correlation was obtained within the gyrus rectus (decision making involving reward).
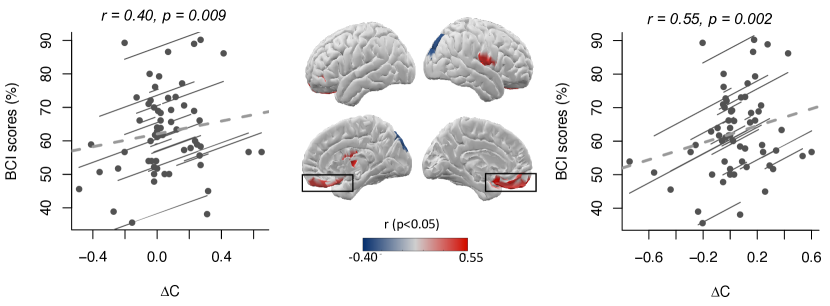
To assess whether relative coreness could be associated with future BCI performance, we estimated the correlation between in session and the BCI score obtained in session . We observed significant correlations only with multiplex within the band (Figure 4). More precisely, a positive correlation () was observed in the gyrus rectus, the subcentral gyrus, but also the long insular gyrus (involved during somatosensory tasks [69]). A negative correlation was obtained in the superior occipital gyrus associated with visual processing (in blue in Figure 4) [84].
Discussion
Controlling a BCI remains a learned skill that is difficult to develop for a non-negligible number of users (15 % - 30 %) [85]. Previous studies dedicated to elicit neural dynamics underlying BCI skill acquisition in primates [86, 87] and humans [20, 19] suggest the presence of a distributed and dynamic network of cortical areas above the motor-related ones. However, the evolution of such brain networks over training is largely unknown mainly because of a lack of longitudinal studies based on BCI paradigms [88]. Our protocol relied on reinforcement learning [89] based on a well-known two-target box task [40] where a training effect has been obtained. In this study, we were particularly interested in understanding the brain network macroscale changes during the learning process. A few number of works, relying on BCI protocols and involving healthy subjects, have previously addressed this question [46, 90].
Tracking core-periphery changes
It has been proved that core-periphery properties could be a valuable tool to track brain reorganization associated with cognitive processes [91] but also disorders [92, 93]. In this study, we worked with the coreness, a concise and robust metric that enables us to assess the likelihood to belong to the core of a network [25, 26]. Regardless of the modality, opposite trends were obtained within the and ranges in terms of the evolution of the discrimination between conditions and of the values with time (see Supplementary Materials Figure S8 and Tables S1-S3). Nevertheless, these observations were particularly true for the multiplex involving areas associated with somatosensory tasks and motor planning, and in areas associated with visual processing and working memory (see Figure3).
The activity is known to be linked to the inhibition of task-irrelevant areas [94, 95, 96]. If desynchronization is clearly associated with sensorimotor tasks, recent studies suggest that -synchrony maintains the current sensorimotor set [97, 98]. In addition, activity is implicated in specific functions such as visual perception [99, 100] and working memory [101], and is associated with top-down controlled processing [98]. From a functional connectivity perspective, in a previous work, we showed that MI-based BCI learning was associated with a progressive decrease of node strength in associative cortical regions and with the reinforcement of sensorimotor activity targeted by the experiment [46]. In this case, and shared a common behaviour. Altogether, these results suggest a joint response of with frequency bands during BCI training, associated with a reinforcement of the integration of sensorimotor areas in paralleled with a functional connectivity release in the associative areas involved during visual processing and working memory in .
Layer comparisons
The complementary role of EEG and MEG has been proved at different levels: dipole orientation and source localization [36, 38, 102] and subjects’ mental state classification [39]. However, such complementarity has been poorly studied at the network level despite some interesting results in functional connectivity [103].
To better capture network changes at different time or spatial scales, one can use multilayer models of networks [23, 24]. This approach enabled for example, in the time domain, to predict the relative learning rate via the flexibility [13] in motor skill acquisition, but also to identify core-periphery changes in Alzheimer disease via a multimodal approach combining structural and functional networks [25, 26, 32].
Here, based on previous work where MEG and DTI were combined [32], we integrated modalities knowing the contribution of each of them in such a way as to ensure the highest separation between conditions. These weights tended to converge to 0.5 (see Figure 1C), meaning that the two modalities provided similar contribution to the multiplex network towards the end of the BCI training. This finding suggests that the two modalities are as important to discriminate MI and Rest conditions in the multiplex at the end of the training. As a result, the multiplex appeared to present a larger and more robust condition effect with respect to EEG and MEG (see Supplementary Materials Figures S7 and Tables S1-S3). However, the attributed weights did not present a significant correlation with BCI performance.
The approach proposed here also raised the possibility to compare results obtained from different layers. In particular, in , we obtained a progressive linear relationship between EEG and MEG relative corenesses with time over all the ROIs (see Figure 2B).
This result suggests that, at a global level, MEG and EEG capture similar task-related processes occurring during the BCI experiment, especially at the end of training.
The modality effects, suggested in Figure 2A, and actually observed at the relative coreness level, were driven by a significant difference between EEG and MEG relative corenesses. This effect was mostly observed in areas associated with decision making and memory consolidation, highlighting the utility to combine MEG and EEG networks to better capture mechanisms underlying learning process.
Markers of cognitive performance
Identifying neural features underlying BCI performance is crucial to design optimized and individualized BCI architectures [104, 105]. Among the elicited markers are psychological and demographical traits [106]. From a neurophysiological perspective, previous studies identified power spectra in , and bands as potential predictors of BCI scores [107, 108]. In our study, the most significant results were obtained in and frequency bands. Recent findings proved that functional connectivity could correlate with the user’s performance [109, 59, 110]. However, these studies were associated with a single session BCI performance. In a recent work, we showed that the regional connectivity strength of specific associative cortical areas could explain the BCI performance in the same session but also the future learning rate [46]. Here, we were particularly interested in identifying markers of BCI performance at the core-periphery network level.
If EEG, MEG, and multiplex presented associations with BCI scores, only the latter presents a significant correlation with the BCI performance of the next session based on the relative coreness within the band (see Supplementary Materials Figure S10-S11). Two trends were again observed: a positive correlation in areas respectively involved during decision making and somatosensory tasks (gyrus rectus, subcentral gyrus, and long insular gyrus) and a negative correlation in the superior occipital gyrus associated with visual processing (see Figure 4). These findings are in line with previous studies that reported a larger clustering coefficient in the gyrus rectus associated with a higher nodal betweenness centrality (NBC) in sensorimotor areas and a reduced NBC in visual areas in the context of motor training [111, 112]. Altogether, these results support the hypothesis that sensorimotor areas and associative areas play a crucial role in motor sequence learning as well as in abstract task learning [7, 113, 114, 115] and that cognitive processes involved in the supervisory attentional system [116, 117] are important to perform MI tasks [118] and motor learning [119, 120, 121, 122].
Caveats and perspectives
The temporal window of study is a crucial matter when considering a longitudinal experimentation, especially in the BCI domain. Our participants followed a four-session-training program, within two weeks. This temporal window might not be sufficient to observe the full learning process [123, 88]. However our results constitute the first observations of a training process at the core-periphery level. Further studies based on longer BCI training are necessary to assess whether our observations could be still verified on a larger temporal scale.
This work could pave the way to further explore of the integration of M/EEG network information to better understand neural mechanisms underlying learning but also task performance in particular in the use of BCI in a clinical context. However, before considering multimodal BCIs in routine, further developments are required to increase MEG portability. The use of new generation of MEG sensors (i.e. optically-pumped magnetometers) could meet this need [124, 125, 126, 127].
Conclusion
In this work, we have proved that studying the network integration changes at the single and multilayer levels provides additional information to characterize dynamic brain reorganization during BCI training. We found that a progressive increase of the integration of somatosensory areas in the band was paralleled by a decrease of the integration of visual processing and working memory areas in the band. More importantly, these changes were more visible in multiplex in which brain network properties correlated with future BCI scores in the band. Taken together, our results cast new light on brain network reorganization occurring during BCI training and more generally during human learning.
References
- [1] Reddy, P. G. et al. Brain state flexibility accompanies motor-skill acquisition. Neuroimage 171, 135–147 (2018). URL http://www.sciencedirect.com/science/article/pii/S1053811917311175.
- [2] Deng, Z., Chandrasekaran, B., Wang, S. & Wong, P. C. Resting-state low-frequency fluctuations reflect individual differences in spoken language learning. Cortex 76, 63–78 (2016). URL https://www.ncbi.nlm.nih.gov/pmc/articles/PMC4777637/.
- [3] Sheppard, J. P., Wang, J.-P. & Wong, P. C. M. Large-scale Cortical Network Properties Predict Future Sound-to-Word Learning Success. Journal of Cognitive Neuroscience 24, 1087–1103 (2012). URL https://www.ncbi.nlm.nih.gov/pmc/articles/PMC3736731/.
- [4] Sami, S. & Miall, R. C. Graph network analysis of immediate motor-learning induced changes in resting state BOLD. Frontiers in Human Neuroscience 7 (2013). URL https://www.ncbi.nlm.nih.gov/pmc/articles/PMC3654214/.
- [5] Taubert, M., Lohmann, G., Margulies, D. S., Villringer, A. & Ragert, P. Long-term effects of motor training on resting-state networks and underlying brain structure. Neuroimage 57, 1492–1498 (2011). URL https://doi.org/10.1016/j.neuroimage.2011.05.078.
- [6] Ge, R., Zhang, H., Yao, L. & Long, Z. Motor imagery learning induced changes in functional connectivity of the default mode network. IEEE Transactions on Neural Systems and Rehabilitation Engineering 23, 138–148 (2015). URL https://ieeexplore.ieee.org/document/6849455.
- [7] McDougle, S. D., Ivry, R. B. & Taylor, J. A. Taking Aim at the Cognitive Side of Learning in Sensorimotor Adaptation Tasks. Trends in Cognitive Sciences 20, 535–544 (2016). URL http://dx.doi.org/10.1016/j.tics.2016.05.002.
- [8] Rizzolatti, G. & Luppino, G. The cortical motor system. Neuron 31, 889–901 (2001). URL http://dx.doi.org/10.1016/s0896-6273(01)00423-8.
- [9] Katiuscia, S. et al. Reorganization and enhanced functional connectivity of motor areas in repetitive ankle movements after training in locomotor attention. Brain Research 1297, 124–134 (2009). URL http://www.sciencedirect.com/science/article/pii/S0006899309017661.
- [10] Heitger, M. H. et al. Motor learning-induced changes in functional brain connectivity as revealed by means of graph-theoretical network analysis. Neuroimage 61, 633–650 (2012). URL https://doi.org/10.1016%2Fj.neuroimage.2012.03.067.
- [11] Sporns, O. & Betzel, R. F. Modular Brain Networks. Annual Review of Psychology 67, 613–640 (2016). URL http://dx.doi.org/10.1146/annurev-psych-122414-033634.
- [12] Gallen, C. L. & D’Esposito, M. Brain Modularity: A Biomarker of Intervention-related Plasticity. Trends in Cognitive Sciences (2019). URL http://www.sciencedirect.com/science/article/pii/S1364661319300427.
- [13] Bassett, D. S. et al. Dynamic reconfiguration of human brain networks during learning. Proceedings of the National Academy of Sciences of the United States of America 108, 7641–7646 (2011). URL http://www.ProceedingsoftheNationalAcademyofSciencesoftheUnitedStatesofAmerica.org/content/108/18/7641.
- [14] Bassett, D. S., Yang, M., Wymbs, N. F. & Grafton, S. T. Learning-induced autonomy of sensorimotor systems. Nature Neuroscience 18, 744–751 (2015). URL http://dx.doi.org/10.1038/nn.3993.
- [15] Hiremath, S. V. et al. Brain computer interface learning for systems based on electrocorticography and intracortical microelectrode arrays. Frontiers in Integrative Neuroscience 40 (2015). URL http://dx.doi.org/10.3389/fnint.2015.00040.
- [16] Sitaram, R. et al. Closed-loop brain training: the science of neurofeedback. Nature Reviews Neuroscience 18, 86–100 (2016). URL https://doi.org/10.1038%2Fnrn.2016.164.
- [17] Ito, H., Fujiki, S., Mori, Y. & Kansaku, K. Self-reorganization of neuronal activation patterns in the cortex under brain-machine interface and neural operant conditioning. Neuroscience Research (2020). URL http://dx.doi.org/10.1016/j.neures.2020.03.008.
- [18] Orsborn, A. L. & Pesaran, B. Parsing learning in networks using brain-machine interfaces. Current Opinion in Neurobiology 46, 76–83 (2017). URL http://dx.doi.org/10.1016/j.conb.2017.08.002.
- [19] Wander, J. D. et al. Distributed cortical adaptation during learning of a brain-computer interface task. Proceedings of the National Academy of Sciences of the United States of America 110, 10818–10823 (2013). URL https://doi.org/10.1073%2FProceedingsoftheNationalAcademyofSciencesoftheUnitedStatesofAmerica.1221127110.
- [20] Pichiorri, F. et al. Sensorimotor rhythm-based brain–computer interface training: the impact on motor cortical responsiveness. Journal of Neural Engineering 8, 025020 (2011). URL http://dx.doi.org/10.1088/1741-2560/8/2/025020.
- [21] Borgatti, S. P. & Everett, M. G. Models of core/periphery structures. Social Networks 21, 375–395 (2000). URL http://www.sciencedirect.com/science/article/pii/S0378873399000192.
- [22] Girvan, M. & Newman, M. E. J. Community structure in social and biological networks. Proceedings of the National Academy of Sciences of the United States of America 99, 7821–7826 (2002). URL https://www.ProceedingsoftheNationalAcademyofSciencesoftheUnitedStatesofAmerica.org/content/99/12/7821. Publisher: National Academy of Sciences Section: Physical Sciences.
- [23] De Domenico, M. et al. Mathematical Formulation of Multilayer Networks. Physical Review X 3, 041022 (2013). URL https://link.aps.org/doi/10.1103/PhysRevX.3.041022.
- [24] Boccaletti, S. et al. The structure and dynamics of multilayer networks. Physics Reports 544, 1–122 (2014). URL http://www.sciencedirect.com/science/article/pii/S0370157314002105.
- [25] Battiston, F., Nicosia, V., Chavez, M. & Latora, V. Multilayer motif analysis of brain networks. Chaos: An Interdisciplinary Journal of Nonlinear Science 27, 047404 (2017). URL https://aip.scitation.org/doi/10.1063/1.4979282.
- [26] Battiston Federico, Guillon Jeremy, Chavez Mario, Latora Vito & De Vico Fallani Fabrizio. Multiplex core–periphery organization of the human connectome. Journal of The Royal Society Interface 15, 20180514 (2018). URL https://royalsocietypublishing.org/doi/full/10.1098/rsif.2018.0514.
- [27] De Domenico, M., Sasai, S. & Arenas, A. Mapping Multiplex Hubs in Human Functional Brain Networks. Frontiers in Neuroscience 10 (2016). URL https://www.ncbi.nlm.nih.gov/pmc/articles/PMC4945645/.
- [28] De Domenico, M. Multilayer modeling and analysis of human brain networks. Gigascience 6, 1–8 (2017). URL https://www.ncbi.nlm.nih.gov/pmc/articles/PMC5437946/.
- [29] Tewarie, P. et al. Integrating cross-frequency and within band functional networks in resting-state MEG: A multi-layer network approach. Neuroimage 142, 324–336 (2016). URL http://dx.doi.org/10.1016/j.neuroimage.2016.07.057.
- [30] Guillon, J. et al. Loss of brain inter-frequency hubs in Alzheimer’s disease. Scientific Reports 7 (2017). URL https://www.nature.com/articles/s41598-017-07846-w.
- [31] Buldú, J. M. & Porter, M. A. Frequency-based brain networks: From a multiplex framework to a full multilayer description. Network Neuroscience 2, 418–441 (2018). URL https://www.ncbi.nlm.nih.gov/pmc/articles/PMC6147638/.
- [32] Guillon, J. et al. Disrupted core-periphery structure of multimodal brain networks in Alzheimer’s disease. Network Neuroscience 3, 635–652 (2019). URL http://dx.doi.org/10.1162/netn_a_00087. Publisher: MIT Press.
- [33] Cuffin, B. N. & Cohen, D. Comparison of the magnetoencephalogram and electroencephalogram. Electroencephalography and Clinical Neurophysiology 47, 132–146 (1979).
- [34] Geisler, C. D. & Gerstein, G. L. The surface EEG in relation to its sources. Electroencephalography and Clinical Neurophysiology 13, 927–934 (1961). URL http://dx.doi.org/10.1016/0013-4694(61)90199-7.
- [35] Delucchi, M. R., Garoutte, B. & Aird, R. B. The scalp as an electroencephalographic averager. Electroencephalography and Clinical Neurophysiology 14, 191–196 (1962).
- [36] Hämäläinen, M., Hari, R., Ilmoniemi, R. J., Knuutila, J. & Lounasmaa, O. V. Magnetoencephalography-theory, instrumentation, and applications to noninvasive studies of the working human brain. Reviews of Modern Physics 65, 413–497 (1993). URL http://dx.doi.org/10.1103/RevModPhys.65.413.
- [37] Wood, C. C., Cohen, D., Cuffin, B. N., Yarita, M. & Allison, T. Electrical sources in human somatosensory cortex: identification by combined magnetic and potential recordings. Science (New York, N.Y.) 227, 1051–1053 (1985). URL https://science.sciencemag.org/content/227/4690/1051.long.
- [38] Sharon, D., Hämäläinen, M. S., Tootell, R. B. H., Halgren, E. & Belliveau, J. W. The advantage of combining MEG and EEG: Comparison to fMRI in focally stimulated visual cortex. Neuroimage 36, 1225–1235 (2007). URL http://dx.doi.org/10.1016/j.neuroimage.2007.03.066.
- [39] Corsi, M.-C. et al. Integrating EEG and MEG Signals to Improve Motor Imagery Classification in Brain–Computer Interface. International Journal of Neural Systems 29, 1850014 (2018). URL https://www.worldscientific.com/doi/abs/10.1142/S0129065718500144.
- [40] Wolpaw, J. R., McFarland, D. J., Vaughan, T. M. & Schalk, G. The Wadsworth Center brain-computer interface (BCI) research and development program. IEEE Transactions on Neural Systems and Rehabilitation Engineering 11, 204–207 (2003). URL http://dx.doi.org/10.1109/TNSRE.2003.814442.
- [41] Schalk, G., McFarland, D. J., Hinterberger, T., Birbaumer, N. & Wolpaw, J. R. BCI2000: a general-purpose brain-computer interface (BCI) system. IEEE Transactions on Biomedical Engineering 51, 1034–1043 (2004). URL http://dx.doi.org/10.1109/TBME.2004.827072.
- [42] Oostenveld, R., Fries, P., Maris, E., Schoffelen, J.-M. & Oostenveld. FieldTrip: Open Source Software for Advanced Analysis of MEG, EEG, and Invasive Electrophysiological Data. Computational Intelligence and Neuroscience 2011, e156869 (2010). URL http://www.hindawi.com/journals/cin/2011/156869/abs/.
- [43] Gross, J. et al. Good practice for conducting and reporting MEG research. Neuroimage 65, 349–363 (2013). URL http://dx.doi.org/10.1016/j.neuroimage.2012.10.001.
- [44] Fischl, B. FreeSurfer. Neuroimage 62, 774–781 (2012). URL http://www.sciencedirect.com/science/article/pii/S1053811912000389.
- [45] Tadel, F., Baillet, S., Mosher, J. C., Pantazis, D. & Leahy, R. M. Brainstorm: A User-Firendly Application for MEG/EEG Analysis. Computational Intelligence and Neuroscience 2011 (2011). URL http://dx.doi.org/10.1155/2011/879716.
- [46] Corsi, M.-C. et al. Functional disconnection of associative cortical areas predicts performance during BCI training. Neuroimage 209, 116500 (2020). URL http://www.sciencedirect.com/science/article/pii/S1053811919310912.
- [47] Taulu, S. & Simola, J. Spatiotemporal signal space separation method for rejecting nearby interference in MEG measurements. Physics in Medicine & Biology 51, 1759–1768 (2006). URL http://dx.doi.org/10.1088/0031-9155/51/7/008.
- [48] Bell, A. J. & Sejnowski, T. J. An information-maximization approach to blind separation and blind deconvolution. Neural Computation 7, 1129–1159 (1995).
- [49] Fuchs, M., Wagner, M. & Kastner, J. Boundary element method volume conductor models for EEG source reconstruction. Clinical Neurophysiology 112, 1400–1407 (2001). URL http://www.sciencedirect.com/science/article/pii/S1388245701005892.
- [50] Gramfort, A., Papadopoulo, T., Olivi, E. & Clerc, M. OpenMEEG: opensource software for quasistatic bioelectromagnetics. BioMedical Engineering OnLine 9, 45 (2010). URL http://dx.doi.org/10.1186/1475-925X-9-45.
- [51] Fuchs, M., Wagner, M., Köhler, T. & Wischmann, H.-A. Linear and nonlinear current density reconstructions. Journal of Clinical Neurophysiology 16, 267–295 (1999).
- [52] Lin, F.-H. et al. Assessing and improving the spatial accuracy in MEG source localization by depth-weighted minimum-norm estimates. Neuroimage 31, 160–171 (2006). URL http://dx.doi.org/10.1016/j.neuroimage.2005.11.054.
- [53] Gramfort, A. et al. MNE software for processing MEG and EEG data. Neuroimage 86, 446–460 (2014). URL http://dx.doi.org/10.1016/j.neuroimage.2013.10.027.
- [54] Destrieux, C., Fischl, B., Dale, A. & Halgren, E. Automatic parcellation of human cortical gyri and sulci using standard anatomical nomenclature. Neuroimage 53, 1–15 (2010). URL https://www.ncbi.nlm.nih.gov/pmc/articles/PMC2937159/.
- [55] Sekihara, K., Owen, J., Trisno, S. & Nagarajan, S. S. Removal of spurious coherence in MEG source-space coherence analysis. IEEE transactions on bio-medical engineering 58, 3121–3129 (2011). URL https://www.ncbi.nlm.nih.gov/pmc/articles/PMC4096348/.
- [56] Kennedy, J. & Eberhart, R. Particle swarm optimization. In Proceedings of ICNN’95 - International Conference on Neural Networks, vol. 4, 1942–1948 vol.4 (1995). URL http://dx.doi.org/10.1109/ICNN.1995.488968. ISSN: null.
- [57] Rubinov, M. & Sporns, O. Complex network measures of brain connectivity: Uses and interpretations. Neuroimage 52, 1059–1069 (2010). URL http://www.sciencedirect.com/science/article/pii/S105381190901074X.
- [58] Klimesch, W. EEG alpha and theta oscillations reflect cognitive and memory performance: a review and analysis. Brain Research Reviews 29, 169–195 (1999). URL http://www.sciencedirect.com/science/article/pii/S0165017398000563.
- [59] Pichiorri, F. et al. Brain-computer interface boosts motor imagery practice during stroke recovery. Annals of Neurology 77, 851–865 (2015). URL http://dx.doi.org/10.1002/ana.24390.
- [60] Shapiro, S. S. & Wilk, M. B. An analysis of variance test for normality (complete samples). Biometrika 52, 591–611 (1965). URL https://academic.oup.com/biomet/article/52/3-4/591/336553. Publisher: Oxford Academic.
- [61] Bakdash, J. Z. & Marusich, L. R. Repeated Measures Correlation. Frontiers in Psychology 8 (2017). URL https://www.frontiersin.org/articles/10.3389/fpsyg.2017.00456/full.
- [62] Benjamini, Y. & Yekutieli, D. The Control of the False Discovery Rate in Multiple Testing under Dependency. The Annals of Statistics 29, 1165–1188 (2001). URL https://www.jstor.org/stable/2674075.
- [63] McAuley, E. Z. et al. Association between the serotonin 2a receptor gene and bipolar affective disorder in an Australian cohort. Psychiatric Genetics 19, 244–252 (2009).
- [64] Sanders, M. S., van Well, G. T., Ouburg, S., Morré, S. A. & van Furth, A. M. Toll-like receptor 9polymorphisms are associated with severity variables in a cohort of meningococcal meningitis survivors. BMC Infectious Diseases 12, 112 (2012). URL https://doi.org/10.1186/1471-2334-12-112.
- [65] Matthews, D. E. & Farewell, V. T. Using and Understanding Medical Statistics (Karger Medical and Scientific Publishers, 2015). Google-Books-ID: DL8nCgAAQBAJ.
- [66] Müller-putz, G. R., Scherer, R., Brunner, C., Leeb, R. & Pfurtscheller, G. Better than random: a closer look on BCI results. International Journal of Bioelectromagnetism 10 (2008). URL http://citeseerx.ist.psu.edu/viewdoc/download?doi=10.1.1.330.3349&rep=rep1&type=pdf.
- [67] Aminoff, E. M., Kveraga, K. & Bar, M. The role of the parahippocampal cortex in cognition. Trends in Cognitive Sciences 17, 379–390 (2013). URL https://www.ncbi.nlm.nih.gov/pmc/articles/PMC3786097/.
- [68] Kolling, N., Behrens, T. E., Wittmann, M. K. & Rushworth, M. F. Multiple signals in anterior cingulate cortex. Current Opinion in Neurobiology 37, 36–43 (2016). URL http://www.sciencedirect.com/science/article/pii/S0959438815001853.
- [69] Uddin, L. Q., Nomi, J. S., Hebert-Seropian, B., Ghaziri, J. & Boucher, O. Structure and function of the human insula. Journal of Clinical Neurophysiology 34, 300–306 (2017). URL https://www.ncbi.nlm.nih.gov/pmc/articles/PMC6032992/.
- [70] Du, J. et al. Functional connectivity of the orbitofrontal cortex, anterior cingulate cortex, and inferior frontal gyrus in humans. Cortex 123, 185–199 (2020). URL http://www.sciencedirect.com/science/article/pii/S001094521930365X.
- [71] Bonnefond, M. et al. What MEG can reveal about inference making: The case of if…then sentences. Human Brain Mapping 34, 684–697 (2012). URL https://www.ncbi.nlm.nih.gov/pmc/articles/PMC6870271/.
- [72] Nee, D. E. et al. A Meta-analysis of Executive Components of Working Memory. Cerebral Cortex 23, 264–282 (2013). URL https://academic.oup.com/cercor/article/23/2/264/283011. Publisher: Oxford Academic.
- [73] Milivojevic, B., Hamm, J. P. & Corballis, M. C. Functional neuroanatomy of mental rotation. Journal of Cognitive Neuroscience 21, 945–959 (2009). URL http://dx.doi.org/10.1162/jocn.2009.21085.
- [74] Wilson, R. C., Takahashi, Y. K., Schoenbaum, G. & Niv, Y. Orbitofrontal Cortex as a Cognitive Map of Task Space. Neuron 81, 267–279 (2014). URL http://www.sciencedirect.com/science/article/pii/S0896627313010398.
- [75] Christophel, T. B., Klink, P. C., Spitzer, B., Roelfsema, P. R. & Haynes, J.-D. The Distributed Nature of Working Memory. Trends in Cognitive Sciences 21, 111–124 (2017). URL http://www.sciencedirect.com/science/article/pii/S1364661316302170.
- [76] Euston, D. R., Gruber, A. J. & McNaughton, B. L. The Role of Medial Prefrontal Cortex in Memory and Decision Making. Neuron 76, 1057–1070 (2012). URL https://www.cell.com/neuron/abstract/S0896-6273(12)01108-7.
- [77] Stephan, K. M. et al. Functional anatomy of the mental representation of upper extremity movements in healthy subjects. Journal of Neurophysiology 73, 373–386 (1995). URL http://dx.doi.org/10.1152/jn.1995.73.1.373.
- [78] Johnson, S. H. et al. Selective activation of a parietofrontal circuit during implicitly imagined prehension. Neuroimage 17, 1693–1704 (2002). URL https://www.sciencedirect.com/science/article/abs/pii/S1053811902912656?via%3Dihub.
- [79] Solodkin, A., Hlustik, P., Chen, E. E. & Small, S. L. Fine modulation in network activation during motor execution and motor imagery. Cerebral Cortex 14, 1246–1255 (2004). URL http://dx.doi.org/10.1093/cercor/bhh086.
- [80] Rizzolatti, G. et al. Localization of grasp representations in humans by PET: 1. Observation versus execution. Experimental Brain Research 111, 246–252 (1996). URL https://doi.org/10.1007/BF00227301.
- [81] Silver, M. A., Ress, D. & Heeger, D. J. Neural correlates of sustained spatial attention in human early visual cortex. Journal of Neurophysiology 97, 229–237 (2007). URL http://dx.doi.org/10.1152/jn.00677.2006.
- [82] Yousry, T. A. et al. Localization of the motor hand area to a knob on the precentral gyrus. A new landmark. Brain 120, 141–157 (1997). URL https://academic.oup.com/brain/article/120/1/141/312820.
- [83] Lotze, M. & Halsband, U. Motor imagery. Journal of Physiology-Paris 99, 386–395 (2006). URL http://www.sciencedirect.com/science/article/pii/S0928425706000210.
- [84] van de Nieuwenhuijzen, M. E. et al. MEG-based decoding of the spatiotemporal dynamics of visual category perception. Neuroimage 83, 1063–1073 (2013). URL https://www.sciencedirect.com/science/article/abs/pii/S1053811913008446?via%3Dihub.
- [85] Allison, B. Z. & Neuper, C. Could Anyone Use a BCI? In Tan, D. S. & Nijholt, A. (eds.) Brain-Computer Interfaces, Human-Computer Interaction Series, 35–54 (Springer London, 2010). URL http://link.springer.com/chapter/10.1007/978-1-84996-272-8_3.
- [86] Ganguly, K. & Carmena, J. M. Emergence of a stable cortical map for neuroprosthetic control. PLoS Biology 7, e1000153 (2009). URL http://journals.plos.org/plosbiology/article?id=10.1371/journal.pbio.1000153.
- [87] Carmena, J. M. et al. Learning to control a brain-machine interface for reaching and grasping by primates. PLoS Biology 1, E42 (2003). URL http://journals.plos.org/plosbiology/article?id=10.1371/journal.pbio.0000042.
- [88] Perdikis, S. & Millan, J. d. R. Brain-Machine Interfaces: A Tale of Two Learners. IEEE Systems, Man, and Cybernetics Magazine 6, 12–19 (2020). URL https://ieeexplore.ieee.org/document/9141465. IEEE Systems, Man, and Cybernetics Magazine.
- [89] Dayan, P. & Niv, Y. Reinforcement learning: the good, the bad and the ugly. Current Opinion in Neurobiology 18, 185–196 (2008). URL http://dx.doi.org/10.1016/j.conb.2008.08.003.
- [90] Stiso, J. et al. Learning in brain-computer interface control evidenced by joint decomposition of brain and behavior. Journal of Neural Engineering (2020). URL http://dx.doi.org/10.1088/1741-2552/ab9064.
- [91] van den Heuvel, M. P. & Sporns, O. Network hubs in the human brain. Trends in Cognitive Sciences 17, 683–696 (2013). URL http://dx.doi.org/10.1016/j.tics.2013.09.012.
- [92] van den Heuvel, M. P. & Hulshoff Pol, H. E. Exploring the brain network: A review on resting-state fMRI functional connectivity. European Neuropsychopharmacology 20, 519–534 (2010). URL http://www.sciencedirect.com/science/article/pii/S0924977X10000684.
- [93] van den Heuvel, M. P. et al. Abnormal rich club organization and functional brain dynamics in schizophrenia. JAMA Psychiatry 70, 783–792 (2013). URL http://dx.doi.org/10.1001/jamapsychiatry.2013.1328.
- [94] Klimesch, W., Sauseng, P. & Hanslmayr, S. EEG alpha oscillations: the inhibition-timing hypothesis. Brain Res Rev 53, 63–88 (2007). URL https://www.sciencedirect.com/science/article/abs/pii/S016501730600083X?via%3Dihub.
- [95] Jensen, O. & Mazaheri, A. Shaping Functional Architecture by Oscillatory Alpha Activity: Gating by Inhibition. Frontiers in Human Neuroscience 4 (2010). URL https://www.frontiersin.org/articles/10.3389/fnhum.2010.00186/full#B28. Publisher: Frontiers.
- [96] Haegens, S., Nácher, V., Luna, R., Romo, R. & Jensen, O. -Oscillations in the monkey sensorimotor network influence discrimination performance by rhythmical inhibition of neuronal spiking. Proceedings of the National Academy of Sciences of the United States of America 108, 19377–19382 (2011). URL https://www.pnas.org/content/early/2011/11/09/1117190108.
- [97] Spitzer, B. & Haegens, S. Beyond the Status Quo: A Role for Beta Oscillations in Endogenous Content (Re)Activation. eNeuro 4 (2017). URL https://www.ncbi.nlm.nih.gov/pmc/articles/PMC5539431/.
- [98] Engel, A. K. & Fries, P. Beta-band oscillations–signalling the status quo? Current Opinion in Neurobiology 20, 156–165 (2010). URL https://www.sciencedirect.com/science/article/abs/pii/S0959438810000395?via%3Dihub.
- [99] Donner, T. H. et al. Population activity in the human dorsal pathway predicts the accuracy of visual motion detection. Journal of Neurophysiology 98, 345–359 (2007). URL https://journals.physiology.org/doi/full/10.1152/jn.01141.2006.
- [100] Piantoni, G., Kline, K. A. & Eagleman, D. M. Beta oscillations correlate with the probability of perceiving rivalrous visual stimuli. Journal of Vision 10, 18 (2010). URL https://jov.arvojournals.org/article.aspx?articleid=2191657.
- [101] Siegel, M., Warden, M. R. & Miller, E. K. Phase-dependent neuronal coding of objects in short-term memory. Proceedings of the National Academy of Sciences of the United States of America 106, 21341–21346 (2009). URL https://www.pnas.org/content/106/50/21341.
- [102] Muthuraman, M. et al. Beamformer source analysis and connectivity on concurrent EEG and MEG data during voluntary movements. PloS One 9 (2014). URL http://dx.doi.org/10.1371/journal.pone.0091441.
- [103] Coquelet, N. et al. Comparing MEG and high-density EEG for intrinsic functional connectivity mapping. Neuroimage 116556 (2020). URL http://www.sciencedirect.com/science/article/pii/S1053811920300434.
- [104] Perdikis, S., Leeb, R. & Millán, J. d. R. Subject-oriented training for motor imagery brain-computer interfaces. Conference Proceedings IEEE Engineering in Medicine and Biology Society 2014, 1259–1262 (2014). URL http://dx.doi.org/10.1109/EMBC.2014.6943826.
- [105] De Vico Fallani, F. & Bassett, D. S. Network neuroscience for optimizing brain-computer interfaces. Physics of Life Reviews (2019). URL http://www.sciencedirect.com/science/article/pii/S1571064519300016.
- [106] Benaroch, C., Jeunet, C. & Lotte, F. Are users’ traits informative enough to predict/explain their mental-imagery based BCI performances? In GBCIC 2019, 7 (2019).
- [107] Ahn, M., Cho, H., Ahn, S. & Jun, S. C. High theta and low alpha powers may be indicative of BCI-illiteracy in motor imagery. PLoS ONE 8, e80886 (2013). URL http://dx.doi.org/10.1371/journal.pone.0080886.
- [108] Jeunet, C., N’Kaoua, B., Subramanian, S., Hachet, M. & Lotte, F. Predicting Mental Imagery-Based BCI Performance from Personality, Cognitive Profile and Neurophysiological Patterns. PLoS ONE 10, e0143962 (2015). URL http://dx.doi.org/10.1371/journal.pone.0143962.
- [109] Sugata, H. et al. Alpha band functional connectivity correlates with the performance of brain-machine interfaces to decode real and imagined movements. Frontiers in Human Neuroscience 8 (2014). URL https://doi.org/10.3389%2Ffnhum.2014.00620.
- [110] De Vico Fallani, F. et al. Multiscale topological properties of functional brain networks during motor imagery after stroke. Neuroimage 83, 438–449 (2013). URL http://dx.doi.org/10.1016/j.neuroimage.2013.06.039.
- [111] Li, J. et al. Probabilistic diffusion tractography reveals improvement of structural network in musicians. PLoS ONE 9, e105508 (2014). URL https://journals.plos.org/plosone/article?id=10.1371/journal.pone.0105508.
- [112] Calmels, C. Neural correlates of motor expertise: Extensive motor training and cortical changes. Brain Research 1739, 146323 (2020). URL http://www.sciencedirect.com/science/article/pii/S0006899319303695.
- [113] Hétu, S. et al. The neural network of motor imagery: an ALE meta-analysis. Neuroscience & Biobehavioral Reviews 37, 930–949 (2013). URL http://dx.doi.org/10.1016/j.neubiorev.2013.03.017.
- [114] Hardwick, R. M., Caspers, S., Eickhoff, S. B. & Swinnen, S. P. Neural correlates of action: Comparing meta-analyses of imagery, observation, and execution. Neuroscience & Biobehavioral Reviews 94, 31–44 (2018). URL http://www.sciencedirect.com/science/article/pii/S0149763417309284.
- [115] Dayan, E. & Cohen, L. G. Neuroplasticity subserving motor skill learning. Neuron 72, 443–454 (2011). URL https://www.ncbi.nlm.nih.gov/pmc/articles/PMC3217208/.
- [116] van Zomeren, A. H. & Brouwer, W. H. Clinical neuropsychology of attention. Clinical neuropsychology of attention (Oxford University Press, New York, NY, US, 1994).
- [117] Wolpert, D. M. & Landy, M. S. Motor Control is Decision-Making. Current Opinion in Neurobiology 22, 996–1003 (2012). URL https://www.ncbi.nlm.nih.gov/pmc/articles/PMC3434279/.
- [118] Guillot, A. & Collet, C. (eds.) The neurophysiological foundations of mental and motor imagery (Oxford University Press, Oxford, New York, 2010).
- [119] Wulf, G. Attention and motor skill learning. Attention and motor skill learning (Human Kinetics, Champaign, IL, US, 2007).
- [120] Lohse, K. R., Jones, M., Healy, A. F. & Sherwood, D. E. The role of attention in motor control. Journal of Experimental Psychology: General 143, 930–948 (2014). URL http://dx.doi.org/10.1037/a0032817.
- [121] Dayan, P., Kakade, S. & Montague, P. R. Learning and selective attention. Nature Neuroscience 3, 1218–1223 (2000). URL https://www.nature.com/articles/nn1100_1218.
- [122] Gottlieb, J. Attention, Learning, and the Value of Information. Neuron 76, 281–295 (2012). URL http://www.sciencedirect.com/science/article/pii/S0896627312008884.
- [123] Yin, H. H. et al. Dynamic reorganization of striatal circuits during the acquisition and consolidation of a skill. Nature Neuroscience 12, 333–341 (2009). URL https://www.ncbi.nlm.nih.gov/pmc/articles/PMC2774785/.
- [124] Boto, E. et al. A new generation of magnetoencephalography: Room temperature measurements using optically-pumped magnetometers. NeuroImage 149, 404 – 414 (2017). URL http://www.sciencedirect.com/science/article/pii/S1053811917300411.
- [125] Labyt, E. et al. Magnetoencephalography with optically pumped 4He magnetometers at ambient temperature. IEEE Transactions on Medical Imaging (2018). URL https://ieeexplore.ieee.org/document/8411463.
- [126] Boto, E. et al. Wearable neuroimaging: Combining and contrasting magnetoencephalography and electroencephalography. Neuroimage 116099 (2019). URL http://www.sciencedirect.com/science/article/pii/S1053811919306901.
- [127] Tierney, T. M. et al. Optically pumped magnetometers: From quantum origins to multi-channel magnetoencephalography. Neuroimage (2019). URL http://www.sciencedirect.com/science/article/pii/S1053811919304550.
- [128] Mitchell, S. M., Lange, S. & Brus, H. Gendered citation patterns in international relations journals. International Studies Perspectives 14, 485–492 (2013).
- [129] Dion, M. L., Sumner, J. L. & Mitchell, S. M. Gendered citation patterns across political science and social science methodology fields. Political Analysis 26, 312–327 (2018).
- [130] Caplar, N., Tacchella, S. & Birrer, S. Quantitative evaluation of gender bias in astronomical publications from citation counts. Nature Astronomy 1, 0141 (2017).
- [131] Maliniak, D., Powers, R. & Walter, B. F. The gender citation gap in international relations. International Organization 67, 889–922 (2013).
- [132] Dworkin, J. D. et al. The extent and drivers of gender imbalance in neuroscience reference lists. bioRxiv (2020). URL https://www.biorxiv.org/content/early/2020/01/11/2020.01.03.894378. https://www.biorxiv.org/content/early/2020/01/11/2020.01.03.894378.full.pdf.
- [133] Zhou, D. et al. Gender diversity statement and code notebook v1.0 (2020). URL https://doi.org/10.5281/zenodo.3672110.
- [134] Ambekar, A., Ward, C., Mohammed, J., Male, S. & Skiena, S. Name-ethnicity classification from open sources. In Proceedings of the 15th ACM SIGKDD international conference on Knowledge Discovery and Data Mining, 49–58 (2009).
- [135] Sood, G. & Laohaprapanon, S. Predicting race and ethnicity from the sequence of characters in a name. arXiv preprint arXiv:1805.02109 (2018).
Acknowledgments
This work was partially supported by French program ”Investissements d’avenir” ANR-10-IAIHU-06; ”ANR-NIH CRCNS” ANR-15-NEUC-0006-02 and by NICHD 1R01HD086888-01. The funders had no role in study design, data collection and analysis, decision to publish, or preparation of the manuscript. This work was performed on a platform of France Life Imaging network partly funded by the grant ”ANR-11-INBS-0006”.
Citation Diversity Statement
Recent work in several fields of science has identified a bias in citation practices such that papers from women and other minority scholars are under-cited relative to the number of such papers in the field [128, 129, 130, 131, 132]. Here we sought to proactively consider choosing references that reflect the diversity of the field in thought, form of contribution, gender, race, ethnicity, and other factors. We used automatic classification of gender based on the first names of the first and last authors [132, 133], with possible combinations including man/ man, man/woman, woman/man, and woman/woman. Code for this classification is open source and available online [133]. By this measure (and excluding self-citations to the first and last authors of our current paper), our references contain 4.96% woman(first)/woman(last), 13.24% man/woman, 16.34% woman/man, and 65.47% man/man. Second, we obtained predicted racial/ethnic category of the first and last author of each reference by databases that store the probability of a first and last name being carried by an author of color [134, 135]. By this measure (and excluding self-citations), our references contain 12.99% author of color (first)/author of color(last), 14.83% white author/author of color, 21.91% author of color/white author, and 50.26% white author/white author. We look forward to future work that could help us to better understand how to support equitable practices in science.
Authors contributions
MC, DS, NG, LH, SD, DSB and FDVF initiated research; MCC, MC, DS, LH, DSB and FDVF designed research; MCC, DS and LH performed research; MCC, DS, LH and AEK contributed analytic tools; MCC and AEK analyzed data; and MCC, DSB, and FDVF wrote the paper. All authors revised and approved the manuscript.
Additional Information
Supplementary Information accompanies this paper.