Go Figure: A Meta Evaluation of Factuality in Summarization
Abstract
While neural language models can generate text with remarkable fluency and coherence, controlling for factual correctness in generation remains an open research question. This major discrepancy between the surface-level fluency and the content-level correctness of neural generation has motivated a new line of research that seeks automatic metrics for evaluating the factuality of machine text. In this paper, we introduce Go Figure, a meta-evaluation framework for evaluating factuality evaluation metrics. We propose five necessary conditions to evaluate factuality metrics on diagnostic factuality data across three different summarization tasks. Our benchmark analysis on ten factuality metrics reveals that our meta-evaluation framework provides a robust and efficient evaluation that is extensible to multiple types of factual consistency and standard generation metrics, including QA metrics. It also reveals that while QA metrics generally improve over standard metrics that measure factuality across domains, performance is highly dependent on the way in which questions are generated.
1 Introduction
The goal of text generation systems is to produce text that is fluent, coherent, relevant, as well as factually correct. Recent progress in neural approaches to building semantically constrained text generation systems has shown tremendous improvements in this direction Liu and Lapata (2019); Guo et al. (2018); Durmus et al. (2020); Wang et al. (2020). However, an important issue in text generation systems is that they can yield factually inconsistent text, caused by somewhat distorted or fabricated facts about the source text. Especially in document summarization tasks, models that abstract away salient aspects, have been shown to generate text with up to 30% factual inconsistencies (Kryscinski et al., 2019; Falke et al., 2019a; Zhu et al., 2020).
Commonly used metrics for measuring quality of generated text fail to capture structural aspects of language like negation and poorly correlate with human judgements Hashimoto et al. (2019); Clark et al. (2019); Sellam et al. (2020), leading to a rapidly progressing search for factuality-driven summarization metrics.
In this work, we propose GO FIGURE111General Outline for Factuality In Generative UndeRstanding Evaluation., a meta-evaluation framework for assessing the effectiveness of factuality metrics across multiple domains - extreme summarization, multi-sentence news summarization and the understudied dialogue summarization domain. Our contributions are as follows: (i) a set of diagnostics for measuring sensitivity of metrics to factual inconsistency, (ii) a diagnostic evaluation dataset of context/summary pairs for measuring effectiveness of new factuality metrics in a controlled setting, and (iii) an evaluation dataset of summaries generated by transformer-based models Raffel et al. (2019) annotated with types of factual errors.
2 Factuality Metric Meta Evaluation
Since reference summaries may be an incomplete representation of the salient facts in a source document or unavailable, we consider factuality in terms of how well candidate summaries are factually grounded with respect to the source document.
| Condition | Definition | \bcloupe Motivation |
|---|---|---|
| Boundedness (I) | There exists such that . | In general, the exact factuality level of may be unclear. Metric bounds provide points of comparison. |
| Sensitivity (II) | The metric value for should correlate with the level of factuality captured by . | A bounded but insensitive factuality metric may assign higher values to mostly nonfactual or unrelated summaries over summaries that are close to the reference. |
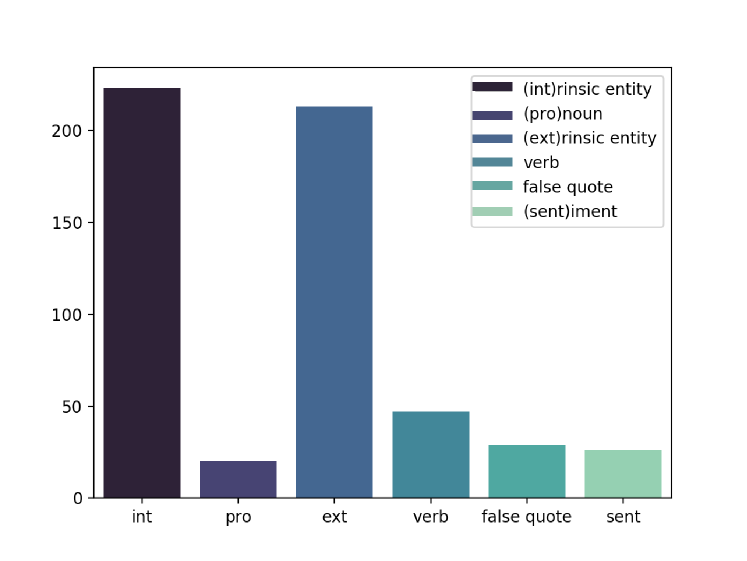
| Robustness (III) | The metric should be robust across types of factual errors. | A metric that is sensitive only to a subset of errors might ignore a significant number of model-generated errors (Figure 1). |
| Generality (IV) | The metric should satisfy conditions I,II,III and V across domains. | Prior work such as Reiter and Belz (2009) highlight the risk of claiming validity without testing generality. |
| Human Correlation (V) | The metric should correlate with human judgements of factuality. | The scoring function represented by human evaluation is a gold standard for assessment of generation quality Chaganty et al. (2018), so should be an approximation. |
We define a set of five conditions for a factual consistency metric to measure factuality of a summary with respect to a source document . These conditions are given in Table 1.
2.1 Testing Factuality Metric Validity
For the purposes of testing boundedness (Condition I), we define the Lower Bound for a metric as where is the source document and is a randomly sampled summary from the corpus.222While this may not be the strictest lower bound in theoretical terms, we consider it appropriate as an empirical lower bound since the content is irrelevant to the document. A single random summary is used. We define the Upper Bound for the metric as , where is the reference ground-truth summary. Since our controlled experiments use transformed versions of the reference summary with injected errors, the original reference is guaranteed to be at least as factually consistent as a transformed summary.
To test sensitivity (Condition II), we measure the correlation (Pearson’s r) between the factual inconsistency level333For our experiments, we inject up to a maximum of errors with . of the summaries (i.e. the number of injected errors) and the average metric score. Then we measure statistical significance using the p-value from a two-tailed hypothesis test. We check whether metrics satisfy robustness and generality (Conditions III and IV) by separately running this analysis over multiple domains and the factual error types shown in Figure 1. We measure how well metric values match human assessment of factuality by checking the correlation between factual consistency levels determined using manual annotation.
2.2 Theoretical Cases
For Condition I, we scope boundedness to only consider cases that are likely to arise in realistic summarization settings. However, there are hypothetical cases that may have ramifications for metric validity. For example, we expect that and for a metric with values in the range , a document , and an empty string summary . For non-deterministic metrics, restrictions on variability between runs may also be desired.
3 Evaluation Datasets
We evaluate metrics on three datasets: 1-sentence BBC news summaries from the XSUM extreme summarization dataset Narayan et al. (2018), multi-sentence summaries from the CNN/DailyMail dataset Nallapati et al. (2016), and the recently released SAMSUM corpus Gliwa et al. (2019) consisting of English language conversations written by linguists and aligned multi-sentence summaries.
| CLOZE | QA | STANDARD and CONTEXTUAL | ||||||||
| BLANC-Help | BLANC-Tune | SummaQA-C | SummaQA-F1 | FEQA | R-1 | R-2 | R-3 | R-L | BERTScore | |
| Upper Bound | 5.99 | 1.73 | 9.64 | 4.48 | 27.87 | 10.61 | 2.56 | 0.72 | 9.32 | 83.76 |
| Level 1 | 5.73 / 5.98 | 1.74 / 1.71 | 9.44 / 9.44 | 3.80 / 4.31 | 23.20 / 26.94 | 10.49 / 10.76 | 2.54 / 2.56 | 0.70 | 9.22 / 9.42 | 83.53 / 83.56 |
| Level 2 | 5.46 / 5.99 | 1.59 / 1.78 | 9.27 / 9.35 | 3.40 / 4.22 | 20.05 / 26.55 | 10.40 / 10.86 | 2.51 / 2.54 | 0.69 / 0.68 | 9.16 / 9.49 | 83.36 / 83.38 |
| Level 3 | 5.30 / 5.97 | 1.58 / 1.76 | 9.16 / 9.23 | 3.13 / 4.14 | 15.81 / 26.06 | 10.33 / 10.92 | 2.49 / 2.52 | 0.69 / 0.67 | 9.10 / 9.55 | 83.21 / 83.26 |
| Lower Bound | 0.51 | -0.14 | 1.28 | 0.26 | 1.18 | 5.44 | 0.39 | 0.01 | 4.94 | 80.08 |
| Correlation | -0.99 / -0.61 | -0.88 / 0.69 | -0.99 / -1.00 | -0.99 / -1.00 | -1.00 | -1.00 / 0.98 | -0.97 / -1.00 | -0.87 / -1.00 | -1.00 / 1.00 | -1.00 |
| p-value | 0.09 / 0.59 | 0.32 / 0.51 | 0.07 / 0.05* | 0.07 / 0.03* | 0.05* / 0.04* | 0.03* / 0.10 | 0.16 / 0.05* | 0.33 / 0.05* | 0.01** / 0.02* | 0.02* / 0.06 |
| CLOZE | QA | STANDARD and CONTEXTUAL | ||||||||
| BLANC-Help | BLANC-Tune | SummaQA-C | SummaQA-F1 | FEQA | R-1 | R-2 | R-3 | R-L | BERTScore | |
| Upper Bound | 7.60 | 5.79 | 13.82 | 10.87 | 37.56 | 14.33 | 8.08 | 4.75 | 13.83 | 84.36 |
| Level 1 | 7.29 / 7.50 | 5.56 / 5.69 | 13.30 / 13.53 | 9.58 / 10.63 | 33.35 / 36.64 | 14.11 / 14.37 | 7.78 / 7.91 | 4.51 / 4.57 | 13.60 / 13.84 | 84.13 / 84.20 |
| Level 2 | 7.03 / 7.43 | 5.43 / 5.58 | 12.93 / 13.24 | 8.53 / 10.38 | 28.46 / 36.13 | 13.95 / 14.38 | 7.55 / 7.75 | 4.32 / 4.40 | 13.44 / 13.85 | 83.94 / 84.04 |
| Level 3 | 6.72 / 7.38 | 5.23 / 5.53 | 12.54 / 13.04 | 7.54 / 10.26 | 25.12 / 35.63 | 13.82 / 14.38 | 7.35 / 7.62 | 4.14 / 4.27 | 13.29 / 13.85 | 83.77 / 83.90 |
| Lower Bound | -0.67 | -0.19 | 1.61 | 0.12 | 0.58 | 5.85 | 0.47 | 0.02 | 5.55 | 78.16 |
| Correlation | -1.00 / -0.99 | -0.99 / -0.97 | -1.00 / -1.00 | -1.00 / -0.98 | -0.99 / -1.00 | -1.00 / 0.96 | -1.00 | -1.00 | -1.00 / 0.91 | -1.00 |
| p-value | 0.03* / 0.08 | 0.07 / 0.17 | 0.01** / 0.06 | 0.01** / 0.13 | 0.07 / 0.01** | 0.04* / 0.17 | 0.02* / 0.04* | 0.01** / 0.04* | 0.03* / 0.27 | 0.01** / 0.02* |
| CLOZE | QA | STANDARD and CONTEXTUAL | ||||||||
| BLANC-Help | BLANC-Tune | SummaQA-C | SummaQA-F1 | FEQA | R-1 | R-2 | R-3 | R-L | BERTScore | |
| Upper Bound | 15.23 | 10.13 | 13.83 | 17.23 | 55.36 | 26.55 | 8.24 | 4.07 | 25.06 | 84.60 |
| Level 1 | 13.97 / 15.03 | 9.00 / 9.47 | 13.48 / 13.52 | 15.00 / 16.71 | 45.31 / 54.25 | 25.31 / 26.18 | 7.85 / 7.86 | 3.84 / 3.73 | 23.91 / 24.69 | 84.42 / 84.38 |
| Level 2 | 12.87 / 15.01 | 8.36 / 9.46 | 13.16 / 13.26 | 12.26 / 16.50 | 37.01 / 53.10 | 24.27 / 25.86 | 7.60 / 7.59 | 3.68 / 3.50 | 22.99 / 24.38 | 84.28 / 84.19 |
| Level 3 | 12.02 / 14.93 | 7.74 / 9.36 | 12.99 / 13.21 | 10.12 / 16.24 | 29.62 / 52.34 | 23.23 / 25.58 | 7.32 / 7.36 | 3.48 / 3.35 | 22.01 / 24.12 | 84.13 / 84.07 |
| Lower Bound | 0.92 | -0.53 | 7.86 | 0.10 | 0.55 | 5.33 | 0.23 | 0.01 | 5.09 | 80.79 |
| Correlation | -1.00 / -0.96 | -1.00 / -0.91 | -0.99 / -0.94 | -1.00 | -1.00 / -0.99 | -1.00 | -1.00 | -1.00 / -0.99 | -1.00 | -1.00/-0.99 |
| p-value | 0.05* / 0.18 | 0.01** / 0.28 | 0.11 / 0.23 | 0.05* | 0.02* / 0.07 | 0.01** / 0.03* | 0.03* | 0.05* / 0.08 | 0.01** / 0.04* | 0.01** / 0.07 |
3.1 Diagnostic Datasets
To test the ability of proposed metrics to fulfill our predefined conditions, we set up two diagnostic datasets consisting of (i) transformed reference summaries with simulated factuality errors that allow us to induce and measure factuality levels in a controlled setting and (ii) summaries generated by state-of-the-art transformer summarization models that allows us to measure the effectiveness of metrics in a real data setting. We sample 500 source / summary pairs for each domain.444See the Appendix for details of linguistic feature extraction for injecting errors.
3.1.1 Model-Generated Datasets
In order to observe how metrics perform on machine-generated summaries, we generate summaries from fine-tuned T5 encoder-decoder summarization models Raffel et al. (2019) that was pretrained on news summarization data. We generate summary text using either beam search or sample-based decoding strategies. We then annotate the generated summaries for fine-grained factual errors using the types in Figure 1 to create a hand-curated factual consistency diagnostic dataset.
4 Factuality Metrics for Evaluation
We mainly focus on meta-evaluating most recently proposed factual consistency metrics which use two types of proxy natural language understanding (NLU) objectives aimed at implicitly capturing factuality in generated text: question-answering (QA) and a masked token prediction cloze task. For QA we evaluate using SummaQA (which uses QA pairs from the source, Scialom et al., 2019) and FEQA (which uses QA pairs from the summary, Durmus et al., 2020), while for the cloze task setting we use BLANC-Help and BLANC-Tune (Vasilyev et al., 2020, see the appendix for details of metrics). We also measure the factual-awareness of BERTScore Zhang et al. (2020), a summarization metric that is aimed primarily at improving coherency rather than factual consistency, and standard summarization evaluation metrics (e.g. ROUGE Lin (2004)).
5 Meta-Analysis of Factuality Metrics
5.1 Controlled Data Experiments
We provide the results of the sensitivity analysis over our controlled data on the XSUM domain in Table 2, on CNNDM in Table 3 and on SAMSUM in Table 4. Our analysis reveals that QA metrics, ROUGE-(2/3) and BERTScore generally perform well at evaluating factuality. In contrast, ROUGE-(1/L) are frequently invalid as factuality metrics (Tables 2 and 3), and the performance of Cloze metrics varies across domains (BLANC-Tune is invalid on XSUM, but does fairly well on other domains). Also, performance of metrics tends to be much lower on news domains when we consider non-entity-based errors with the exception of QA-based metrics, ROUGE-(2/3) and BERTScore, indicating that while factuality and standard metrics are fairly attuned to changes in factual consistency that relate to entity-based errors, they are less robust to other types of factual errors.
5.2 Comparison with Human Evaluation of Model Generations
We find that metrics displaying invalid behavior on controlled data (for instance assigning higher metric values to more factually inconsistent summaries on XSUM in Table 2) also display this invalid behavior in model generations (Table 5). This indicates that meta-evaluation with controlled data is effective as a diagnostic tool for finding weak factuality metrics, and follows our intuition that non-entity errors, while frequently produced by abstractive summarization models, are difficult for standard summarization metrics to identify. When considering better-performing factuality metrics identified by the controlled error analysis, we find that the controlled data analysis is generally able to identify better-performing metrics (SummaQA, ROUGE-(2/3) and BERTScore) for XSUM with the exception of FEQA (FEQA metric performs well on XSUM controlled analysis (Table 2), but only approaches this performance on SAMSUM when we consider human eval). The strong overall performance of ROUGE-3 is consistent with the findings of Fabbri et al. (2021) on CNNDM, our work confirms that this metric is more consistently correlated with factuality than other ROUGE variations across domains.
| Metric | XSUM | SAMSUM | ||
|---|---|---|---|---|
| Corr (- ) | p-value | Corr (- ) | p-value | |
| BLANC-Help | 0.04 | 0.55 | -0.01 | 0.82 |
| BLANC-Tune | 0.00 | 0.98 | -0.03 | 0.64 |
| SummaQA-C | -0.11 | 0.11 | -0.09 | 0.18 |
| SummaQA-F1 | -0.12 | 0.07 | -0.14 | 0.03* |
| FEQA | 0.04 | 0.57 | -0.03 | 0.69 |
| R-1 | 0.07 | 0.19 | 0.01 | 0.82 |
| R-2 | -0.10 | 0.15 | -0.03 | 0.59 |
| R-3 | -0.12 | 0.07 | -0.09 | 0.18 |
| R-L | 0.07 | 0.13 | 0.01 | 0.83 |
| BERTScore | -0.17 | 0.01** | 0.03 | 0.64 |
6 Related Work
Prior work concerning evaluation of automatic metrics and human evaluation for NLG systems has mainly focused on general analysis of output quality or coherence and fluency Callison-Burch et al. (2007); Graham (2015); Fabbri et al. (2021), rather than factuality. Recent efforts by NLP researchers have drawn attention to the issue of factual errors and hallucinations in the output of neural summarization models Cao et al. (2018); Massarelli et al. (2019); Zhao et al. (2020); Falke et al. (2019b); Goodrich et al. (2019); Celikyilmaz et al. (2020). A number of works have highlighted the effectiveness of QA and cloze task objectives for evaluating or improving factuality on specific domains Eyal et al. (2019); Huang et al. (2020). We aim to evaluate these metrics more broadly, and consider a wider range of domains (notably dialogue).
6.1 Discussion of Meta Evaluation and Conclusion
Our analyses show that in contrast to prior work on factual consistency that mostly concentrated on one specific domain and dataset, our GO FIGURE framework is effective at evaluating sensitivity and validity of factual consistency metrics with only reference summaries, rather than requiring computationally intensive testing across summarization model variants to identify metric strengths and shortcomings.
We highlight the following key points from experiments run using meta-evaluation:
Standard summarization metrics are not always valid measures of factuality. ROUGE-1 and ROUGE-L fail to accurately measure factual inconsistency across domains in our controlled analysis. The ROUGE-L results raise the question of context relevance. While ROUGE-L takes into account more context than other ROUGE variations, this context may not be relevant for assessing factuality. For example, swapping “decreased” for “increased” dramatically changes the meaning in the summary “Scotland’s renewable energy output increased by 45% in the first quarter of this year, compared with the same period last year.”, but ROUGE-L is not affected. Despite the frequent use of ROUGE-L as a more contextual measure, prior work has also noted that ROUGE-N outperforms ROUGE-L Rankel et al. (2013); Fabbri et al. (2021).
Analysis on human annotated data is still necessary as an upper-bound on meta-evaluation quality. While BLANC-Help, FEQA metric and BERTScore values decrease with factual inconsistency on controlled data, the metrics may sometimes be positively correlated with factual inconsistency on generated data. This emphasizes the importance of a expert curated test set as part of the GO FIGURE meta evaluation for the most rigorous testing. A question-answering objective is promising for measuring factual consistency across domains, but effectiveness depends on the question. While QA metrics can perform well at measuring factual consistency of generated summaries, our meta-evaluation reveals this is dependent on the way in which questions are asked. While both QA metrics use SQuAD-based systems Rajpurkar et al. (2016), asking questions from the source rather than the summary is most robust across domains. This opens the door to metrics based on more contextual QA like commonsense Shwartz et al. (2020).
We will release our meta-evaluation framework and diagnostic datasets to aid in development of effective summarization factuality metrics. In future work, summary meta-metric results (e.g. correlation on simulated data) could be used as rewards for reinforcement learning driven approaches to training factuality metrics.
7 Ethics and Broader Impact Statement
Ethical considerations involving our meta-evaluation framework primarily revolve around human evaluation. News articles and dialogues may contain references to distressing events or abnormal social behavior. All our expert annotators voluntarily took part in the human evaluation with prior knowledge of the type of content being evaluated. Crowd-sourced human evaluation trials were conducted under an IRB exemption.
Our work outlines a simple and effective approach for evaluating factuality metrics in summarization. This can aid in development of more robust and sensitive factuality metrics to accurately evaluate the factual correctness of generative models. This is key as improvement in the coherency of models accelerates, potentially leading to generations that appear to be high quality while containing factual inaccuracies. Our framework could also evaluate factuality metrics for use in identifying human-written errors, mitigating potential spread of misinformation.
Acknowledgments
The authors thank Yichen Jiang and Shiyue Zhang for feedback on implementation, Hannah Rashkin and Tom McCoy for help with MSR GPU clusters, Rowan Zellers and Elizabeth Clark for pointers to related work, as well as other members of the UW NLP, MSR AI and MSR MSAI communities for helpful comments.
References
- Ageeva et al. (2015) E. Ageeva, M. Forcada, Francis M. Tyers, and Juan Antonio Pérez-Ortiz. 2015. Evaluating machine translation for assimilation via a gap-filling task. In EAMT.
- Callison-Burch et al. (2007) Chris Callison-Burch, Cameron Fordyce, Philipp Koehn, Christof Monz, and Josh Schroeder. 2007. (meta-) evaluation of machine translation. In Proceedings of the Second Workshop on Statistical Machine Translation, pages 136–158, Prague, Czech Republic. Association for Computational Linguistics.
- Cao et al. (2018) Ziqiang Cao, Furu Wei, W. Li, and Sujian Li. 2018. Faithful to the original: Fact aware neural abstractive summarization. In AAAI.
- Celikyilmaz et al. (2020) Asli Celikyilmaz, Elizabeth Clark, and Jianfeng Gao. 2020. Evaluation of text generation: A survey. ArXiv, abs/2006.14799.
- Chaganty et al. (2018) Arun Chaganty, Stephen Mussmann, and Percy Liang. 2018. The price of debiasing automatic metrics in natural language evalaution. In Proceedings of the 56th Annual Meeting of the Association for Computational Linguistics (Volume 1: Long Papers), pages 643–653, Melbourne, Australia. Association for Computational Linguistics.
- Clark et al. (2019) Elizabeth Clark, Asli Celikyilmaz, and Noah A. Smith. 2019. Sentence mover’s similarity: Automatic evaluation for multi-sentence texts. In ACL.
- Durmus et al. (2020) Esin Durmus, He He, and Mona Diab. 2020. FEQA: A question answering evaluation framework for faithfulness assessment in abstractive summarization. In Proceedings of the 58th Annual Meeting of the Association for Computational Linguistics, pages 5055–5070, Online. Association for Computational Linguistics.
- Eyal et al. (2019) Matan Eyal, Tal Baumel, and Michael Elhadad. 2019. Question answering as an automatic evaluation metric for news article summarization. In Proceedings of the 2019 Conference of the North American Chapter of the Association for Computational Linguistics: Human Language Technologies, Volume 1 (Long and Short Papers), pages 3938–3948, Minneapolis, Minnesota. Association for Computational Linguistics.
- Fabbri et al. (2021) A. R. Fabbri, Wojciech Kryscinski, Bryan McCann, R. Socher, and Dragomir Radev. 2021. Summeval: Re-evaluating summarization evaluation. Trans. Assoc. Comput. Linguistics, 9:391–409.
- Falke et al. (2019a) Tobias Falke, Leonardo F. R. Ribeiro, Prasetya Ajie Utama, Ido Dagan, and Iryna Gurevych. 2019a. Ranking generated summaries by correctness: An interesting but challenging application for natural language inference. In ACL.
- Falke et al. (2019b) Tobias Falke, Leonardo F. R. Ribeiro, Prasetya Ajie Utama, Ido Dagan, and Iryna Gurevych. 2019b. Ranking generated summaries by correctness: An interesting but challenging application for natural language inference. In Proceedings of the 57th Annual Meeting of the Association for Computational Linguistics, pages 2214–2220, Florence, Italy. Association for Computational Linguistics.
- Gliwa et al. (2019) Bogdan Gliwa, Iwona Mochol, Maciej Biesek, and Aleksander Wawer. 2019. Samsum corpus: A human-annotated dialogue dataset for abstractive summarization. ArXiv, abs/1911.12237.
- Goodrich et al. (2019) B. Goodrich, V. Rao, Mohammad Saleh, and Peter J. Liu. 2019. Assessing the factual accuracy of generated text. Proceedings of the 25th ACM SIGKDD International Conference on Knowledge Discovery & Data Mining.
- Graham (2015) Yvette Graham. 2015. Re-evaluating automatic summarization with BLEU and 192 shades of ROUGE. In Proceedings of the 2015 Conference on Empirical Methods in Natural Language Processing, pages 128–137, Lisbon, Portugal. Association for Computational Linguistics.
- Guo et al. (2018) Han Guo, Ramakanth Pasunuru, and Mohit Bansal. 2018. Soft layer-specific multi-task summarization with entailment and question generation. In Proceedings of the 56th Annual Meeting of the Association for Computational Linguistics (Volume 1: Long Papers), pages 687–697, Melbourne, Australia. Association for Computational Linguistics.
- Hashimoto et al. (2019) T. Hashimoto, Hugh Zhang, and Percy Liang. 2019. Unifying human and statistical evaluation for natural language generation. ArXiv, abs/1904.02792.
- Huang et al. (2020) Luyang Huang, Lingfei Wu, and Lu Wang. 2020. Knowledge graph-augmented abstractive summarization with semantic-driven cloze reward. In Proceedings of the 58th Annual Meeting of the Association for Computational Linguistics, pages 5094–5107, Online. Association for Computational Linguistics.
- Kryscinski et al. (2019) Wojciech Kryscinski, B. McCann, Caiming Xiong, and R. Socher. 2019. Evaluating the factual consistency of abstractive text summarization. ArXiv, abs/1910.12840.
- Landis and Koch (1977) J. Landis and G. Koch. 1977. The measurement of observer agreement for categorical data. Biometrics, 33 1:159–74.
- Lin (2004) Chin-Yew Lin. 2004. ROUGE: A package for automatic evaluation of summaries. In Text Summarization Branches Out, pages 74–81, Barcelona, Spain. Association for Computational Linguistics.
- Liu and Lapata (2019) Yang Liu and Mirella Lapata. 2019. Hierarchical transformers for multi-document summarization. ACL.
- Massarelli et al. (2019) Luca Massarelli, F. Petroni, Aleksandra Piktus, Myle Ott, Tim Rocktäschel, Vassilis Plachouras, F. Silvestri, and S. Riedel. 2019. How decoding strategies affect the verifiability of generated text. ArXiv, abs/1911.03587.
- Miller (1995) George A. Miller. 1995. Wordnet: A lexical database for english. Commun. ACM, 38(11):39–41.
- Nallapati et al. (2016) Ramesh Nallapati, Bowen Zhou, C. D. Santos, Çaglar Gülçehre, and B. Xiang. 2016. Abstractive text summarization using sequence-to-sequence rnns and beyond. In CoNLL.
- Narayan et al. (2018) Shashi Narayan, Shay B. Cohen, and Mirella Lapata. 2018. Don’t give me the details, just the summary! Topic-aware convolutional neural networks for extreme summarization. In Proceedings of the 2018 Conference on Empirical Methods in Natural Language Processing, Brussels, Belgium.
- Novikova et al. (2017) Jekaterina Novikova, Ondrej Dusek, A. Curry, and Verena Rieser. 2017. Why we need new evaluation metrics for nlg. In EMNLP.
- Raffel et al. (2019) Colin Raffel, Noam Shazeer, Adam Roberts, Katherine Lee, Sharan Narang, Michael Matena, Yanqi Zhou, W. Li, and Peter J. Liu. 2019. Exploring the limits of transfer learning with a unified text-to-text transformer. ArXiv, abs/1910.10683.
- Rajpurkar et al. (2016) Pranav Rajpurkar, Jian Zhang, Konstantin Lopyrev, and Percy Liang. 2016. Squad: 100, 000+ questions for machine comprehension of text. ArXiv, abs/1606.05250.
- Rankel et al. (2013) Peter A. Rankel, John M. Conroy, Hoa Trang Dang, and Ani Nenkova. 2013. A decade of automatic content evaluation of news summaries: Reassessing the state of the art. In Proceedings of the 51st Annual Meeting of the Association for Computational Linguistics (Volume 2: Short Papers), pages 131–136, Sofia, Bulgaria. Association for Computational Linguistics.
- Reiter and Belz (2009) Ehud Reiter and Anja Belz. 2009. An investigation into the validity of some metrics for automatically evaluating natural language generation systems. Computational Linguistics, 35(4):529–558.
- Scialom et al. (2019) Thomas Scialom, Sylvain Lamprier, Benjamin Piwowarski, and Jacopo Staiano. 2019. Answers unite! unsupervised metrics for reinforced summarization models. In EMNLP/IJCNLP.
- Sellam et al. (2020) Thibault Sellam, Dipanjan Das, and Ankur Parikh. 2020. BLEURT: Learning robust metrics for text generation. In Proceedings of the 58th Annual Meeting of the Association for Computational Linguistics, pages 7881–7892, Online. Association for Computational Linguistics.
- Shazeer and Stern (2018) Noam Shazeer and Mitchell Stern. 2018. Adafactor: Adaptive learning rates with sublinear memory cost. In ICML.
- Shwartz et al. (2020) Vered Shwartz, Peter West, Ronan Le Bras, Chandra Bhagavatula, and Yejin Choi. 2020. Unsupervised commonsense question answering with self-talk. EMNLP.
- Vasilyev et al. (2020) Oleg V. Vasilyev, Vedant Dharnidharka, and J. Bohannon. 2020. Fill in the blanc: Human-free quality estimation of document summaries. ArXiv, abs/2002.09836.
- Wang et al. (2020) Alex Wang, Kyunghyun Cho, and Mike Lewis. 2020. Asking and answering questions to evaluate the factual consistency of summaries. In Proceedings of the 58th Annual Meeting of the Association for Computational Linguistics, pages 5008–5020, Online. Association for Computational Linguistics.
- Zhang et al. (2020) Tianyi Zhang, V. Kishore, Felix Wu, K. Weinberger, and Yoav Artzi. 2020. Bertscore: Evaluating text generation with bert. ArXiv, abs/1904.09675.
- Zhao et al. (2020) Z. Zhao, Shay B. Cohen, and B. Webber. 2020. Reducing quantity hallucinations in abstractive summarization. ArXiv, abs/2009.13312.
- Zhu et al. (2020) Chenguang Zhu, William Hinthorn, Ruochen Xu, Qingkai Zeng, Michael Zeng, Xuedong Huang, and Meng Jiang. 2020. Boosting factual correctness of abstractive summarization. ArXiv, abs/2003.08612.
Appendix A Appendices
A.1 Additional Details of Datasets
We provide dataset statistics for each of our domains in Table 6.
| Dataset | Train | Dev | Test | Domain |
| XSUM | 204,045 | 11,332 | 11,334 | Short news |
| CNNDM | 287,227 | 13,368 | 11,490 | Long news |
| SAMSUM | 14,732 | 818 | 819 | Dialogues |
| Reference | Type | Description | Example |
|---|---|---|---|
| Irish Taoiseach (PM) Leo Varadkar has engaged in | An entity appearing in the | Canadian Taoiseach (PM) Leo Varadkar has engaged in | |
| some “sock diplomacy” in his first meeting with | Intrinsic entity error | source document is used | some “sock diplomacy” in his first meeting with |
| Canadian Prime Minister Justin Trudeau in Dublin. | (int) | incorrectly. | Irish Prime Minister Justin Trudeau in Dublin. |
| Irish Taoiseach (PM) Leo Varadkar has engaged in | An entity appearing in | French Taoiseach (PM) Leo Varadkar has engaged in | |
| some “sock diplomacy” in his first meeting with | Extrinsic entity error | the candidate summary does | some “sock diplomacy” in his first meeting with |
| Canadian Prime Minister Justin Trudeau in Dublin. | (ext) | not appear in the source document. | Canadian Prime Minister Justin Trudeau in Dublin. |
| Irish Taoiseach (PM) Leo Varadkar has engaged in | A pronoun in the candidate summary | Irish Taoiseach (PM) Leo Varadkar has engaged in | |
| some “sock diplomacy” in his first meeting with | Pronoun error | is used incorrectly. | some “sock diplomacy” in her first meeting with |
| Canadian Prime Minister Justin Trudeau in Dublin. | (pro) | For example, (her/she instead of him/he). | Canadian Prime Minister Justin Trudeau in Dublin. |
| Irish Taoiseach (PM) Leo Varadkar has engaged in | There are verb negations in | Irish Taoiseach (PM) Leo Varadkar has not engaged in | |
| some “sock diplomacy” in his first meeting with | Negation error | the candidate summary that | some “sock diplomacy” in his first meeting with |
| Canadian Prime Minister Justin Trudeau in Dublin. | (verb) | contradict the source document. | Canadian Prime Minister Justin Trudeau in Dublin. |
| People who have been prescribed powerful anxiety | An adjective or adverb appearing | People who have been prescribed weak anxiety | |
| or pain relief drugs are being warned about a new | Sentiment error | in the candidate summary | or pain relief drugs are being warned about a new |
| drug-driving law. | (sent) | contradicts the source document. | drug-driving law. |
A.2 Evaluation Metric Details
QA-Based Quality Score. Given a source or reference document and candidate summary , QA-based evaluation metrics assign a generation quality score to to measure the ability of a QA system by accurately answering questions generated from or . We use the SummaQA Scialom et al. (2019) and FEQA Durmus et al. (2020) metrics. For the SummaQA metric, questions are generated from the source document and the candidate summary is used as input to the QA system. Alternatively, FEQA generates questions from and uses to answer these questions.
The generation quality score is typically the aggregated score measuring the similarity between ground-truth answers for questions generated from and the answers predicted by the QA system. SummaQA also generally includes the aggregated model confidence probabilities for predictions.
Masked LM Prediction (Cloze Task) Score. Given a source document and candidate summary , Cloze-based evaluation metrics assign a generation quality score to by measuring the ability of a NLU system to accurately predict masked tokens in the source document, given access to the information in . We use two variants of BLANC Vasilyev et al. (2020), BLANC-Help and BLANC-Tune. BLANC-Help uses both and as input to a pretrained masked token prediction model, while BLANC-Tune only uses as input to a model that has been finetuned on the candidate summary. Both metrics are aimed at capturing fluency, informativeness and factual correctness of summaries.
Semantic Similarity. Semantic similarity metrics measure the overlap between contextual embeddings of a source or reference document and candidate summary . We use BERTScore Zhang et al. (2020), which has been shown to correlate better with human judgements of coherency than standard summarization metrics and similarly to n-gram metrics on factual consistency of CNNDM summaries Wang et al. (2020).
Lexical Overlap. Finally, we test ROUGE Lin (2004), which is the standard metric used for evaluating summarization. ROUGE measures the n-gram overlap between a source or reference document and candidate summary . We evaluate results using ROUGE-1 and ROUGE-2, as well as ROUGE-L, which measures longest common sub-sequence overlap. We follow prior work that considered ROUGE in factual consistency evaluations Wang et al. (2020), though it has also been previously noted that ROUGE can underweight good summarization examples Novikova et al. (2017).
A.3 Simulated Data Transformations
We inject errors into reference summaries by first using a part-of-speech tagging model and named entity recognition system (spaCy)555https://spacy.io/ to extract entities, verbs, and adjectives from these summaries. For each named entity, we keep track of the label type (e.g. ORG, GPE, etc). All datasets are comprised of English language articles or dialogues and summaries, and we use the spaCy English NLP models.
Intrinsic entity errors. To inject intrinsic entity errors into a summary , we construct a dictionary of all unique entities appearing in the source document for only, organized by entity label type. We then swap a random entity in the reference summary for a different entity of the same label type in the constructed dictionary.
Extrinsic entity errors. For extrinsic entity errors, we use the same dictionary construction for all unique entities appearing in all the corpus source documents. To change a random adjective, we use WordNet Miller (1995) to obtain the synsets for that adjective and swap the adjective for its antonym.
Pronoun entity errors. Pronoun errors are introduced with a preset list of commonly used pronouns. We randomly extract a pronoun set (e.g. she/her) from the text using the preset list and swap it with another random pronoun set (e.g. he/him).
Verb Negation. We use a rule-based system for verb negation based on verb tense, and predict tense based on the suffix and preceding words.
We note that injecting a certain level of error into a summary will have varying effects depending on the average length of summaries for a corpus. We use the same methodology for each corpus to maintain consistency, but future work may explore length-controlled error injection based on the objectives of the evaluation.
A.4 Metric Implementation Details
For all metrics, we use the publicly shared implementations. Due to BERT context size constraints, we limit the length of document input sentences to 400 tokens for BLANC variants. We use Roberta-large for BERTScore.
A.5 T5 Training
We fine-tune the T5-base model (220M parameters) trained on news summaries for each domain using the AdaFactor optimizer Shazeer and Stern (2018) with a learning rate of 0.001 and a batch size of 8. The learning rate was tuned using ROUGE score on a dev set, and we experimented with learning rates in the range of [0.01,0.0001]. All other hyperparameters follow from the original T5 paper. Best performing models were trained using one random seed on NVIDIA V100 GPUs.
A.5.1 Human Annotation Layout
For human annotation of factual consistency in summaries, we show the source document, reference summary and a candidate summary that should be assessed for factuality. We then ask a factuality question with three choices:
-
•
Yes (i.e. the summary is factual)
-
•
No (i.e. the summary contains factual inconsistencies)
-
•
Not Sure (i.e. the summary is too incoherent to judge)
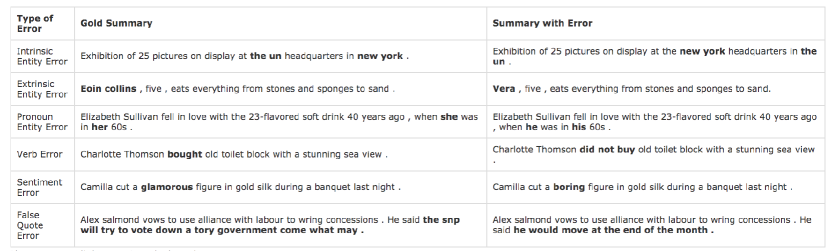
If a summary is judged to be factually incorrect, annotators are allowed to select the number and type of errors they observe using a predefined list of factual errors. A screenshot of the error types and examples shown in the annotation task is given in Figure 2. For less obvious cases of factual inconsistency (for example when summaries contain locations or political figures that require regional background knowledge), we check factuality using external knowledge bases to ensure correctness of annotation. We also adhere to a strict binary notion of factuality in deciding cases where summaries are imprecise but ambiguous in terms of correctness, opting to label these summaries as factually inaccurate. If summaries are completely incoherent, we treat these summaries as having the highest level of factual inconsistency.
We validated the effectiveness of the setup by computing inter-annotator agreement of in-house expert annotators for 30 XSUM summaries. We achieve “fair” agreement of Krippendorff’s = 0.32 with 3 annotators and “moderate” agreement of = 0.44 with 2 annotators Landis and Koch (1977); Ageeva et al. (2015). The remaining annotations are done by one in-house expert annotator.
| Dataset | Level 1 Avg. | Level 2 Avg. | Level 3 Avg. | Avg. % Transformed |
|---|---|---|---|---|
| (L1/L2/L3/All) | ||||
| XSUM (Entity) | 0.59 | 1.14 | 1.61 | 58.84 / 76.44 / 86.28 / 73.85 |
| XSUM (Non-Entity) | 0.48 | 0.93 | 1.28 | 48.32 / 74.00 / 85.40 / 69.24 |
| CNNDM (Entity) | 0.75 | 1.48 | 2.17 | 74.92 / 85.68 / 94.48 / 85.03 |
| CNNDM (Non-Entity) | 0.50 | 1.05 | 1.62 | 79.44 / 93.32 / 97.04 / 89.93 |
| SAMSUM (Entity) | 0.59 | 1.16 | 1.70 | 58.96 / 77.32 / 87.56 / 74.61 |
| SAMSUM (Non-Entity) | 0.49 | 0.91 | 1.28 | 48.52 / 72.80 / 84.12 / 68.48 |