Wind dispersal of natural and biomimetic maple samaras
2 School of Plant and Environmental Sciences, Virginia Tech, Blacksburg, Virginia, USA
3 Department of Mechanical Engineering, Virginia Tech, Blacksburg, Virginia, USA
4 Department of Civil and Environmental Engineering, Virginia Tech, Blacksburg, Virginia, USA
5 Blacksburg High School, Blacksburg, Virginia, USA
6 Department of Aerospace and Ocean Engineering, Virginia Tech, Blacksburg, Virginia, USA
)
Abstract
Maple trees (genus Acer) accomplish the task of distributing objects to a wide area by producing seeds which are carried by the wind as they slowly descend to the ground, known as samaras. With the goal of supporting engineering applications, such as gathering environmental data over a broad area, we developed 3D-printed artificial samaras. Here, we compare the behavior of both natural and artificial samaras in both still-air laboratory experiments and wind dispersal experiments in the field. We show that the artificial samaras are able to replicate (within 1 standard deviation) the behavior of natural samaras in a lab setting. We further introduce the notion of windage to compare dispersal behavior, and show that the natural samara has the highest mean windage, corresponding to the longest flights during both high wind and low wind experimental trials. This research provides a bioinspired design for the dispersed deployment of sensors and provides a better understanding of wind-dispersal of both natural and artificial samaras.
Keywords: wind dispersal, maple samaras, autorotation, additive manufacturing, biomimicry
1 Introduction
Distributed networks of inexpensive sensors can provide an effective method for gathering environmental data, with applications to precision meteorology and atmospheric physics [1, 2, 3], wildfire management [4, 5], air quality [6, 7], water quality [8], agricultural management [9, 10], and even exploration of other planetary surfaces [11]. While much research focuses on sensor development and distributed sensor networks [12, 13], there remains a need for efficient methods to distribute the sensors themselves. For instance, in recent years, a concept known as GlobalSense has been in development which would involve massively deployable, low-cost airborne sensors inspired by two-winged seeds for atmospheric characterization [14, 15, 16].
Wind dispersal is a common distribution strategy in the biological world, employed by organisms across different scales, from microscopic scales (e.g., fungi and pollen) to macroscopic scales (e.g., insects and plant seeds [17, 18, 19, 20]). The fruit of maple trees (genus Acer) produce wind-dispersed seeds known as samaras. A samara consists of a seed (nut or pericarp) and a single fibrous wing. After abscission, the samara, after falling from rest, goes through a transition phase (about 1 m descent) which leads to autorotation and a steady descent, slower than what would be predicted from the terminal velocity based on mass and drag considerations alone.
Detailed fluid experiments have revealed the slow descent of the maple samara is due to a lift force generated by the formation of a stable leading-edge vortex [21], which has been reproduced in simulation via computational fluid dynamics [22]. Samaras with a longer descent time have a greater likelihood of being dispersed over greater distances by the wind. This ultimately reduces resource competition and increases fitness [23].
In this study, we sought to reproduce the flight behavior seen in natural samaras by creating artificial samaras. We hypothesized that the artificial samaras would have similar dispersal characteristics (e.g., descent speed, rotation speed, and dispersal distance) to natural samaras. To test this hypothesis, we developed replicas of samaras via additive manufacturing (i.e., 3D printing). These artificial samaras were designed to match the dimensions, shape, and weight distribution of natural maple samaras. We then conducted a series of laboratory (no wind) and field (with wind) experiments to study the dispersal of artificial and natural samaras. To understand the dispersal of the samaras by wind, we introduce the concept of windage, representing the horizontal force of the wind on, and hence the horizontal motion of, falling objects. Windage is known to influence the fate of seeds of seagrasses, which are primarily water-dispersed [24, 25, 26], but to our knowledge has not been considered for primarily wind-dispersed seeds.
Artificial samara seeds, not of maples, but of a tropical tree Tachigalia versicolor, have been considered previously [27]. These artificial samaras autorotated, but about two axes simultaneously; the vertical axis and a longitudinal axis, much like the poplar seed (of the Salicaceae family) [28]. By contrast, our artificial seeds only autorotate about a single vertical axis, like natural seeds of the maple genus (Acer). In the previous artificial samara study [27], seeds were drop tested in the field, and their landing distributions recorded, but the wind speeds were not measured and the windage was not determined.
To reiterate, the specific objectives of our study were to: (1) create artificial samaras with a morphology similar to natural samaras and (2) compare the resulting dynamical properties of artificial samaras with natural samaras by conducting identical experiments on both sets of objects.
2 Development of artificial samaras
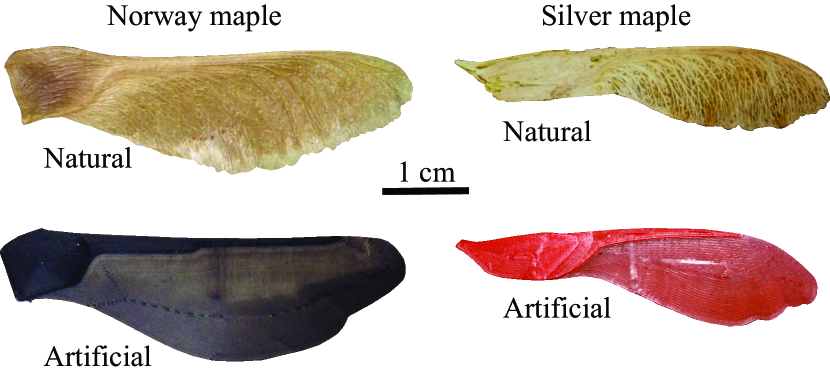
We considered two species, Acer platanoides (Norway maple) and Acer saccharinum (Silver maple). We based the shape of a 3D-printed replica on the planform of one individual () of each species. Using reference points and spline fitting for a Norway maple and silver maple, we were able to reproduce the geometry of samaras in three 2-dimensional sections — the nut, the leading edge, and the wing. We extruded each samara section in the perpendicular direction and rounded all edges to generate the 3D-model for printing. The natural samara and its artificial 3D-printed counterpart is shown for each samara type in figure 1.
We used an Ultimaker 3 3D printer with PLA (polylactic acid) as filament, which has a density of 1.24 g/cm3. Our 3D-printed samaras went through several design iterations while attempting to recreate the autorotation behavior of the natural samaras, varying both nut thickness and wing thickness. Due to the technical challenges of 3D-printing a thin layer of material, a wing thickness of 0.05 mm was chosen, with a nut thickness of 1.5 mm heuristically providing the desired autorotation properties.
Due to seed availability for testing, samaras of the Norway maple (Acer platanoides) were chosen as 30 individuals () were available for further testing. In all, 30 natural Norway maple seeds, 30 artificial 3D-printed Norway maple seeds, and 30 artificial 3D-printed silver maple seeds were used in the experiments described below.
3 Experimental methods
3.1 Samara morphology
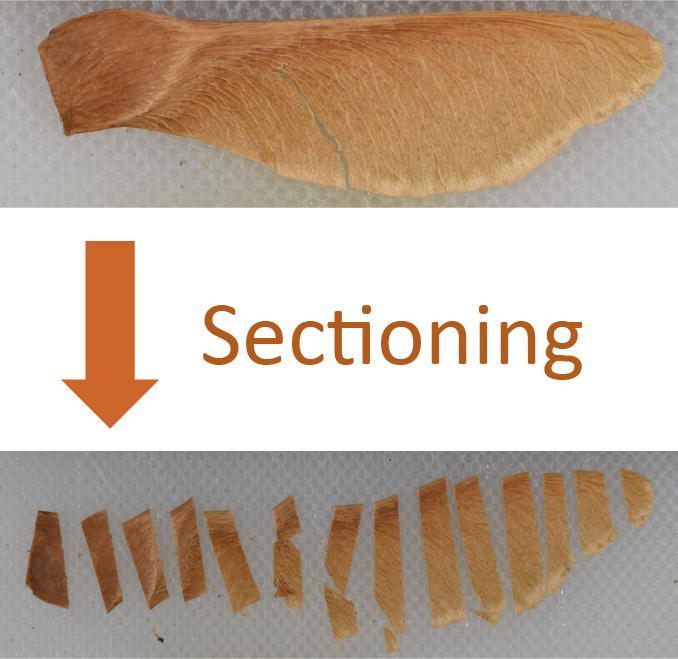
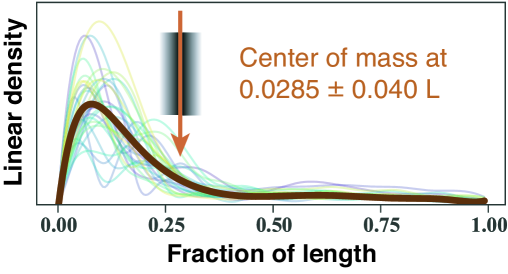
There are several aspects of the maple seed that give it its autorotation abilities, such as a thick leading edge compared to the wing, and a dense seed that optimizes the center of mass for autorotation. To capture this morphology of the maple seed, we used a sectioning method to obtain a linear mass density along the long axis of the seed. Although each maple seed is unique in its shape, mass, and wing style, a common characteristic obtained from the linear density is the spanwise position of the center of mass. To approximate the linear density and thus the center of mass location, each of the 30 Norway maples used in dynamical testing were sliced into segments ranging from 2 mm to 7 mm (see figure 2(a)), and each segment weighed using a 1 microgram precision scale. Using this mass and length data, the center of mass was calculated for each samara. As this measurement requires destruction of the samara, this analysis was done after both the laboratory (still air) and field experiments.
3.2 Still air experiments
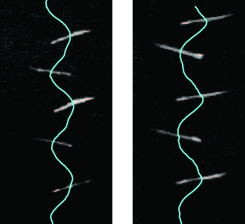
To determine the natural descent properties of all samaras tested, artificial and natural, we dropped the samaras in a still air setting, as in [29]. Samaras were released from rest, with the blade pointing downward, from a height of 3.05 m, and allowed to fall freely. Tests were conducted in a laboratory (a growth chamber) without active ventilation, to minimize air currents that could disrupt the measurements. Each individual samara was tested 3 times (i.e., 90 samaras, each dropped 3 times, giving 270 total drops). A Photron FASTCAM Mini UX100 camera (Photron, San Diego, CA, USA) with a micro-Nikkor 105 mm f/28 lens (Nikon, New York, NY, USA) was used to record video data at 2000 frames per second (0.5 ms between frames) with a resolution of 1,280 800 pixels. The resulting images were analyzed to determine the mean descent speed and rotational velocity at steady state, as illustrated in figure 3(a). Frames were processed using opencv for Python to identify samara position and orientation.
3.3 Field experiments
For a more realistic test of the samaras’ descent performance, experiments were conducted in field conditions. Samaras were dropped from an aerial work platform over an asphalt airstrip located at the Kentland Experimental Aerial Systems Laboratory at Virginia Tech’s Kentland Farm in Blacksburg, VA (figure 4(c)). This site was selected because the paved area and the land in the immediate vicinity are flat, with no obstructions. As in the still air experiments, samaras were released from rest from a height of 3.05 m with the blade pointing downward and allowed to freely descend to the ground. The location of their first contact with the ground was marked with a colored metal disk so that no additional lateral sliding movement along the ground would occur.
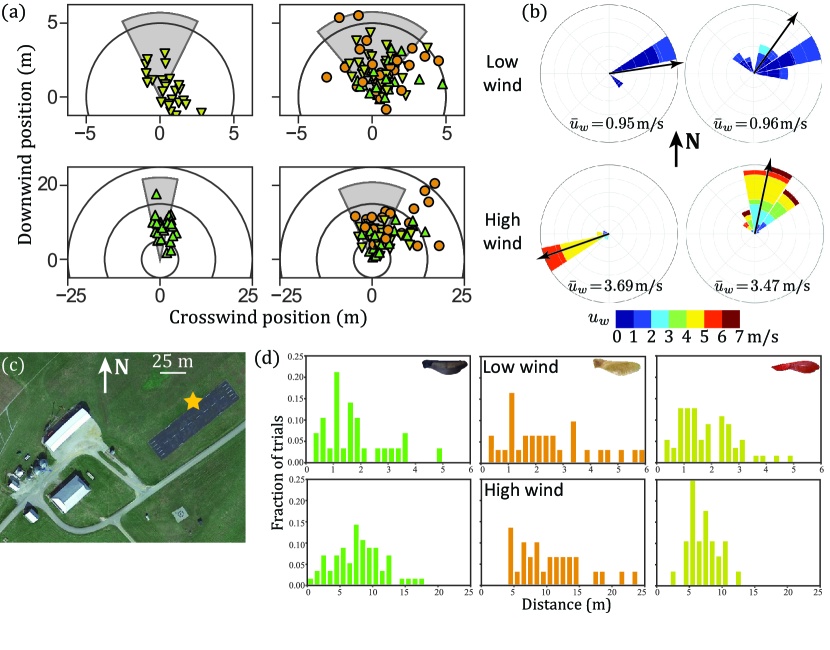
Each natural Norway maple seed was dropped 2 times and each 3D-printed Norway maple seed and 3D-printed silver maple seed was dropped 3 times from the platform. In this experiment, the repeated trials were conducted on different days to account for potential variability in wind conditions. Wind conditions were approximated by taking an average for the entire trial duration, which was typically 3 hours per trial, on three different days. Wind speed and direction were measured at an approximate height of 3 m at a weather station located approximately 100 m from the drop location. The wind conditions were variable. On the first day, artificial silver maple seeds were dropped in low wind conditions ( m/s) and artificial Norway maple seeds were dropped in higher wind conditions ( m/s). On the second and third days, all samaras were dropped together, with one low ( m/s) and one higher ( m/s) wind day. The wind conditions for each drop period are shown in Figure 4(b).
3.4 Windage
Windage was estimated from the field experiments. We use the widely used and simplistic (kinematic) empirical model of windage [25, 30, 31], which holds that the average horizontal velocity of the object, , is linearly related to the average horizontal wind velocity ,
| (1) |
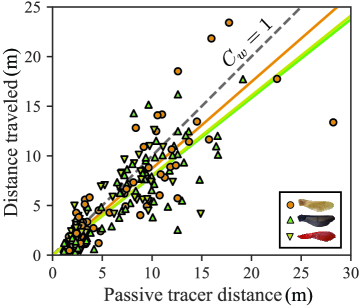
by a windage coefficient , where is the horizontal wind velocity averaged between the release height, , and the ground. To estimate , we determine the downwind distance traveled by the dropped samara, , as compared with the distance, , traveled by a theoretical tracer following the horizontal wind for the same drop time. Using each day’s average wind speed, and the drop time of each samara, , the effective distance traveled by a passive tracer in the wind may be calculated as,
| (2) |
The windage coefficient, , therefore, is the ratio of the actual downwind distance traveled to the effective distance of a passive tracer,
| (3) |
Ignoring turbulence [32, 33], the drop time is approximately related to the release height and terminal velocity of the seed, that is, the seed descent rate in still air (),
| (4) |
thus, the distance traveled is estimated as,
| (5) |
We note that this differs from a simple ballistic model used in some previous seed dispersal studies [34, 35, 33], which effectively considered a windage coefficient of 1.
4 Experimental results
The mean and standard deviation of all measured properties are shown in Table 1.
| Samara | Natural Norway maple | Artificial Norway maple | Artificial silver maple |
|---|---|---|---|
| Mass, | mg | mg | — |
| Length, | cm | cm | — |
| Center of mass | % | % | — |
| Wing loading, | N/m2 | N/m2 | — |
| Rotational velocity, | rad/s | rad/s | rad/s |
| Wing tip speed, | m/s | m/s | — |
| Lab descent speed, | m/s | m/s | m/s |
| Field descent speed, | m/s | m/s | m/s |
| Windage coefficient, |
4.1 Samara morphology
The natural Norway maple samaras have a center of mass that occurs between 24% and 30% of its length measured from the heavy tip of the seed. The average center of mass was 28.5 4.0%, as illustrated for a seed of Acer platanoides (Norway maple) in figure 2(b).
 |
 |
| (a) | (b) |
The wing loading was also calculated for each of the 30 samaras, with the average wing loading found to be 2.1 N/m2. Similarly, the artificial Norway maples were sectioned and weighed to analyze their mass distribution characteristics. Their center of mass was found to be 27.7%, with a wing loading of 3.2 N/m2. As their natural counterparts were not available for testing in large enough numbers, the artificial silver maples did not undergo morphology characterization. The artificial Norway maple seeds were found to be substantially heavier ( mg) than their natural counterparts ( mg), leading to a larger wing loading (artificial: N/m2, natural: N/m2). However, the center of mass of artificial Norway maple seeds (%) was found to be very consistent with the natural seeds (%).
4.2 Still air experiments
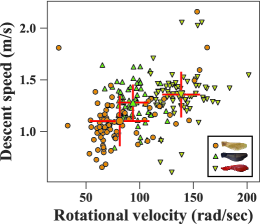
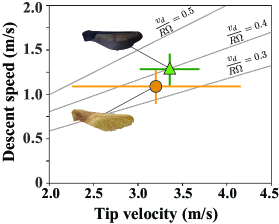
Figure 3 shows the results of still air experiments. In panel (b), each point represents the mean steady state descent properties, and the overall mean and standard deviation for all trials of each samara type is shown. Taking all the samaras together, there is a positive correlation between rotational velocity descent speed, as seen previously [36]. In panel (c), we show the descent speed vs. tip velocity, , where is the mean of the distance of the samara tip from the center of mass. A few contours of the ratio of these two velocities, , are shown. They are both close to , in agreement with previous work (cf. Fig. 3 of [36]).
 |
 |
 |
| (a) | (b) | (c) |
The natural Norway maple seeds exhibit both the slowest mean descent speed (1.10 0.24 m/s) and slowest rotational velocity (81.4 27.6 rad/s). The mean properties of the 3D-printed Norway maple seeds fall within one standard deviation of their natural counterparts, with a mean descent speed of 1.28 0 .17 m/s and a rotational velocity of 93.7 14.4 rad/s. Finally, the 3D-printed silver maple seeds fell more quickly (1.36 0.22 m/s) and rotated more quickly (138.6 17.7 rad/s) on average than either the natural or artificial Norway maple seeds. There was a notable variability within each samara type; the slowest descent measured was a 3D-printed silver maple, which had the fastest mean descent speed, while the fastest descent measured was a natural samara, which had the slowest mean. The natural samaras had the most variability in both properties, likely due to increased morphological variability. However, the variation present in the 3D-printed samaras suggests that the autorotation dynamics of even a consistent shape are highly variable when dropped from rest in still air, perhaps due to inherent sensitivity to initial conditions of the dynamics, even in a quiescent fluid medium [37].
4.3 Field experiments
Field experiments were conducted to measure the performance (descent speed, landing location) of each samara type in natural wind conditions. Descent speeds, measured directly from descent time, for the field drops closely aligned with the descent speeds in still air (Table 1). The natural Norway maple mean descent speeds had a difference of 7% in the laboratory vs. the field setting, whereas its artificial counterpart differed by only 1%.
The samara landing positions, and the corresponding wind rose, for each of the wind conditions, are shown in figure 4. The landing positions of figure 4(a) are shown in terms of the mean wind direction, with the relative wind speed and standard deviation of the wind direction shown by the gray regions radius and angle, respectively. The five trials which travelled the furthest in the wind were all natural samaras, and the natural samaras again showed the most variation. Figure 4(d) shows the histograms of distances travelled by each type of samara, combining the lower wind condition trials and higher wind condition trials.
 |
 |
| (a) | (b) |
4.4 Morphology as performance indicator
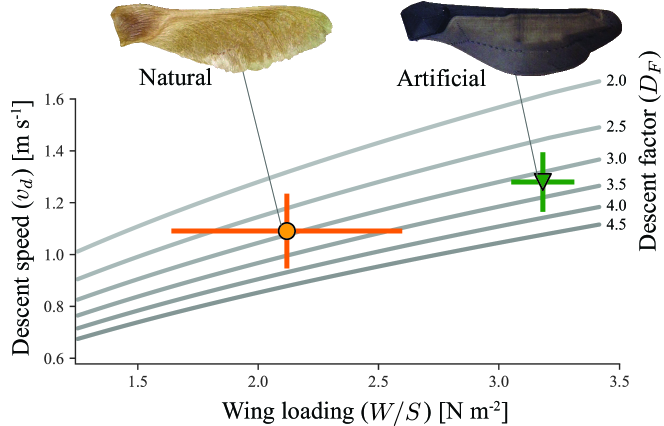
Using a basic aerodynamic performance analysis, Lentink et al. [21] derived a formula relating the descent speed to the square root of the wing loading divided by a descent factor,
| (6) |
where the descent factor is a dimensionless number of order 1 that represents a seed’s aerodynamic efficacy. In figure 6, we plot the descent speed as a function of wing loading for both the natural and artificial Norway maple samaras. The gray lines represent descent speed as a function of wing loading for constant descent factors ().
5 Discussion
New information is needed to understand the dynamics of wind dispersal. Here, we designed a series of biomimetic maple samaras, and tested their ability to ‘fly’ in a series of laboratory and field experiments. With still-air laboratory experiments, we showed that the biomimetic samaras exhibited similar descent properties (i.e., descent speed and rotation) as the natural samaras. From field experiments, we found that the natural samara traveled the greatest distances with the wind, yet also exhibited the most variability. Our field experiments also supported the assertion that wind speed has strong impact on dispersal. We calculated a windage coefficient to capture the effect of wind and showed that is an effective metric for predicting dispersal distance.
The shape of the artificial samaras was developed heuristically, varying the depths of each segment until the desired behavior was observed. However, the locations of the center of mass of the natural and artificial samaras are nearly identical. This relationship has been more closely investigated, using balsa wood prototypes [38], which showed that descent speed and rotational velocity are closely related to the location of the center of mass. The separation of the center of mass and the center of fluid forcing contributes to the rotation of a samara [29, 39].
From the observed behaviors, the natural and artificial samaras both showed approximately equivalent descent factors, , as shown in Figure 6. According to [21], the descent factor is a measure of aerodynamic efficacy relating the wing loading, descent velocity, and fluid density of a samara. The natural and artificial samaras having the same descent factor is likely due to their similar morphology, and suggests that differences in descent speed may be related to differences in samara weight.
During the high wind trials, the landing distribution shows a significant bias to the right of downwind (figure 4(a)). This may be due to temporally localized turbulent gusts which were biased to the right of the mean wind direction during the trial duration (figure 4(b)). This is consistent with the high variability of the wind direction during this trial.
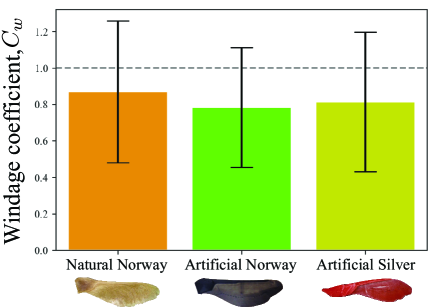
Our results indicate that for some samaras, the windage was estimated to be greater than 1 (see figure 5(a)). While a windage value of greater than 1 might at first glance seem puzzling, seeds are capable of various aerial movements, including tumbling and gilding relative to the moving air [40, 41, 42], which could lead to average horizontal speeds which exceed that of the wind itself. The sensitivity of these effects to local conditions, and the spatiotemporal variability of the conditions themselves (turbulence), may also contribute to the observed dispersal patterns.
Biological implications. A review of seed dispersal [18] suggests that for many plants, to escape from competition with the parent plant, there is a strong selective pressure to achieve dispersal distances of at least 1 canopy diameter. For a seed dropped from a canopy of height and diameter , then this condition requires, via eq. (5),
| (7) |
Assuming , we have a fitness criterion of,
| (8) |
where we note that global average surface (10 m height) winds over land are m/s [43]. For the maples considered here, we thus have , so the canopy diameter needs to be less than 3 times the canopy height to satisfy the hypothesized biological fitness constraint. Acer platanoides (Norway maples) have a canopy diameter of approximately m and a tree height of approximately m [44], which gives a , satisfying the criterion, eq. (8).
Engineering implications. In the delivery of sensors or resources, a distributed delivery over a large area from a single release point may be a desirable feature [37]. Because of the large deviation in behavior, as observed in this study, samaras naturally scatter over a range quite effectively. Even our 3D-printed samaras, which are effectively identical morphologically, have a significant variability in their dynamic behavior both in still air in the laboratory (figure 3) and in the field (figures 4 and 5). We hypothesize that this diversity of behaviors is related to the stochastic nature of the transition to autorotation as well as sensitivity of samaras to local wind fluctuations (i.e., turbulence).
6 Conclusion
Windage factors were measured at about 80%, which means the seeds considered are roughly moving horizontally with the wind. Variability is higher for the natural samaras, which also show the best performance. The windage could be measured for other wind-dispersed seeds [28], improving models that predict dispersal kernels [32], and also aiding in the design of bio-inspired delivery devices. The ubiquity and low cost of additive manufacturing technology in the form of 3D printing make studies like this one possible and could aid in experimental tests of the windage for other seeds. While previous studies have considered artificial samaras [27], the use of 3D-printing to create replicas of seeds and study their aerodynamics can accelerate such studies. While 3D-printing has been done previously for a double-winged seed [45, 46], we note that the present study is the first, to our knowledge, to 3D-print single winged samaras. More detailed models and fluid experiments could be explored, especially those analyzing the side slip during autorotation [47] and tumbling and gliding behaviors [48, 49]. Another modeling direction would be the incorporation of turbulence [32], to measure if its effect on dispersal patterns, which may provide the variability observed in this study.
Acknowledgements
This research was supported in part by a grant from the Virginia Tech Institute for Critical Technologies and Applied Sciences (ICTAS) Research Experiences for Undergraduates and grants from the National Science Foundation (NSF) under grant numbers 1821145 and 2027523. Any opinions, findings, and conclusions or recommendations expressed in this material are those of the authors and do not necessarily reflect the views of the sponsors.
Data availability
Files for 3D-printing are provided in the supplementary figshare repository [50].
References
- [1] Chilson, P. B., Bell, T. M., Brewster, K. A., Britto Hupsel de Azevedo, G., Carr, F. H., Carson, K., Doyle, W., Fiebrich, C. A., Greene, B. R., Grimsley, J. L. et al. [2019] Moving towards a Network of Autonomous UAS Atmospheric Profiling Stations for Observations in the Earth’s Lower Atmosphere: The 3D Mesonet Concept. Sensors 19(12):2720.
- [2] Barbieri, L. K., Kral, S. T., Bailey, S. C. C., Frazier, A. E., Jacob, J. D., D. Brus, P. B. C., Crick, C., Elston, J., Foroutan, H., González-Rocha, J., Greene, B. R., Guzman, M. I., Houston, A. L., Islam, A., Kemppinen, O., Pillar-Little, E. A., Reuder, J., Ross, S. D., Sama, M., Schmale III, D. G., Schuyler, T. J., Smith, S., Waugh, S., Doddi, A., Lawrence, D., Dixon, C., Borenstein, S. and de Boer, G. [2019] Intercomparison of small unmanned aircraft system (sUAS) measurements for atmospheric science during the LAPSE-RATE campaign. Sensors 19:2179.
- [3] Lee, T. R., Buban, M., Dumas, E. and Baker, C. B. [2019] On the use of rotary-wing aircraft to sample near-surface thermodynamic fields: Results from recent field campaigns. Sensors 19(1):10.
- [4] Rabinovich, S., Curry, R. E. and Elkaim, G. H. [2018] Toward dynamic monitoring and suppressing uncertainty in wildfire by multiple unmanned air vehicle system. Journal of Robotics 2018.
- [5] AL-Dhief, F. T., Sabri, N., Fouad, S., Latiff, N. A. and Albader, M. A. A. [2019] A review of forest fire surveillance technologies: Mobile ad-hoc network routing protocols perspective. Journal of King Saud University-Computer and Information Sciences 31(2):135–146.
- [6] Villa, T. F., Gonzalez, F., Miljievic, B., Ristovski, Z. D. and Morawska, L. [2016] An overview of small unmanned aerial vehicles for air quality measurements: Present applications and future prospectives. Sensors 16(7):1072.
- [7] Carranza, V., Rafiq, T., Frausto-Vicencio, I., Hopkins, F. M., Verhulst, K. R., Rao, P., Duren, R. M. and Miller, C. E. [2018] Vista-LA: Mapping methane-emitting infrastructure in the Los Angeles megacity. Earth System Science Data 10(1):653.
- [8] Schmale, D. G., Ault, A. P., Saad, W., Scott, D. T. and Westrick, J. A. [2019] Perspectives on Harmful Algal Blooms (HABs) and the Cyberbiosecurity of Freshwater Systems. Frontiers in Bioengineering and Biotechnology 7:128.
- [9] Hart, J. K. and Martinez, K. [2006] Environmental sensor networks: A revolution in the earth system science? Earth-Science Reviews 78(3-4):177–191.
- [10] Barrientos, A., Colorado, J., Cerro, J. d., Martinez, A., Rossi, C., Sanz, D. and Valente, J. [2011] Aerial remote sensing in agriculture: A practical approach to area coverage and path planning for fleets of mini aerial robots. Journal of Field Robotics 28(5):667–689.
- [11] Pandolfi, C. and Izzo, D. [2013] Biomimetics on seed dispersal: survey and insights for space exploration. Bioinspiration & Biomimetics 8(2):025003.
- [12] Lohr, S. [2010] Smart Dust? Not Quite, but We’re Getting There. New York Times URL https://www.nytimes.com/2010/01/31/business/31unboxed.html.
- [13] Batista da Silva, L. C., Bernardo, R. M., de Oliveira, H. A. and Rosa, P. F. F. [2017] Unmanned aircraft system coordination for persistent surveillance with different priorities. In 2017 IEEE 26th International Symposium on Industrial Electronics (ISIE), 1153–1158.
- [14] Prather, J. C., M. Bolt, H., Harrell, H., Manobianco, J. and Adams, M. L. [2016] Antenna design for a massive multiple input environmental sensor network. Digital Communications and Networks 2(4):256–259.
- [15] Horton, T., Bolt, M., Prather, C., Manobianco, J. and Adams, M. L. [2018] Airborne Sensor Network for Atmospheric Profiling. Wireless Sensor Network 10:93–101.
- [16] Bolt, M., Prather, J. C., Horton, T. and Adams, M. [2020] Massively Deployable, Low-Cost Airborne Sensor Motes for Atmospheric Characterization. Wireless Sensor Network 12:1–11.
- [17] Howe, H. F. and Smallwood, J. [1982] Ecology of seed dispersal. Annual Review of Ecology and Systematics 13(1):201–228.
- [18] Hughes, L., Dunlop, M., French, K., Leishman, M. R., Rice, B., Rodgerson, L. and Westoby, M. [1994] Predicting dispersal spectra: a minimal set of hypotheses based on plant attributes. Journal of Ecology 82:933–950.
- [19] Isard, S. and Gage, S. H. [2001] Flow of Life in the Atmosphere: An Airscape Approach to Understanding Invasive Organisms. Michigan State University Press, East Lansing, MI.
- [20] Schmale, D. G. and Ross, S. D. [2015] Highways in the Sky: Scales of Atmospheric Transport of Plant Pathogens. Annual Review of Phytopathology 53(1):591–611.
- [21] Lentink, D., Dickson, W. B., Van Leeuwen, J. L. and Dickinson, M. H. [2009] Leading-edge vortices elevate lift of autorotating plant seeds. Science 324(5933):1438–1440.
- [22] Lee, I. and Choi, H. [2018] Scaling law for the lift force of autorotating falling seeds at terminal velocity. Journal of Fluid Mechanics 835:406.
- [23] Fenner, M. W. [2012] Seed Ecology. Springer Science & Business Media.
- [24] Harwell, M. C. and Orth, R. J. [2002] Long-distance dispersal potential in a marine macrophyte. Ecology 83(12):3319–3330.
- [25] Ruiz-Montoya, L., Lowe, R. J., van Niel, K. P. and Kendrick, G. A. [2012] The role of hydrodynamics on seed dispersal in seagrasses. Limnology and oceanography 57(5):1257–1265.
- [26] Ruiz-Montoya, L., Lowe, R. J. and Kendrick, G. A. [2015] Contemporary connectivity is sustained by wind-and current-driven seed dispersal among seagrass meadows. Movement ecology 3(1):9.
- [27] Augspurger, C. K. and Franson, S. E. [1987] Wind dispersal of artificial fruits varying in mass, area, and morphology. Ecology 68(1):27–42.
- [28] Minami, S. and Azuma, A. [2003] Various flying modes of wind-dispersal seeds. Journal of Theoretical Biology 225:1–14.
- [29] Varshney, K., Chang, S. and Wang, Z. J. [2012] The kinematics of falling maple seeds and the initial transition to a helical motion. Nonlinearity 25(1):C1.
- [30] Allshouse, M. R., Ivey, G. N., Lowe, R. J., Jones, N. L., Beegle-Krause, C., Xu, J. and Peacock, T. [2017] Impact of windage on ocean surface Lagrangian coherent structures. Environmental Fluid Mechanics 17(3):473–483.
- [31] Breivik, Ø., Allen, A. A., Maisondieu, C. and Roth, J. C. [2011] Wind-induced drift of objects at sea: The leeway field method. Applied Ocean Research 33(2):100–109.
- [32] Okubo, A. and Levin, S. A. [1989] A theoretical framework for data analysis of wind dispersal of seeds and pollen. Ecology 70(2):329–338.
- [33] Murren, C. J. and Ellison, A. M. [1998] Seed dispersal characteristics of Brassavola nodosa (Orchidaceae). American Journal of Botany 85(5):675–680.
- [34] Cremer, K. W. [1977] Distance of seed dispersal in eucalyptus estimated from seed weights. Australian Forestry Research 7:225–228.
- [35] Greene, D. F. and Johnson, E. A. [1989] A model of wind dispersal of winged or plumed seeds. Ecology 70(2):339–347.
- [36] Azuma, A. and Yasuda, K. [1989] Flight performance of rotary seeds. Journal of Theoretical Biology 138(1):23–53.
- [37] Heisinger, L., Newton, P. and Kanso, E. [2014] Coins falling in water. Journal of Fluid Mechanics 742:243–253.
- [38] Yasuda, K. and Azuma, A. [1997] The autorotation boundary in the flight of samaras. Journal of Theoretical Biology 185(3):313–320.
- [39] Lee, S. J., Lee, E. J. and Sohn, M. H. [2014] Mechanism of autorotation flight of maple samaras (Acer palmatum). Experiments in fluids 55(4):1718.
- [40] Rabinowitz, D. and Rapp, J. K. [1981] Dispersal abilities of seven sparse and common grasses from a Missouri prairie. American Journal of Botany 68(5):616–624.
- [41] Ern, P., Risso, F., Fabre, D. and Magnaudet, J. [2012] Wake-induced oscillatory paths of bodies freely rising or falling in fluids. Annual Review of Fluid Mechanics 44:97–121.
- [42] Nave Jr, G. K. and Ross, S. D. [2019] Global phase space structures in a model of passive descent. Communications in Nonlinear Science and Numerical Simulation 77:54–80.
- [43] Archer, C. L. and Jacobson, M. Z. [2005] Evaluation of global wind power. Journal of Geophysical Research: Atmospheres 110:D12220.
- [44] Gilman, E. F. and Watson, D. G. [1993] Acer platanoides: Norway Maple. Fact Sheet ST-28, adapted from a series by the Environmental Horticulture Department, University of Florida for the United States Forest Service .
- [45] Rabault, J., Fauli, R. A. and Carlson, A. [2019] Curving to fly: synthetic adaptation unveils optimal flight performance of whirling fruits. Physical Review Letters 122:024501.
- [46] Fauli, R. A., Rabault, J. and Carlson, A. [2019] Effect of wing fold angles on the terminal descent velocity of double-winged autorotating seeds, fruits, and other diaspores. Physical Review E 100(1):013108.
- [47] Norberg, R. Å. [1973] Autorotation, self-stability, and structure of single-winged fruits and seeds (samaras) with comparative remarks on animal flight. Biological Reviews 48(4):561–596.
- [48] Field, S. B., Klaus, M., Moore, M. and Nori, F. [1997] Chaotic dynamics of falling disks. Nature 388(6639):252–254.
- [49] Andersen, A., Pesavento, U. and Wang, Z. J. [2005] Unsteady aerodynamics of fluttering and tumbling plates. Journal of Fluid Mechanics 541:65–90.
- [50] Nave Jr., G. K., Hall, N., Somers, K., Davis, B., Collver, M., Gruszewski, H. A., G. Schmale III, D. and Ross, S. [2020]. Wind dispersal of natural and biomimetic maple samaras - supplemental design files. URL https://doi.org/10.6084/m9.figshare.13003025.v1.