Performance Evaluation of ParalleX Execution model on Arm-based Platforms
A Preprint -
Abstract
The HPC community shows a keen interest in creating diversity in the CPU ecosystem. The advent of Arm-based processors provides an alternative to the existing HPC ecosystem, which is primarily dominated by x86 processors. In this paper, we port an Asynchronous Many-Task runtime system based on the ParalleX model, i.e., High Performance ParalleX (HPX), and evaluate it on the Arm ecosystem with a suite of benchmarks. We wrote these benchmarks with an emphasis on vectorization and distributed scaling. We present the performance results on a variety of Arm processors and compare it with their x86 brethren from Intel. We show that the results obtained are equally good or better than their x86 brethren. Finally, we also discuss a few drawbacks of the present Arm ecosystem.
Index Terms:
Asynchronous Many-Task, HPX, Parallel Computing, ParalleXI Introduction
††©2020 IEEE. Personal use of this material is permitted. Permission from IEEE must be obtained for all other uses, in any current or future media, including reprinting/republishing this material for advertising or promotional purposes, creating new collective works, for resale or redistribution to servers or lists, or reuse of any copyrighted component of this work in other works.The High-Performance ecosystem has shown a keen interest in shifting from the traditional x86 architecture to Arm-based processors. The Japanese exascale system called Fugaku [1] is based on the A64FX processor from Fujitsu. In Europe, the European Processor Initiative (EPI) is working on a processor that will (among others) include Arm-based cores and is positioned as an HPC technology. In the USA, Sandia National Laboratories has deployed a large-scale system based on the ThunderX2 processor from Marvell, which is based on the Armv8 ISA.
This development triggers the question of whether the HPC software ecosystem is ready for exploiting Arm. This concerns, in particular, a recent extension of the Arm ISA, which is called Scalable Vector Extension (SVE) [2]. SVE is vector-length agnostic, unlike AVX or AVX512 from Intel, where SIMD width is fixed to 256 and 512 bit, respectively. Size has some significant consequences when programming for SVE. For AVX and AVX512 (and similar SIMD ISAs), data types that are defined (e.g., __m512d for a vector of eight doubles) have a size known at compile-time. For SVE, this is a priori, not the case, as the vector length is only known at runtime.
These hardware complexities are matched with software complexities. Operating systems, compiler, and library support are required to provide a functional environment that supports large-scale HPC applications and ensure they can both be easily ported to such new hardware and exploit it efficiently. One such class of applications is the one exploiting parallelism through task-based programming. Asynchronous Many-Task (AMT) runtime system models task-based programming and offers an alternative to the conventional programming models like Message Passing (MPI). In an AMT model, the program can be broken down into tasks, with each task having a dependency on some other task generating a data flow based process. During program execution, these tasks are launched arbitrarily based on the input data and the DAG generated, enabling multiple concurrent tasks running as computation kernels. The scheduler deals with the load imbalance. These characteristics of the AMT model poses it as a viable alternative in an era where future algorithms are expected to feature an increased dynamic behavior and low uniformity. In this paper, we explore an AMT model on Arm-based processors.
Section \Romannum2 talks about Related Work in porting and evaluating the Arm processors. Section \Romannum3 discusses the ParalleX execution model and HPX. Section \Romannum4 touches on key concepts required to understand the benchmarks and the results. Section \Romannum5 describes the benchmarks and system setup, and Section \Romannum6 discusses the results.
II Related Work
S. McIntosh-Smith et al. [3] recorded the initial set of performance evaluations on mainstream Arm processors on large HPC systems. These evaluations showcased performance and cost benefits for a class of applications. The result considers performance on a single-node. They later released distributed application results in [4]. Jackson et al. [5] investigated the performance of distributed memory communications (MPI), as well as scientific applications utilizing MPI on ThunderX2. We also found that Mont-Blanc project [6] investigated energy consumptions during the execution of benchmarks and mini-apps.
While there has been decent research and performance evaluation on the conventional computation models (such as OpenMP + MPI), there are no performance numbers available for AMT runtime systems on mainstream Arm processors.
II-A Our contribution
In this paper, we execute several benchmarks on an AMT based on the ParalleX model, i.e. HPX. We investigate both distributed and shared memory models with a special emphasis on vectorization. Furthermore, we provide performance comparisons of mainstream Arm processors, such as Kunpeng 916 (HiSilicon), ThunderX2 (Marvell) and A64FX (Fujitsu), with their x86 brethren from Intel.
III Background
III-A ParalleX Execution Model
ParalleX execution model [7] was devised to address the critical bottlenecks of exascale HPC systems namely:
-
•
Starvation - insufficient parallelism
-
•
Latencies - time-distance delay of remote resource accesses
-
•
Overheads - extra work for management of parallel actions and resources on the critical path that are not necessary in the sequential variant
-
•
Contention - delays due to lack of availability of resources
The ParalleX model offers an alternative to conventional computational models, such as MPI.
ParalleX improves the efficiency of the application by reducing synchronization and scheduling overheads. Resource utilization is achieved through increased asynchrony. Contention overheads are significantly reduced by employing adaptive scheduling and routing. This technique is instrumental in handling memory bank conflicts. Data directed computing using message-driven computation and lightweight synchronization mechanisms results in visible scalability improvements, at least for certain classes of problems. ParalleX achieves power reductions by reducing extraneous calculations and data movements.
III-B High Performance ParalleX Runtime System
High Performance ParalleX (HPX) [8, 9, 10, 11, 12] is the first open-source implementation of ParalleX execution model. HPX exposes an ISO C++ standard confirming API, which enables wait-free asynchronous parallel programming, including futures, channels, and other synchronization primitives. Being C++ standards conforming, HPX can run on a single machine as well as a cluster with thousands of nodes. Figure 1 gives us the architecture of HPX.
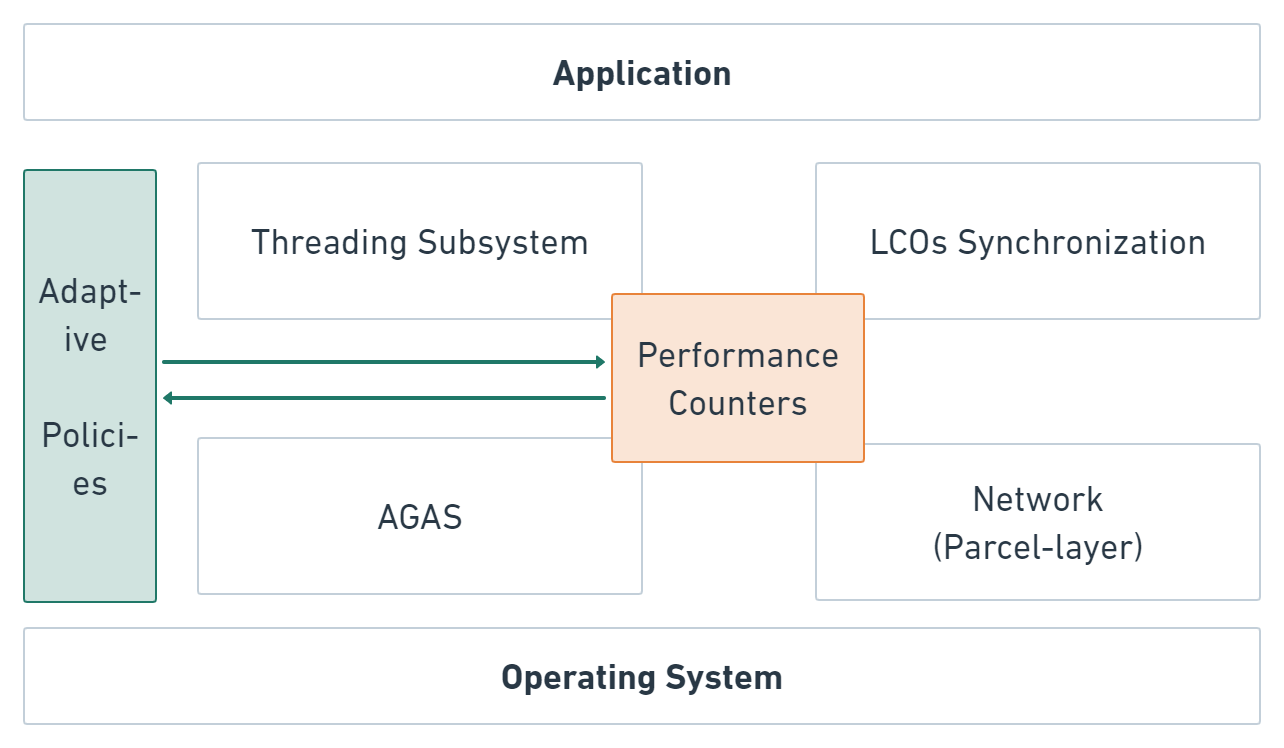
HPX utilizes Active Global Address Space (AGAS) for addressing any HPX object globally. Every object is assigned a Global Identifier (GID) that persists until object destruction. Furthermore, AGAS supports load balancing through object migration. HPX utilizes lightweight threads, called HPX threads, that are executed and scheduled on top of OS threads. Local Control Object (LCO) is a family of synchronization functions used to synchronize tasks generated by the application. HPX has an active-message networking layer that ships functions to the objects they operate on, i.e., the Parcel subsystem.
III-C Roofline Model
The Roofline Model [13, 14, 15] provides performance estimation keeping in mind the bottlenecks and bounds to predict a more realistic performance estimation. Usually, the performance is expressed as a function of peak Computational Performance (CP) of the architecture and the reachable peak I/O Bandwidth (BW). The CP is the maximum number of floating-point operations that the processor can achieve.
The Arithmetic Intensity (AI) is the number of operations executed per byte accessed from the main memory. It reveals the complexity of the algorithm. The model identifies the CP or the I/O BW as limiting factors. Ergo, the maximal attainable performance is always below the roofline obtained from both parameters:
| (1) |
IV Stencil Codes
In this paper, we explore a 1D stencil solver for the heat equation in one dimension and a 2D stencil solver implementing a Jacobi solver.
IV-A 1D Heat Equation
The diffusion equation, also known as heat equation in one dimension is given by:
| (2) |
where is unknown and is the diffusion constant. On discretizing the domain and replacing the derivatives by finite differences, one can derive a 3-point stencil to update a single cell as:
| (3) |
IV-B Jacobi Method for Linear Equation
Jacobi solvers are a class of iterative solvers for linear equations given by:
On a uniform grid with Dirichlet boundary conditions, the linear equation can be derived into a 5-point stencil to update a single cell as:
| (4) |
A detailed derivation is available at [16].
V Benchmarks
This Section discusses the implementation details of benchmarks, machine architectures and HPX configuration.
V-A 1D Stencil
For the 1D stencil, we implement a fully distributed 1D heat equation solver. This benchmark accurately measures the total execution time of the application. We report application execution time over kernel performance to investigate how the complete application scales on a distributed setting.
We run the application for two cases, i.e., weak and strong scaling. For weak scaling, we start with 480 million stencil points, and another 480 million stencil points are added for every node. For strong scaling, we benchmark with 1.2 billion stencil points. The benchmarks iterate over a hundred time steps.
V-B 2D stencil
For the 2D stencil, we implement a shared-memory based 2D stencil implementing Jacobi method. We make use of explicit vectorization to compare performance with an auto vectorized scalar code from the compiler. Assuming that the cache size is large enough to accommodate three rows of the grid, three memory transfers have to be done for every iteration, implying that for a double, a total of 24 Bytes are fetched from the main memory for every Lattice Site Update (LUP). Similarly, for a float, a total of 12 Bytes are fetched from the main memory. Thus, the Arithmetic Intensity (AI) for floats and doubles are LUP/Byte and LUP/Byte, respectively. The low arithmetic intensity makes the application memory bound for a broad class of processors.
Listing 2 shows parts of the C++ code written in HPX to generate a generic 2D stencil kernel that supports all floating-point data types. Grid is our custom class that abstracts away the data layout of our stencil. We make use of the Virtual Node Scheme [17] to generate a SIMD data layout of the stencil. To maintain this data layout, we need to update the boundaries to keep consistent data. This is done by shuffling the halo vectors to update according to the changes brought after executing the current time step (see Line 18). At Line 17, we use C++ type traits and our custom get_type meta-class to identify if a type is scalar or vector.
| Intel Xeon E5-2660 v3 | HiSilicon Kunpeng 916 | Marvell ThunderX2 | Fujitsu (FX1000) A64FX | |
| Processor Clock Speed | 2.6GHz | 2.4GHz | 2.4GHz | 2.2Ghz |
| Cores per processors | 10 | 64 | 32 | 48 (compute) + 4 (helper) |
| Processors per node | 2 | 1 | 1 | 1 |
| Threads per core | 2 | 1 | 4 | 1 |
| Vectorization | Double AVX2 Pipeline | Single NEON Pipeline | Double NEON Pipeline | Double SVE 512-bit |
| Double Precision FLOPS per cycle | 16 | 4 | 8 | 32 |
| Peak Performance in GFLOP/s | 832 | 614 | 1228 | 3379 |
We run the application with strong scaling since we are inclined to investigate the performance of the kernel. We report performance numbers for a grid size of . The row size has been chosen such that it fits easily in caches for our described assumptions to be true. Furthermore, the grid size is chosen to be large enough in an attempt to keep all processing cores busy. The benchmark iterates over a hundred time steps.
VI System Setup
We use the following clusters to access processors:
-
–
Juawei prototype cluster, JSC. We use the cluster to access Intel Xeon E5 2660 v3 and HiSilicon Kunpeng 916 nodes.
-
–
Sage prototype cluster, JSC. We use the cluster to access Marvell ThunderX2 nodes.
-
–
A64FX prototype cluster, Fujitsu. We use the cluster to access Fujitsu FX1000 A64FX nodes.
Table I lists the specification for all processors. Table II gives an overview of the dependencies of our benchmark. We choose GCC over Arm HPC compiler and Fujitsu Compiler. Arm compilers implement SVE data types using __sizeless_struct. __sizeless_struct determines vector length at runtime, thus making the SVE code portable in the sense that an executable can run all vector lengths supported by SVE (i.e., 128bits through 2048bits). However, one cannot wrap __sizeless_struct into a struct or a class unless the struct is also defined as __sizeless_struct. Since we make heavy use of the C++ STL vector and our custom class, we have to determine type and length at compile time. As SVE is bleeding-edge technology, there is no synergy between the implementation details of various compilers. Currently, only GCC provides the choice of passing SVE vector length at compile time. Therefore, we use GCC.
| Package Name | Version |
|---|---|
| GCC | 10.1 |
| hwloc | 2.1 |
| jemalloc | 5.2.1 |
| boost | 1.66 |
| HPX | commit c62d992 |
| NSIMD | commit d4f9fc5 |
| PAPI | 6.0.0 |
We make use of NSIMD111https://github.com/agenium-scale/nsimd for explicit vectorization. We chose NSIMD over explicitly using vector intrinsics because NSIMD provides a portable code supporting a wide array of vectorizations, including SVE. Portability allowed us to use the same code on all machine architectures and underlying vectors. To our knowledge, NSIMD and Inastemp [18] are the only C++ libraries for explicit vectorization that support SVE data types.
[terminal=latex] set terminal latex rotate size 3.5in,5in
set ylabel ”Memory Bandwidth (in GBps)” set xlabel ”Core count”
set size 1,1 set multiplot layout 2,2 title ”Memory Bandwidth using STREAM COPY Benchmark”
set title ”Xeon E5-2660 v3” unset key
set size 0.45,0.47 set origin 0,0.47 set xtics (1, 5, 10, 15, 20)
plot ”plots/2d_stencil/x86/x86_64_bandwidth.dat” using 1:(2/1000) lw 2 lt 7 lc -1 w lp,
set ylabel ”Memory Bandwidth (in GBps)”
set title ”ThunderX2”
set size 0.45,0.47 set origin 0,0 set xtics (1, 8, 16, 24, 32)
plot ”plots/2d_stencil/x2/aarch64_bandwidth.dat” using 1:(2/1000) lw 2 lt 7 lc -1 w lp,
unset multiplot
Apart from the specifications in Table I, we measure the memory bandwidth using the STREAM COPY benchmark [19]. Results of the run are available in Figure 2222Higher STREAM benchmark results can be obtained on A64FX using Fujitsu compiler and special cache initialization techniques. We use the STREAM benchmark as a reference performance metric for our stencil application. For us to make assertions about the optimality of stencil codes, we need to make sure that we do not optimize STREAM benchmarks using techniques that cannot be applied to the 2D stencil code. We make sure that STREAM benchmarks are NUMA aware as we make our 2D stencil code NUMA aware.. The benchmark was run ten times, and the highest memory bandwidth for the core count is reported. Due to the memory bound nature of stencil codes, memory bandwidth results are important to determine how our results compare to the expected peak deriving from the STREAM benchmark.
We run each variant of the 1D stencil and 2D stencil for three and five times respectively. In case of 1D stencil, we report the least time consumed amongst all runs. For 2D stencil, we report the maximum performance achieved for a particular data type. While hyperthreading is enabled on all the cores, we pin to the physical PUs to ensure that the benchmark effectively uses L1 and L2 caches. In a hyperthreaded scenario, the pressure on the cache increases that may result in cache evictions leading to a possible loss in performance. All the benchmarks are run by pinning one thread per core using hwloc-bind. Finally, we turn all optimization flags on, i.e. -O3, -ftree-vectorize, -ffast-math for the best possible performances.
Hardware Counters: We use Linux perf and PAPI to get access to the hardware counters to better explain any aberration in results. All hardware counters were run on a single physical core on a smaller grid size of 8192 16384 for a hundred iteration.
VII Results
VII-A 1D Stencil
Figure 3 succinctly presents the results of strong and weak scaling. The distributed application is implemented such that network latencies can be hidden under compute. Furthermore, the application is also NUMA aware. This is made possible by utilizing block allocators implemented within HPX. The allocator allocates memory based on Linux’s first touch data placement policy. This is similar to OpenMP’s schedule(static) policy. Combined with the block executor, we make sure that an HPX thread always spawns at a location of data. Thus, we are able to make up for the lack of bandwidth between chip-to-chip communications. For Fujitsu A64FX, we compiled all dependencies using the Fujitsu compiler. Furthermore, we build the HPX parcelport backend using Fujitsu MPI for easier integration with the system. For all other processors, results are considered according to the benchmark dependencies, as described in Table II.
[terminal=latex] set terminal latex rotate size 3.5in,3.8in
set ylabel ”Execution Time (s)” set xlabel ”Node count”
set size 1,1 set multiplot layout 2,2 title ”1D Stencil: Distributed Results”
unset key
set size 0.5,0.8 set origin 0,0.1
set title ”Strong Scaling”
set xtics (1, 2, 4, 6, 8)
plot ”plots/1d_stencil/x86/result_x86” title ”Xeon E5” lw 2 lc -1 w lp, ”plots/1d_stencil/hi1616/result_hi1616” title ”Kunpeng 916” lw 2 lt 7 lc -1 w lp, ”plots/1d_stencil/a64fx/strong_a64fx” title ”A64FX” lw 2 lt 9 lc -1 w lp,
set size 0.5,0.8 set origin 0.5,0.1
set title ”Weak Scaling”
unset ylabel
set xtics (1, 2, 4, 6, 8)
plot ”plots/1d_stencil/x86/weak_x86” title ”Xeon E5” lw 2 lc -1 w lp, ”plots/1d_stencil/hi1616/weak_hi1616” title ”Kunpeng 916” lw 2 lt 7 lc -1 w lp, ”plots/1d_stencil/a64fx/weak_a64fx” title ”A64FX” lw 2 lt 9 lc -1 w lp,
set size 1,0.15 set origin 0,-0.05 unset title set key horizontal center unset tics unset xlabel unset ylabel set yrange [0:1] plot 2 t ’Xeon E5’ lw 2 lc -1 w lp, 2 t ’Kunpeng 916’ lw 2 lt 7 lc -1 w lp, 2 t ’A64FX’ lw 2 lt 9 lc -1 w lp,
unset multiplot
For Intel Xeon E5 and Fujitsu A64FX under strong scaling, the application takes 28s and 18s respectively for a single node and 3.8s and 2.5s respectively involving eight nodes, which is close to linear scaling (the factor being 7.36 and 7.2, respectively). We expected a similar behavior as sufficient parallelism can be derived from the given number of stencil points to hide network latencies. Under weak scaling, the application takes 12s and 7.5s respectively irrespective of the number of nodes which proves that the network latencies are aptly hidden.
For Kunpeng 916, we do not observe linear scaling. On closer inspection, we observed that the network performance on the Hi1616 nodes is unsatisfactory and that the processor is not able to exploit the capabilities of the InfiniBand network making it difficult to hide network latencies and the results are transferred to the graph. This hypothesis is well proven under weak scaling, where we see a significant increase in execution times as we increase the number of nodes.
VII-B 2D Stencil
The expected peak performance can be calculated with the recorded Memory Bandwidth, and calculated Arithmetic Intensity (See V-B) by putting the values in Equation 1. We do not aim to be optimal as further micro-optimizations can be made on our 2D stencil implementation. Our results will be considered optimal if we reach close to this expected peak performance. We make use of hardware performance counters to explain any aberrations in the results.
[terminal=latex] set terminal latex rotate size 3.5in,3.8in
set ylabel ”Performance (in GLUPs/s)” set xlabel ”Core count”
set size 1,1 set multiplot layout 2,2 title ”2D Stencil: Intel Xeon E5-2660 v3”
unset key
set size 0.5,0.8 set origin 0,0.1
set title ”Single Precision”
set xtics (1, 5, 10, 15, 20)
plot ”plots/2d_stencil/x86/x86_64_float” using 1:(3/1000) title ”vector” lw 2 lt 7 lc -1 w lp, ”plots/2d_stencil/x86/x86_64_bandwidth.dat” using 1:(3/1000) title ”scalar” lw 2 lc -1 w lp, ”plots/2d_stencil/x86/x86_64_ndouble” using 1:(2/24000) title ”Expected peak” lw 2 lt 9 lc -1 w lp,
set size 1,0.15 set origin 0,-0.05 unset title set key horizontal center unset tics unset xlabel unset ylabel set yrange [0:1] plot 2 t ’scalar’ lw 2 lc -1 w lp, 2 t ’vector’ lw 2 lt 7 lc -1 w lp, 2 t ’Expected Peak’ lw 2 lt 9 lc -1 w lp,
unset multiplot
Our noticeable observation about GCC is its ability to auto vectorize our 2D stencil application. We observe that the instruction count with auto vectorized codes is similar to our explicitly vectorized codes, sometimes even beating it at instruction count. Visible differences come from cache-misses and CPU stalls arising from different data layout pattern design by GCC and our code. The next few paragraphs discuss processor specific results in detail.
Table III describes the major contributing hardware counters that directly contribute to performance differences for Intel Xeon E5. We observed a 2x difference in instruction count between scalar and vector types, i.e., GCC is not able to auto vectorize the code very well. The lower instruction count certainly helps an explicitly vectorized code to perform better. Interestingly, the cache friendly optimization from GCC is highly optimized for x86 architecture. This can be seen by the lower cache miss counts for auto vectorized codes.
| Data Type | Instruction | Cache Misses |
|---|---|---|
| Float | 3.153 | 2.121 |
| Vector Float | 1.783 | 3.706 |
| Double | 6.01 | 4.74 |
| Vector Double | 3.507 | 8.751 |
Furthermore, PUs are able to keep only certain memory transactions in the flight. One can make use of CPU stall cycles to determine these numbers. Unfortunately, Intel Xeon E5 2660v3 doesn’t support these counters. Nonetheless, we believe that the lower instruction counts relieve the memory controllers of excessive memory transactions improving the performance further. We hypothesize that the improvements of up to 50% with vectorized floats are a result of decreased memory transactions. Given doubles occupy eight bytes, we do not expect much performance improvements with decreased instruction count on an already busy memory bus, which can be easily visualized in the graphs with only up to 10% improvements in performances.
[terminal=latex] set terminal latex rotate size 3.5in,3.8in
set ylabel ”Performance (in GLUPs/s)” set xlabel ”Core count”
set size 1,1 set multiplot layout 2,2 title ”2D Stencil: Huawei Hi1616”
unset key
set size 0.5,0.8 set origin 0,0.1
set title ”Single Precision”
set xtics (1, 8, 16, 24, 32, 40, 48, 56, 64) rotate by 90 offset 0,-1
plot ”plots/2d_stencil/hi1616/Hi1616_float” using 1:(3/1000) title ”vector” lw 2 lt 7 lc -1 w lp, ”plots/2d_stencil/hi1616/aarch64_bandwidth.dat” using 1:(3/1000) title ”scalar” lw 2 lc -1 w lp, ”plots/2d_stencil/hi1616/Hi1616_ndouble” using 1:(2/24000) title ”Expected peak” lw 2 lt 9 lc -1 w lp,
set size 1,0.15 set origin 0,-0.05 unset title set key horizontal center unset tics unset xlabel unset ylabel set yrange [0:1] plot 2 t ’scalar’ lw 2 lc -1 w lp, 2 t ’vector’ lw 2 lt 7 lc -1 w lp, 2 t ’Expected Peak’ lw 2 lt 9 lc -1 w lp,
unset multiplot
| Data Type | Instruction | Cache Misses |
|---|---|---|
| Float | 4.3 | 3.148 |
| Vector Float | 4.144 | 2.512 |
| Double | 8.321 | 5.639 |
| Vector Double | 8.236 | 4.953 |
[terminal=latex] set terminal latex rotate size 3.5in,3.8in
set ylabel ”Performance (in GLUPs/s)” set xlabel ”Core count”
set size 1,1 set multiplot layout 2,2 title ”2D Stencil: Fujitsu A64FX (Compute cores only)”
unset key
set size 0.5,0.8 set origin 0,0.1
set title ”Single Precision”
set xtics (1, 6, 12, 18, 24, 30, 36, 42, 48) rotate by 90 offset 0,-1
plot ”plots/2d_stencil/a64fx-new/131072/a64fx_float” using 1:(3/1000) title ”vector” lw 2 lt 7 lc -1 w lp, ”plots/2d_stencil/a64fx-new/131072/aarch64_bandwidth.dat” using 1:(2/12000) title ”Expected peak Min” lw 2 lt 9 lc -1 w lp,
set size 0.5,0.8 set origin 0.5,0.1
set title ”Double Precision”
unset ylabel
set xtics (1, 6, 12, 18, 24, 30, 36, 42, 48) rotate by 90 offset 0,-1
plot ”plots/2d_stencil/a64fx-new/131072/a64fx_double” using 1:(3/1000) title ”vector” lw 2 lt 7 lc -1 w lp, ”plots/2d_stencil/a64fx-new/131072/aarch64_bandwidth.dat” using 1:(2/24000) title ”Expected peak Min” lw 2 lt 9 lc -1 w lp,
set size 1,0.15 set origin 0,-0.05 unset title set key horizontal center right unset tics unset xlabel unset ylabel set yrange [0:1] plot 2 t ’scalar’ lw 2 lc -1 w lp, 2 t ’vector’ lw 2 lt 7 lc -1 w lp, 2 t ’Expected Peak Max’ lw 2 lt 9 lc -1 w lp, 2 t ’Expected Peak Min’ lw 2 lt 9 lc -1 w lp,
unset multiplot
HiSilicon Hi1616 shows up to 80% improvements with explicit vectorization. Table IV describes differentiating hardware counter results. The table suggests that GCC is able to auto vectorize the results very well. Explicit vectorization resulted in a mere 5% improvement in instruction count. The auto vectorization does fail in exploiting caches that can be observed by a 10-20% decline in cache misses by moving to an explicitly vectorized code. We believe that the remaining difference arises from Backend stalls. Unfortunately, Hi1616 doesn’t support CPU stall counters, but we hypothesize this based on our results on ThunderX2 (result described in the coming paragraphs) where we see similar behaviors. Backend stalls are generally caused either by many long-latency operations such as multiply and divide, or by long-latency memory operations, or both. In our case, our stencil kernel uses simpler operations, so, a majority of such stalls are caused by memory operations. With explicit vectorization, we believe that we’ve reduced these memory transactions considerably allowing us for better performances.
Another interesting observation is the sudden decrease in performance while moving from 32 to 40 cores and 56 to 64 cores. It can be explained by understanding how memory controllers work. When the application runs on 40 cores, two of the NUMA domains are fully saturated with respect to memory bandwidth, while the third NUMA domain is only partially saturated. This uneven distribution leads to faster iteration in the fully saturated domains, leaving a trail of poor performance for the partially saturated domain. Therefore, a partially saturated NUMA domain becomes the critical path for the benchmark. With lower memory bandwidth available to the partially saturated domain, we see a loss in performance.
For Fujitsu A64FX, the execution time for the 2D stencil kernel is less than 2s for scalar and vector floats and about 3.5s for scalar and vector doubles while utilizing all 48 compute cores. Compared to the other processors, the execution time is significantly lower. This piqued our interest, and we investigated whether we have enough parallelism for HPX to take advantage of. Like every AMT model, HPX is known to have contention overheads when the grain size is too small.
[terminal=latex] set terminal latex rotate size 3.5in,3.8in
set ylabel ”Performance (in GLUPs/s)” set xlabel ”Core count”
set size 1,1 set multiplot layout 2,2 title ”2D Stencil: Fujitsu A64FX (Compute cores only)”
unset key
set size 0.5,0.8 set origin 0,0.1
set title ”Single Precision”
set xtics (1, 6, 12, 18, 24, 30, 36, 42, 48) rotate by 90 offset 0,-1
plot ”plots/2d_stencil/a64fx-new/196608/a64fx_float” using 1:(3/1000) title ”vector” lw 2 lt 7 lc -1 w lp, ”plots/2d_stencil/a64fx-new/196608/aarch64_bandwidth.dat” using 1:(2/12000) title ”Expected peak Min” lw 2 lt 9 lc -1 w lp,
set size 0.5,0.8 set origin 0.5,0.1
set title ”Double Precision”
unset ylabel
set xtics (1, 6, 12, 18, 24, 30, 36, 42, 48) rotate by 90 offset 0,-1
plot ”plots/2d_stencil/a64fx-new/196608/a64fx_double” using 1:(3/1000) title ”vector” lw 2 lt 7 lc -1 w lp, ”plots/2d_stencil/a64fx-new/196608/aarch64_bandwidth.dat” using 1:(2/24000) title ”Expected peak Min” lw 2 lt 9 lc -1 w lp,
set size 1,0.15 set origin 0,-0.05 unset title set key horizontal center right unset tics unset xlabel unset ylabel set yrange [0:1] plot 2 t ’scalar’ lw 2 lc -1 w lp, 2 t ’vector’ lw 2 lt 7 lc -1 w lp, 2 t ’Expected Peak Max’ lw 2 lt 9 lc -1 w lp, 2 t ’Expected Peak Min’ lw 2 lt 9 lc -1 w lp,
unset multiplot
We decided to investigate by increasing the grid size. We discovered that 32GB High Bandwidth Memory (HBM) can be a disadvantage for memory-intensive applications. For instance, our grid requires 9GB worth of DRAM. A 2D stencil code has two grids, i.e., 18GB worth of DRAM. We can, therefore, only test grid sizes of up to 1.5x the current size. Our investigation results suggest that there are no performance benefits (see Figure 7) in increasing grid size. This means that HPX is able to take advantage of the underlying parallelism.
| Data Type | Instruction | Frontend Stalls | Backend Stalls |
|---|---|---|---|
| Float | 1.284 | 3.801 | 9.43 |
| Vector Float | 1.496 | 2.918 | 8.003 |
| Double | 2.299 | 3.86 | 1.871 |
| Vector Double | 2.956 | 3.56 | 1.443 |
Another interesting observation is the better performance compared to the expected peak assuming three memory transfers per iteration. We claimed that the caches were large enough to accommodate three rows resulting in three memory transfer per iteration. With A64FX, we observe that the results do not follow the scheme. Due to large sized cache lines, we see cache benefits resulting in better Arithmetic Intensity. We witness results equivalent to cache blocking version of 2D stencil up to 32 cores. A cache blocked version of 2D stencil essentially reduces the number of memory transfers per iteration, in our case, by one. This results in a 49% performance boost over the previously expected results.
The significant increase in performance going from half saturated NUMA domain to a fully saturated NUMA domain can be explained using the same principles as described for HiSilicon Hi1616. We use a 512-bit SVE vector length for benchmarking the 2D stencil. From the results, it is clear that no significant improvements are achieved by explicitly vectorizing the code. The improvements are anywhere from 5% to 15%. Table V provides some insights. Firstly, glancing at the instruction count, we observe that GCC does a better job of optimizing the instruction count than our explicitly vectorized code. The cache miss counts were very similar for auto vectorized and explicitly vectorized codes as well. What differs visibly are the CPU stall counts. This means that explicit vectorization is helping to relieve stress from the memory controllers. Due to significant reductions in CPU stalls for vectorized codes, we get marginally better results.
[terminal=latex] set terminal latex rotate size 3.5in,3.8in
set ylabel ”Performance (in GLUPs/s)” set xlabel ”Core count”
set size 1,1 set multiplot layout 2,2 title ”2D Stencil: Marvell ThunderX2”
unset key
set size 0.53,0.8 set origin 0,0.1
set title ”Single Precision”
set xtics (1, 8, 16, 24, 32)
plot ”plots/2d_stencil/x2/x2_float” using 1:(3/1000) title ”vector” lw 2 lt 7 lc -1 w lp, ”plots/2d_stencil/x2/aarch64_bandwidth.dat” using 1:(2/12000) title ”Expected peak Min” lw 2 lt 9 lc -1 w lp,
set size 0.47,0.8 set origin 0.53,0.1
set title ”Double Precision”
unset ylabel
set xtics (1, 8, 16, 24, 32)
plot ”plots/2d_stencil/x2/x2_double” using 1:(3/1000) title ”vector” lw 2 lt 7 lc -1 w lp, ”plots/2d_stencil/x2/aarch64_bandwidth.dat” using 1:(2/24000) title ”Expected peak Min” lw 2 lt 9 lc -1 w lp,
set size 1,0.15 set origin 0,-0.05 unset title set key horizontal center right unset tics unset xlabel unset ylabel set yrange [0:1] plot 2 t ’scalar’ lw 2 lc -1 w lp, 2 t ’vector’ lw 2 lt 7 lc -1 w lp, 2 t ’Expected Peak Max’ lw 2 lt 9 lc -1 w lp, 2 t ’Expected Peak Min’ lw 2 lt 9 lc -1 w lp,
unset multiplot
For Marvell ThunderX2, we see a similar behavior as observed in A64FX. Single precision performance is taking complete advantage of a large cache line. Cache blocking behavior can be observed, leading to an additional 49% performance boost over an implementation assuming three memory transfers per iteration. With doubles, we see contradictory behavior. At lower core count, it behaves optimally according to our assumed arithmetic intensity. At 16 cores and above, the behavior changes to an arithmetic intensity of 1/8 and 1/16 for floats and doubles, respectively. This leads to an improvement in performance. Using hardware stall counters, we found that the number of backend and frontend stalls for explicitly vectorized code that shows this interesting switch reduced by about 40% from and (for auto vectorization) to and (for explicit vectorization), respectively, at a core count of 32, leading to a significant increase in performance. However, the total number of instructions and cache misses were similar for both auto vectorized and explicitly vectorized codes. Unfortunately, we were not able to identify the reason behind this interesting switch and it remains an open question.
| Data Type | Instruction | L2 Cache Misses | Backend Stalls |
|---|---|---|---|
| Float | 4.039 | 1.811 | 1.522 |
| Vector Float | 4.394 | 1.69 | 6.437 |
| Double | 8.065 | 5.716 | 3.298 |
| Vector Double | 8.756 | 6.055 | 2.826 |
Effects of adding explicit vectorization are significant. While GCC is able to auto vectorize the code well (see Table VI), we notice that the implementation is rather unoptimized. We observe a decrease in L2 cache misses of about 10% (No visible difference in L1 cache misses, hence not reported). The number of backend stalls observed in the case of GCC is considerably higher compared to an explicitly vectorized code. This means that outstanding load/store instructions with explicit vectorization is noticeably lower than an auto vectorized code. In this regard, we believe that ThunderX2 microarchitecture behaves similar to Cortex-A72 where we saw that cache misses differed by only 15%, but the resulting performance gap was upwards of 50%. We see significant improvements by utilizing explicit vectorization. These improvements were consistently within 50-60% for floats and up to 40% for doubles. The results also look nearly optimal for the given memory bandwidth.
VIII Conclusion
This paper gives a first overview of the performance of AMTs running at scale on a production HPC system that is based on Arm processors. Our experience of porting HPX and the benchmarks to Arm processors was mostly straightforward. We faced a few issues when building for SVE types. Arm Compilers implement SVE using __sizeless_struct making it impossible to wrap an SVE type to the custom container as they have no size at compile time. Currently, only GCC allows the commandline flag to pass SVE vector length with the -msve-vector-bits. However, this comes at the cost of SVE type portability. Further development is required to integrate custom containers to work with __sizeless_struct to make it easier for application developers to port their application to Arm.
We demonstrate that the application scales both on-node and distributed. We found that performance on Arm processors is as good or better than their x86 brethren. For the 1D stencil, all processors except Kunpeng 916 showed good scaling results. In the case of Kunpeng 916, the poor interconnect network is to be blamed. For the 2D stencil, we observed that processors with large cache lines showed inherent cache blocking benefits (without explicit implementation). This resulted in about a 50% performance boost over the expected results. We also observed that explicit vectorization can improve the performance significantly for ThunderX2 and Kunpeng 916 due to considerably lower CPU stall counts when compared with auto vectorized codes. For A64FX, we did not observe any visible performance benefits by employing explicit vectorization.
IX Acknowledment
We would like to thank Huawei for making the JUAWEI cluster hardware available at JSC as well as Fujitsu for allowing us to participate in the A64FX early access program. Funding for parts of this work is received from the European Commission H2020 program under Grant Agreement 779877(Mont-Blanc 2020).
We are grateful for the insights provided by Dr. Thomas Heller (Exasol) and Prof. Hartmut Kaiser (LSU, USA) in analyzing and optimizing our benchmarks.
References
- [1] Fujitsu. (2019) Supercomputer fugaku. [Online]. Available: https://www.fujitsu.com/global/Images/supercomputer-fugaku.pdf
- [2] N. Stephens, S. Biles, M. Boettcher, J. Eapen, M. Eyole, G. Gabrielli, M. Horsnell, G. Magklis, A. Martinez, N. Premillieu et al., “The arm scalable vector extension,” IEEE Micro, vol. 37, no. 2, pp. 26–39, 2017.
- [3] S. McIntosh-Smith, J. Price, T. Deakin, and A. Poenaru, “Comparative benchmarking of the first generation of hpc-optimised arm processors on isambard,” 2018.
- [4] S. McIntosh-Smith, J. Price, A. Poenaru, and T. Deakin, “Scaling results from the first generation of arm-based supercomputers.”
- [5] A. Jackson, A. Turner, M. Weiland, N. Johnson, O. Perks, and M. Parsons, “Evaluating the arm ecosystem for high performance computing,” in Proceedings of the Platform for Advanced Scientific Computing Conference, ser. PASC ’19. New York, NY, USA: Association for Computing Machinery, 2019. [Online]. Available: https://doi.org/10.1145/3324989.3325722
- [6] F. Banchelli, M. Garcia, M. Josep, F. Mantovani, J. Morillo, K. Peiro, G. Ramirez, G. Valenzano, and J. W. Weloli, “Mb3 d6. 9–performance analysis of applications and mini-applications and benchmarking on the project test platforms. version 1.0.”
- [7] H. Kaiser, M. Brodowicz, and T. Sterling, “ParalleX an advanced parallel execution model for scaling-impaired applications,” in 2009 International Conference on Parallel Processing Workshops, 2009, pp. 394–401.
- [8] M. Anderson, M. Brodowicz, H. Kaiser, and T. Sterling, “An application driven analysis of the parallex execution model,” 2011.
- [9] T. Heller, H. Kaiser, and K. Iglberger, “Application of the parallex execution model to stencil-based problems,” Computer Science - Research and Development, vol. 28, no. 2, pp. 253–261, May 2013. [Online]. Available: https://doi.org/10.1007/s00450-012-0217-1
- [10] H. Kaiser, T. Heller, B. Adelstein-Lelbach, A. Serio, and D. Fey, “Hpx: A task based programming model in a global address space,” in Proceedings of the 8th International Conference on Partitioned Global Address Space Programming Models, ser. PGAS ’14. New York, NY, USA: Association for Computing Machinery, 2014. [Online]. Available: https://doi.org/10.1145/2676870.2676883
- [11] T. Heller, P. Diehl, Z. Byerly, J. Biddiscombe, and H. Kaiser, “HPX – An open source C++ Standard Library for Parallelism and Concurrency,” in Proceedings of OpenSuCo 2017, Denver, Colorado USA, November 2017 (OpenSuCo’17), 2017, p. 5.
- [12] H. Kaiser, B. A. L. aka wash, T. Heller, M. Simberg, A. Bergé, J. Biddiscombe, aurianer, A. Bikineev, G. Mercer, A. Schäfer, K. Huck, A. S. Lemoine, T. Kwon, J. Habraken, M. Anderson, M. Copik, S. R. Brandt, M. Stumpf, D. Bourgeois, D. Blank, S. Jakobovits, V. Amatya, rstobaugh, L. Viklund, Z. Khatami, P. Diehl, T. Pathak, D. Bacharwar, S. Yang, and E. Schnetter, “STEllAR-GROUP/hpx: HPX V1.4.1: The C++ Standards Library for Parallelism and Concurrency,” Feb. 2020. [Online]. Available: https://doi.org/10.5281/zenodo.3675272
- [13] S. Williams, A. Waterman, and D. Patterson, “Roofline: An insightful visual performance model for multicore architectures,” Commun. ACM, vol. 52, no. 4, p. 65–76, Apr. 2009. [Online]. Available: https://doi.org/10.1145/1498765.1498785
- [14] S. Williams, D. Patterson, L. Oliker, J. Shalf, and K. Yelick, “The roofline model: A pedagogical tool for auto-tuning kernels on multicore architectures,” in Hot Chips, vol. 20, 2008, pp. 24–26.
- [15] S. W. Williams, “Auto-tuning performance on multicore computers,” Ph.D. dissertation, USA, 2008.
- [16] R. Barrett, M. Berry, T. F. Chan, J. Demmel, J. Donato, J. Dongarra, V. Eijkhout, R. Pozo, C. Romine, and H. van der Vorst, Templates for the Solution of Linear Systems: Building Blocks for Iterative Methods. Society for Industrial and Applied Mathematics, 1994. [Online]. Available: https://epubs.siam.org/doi/abs/10.1137/1.9781611971538
- [17] P. Boyle, A. Yamaguchi, G. Cossu, and A. Portelli, “Grid: A next generation data parallel c++ qcd library,” arXiv preprint arXiv:1512.03487, 2015.
- [18] B. Bramas, “Inastemp: A novel intrinsics-as-template library for portable simd-vectorization,” Scientific Programming, vol. 2017, p. 5482468, Sep 2017. [Online]. Available: https://doi.org/10.1155/2017/5482468
- [19] J. D. McCalpin, “Memory bandwidth and machine balance in current high performance computers,” IEEE Computer Society Technical Committee on Computer Architecture (TCCA) Newsletter, pp. 19–25, Dec. 1995.