Automating Abnormality Detection in Musculoskeletal Radiographs through Deep Learning
Abstract
This paper introduces MuRAD (Musculoskeletal Radiograph Abnormality Detection tool), a tool that can help radiologists automate the detection of abnormalities in musculoskeletal radiographs (bone X-rays). MuRAD utilizes a Convolutional Neural Network (CNN) that can accurately predict whether a bone X-ray is abnormal, and leverages Class Activation Map (CAM) to localize the abnormality in the image. MuRAD achieves an F1 score of 0.822 and a Cohen’s kappa of 0.699, which is comparable to the performance of expert radiologists.
1 Introduction
A critical task for radiologists is determining whether a study is abnormal. If the study is normal, the patient is free of disease and does not have to undergo further diagnostic procedures, but if it is not, the patient may need to be further evaluated if an abnormality is detected with some confidence. Musculoskeletal abnormality detection is particularly important as musculoskeletal conditions are the most common cause of disability and severe, long-term pain, with more than 1.7 billion people affected worldwide with over 30 million annual ER visits [1].
An automated tool for abnormality detection in bone X-rays has important clinical applications. First, it can be utilized for worklist prioritization. In this scenario, cases that are deemed abnormal can be prioritized so that the sickest patient gets the care first. Moreover, it can assign an initial reading of normal for studies without an abnormality, which can help manage workflow and, by providing rapid results to the ordering health provider, improve disposition in other areas of the healthcare system. Second, this tool can help combat radiologist fatigue. Radiologists worldwide are reading an increasing number of cases with more images per case, and problems are exacerbated for those in underserved communities [2]. Fatigue can impact diagnostic accuracy, as evidenced by the results of a study that found there was a statistically significant reduction in fracture detection at the end of the work day compared to the beginning of the work day [3]. A tool that can highlight the abnormality in an image can draw the attention of the radiologist, which could potentially reduce errors, speed up image interpretation, and help standardize diagnostic quality.
A machine learning approach to this problem faces two challenges. The first challenge is data. In order to create a model that can, with high confidence, detect and localize abnormality in a bone X-ray, the model needs to be trained on a large collection of labeled musculoskeletal radiographs, which is hard to come by. The second challenge is finding the appropriate machine learning approach that can interpret the data with high accuracy.
This paper introduces MuRAD (Musculoskeletal Radiograph Abnormality Detection tool) to overcome these challenges, a Convolutional Neural Network (CNN) trained on Stanford’s MURA dataset and equipped with Class Activation Map (CAM) to determine whether an image is abnormal and localize the abnormality when it is detected [4]. Multiple CNNs were tested to find the one with the best performance, given that they allow us to adapt the model to the specific features of bone X-rays,. Furthermore, leveraging CAM helps us create heat maps on each image that highlight the detected abnormality.
2 Related work
Large medical datasets have enabled expert-level performance for detection of hip fracture [5], pneumonia [6], brain hemorrhage [7], heart arrhythmia [8], lymph node metastases [9], skin cancer [10], and diabetic retinopathy [11]. There has been efforts to make medical radiography repositories available online, with a summary of the ones publicly available shown in Table 1. Except for MURA [12] (which is used in this study), all datasets have labels that are automatically generated from radiologist reports.
| dataset | Study type | Label | Images |
|---|---|---|---|
| MURA [12] | musculoskeletal (upper extremity) | abnormality | 40,561 |
| Pediatric Bone Age [13] | musculoskeletal (hand) | bone age | 14,236 |
| Digital Hand Atlas [14] | musculoskeletal (left hand) | bone age | 1,390 |
| ChestX-ray13 [15] | chest | multiple pathologies | 112,120 |
| OpenI [16] | chest | multiple pathologies | 7,470 |
| MC [17] | chest | abnormality | 138 |
| Shenzhen [17] | chest | Tuberculosis | 662 |
| JSRT [18] | chest | pulmonary nodule | 247 |
| DDSM [19] | mammogram | breast cancer | 10,239 |
There are only a few publicly available datasets of musculoskeletal radiographs, and each of those contain fewer than 15,000 images. These include a dataset of pediatric hand radiographs annotated with skeletal age from Stanford Program for Artificial Intelligence in Medicine and Imaging [13], and a dataset of left hand radiographs from children of different ages labeled with radiologist readings of bone age [14].
Along with the MURA dataset, which contains around 41,000 musculoskeletal radiographs from around 15,000 studies, researchers at Stanford developed a machine learning model for abnormality detection [4]. They trained a 169-layer CNN to estimate the probability of abnormality for each image in the study, with the network using a Dense Convolutional Network architecture [20].
3 Method
For developing MuRAD, numerous CNNs were trained on the MURA dataset, and the one that performed best was equipped with CAM to locate abnormalities. The following subsections provide more detail about the dataset, model, and CAM implementation.
3.1 Dataset
The Stanford MURA dataset was collected from HIPAA-compliant images from the Picture Archive and Communication System (PACS) of Stanford Hospital [4, 12]. The dataset consists of 40,561 multi-view radiographs from 14,863 studies of 12,173 patients between 2001 and 2012. Each image belongs to one of seven standard upper extremity radiographic study types: elbow, finger, forearm, hand, humerus, shoulder, and wrist. Each study was manually labeled as normal or abnormal by board-certified radiologists at the time of interpretation and diagnosis. The dataset is split into training (11,184 patients, 13,457 studies, 36,808 images), validation (783 patients, 1,199 studies, 3,197 images), and test (206 patients, 207 studies, 556 images) sets. A summary of the distribution of normal and abnormal studies in the training and validation sets is provided in Table 2.
| Study | Train | Validation | Total | ||
|---|---|---|---|---|---|
| Normal | Abnormal | Normal | Abnormal | ||
| Elbow | 1,094 | 660 | 92 | 66 | 1,912 |
| Finger | 1,280 | 655 | 92 | 83 | 2,110 |
| Hand | 1,497 | 521 | 101 | 66 | 2,185 |
| Humerus | 321 | 271 | 68 | 67 | 727 |
| Forearm | 590 | 287 | 69 | 64 | 1,010 |
| Shoulder | 1,364 | 1,457 | 99 | 95 | 3,015 |
| Wrist | 2,134 | 1,326 | 140 | 97 | 3,697 |
| Total number of studies | 8,280 | 5,177 | 661 | 538 | 14,656 |
The test set of the MURA dataset is not publicly available; therefore, in this study the results obtained from the validation set are reported instead.
3.2 Model
Various CNNs were examined in order to select the one with the best performance for MuRAD. These models were variants of VGG [21], DenseNet [20], ResNet [22], ResNeXt [23], Inception [24], and MobileNet [25]. A few of them are briefly described in what follows.
The VGG model uses an architecture with very small (3 3) convolutional filters, which shows a significant improvement on previous configurations can be achieved by pushing the depth to 16 - 19 layers [21]. The DenseNet model uses an architecture consisting of multiple dense blocks, in which each layer is connected to every other layer in a feed-forward fashion [20]. For each layer, the feature-maps of all preceding layers are used as inputs, and its own feature-maps are used as inputs into all subsequent layers. This architecture has several advantages: it alleviates the vanishing-gradient problem, strengthens feature propagation, encourages feature reuse, and substantially reduces the number of parameters. A DenseNet model can have depths as high as 201 layers. Finally, the ResNet model uses a residual learning framework for improving training of networks that are substantially deeper than those normally used [22]. In this model each layer learns residual functions with reference to the layer inputs, instead of learning unreferenced functions. A ResNet model can have depths as high as 152 layers.
Transfer learning concepts were leveraged for better training. The weights of each model were initialized to those of the model trained on the ImageNet dataset, which helped us reach the desired optimal point faster. Because of this, each image was normalized before training to have the same mean and standard deviation as those in the ImageNet dataset. Additionally, images were resized to 320 320 pixels and augmented by applying random lateral inversions and rotations of up to 30 degrees. Each model was trained for 100 epochs with mini-batches of size 16, 32, or 64 - depending on the model’s use of GPU memory - using Adam with a learning rate of 0.0001 and default parameters. The learning rate was decayed by a factor of 10 each time the validation loss plateaued after an epoch. All models were trained on Virginia Tech’s Advanced Research Computing NewRiver system. Each model was trained on one node utilizing two Nvidia P100 GPUs [26].
After evaluating model performance, CAM was implemented on the best performing model. When inputting a radiograph into the fully trained model, if an abnormality was detected CAM would take a weighted average of the feature maps of the last convolutional layer to locate the abnormality. Essentially, if the -th feature map output of the model on image was and the -th fully connected weight was , CAM could be written as
| (1) |
Finally, was upscaled to the dimensions of the image and overlayed on the image to indicate the location of the abnormality.
4 Results
Overall, 18 CNNs were trained and their performance was evaluated on the validation dataset. These models were selected based on their ImageNet Top-1 crop error rate. A summary of the results can be seen in Table 3.
| Model | Accuracy | Precision | Recall | F1 | Cohen’s | Number of | Training |
| score | kappa | parameters (M) | time | ||||
| DenseNet 121 | 0.853 | 0.904 | 0.753 | 0.822 | 0.699 | 8 | 492 |
| DenseNet 161 | 0.844 | 0.844 | 0.751 | 0.812 | 0.680 | 30 | 1083 |
| DenseNet 169 | 0.843 | 0.896 | 0.736 | 0.808 | 0.678 | 14 | 595 |
| DenseNet 201 | 0.847 | 0.899 | 0.742 | 0.813 | 0.685 | 20 | 888 |
| Inception V3 | 0.787 | 0.854 | 0.632 | 0.727 | 0.558 | 25 | 354 |
| MobileNet V2 | 0.837 | 0.896 | 0.721 | 0.799 | 0.665 | 3.4 | 203 |
| ResNet 34 | 0.842 | 0.905 | 0.725 | 0.805 | 0.675 | 24.3 | 244 |
| ResNet 50 | 0.838 | 0.910 | 0.710 | 0.798 | 0.666 | 25.6 | 427 |
| ResNet 101 | 0.848 | 0.901 | 0.744 | 0.815 | 0.688 | 44.5 | 654 |
| ResNet 152 | 0.852 | 0.913 | 0.742 | 0.819 | 0.696 | 60.2 | 1019 |
| ResNext 50 | 0.844 | 0.893 | 0.742 | 0.810 | 0.680 | 25.6 | 1054 |
| ResNext 101 | 0.842 | 0.896 | 0.734 | 0.807 | 0.676 | 44.5 | 2217 |
| VGG 16 | 0.846 | 0.917 | 0.721 | 0.808 | 0.682 | 138 | 741 |
| VGG 19 | 0.844 | 0.907 | 0.727 | 0.807 | 0.679 | 144 | 853 |
| VGG 11 with BN∗ | 0.837 | 0.896 | 0.719 | 0.798 | 0.663 | 133 | 491 |
| VGG 13 with BN∗ | 0.840 | 0.904 | 0.721 | 0.803 | 0.672 | 133 | 784 |
| VGG 16 with BN∗ | 0.850 | 0.911 | 0.738 | 0.815 | 0.691 | 138 | 954 |
| VGG 19 with BN∗ | 0.855 | 0.910 | 0.751 | 0.823 | 0.702 | 144 | 1087 |
| ∗ batch normalization |
Table 3 shows that DenseNet 121, ResNet 152, and VGG 19 with BN perform the best and Inception V3 performs the worst by a large margin. VGG 19 with BN scores the highest Cohen’s kapp, along with the highest accuracy and F1 score. VGG 16 achieves the highest precision while DenseNet 121 scores the highest recall. Looking at training time, it is clear that MobileNet V2 and ResNet 34 are much faster to train compared to other models and both have a good performance. Overall, given that the three models with the best performance score virtually similar on all metrics but DenseNet 121 has far fewer parameters and faster to train, it is our model of choice. For mobile applications, MobileNet V2 can be a good replacement.
The CNN trained by Stanford (DenseNet 169) scored an overall Cohen’s kappa of 0.705 on the test set [4]. Furthermore, three expert radiologists scored an overall Cohen’s kappa of 0.731, 0.763, 0.778 on the test set. While a direct comparison with those results is not possible, based on the performance of the trained DenseNet 169 model on the validation set we can make an educated guess that the three models with the highest performance will slightly surpass those results, perhaps scoring a Cohen’s kappa of 0.72 on the test set. While the CNNs trained here have a better performance compared to those trained in similar studies [27, 28, 29, 30, 31, 32, 33], they are still slightly behind expert human radiologists.
Table 4 shows the Cohen’s kappa values of six trained CNNs for different body parts. An overall look at the table shows that different models have different strengths and weaknesses depending on the category. DenseNet 121 performs the best for forearm and hand, MobileNet V2 for shoulder, ResNet 152 for finger and humerus, and VGG 19 with BN for elbow and wrist radiograph abnormality detection. These results suggest that an ensemble model that combines the best of these model to make category-based predictions could potentially have a better performance and even rival that of expert human radiologists. Finally, based on the results it seems that abnormality detection in hand, shoulder, and finger radiographs is more difficult than for the other body parts.
| Body part | DenseNet | Inception | MobileNet | ResNet | ResNeXt | VGG 19 |
|---|---|---|---|---|---|---|
| 121 | V3 | V2 | 152 | 50 | with BN | |
| Elbow | 0.735 | 0.718 | 0.734 | 0.734 | 0.748 | 0.761 |
| Finger | 0.630 | 0.484 | 0.584 | 0.664 | 0.619 | 0.652 |
| Forearm | 0.727 | 0.495 | 0.681 | 0.711 | 0.666 | 0.696 |
| Hand | 0.587 | 0.363 | 0.540 | 0.543 | 0.570 | 0.570 |
| Humerus | 0.807 | 0.615 | 0.748 | 0.822 | 0.793 | 0.807 |
| Shoulder | 0.638 | 0.505 | 0.649 | 0.628 | 0.628 | 0.639 |
| Wrist | 0.758 | 0.558 | 0.703 | 0.756 | 0.719 | 0.768 |
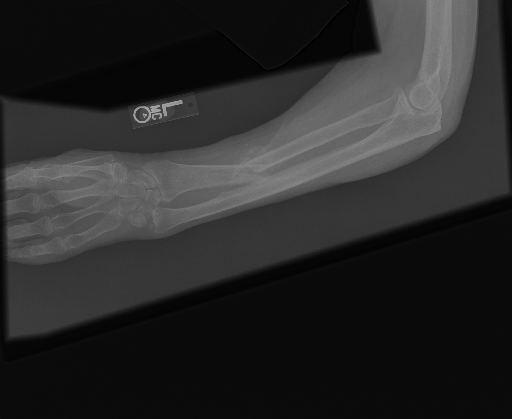
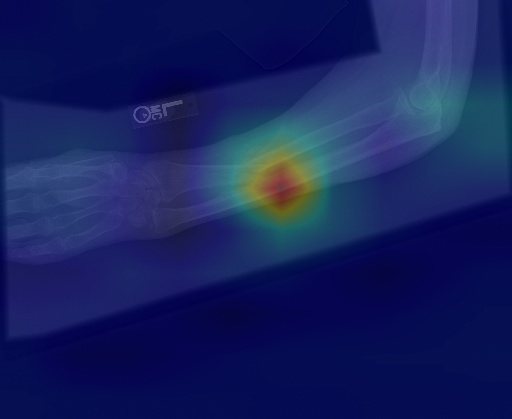
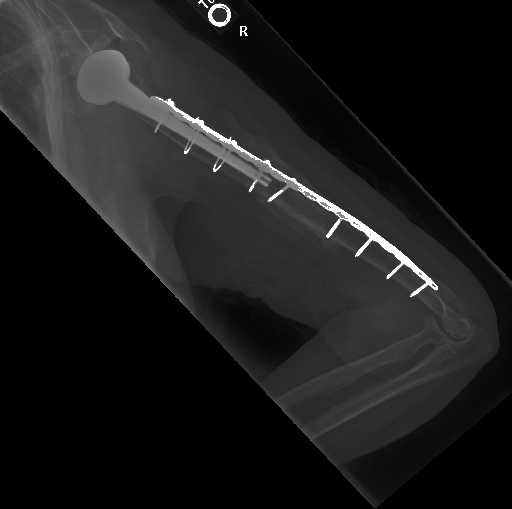
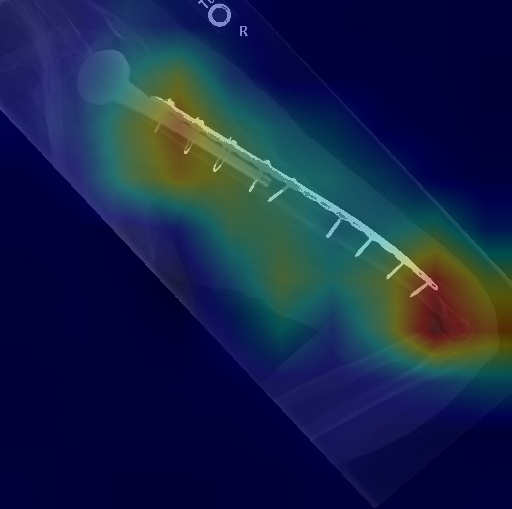
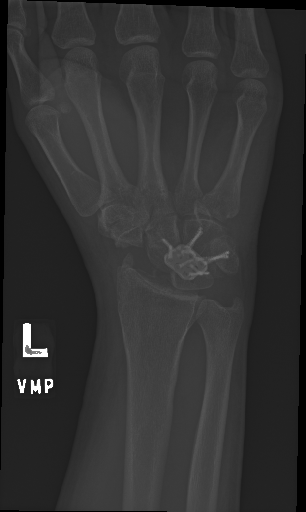
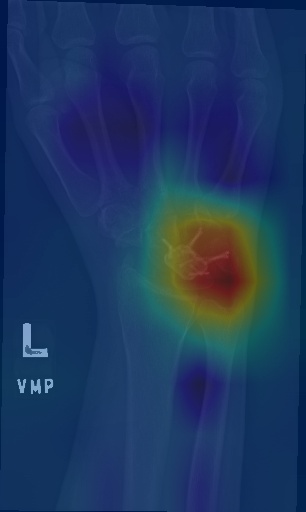
In the end, some sample radiographs showcasing the performance of MuRAD equipped with CAM are shown in Figure 1. As can be seen from the figure, CAM helps MuRAD accurately locate abnormalities in each image.
5 Conclusions
This paper introduced MuRAD, a tool that can help radiologists automate the detection of abnormalities in musculoskeletal radiographs (bone X-rays). MuRAD utilizes a CNN that can accurately predict whether a bone X-ray is abnormal, and leverages CAM to localize the abnormality in the image. To develop MuRAD, 18 CNNs were trained on the Stanford MURA dataset and their performance was evaluated on the validation set. Out of these models, DenseNet 121 showed the best combination of performance, training time, and model size (number of parameters). Even though a direct comparison with the Stanford baseline model (DenseNet 169) was not possible due to the unavailability of the test set, the results indicate that MuRAD shows comparable performance to that model but is still slightly behind expert human radiologists. However, employing ensemble methods in a future work may narrow or completely eliminate this gap.
Acknowledgments
The author would like to express his gratitude to the Stanford Machine Learning Group for making the MURA dataset publicly available, and to Virginia Tech’s Advanced Research Computing center for providing the computational resources that made this work possible. This research was conducted using the PyTorch framework.
References
- [1] Anthony D Woolf and Bruce Pfleger. Burden of major musculoskeletal conditions. Bulletin of the World Health Organization, 81:646–656, 2003.
- [2] Yasuo Nakajima, Kei Yamada, Keiko Imamura, and Kazuko Kobayashi. Radiologist supply and workload: international comparison. Radiation Medicine, 26(8):455–465, 2008.
- [3] Elizabeth A Krupinski, Kevin S Berbaum, Robert T Caldwell, Kevin M Schartz, and John Kim. Long radiology workdays reduce detection and accommodation accuracy. Journal of the American College of Radiology, 7(9):698–704, 2010.
- [4] Pranav Rajpurkar, Jeremy Irvin, Aarti Bagul, Daisy Ding, Tony Duan, Hershel Mehta, Brandon Yang, Kaylie Zhu, Dillon Laird, Robyn L Ball, et al. MURA: Large dataset for abnormality detection in musculoskeletal radiographs. arXiv preprint arXiv:1712.06957, 2017.
- [5] William Gale, Luke Oakden-Rayner, Gustavo Carneiro, Andrew P Bradley, and Lyle J Palmer. Detecting hip fractures with radiologist-level performance using deep neural networks. arXiv preprint arXiv:1711.06504, 2017.
- [6] Pranav Rajpurkar, Jeremy Irvin, Kaylie Zhu, Brandon Yang, Hershel Mehta, Tony Duan, Daisy Ding, Aarti Bagul, Curtis Langlotz, Katie Shpanskaya, et al. CheXNet: Radiologist-level pneumonia detection on chest X-rays with deep learning. arXiv preprint arXiv:1711.05225, 2017.
- [7] Monika Grewal, Muktabh Mayank Srivastava, Pulkit Kumar, and Srikrishna Varadarajan. RADnet: Radiologist level accuracy using deep learning for hemorrhage detection in CT scans. In 2018 IEEE 15th International Symposium on Biomedical Imaging (ISBI 2018), pages 281–284. IEEE, 2018.
- [8] Pranav Rajpurkar, Awni Y Hannun, Masoumeh Haghpanahi, Codie Bourn, and Andrew Y Ng. Cardiologist-level arrhythmia detection with convolutional neural networks. arXiv preprint arXiv:1707.01836, 2017.
- [9] Babak Ehteshami Bejnordi, Mitko Veta, Paul Johannes Van Diest, Bram Van Ginneken, Nico Karssemeijer, Geert Litjens, Jeroen AWM Van Der Laak, Meyke Hermsen, Quirine F Manson, Maschenka Balkenhol, et al. Diagnostic assessment of deep learning algorithms for detection of lymph node metastases in women with breast cancer. JAMA, 318(22):2199–2210, 2017.
- [10] Andre Esteva, Brett Kuprel, Roberto A Novoa, Justin Ko, Susan M Swetter, Helen M Blau, and Sebastian Thrun. Dermatologist-level classification of skin cancer with deep neural networks. Nature, 542(7639):115–118, 2017.
- [11] Varun Gulshan, Lily Peng, Marc Coram, Martin C Stumpe, Derek Wu, Arunachalam Narayanaswamy, Subhashini Venugopalan, Kasumi Widner, Tom Madams, Jorge Cuadros, et al. Development and validation of a deep learning algorithm for detection of Diabetic Retinopathy in retinal fundus photographs. JAMA, 316(22):2402–2410, 2016.
- [12] Pranav Rajpurkar, Jeremy Irvin, Aarti Bagul, Daisy Ding, Tony Duan, Hershel Mehta, Brandon Yang, Kaylie Zhu, Dillon Laird, Robyn L Ball, et al. MURA dataset: Towards radiologist-level abnormality detection in musculoskeletal radiographs. 2018.
- [13] Shared datasets. https://aimi.stanford.edu/research/public-datasets.
- [14] Arkadiusz Gertych, Aifeng Zhang, James Sayre, Sylwia Pospiech-Kurkowska, and HK Huang. Bone age assessment of children using a digital hand atlas. Computerized Medical Imaging and Graphics, 31(4-5):322–331, 2007.
- [15] Xiaosong Wang, Yifan Peng, Le Lu, Zhiyong Lu, Mohammadhadi Bagheri, and Ronald M Summers. ChestX-ray8: Hospital-scale chest X-ray database and benchmarks on weakly-supervised classification and localization of common thorax diseases. In Proceedings of the IEEE Conference on Computer Vision and Pattern Recognition, pages 2097–2106, 2017.
- [16] Dina Demner-Fushman, Marc D Kohli, Marc B Rosenman, Sonya E Shooshan, Laritza Rodriguez, Sameer Antani, George R Thoma, and Clement J McDonald. Preparing a collection of radiology examinations for distribution and retrieval. Journal of the American Medical Informatics Association, 23(2):304–310, 2016.
- [17] Stefan Jaeger, Sema Candemir, Sameer Antani, Yì-Xiáng J Wáng, Pu-Xuan Lu, and George Thoma. Two public chest X-ray datasets for computer-aided screening of pulmonary diseases. Quantitative Imaging in Medicine and Surgery, 4(6):475, 2014.
- [18] Junji Shiraishi, Shigehiko Katsuragawa, Junpei Ikezoe, Tsuneo Matsumoto, Takeshi Kobayashi, Ken-ichi Komatsu, Mitate Matsui, Hiroshi Fujita, Yoshie Kodera, and Kunio Doi. Development of a digital image database for chest radiographs with and without a lung nodule: receiver operating characteristic analysis of radiologists’ detection of pulmonary nodules. American Journal of Roentgenology, 174(1):71–74, 2000.
- [19] Michael Heath, Kevin Bowyer, Daniel Kopans, P Kegelmeyer, Richard Moore, Kyong Chang, and S Munishkumaran. Current status of the digital database for screening mammography. In Digital Mammography, pages 457–460. Springer, 1998.
- [20] Gao Huang, Zhuang Liu, Laurens Van Der Maaten, and Kilian Q Weinberger. Densely connected convolutional networks. In Proceedings of the IEEE Conference on Computer Vision and Pattern Recognition, pages 4700–4708, 2017.
- [21] Karen Simonyan and Andrew Zisserman. Very deep convolutional networks for large-scale image recognition. arXiv preprint arXiv:1409.1556, 2014.
- [22] Kaiming He, Xiangyu Zhang, Shaoqing Ren, and Jian Sun. Deep residual learning for image recognition. In Proceedings of the IEEE Conference on Computer Vision and Pattern Recognition, pages 770–778, 2016.
- [23] Saining Xie, Ross Girshick, Piotr Dollár, Zhuowen Tu, and Kaiming He. Aggregated residual transformations for deep neural networks. In Proceedings of the IEEE Conference on Computer Vision and Pattern Recognition, pages 1492–1500, 2017.
- [24] Christian Szegedy, Vincent Vanhoucke, Sergey Ioffe, Jon Shlens, and Zbigniew Wojna. Rethinking the Inception architecture for computer vision. In Proceedings of the IEEE Conference on Computer Vision and Pattern Recognition, pages 2818–2826, 2016.
- [25] Mark Sandler, Andrew Howard, Menglong Zhu, Andrey Zhmoginov, and Liang-Chieh Chen. MobileNetV2: Inverted residuals and linear bottlenecks. In Proceedings of the IEEE Conference on Computer Vision and Pattern Recognition, pages 4510–4520, 2018.
- [26] Newriver computing system. https://www.arc.vt.edu/computing/newriver/.
- [27] Dennis Banga and Peter Waiganjo. Abnormality detection in musculoskeletal radiographs with convolutional neural networks (ensembles) and performance optimization. arXiv preprint arXiv:1908.02170, 2019.
- [28] N Harini, B Ramji, S Sriram, V Sowmya, and KP Soman. Musculoskeletal radiographs classification using deep learning. In Deep Learning for Data Analytics, pages 79–98. Elsevier, 2020.
- [29] Arunava Chakravarty, Nirmalya Ghosh, Debdoot Sheet, Tandra Sarkar, and Ramanathan Sethuraman. Radiologist validated systematic search over deep neural networks for screening musculoskeletal radiographs.
- [30] Yunxue Shao and Xin Wang. Abnormality diagnosis of musculoskeletal radiographs combined with shallow texture features. In Artificial Intelligence in China, pages 480–486. Springer, 2020.
- [31] Mukul Goyal, Rishabh Malik, Deepika Kumar, Siddhant Rathore, and Rahul Arora. Musculoskeletal abnormality detection in medical imaging using GnCNNr (Group Normalized Convolutional Neural Networks with Regularization). SN Computer Science, 1(6):1–12, 2020.
- [32] Yunxue Shao and Xin Wang. A two stage method for abnormality diagnosis of musculoskeletal radiographs. In International Conference on Pattern Recognition and Artificial Intelligence, pages 610–621. Springer, 2020.
- [33] Wei Huang, Zhitong Xiong, Qi Wang, and Xuelong Li. KALM: Key area localization mechanism for abnormality detection in musculoskeletal radiographs. In ICASSP 2020-2020 IEEE International Conference on Acoustics, Speech and Signal Processing (ICASSP), pages 1399–1403. IEEE, 2020.